Article

Field Study of Photovoltaic Systems with Anti-Potential-Induced-Degradation Mechanism: UVF, EL, and Performance Ratio Investigations

School of Physics, Engineering and Technology, Laboratory of Photovoltaics, University of York, York YO10 5DD, UK
*
Author to whom correspondence should be addressed.
Photonics 2023, 10(2), 225; https://doi.org/10.3390/photonics10020225
Submission received: 4 November 2022 / Revised: 2 February 2023 / Accepted: 17 February 2023 / Published: 19 February 2023

Abstract

:
The potential-induced degradation (PID) of photovoltaic (PV) modules is one of the most extreme types of degradation in PV modules, where PID-affected modules can result in an almost 25% power reduction. Understanding how module defects impact PID is key to reducing the issue. Therefore, this work investigates the impact of an anti-PID inverter on PV modules throughout three years of field operating conditions. We used electroluminescence (EL), ultraviolet fluorescence (UVF), and thermography imaging to explore the varieties of an anti-PID inverter connected to a PV string. It was discovered that a PV string with an anti-PID inverter could improve the output power of the modules by 5.8%. In addition, the performance ratio (PR) was equal to 91.2% and 87.8%, respectively, for PV strings with and without an anti-PID inverter.

1. Introduction

One of the most worthwhile qualities of solar cell technology is its high stability, with an operational endurance of over 30 years. Nevertheless, diverse degradation mechanisms collectively reduce the module’s output power over time. One of the main degradation mechanisms is called potential-inducted-degradation (PID) [1,2,3]. For many photovoltaic (PV) installations, PID is one of the leading conditions of module degradation caused by voltage and the interaction of this stress factor with temperature and humidity. Hence, PID occurs when the electrons of the PV module leak from the semiconductor material into other elements of the panel, such as the frame, glass, mounting, etc.
Recent studies have confirmed that PID could originate due to pre-existing cracks or hotspots cultivated in the PV modules during manufacturing or packaging/transportation practices. Thus, according to the prevailing IEC61215 standard, PV modules must be studied under electroluminescence (EL) imaging settings or at least using thermal imaging when they are (or are being) installed at the PV site [4].
The reproduction of PV modules involves multiple stages, with the assembly of solar cells being one of the critical stages where cracks can develop. These cracks, as confirmed by previous studies [5], can range from small micro-level damages to complete inactivity in the PV module [6]. Despite the potential consequences, there is limited information available on the impact of these cracks on the output power of PV modules before and after they are installed in the field. A recent study [7] shed light on the effects of reverse bias voltage on the performance of PV modules. The study found that applying a reverse bias voltage of 160 V to a PV module resulted in severe potential-induced degradation (PID), leading to the formation of hotspots on the module. The PID reduced the current density and open-circuit voltage, resulting in a significant decrease in output power, as high as 30%. To demonstrate the impact of PID on the output power of PV modules, we included two electroluminescent (EL) images taken before and after PID developed in a PV module (Figure 1). The comparison of the two images revealed a 26.6% loss in output power due to PID. This study highlights the importance of monitoring and controlling the performance of PV modules throughout their life cycle to ensure their maximum efficiency and longevity.
Preventing potential-induced degradation (PID) or cracks in solar cells requires optimization of the antireflection coating (ARC) [8,9,10]. Recent studies have shown that incorporating a thin silicon dioxide (SiO2) ARC layer with n-type and p-type solar cells can enhance the reliability and durability of the solar cells against PID. However, this coating is not a permanent solution and cannot prevent cracks and structural defects that lead to PID in solar cells. An alternative approach is to integrate the PV string with an anti-PID inverter [11,12]. This inverter helps prevent current leakage in defective PV modules by directing it to the ground in the circuitry [13].
Infrared (IR) thermography is extensively used in PV inspection to identify mismatched modules related to thermal anomalies and hotspots [14,15]. The PV modules convert the incident solar radiation into electricity. Still, due to the low power conversion efficiencies under actual working conditions (usually around 12% to 15%), most energy is dissipated as heat [16]. The PV module operating temperature depends on the resistive losses, solar insolation, ambient temperature, mounting configuration, wind speed, and even the module packaging elements [17,18]. In the case of inhomogeneous defects in the modules (i.e., PID or cracks), multiple studies, such as [19,20], have suggested using photoluminescence (PL) imaging or an ultraviolet fluorescence (UVF) because both techniques do not require electrical insulation of the PV systems and can be performed in outdoor conditions, ideally under low irradiance levels.
This work aims to present our examination of two PV strings configured with and without an anti-PID inverter. In addition to electrical current-voltage (I-V) and power-voltage (P-V) characterization, EL, UVF, and IR inspection are used to identify mismatched and inhomogeneous defects in the examined PV strings. Furthermore, the performance ratio (PR) over three years of both PV strings is also investigated for comparative analysis. Up to date, and to the best of the author’s knowledge, no such similar research has been carried out on anti-PID inverters considering real-time and long-term data measurements.

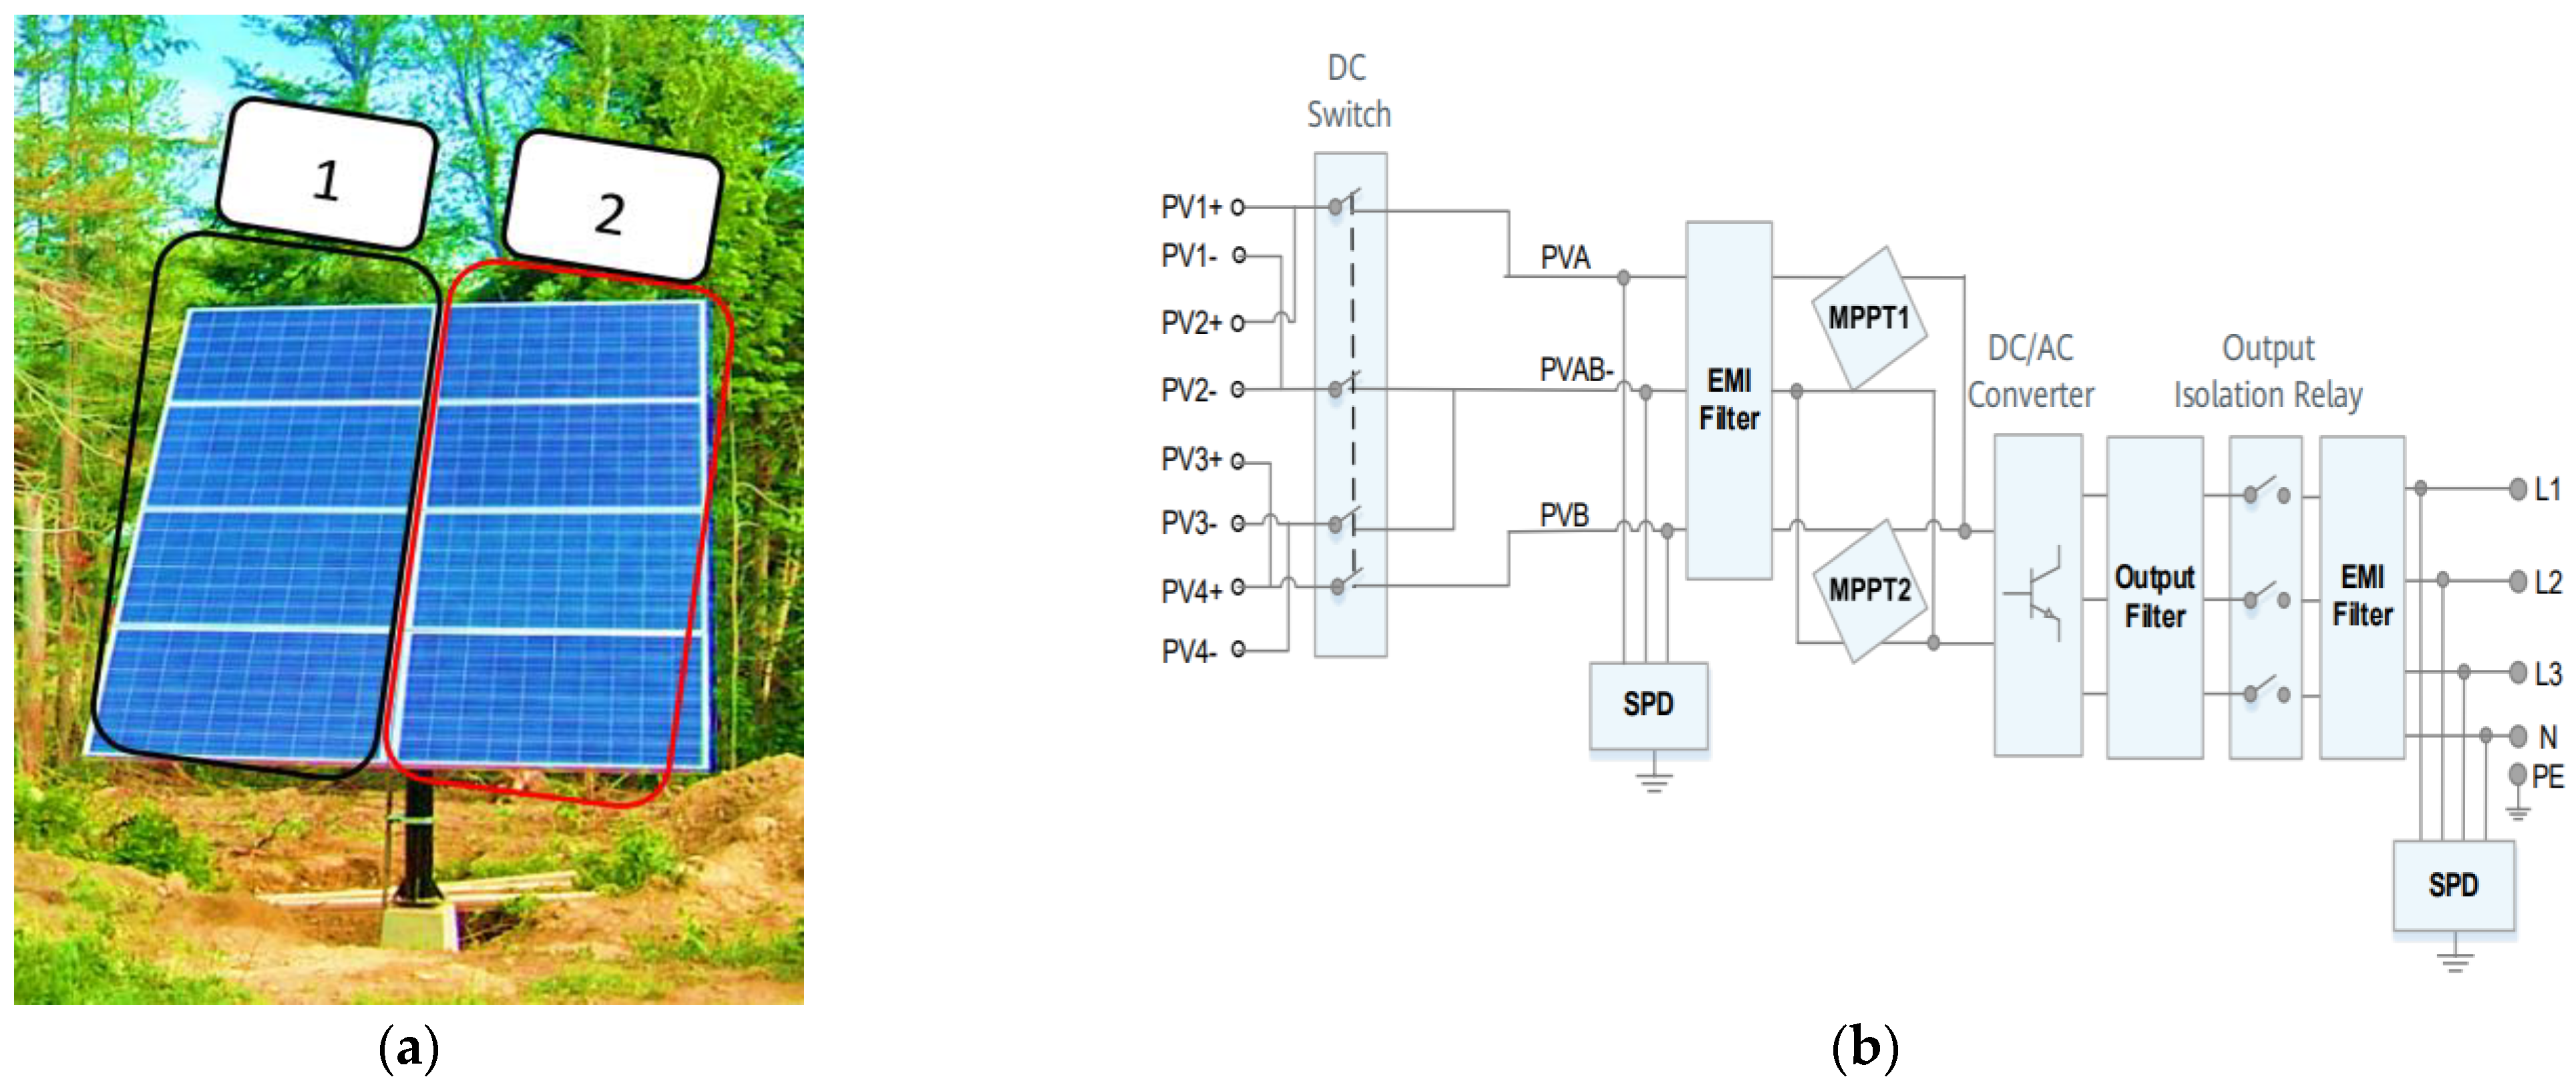
2. PV System and Data Acquisition

In this work, the investigation of the performance of two PV strings was conducted, with each PV string comprising four series-connected polycrystalline silicon PV modules (Figure 2a). In standard test conditions, where the solar irradiance was 1000 W/m2, and PV surface temperature was 25 °C, the PV module’s main electrical characteristics are summarized in Table 1. The PV setup was installed near Leeds, UK, and managed via Al-Suwaidi Constructions Ltd.
The first PV string was connected to the grid through a Huawei SUN2000-12/15/17/20KTL-M0/M2 inverter. The inverter had a built-in feature to recover from PID. The design of the inverter’s internal circuit is shown in Figure 2b. Before connection to the electromagnetic interference (EMI) filter, the PV system had a surge protection device (SPD) to prevent overvoltage and surges caused by PID and mismatching in the PV modules, such as cracks, hotspots, or shading. The inverter also had a maximum power point tracking (MPPT) unit to track the best power output with 98% accuracy.
When an overvoltage or overcurrent condition occurred in the system, the SPD diverted the excess voltage or current away from the sensitive electronic components of the inverter and PV panels. This helped prevent damage to the components and reduce the risk of PID. Typically, SPDs work by using metal oxide varistors (MOVs), which are voltage-dependent resistors. When the voltage exceeds a certain level, the MOV acts as a short circuit, diverting the excess voltage to ground. In summary, the SPD in an anti-PID inverter system functions to protect the inverter and PV panels from surges and prevent PID by diverting excess voltage and current away from sensitive components.
EMI can cause issues in PV systems by disrupting the normal operation of the inverter and affecting the accuracy of the voltage and current measurements. This can lead to potential-induced degradation (PID) of the PV panels and reduce their overall efficiency. The EMI filter is designed to block EMI from entering the anti-PID inverter and PV panels, while still allowing the normal AC and DC signals to pass through. The EMI filter typically consists of a series of passive components, such as capacitors and inductors, that work together to suppress EMI.
In contrast, the second PV string was connected to the grid via a Huawei SUN2000-30/36/40KTL-M3 inverter with no PID prevention design. According to the PV strings arrangement, it was expected that because the first PV string was configured with anti-PID, the second PV string had less performance over time. However, we do not know if this is the case in reality. Therefore, different examination plans have been considered, including:
  • Plan 1: Examine the EL and UVF images for both PV strings at day 1 of operation. In addition, take the I-V and P-V curves measurement at respectively high irradiance conditions. Both EL and UVF were taken using Brightspot automation EL and UVF detection cameras. In addition, the I-V and P-V curves were measured using a PV200 Solar PV Tester; the accuracy of this device was ±0.25 V and ±0.1 A.
  • Plan 2: Repeat the examination undertaken at plan one after three years of field operation.
  • Plan 3: Estimate the performance ratio of the PV strings.
  • Plan 4: Compare both PV strings’ thermal performance after three years to check whether any cells developed hotspots. This was accomplished by taking the thermal images using a FLIR E54 thermal camera with a thermal sensitivity of ±0.1 °C.
It is worth noting that PID occurs when a high electric field or electrostatic potential builds up between a PV cell and its frame, causing the migration of positive and negative charges that can lead to performance degradation and even permanent damage to the cell. In typical PV plants, large numbers of PV panels are connected in series, leading to high DC voltages of several hundred volts or kilovolts. However, our work was carried out with a relatively low voltage PV string, consisting of eight PV panels, with a maximum voltage difference of 60 V or less. Despite the lower voltage, this PV setup can still experience PID.
Low voltage PV strings can still be useful to study PID because they allow for a controlled and more manageable testing environment, where the effects of PID can be more easily observed and studied. Additionally, PID can still occur at lower voltage levels, and understanding the impact of PID on these systems is still important for improving the overall reliability and efficiency of PV systems. To understand PID, it is important to note that the electric field or electrostatic potential that causes it is proportional to the voltage difference between the PV cell and its frame. While high voltage PV strings are more likely to experience PID due to the higher voltage difference, PID can still occur at lower voltage levels, and it is important to study and understand the mechanisms that lead to PID in these systems.
PID can occur at both the cell level and the complete PV module level. PID at the cell level refers to the degradation of individual solar cells within a PV module, whereas PID at the module level refers to degradation in the overall performance of the entire module. At the cell level, PID can result in decreased efficiency and reduced power output of individual cells within the module. This can occur due to an accumulation of electrical charge on the cell surface, which can lead to an imbalance in the cell and result in electrical current flowing between the cell and its frame. This current flow can cause damage to the cell and reduce its performance. PID at the module level can result in a decrease in the overall power output of the module and an increase in the resistance of the electrical connections within the module; this typically happens for >600V PV array sizes. This can be caused by the combined effect of multiple cells within the module experiencing PID, or by electrical current flowing between cells within the module.

3. Results

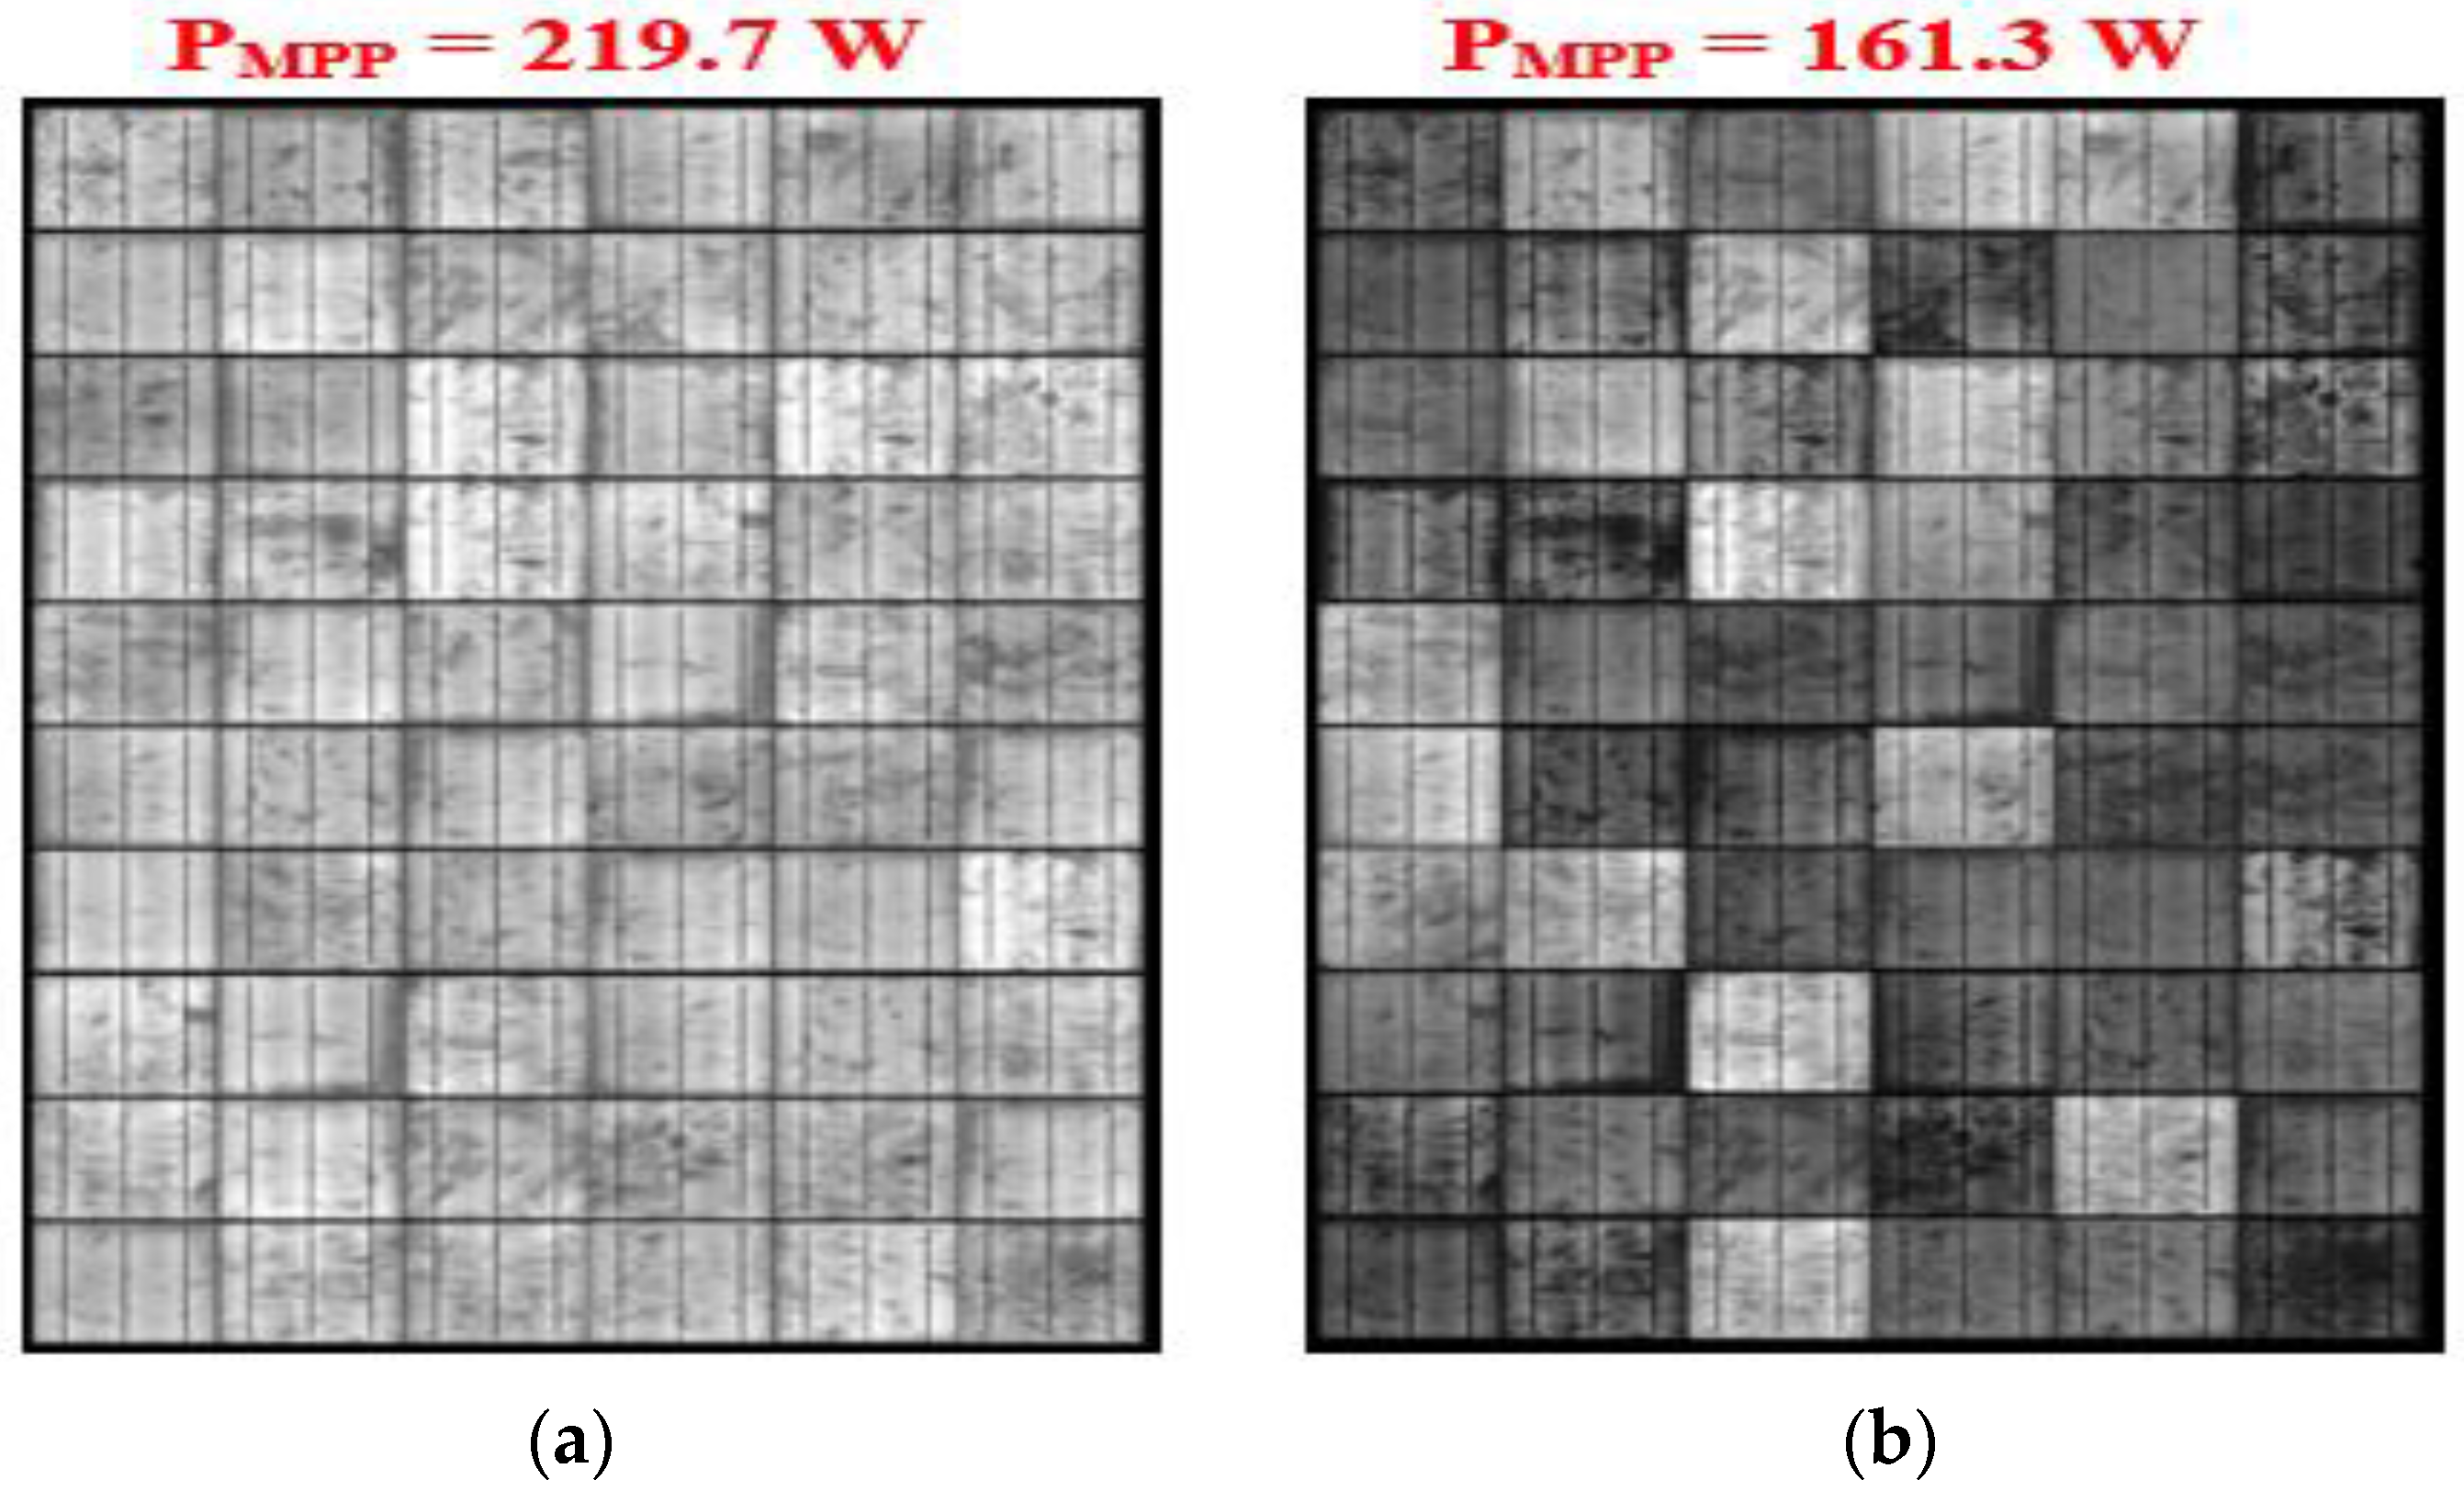
3.1. Inspection of the PV Strings at Day 1

After the PV strings were successfully installed in the field (12 June 2019), the inspection of the EL and UVF was determined (Figure 3). According to Figure 3a, it is clear that the PV modules have no breakdown regions or cracks. At the same time, this is also apparent by observing the PV strings using UVF, as shown in Figure 3b. The images were also taken at night, which means that solar illumination did not affect the precision of the images. As a result, neither of the PV strings on day 1 had mismatching conditions, cracks, or any other form of PID.
Due to the imperfections of the EL and UVF testing equipment, some solar cells may appear to have dark areas. However, if we rigorously observe, these areas do not comprise cracks or a closed “black region”. Hence, they represent normal solar cells that are operating under normal conditions. According to the UVF image of the PV strings, as shown in Figure 3b, it is recognized that the first PV string has only one solar cell exhibiting a different degree of illumination compared with six solar cells in the second PV string.
On the same day, the I-V and P-V curves were recorded (Figure 4) for both PV strings. The solar irradiance was 822 W/m2 and the PV surface temperature was 19.7 °C. Again, there was almost no difference in the output power of either PV strings, and, using (1), the difference in the power was limited to 0.95%.
P D i f f e r e n c e ( % ) = P s t r i n g   1 P s t r i n g   2 P s t r i n g   2 × 100

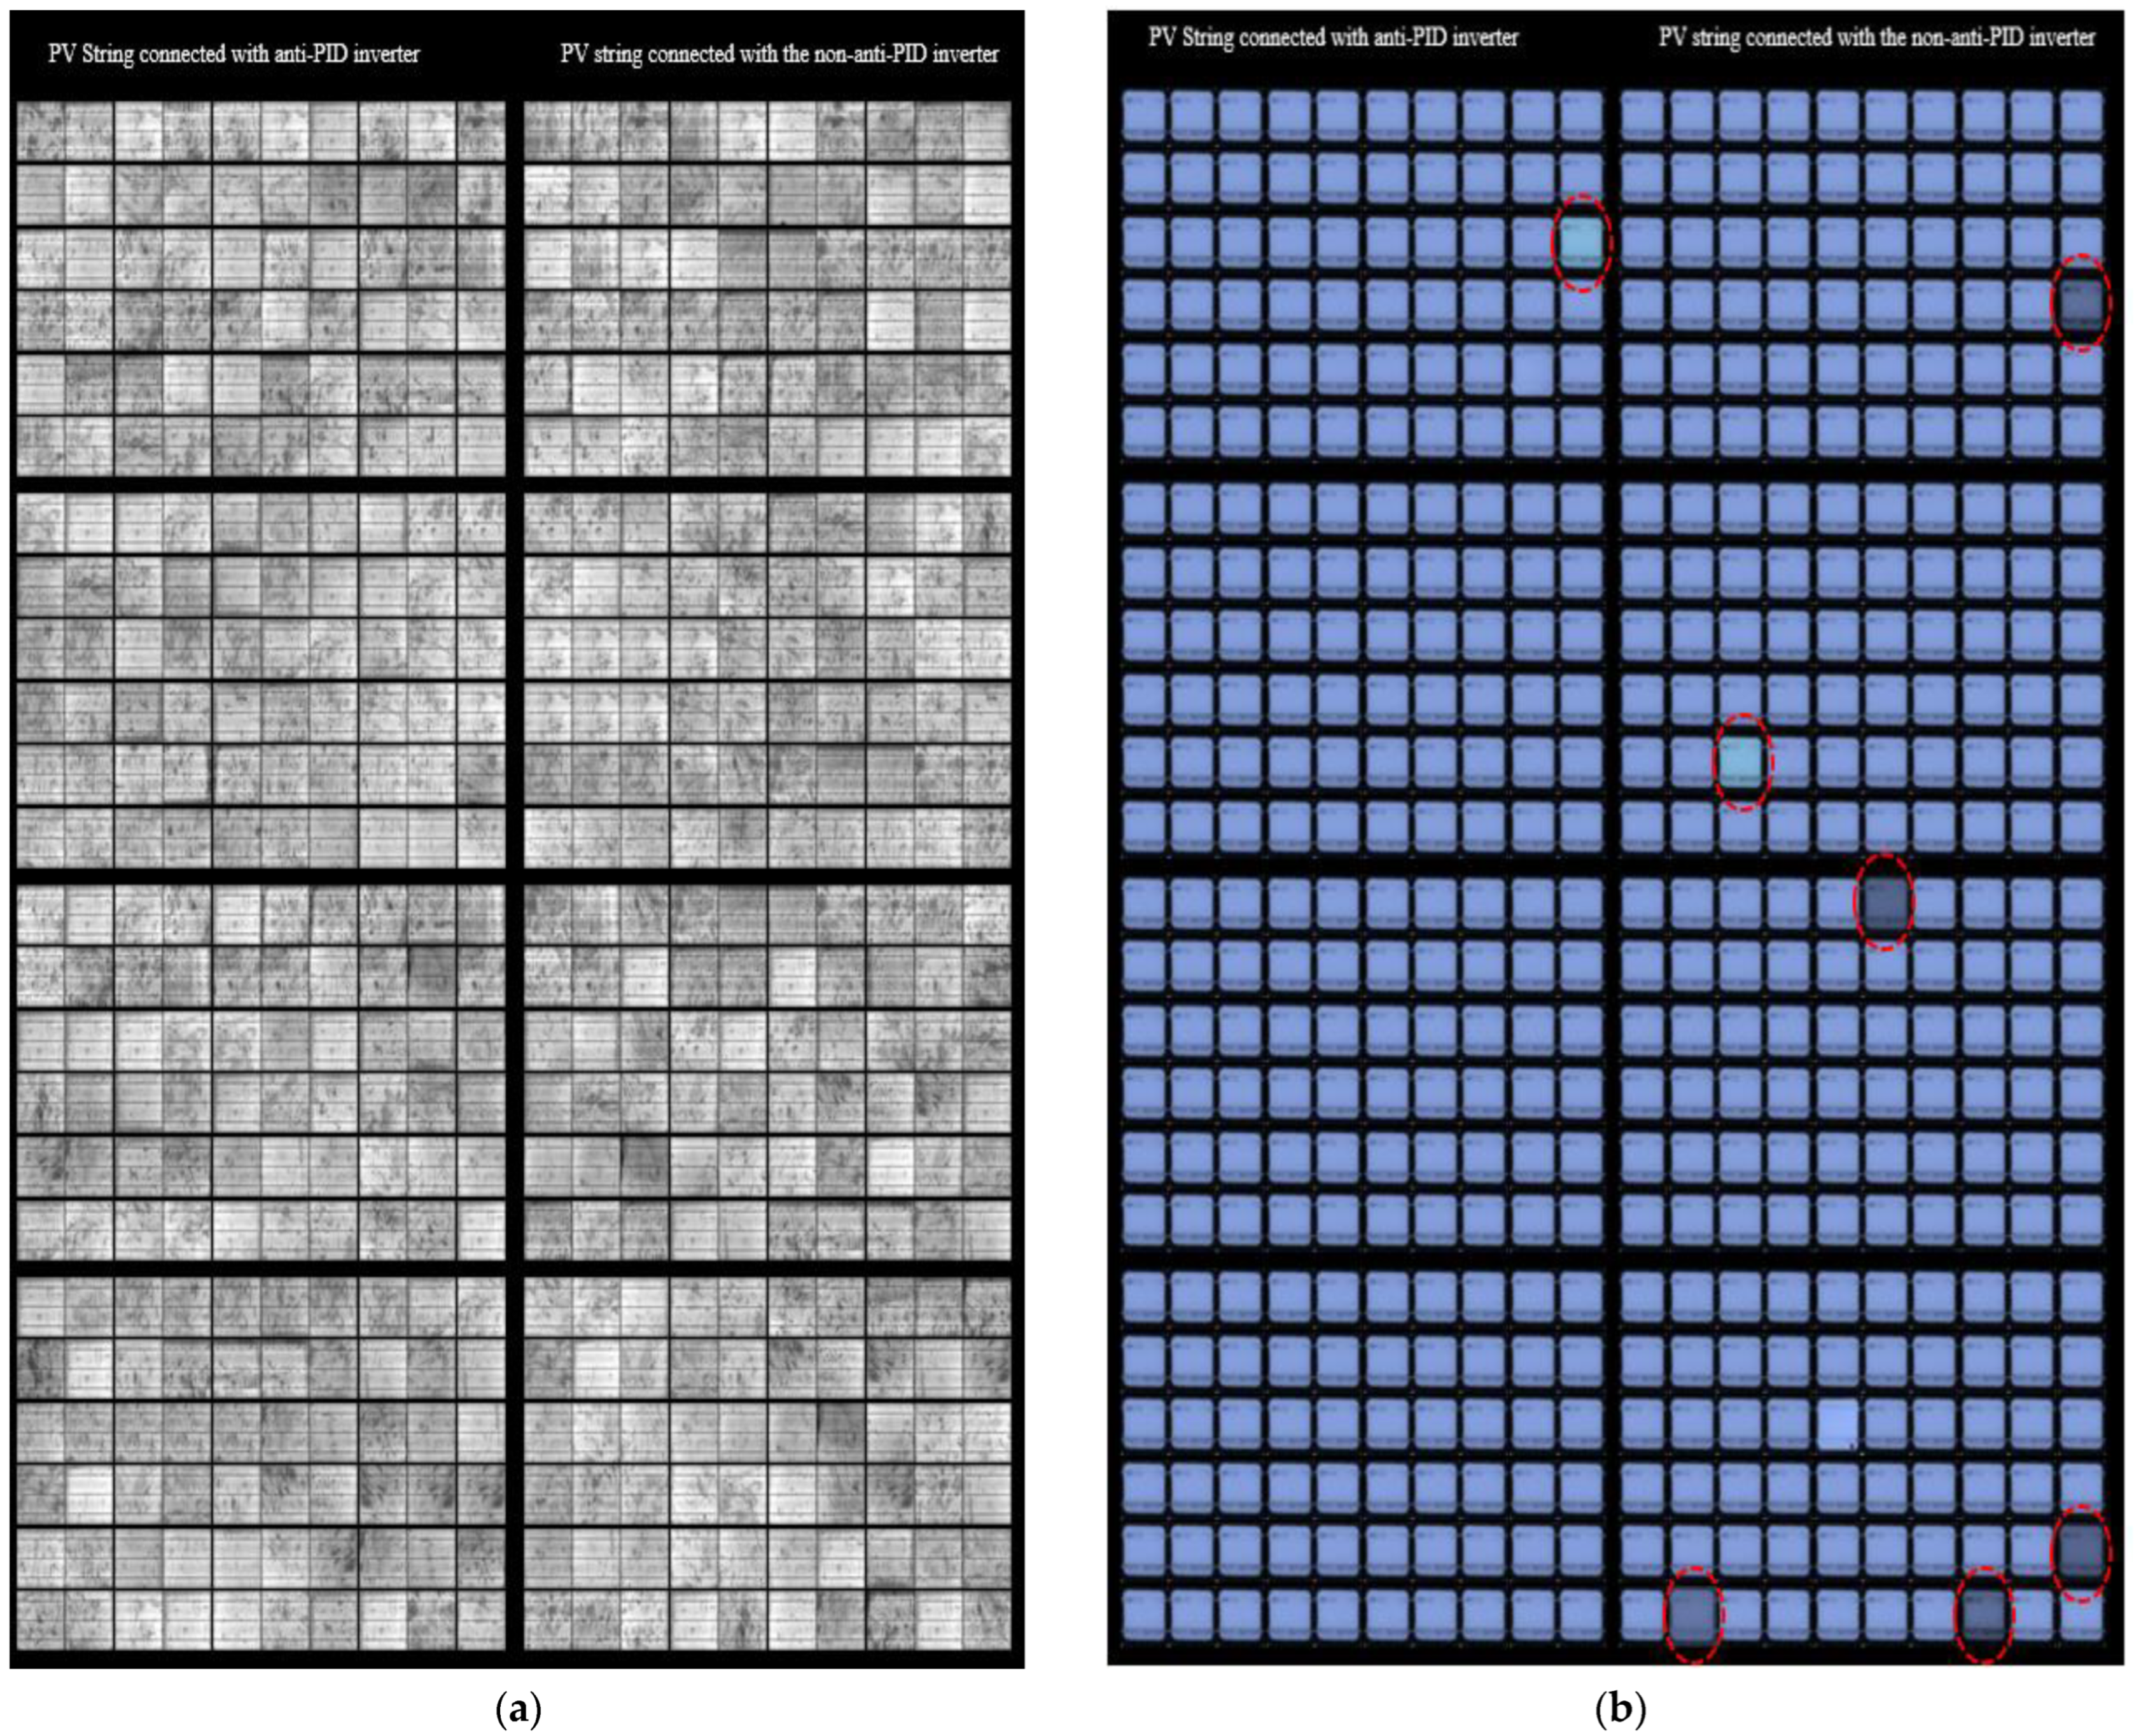
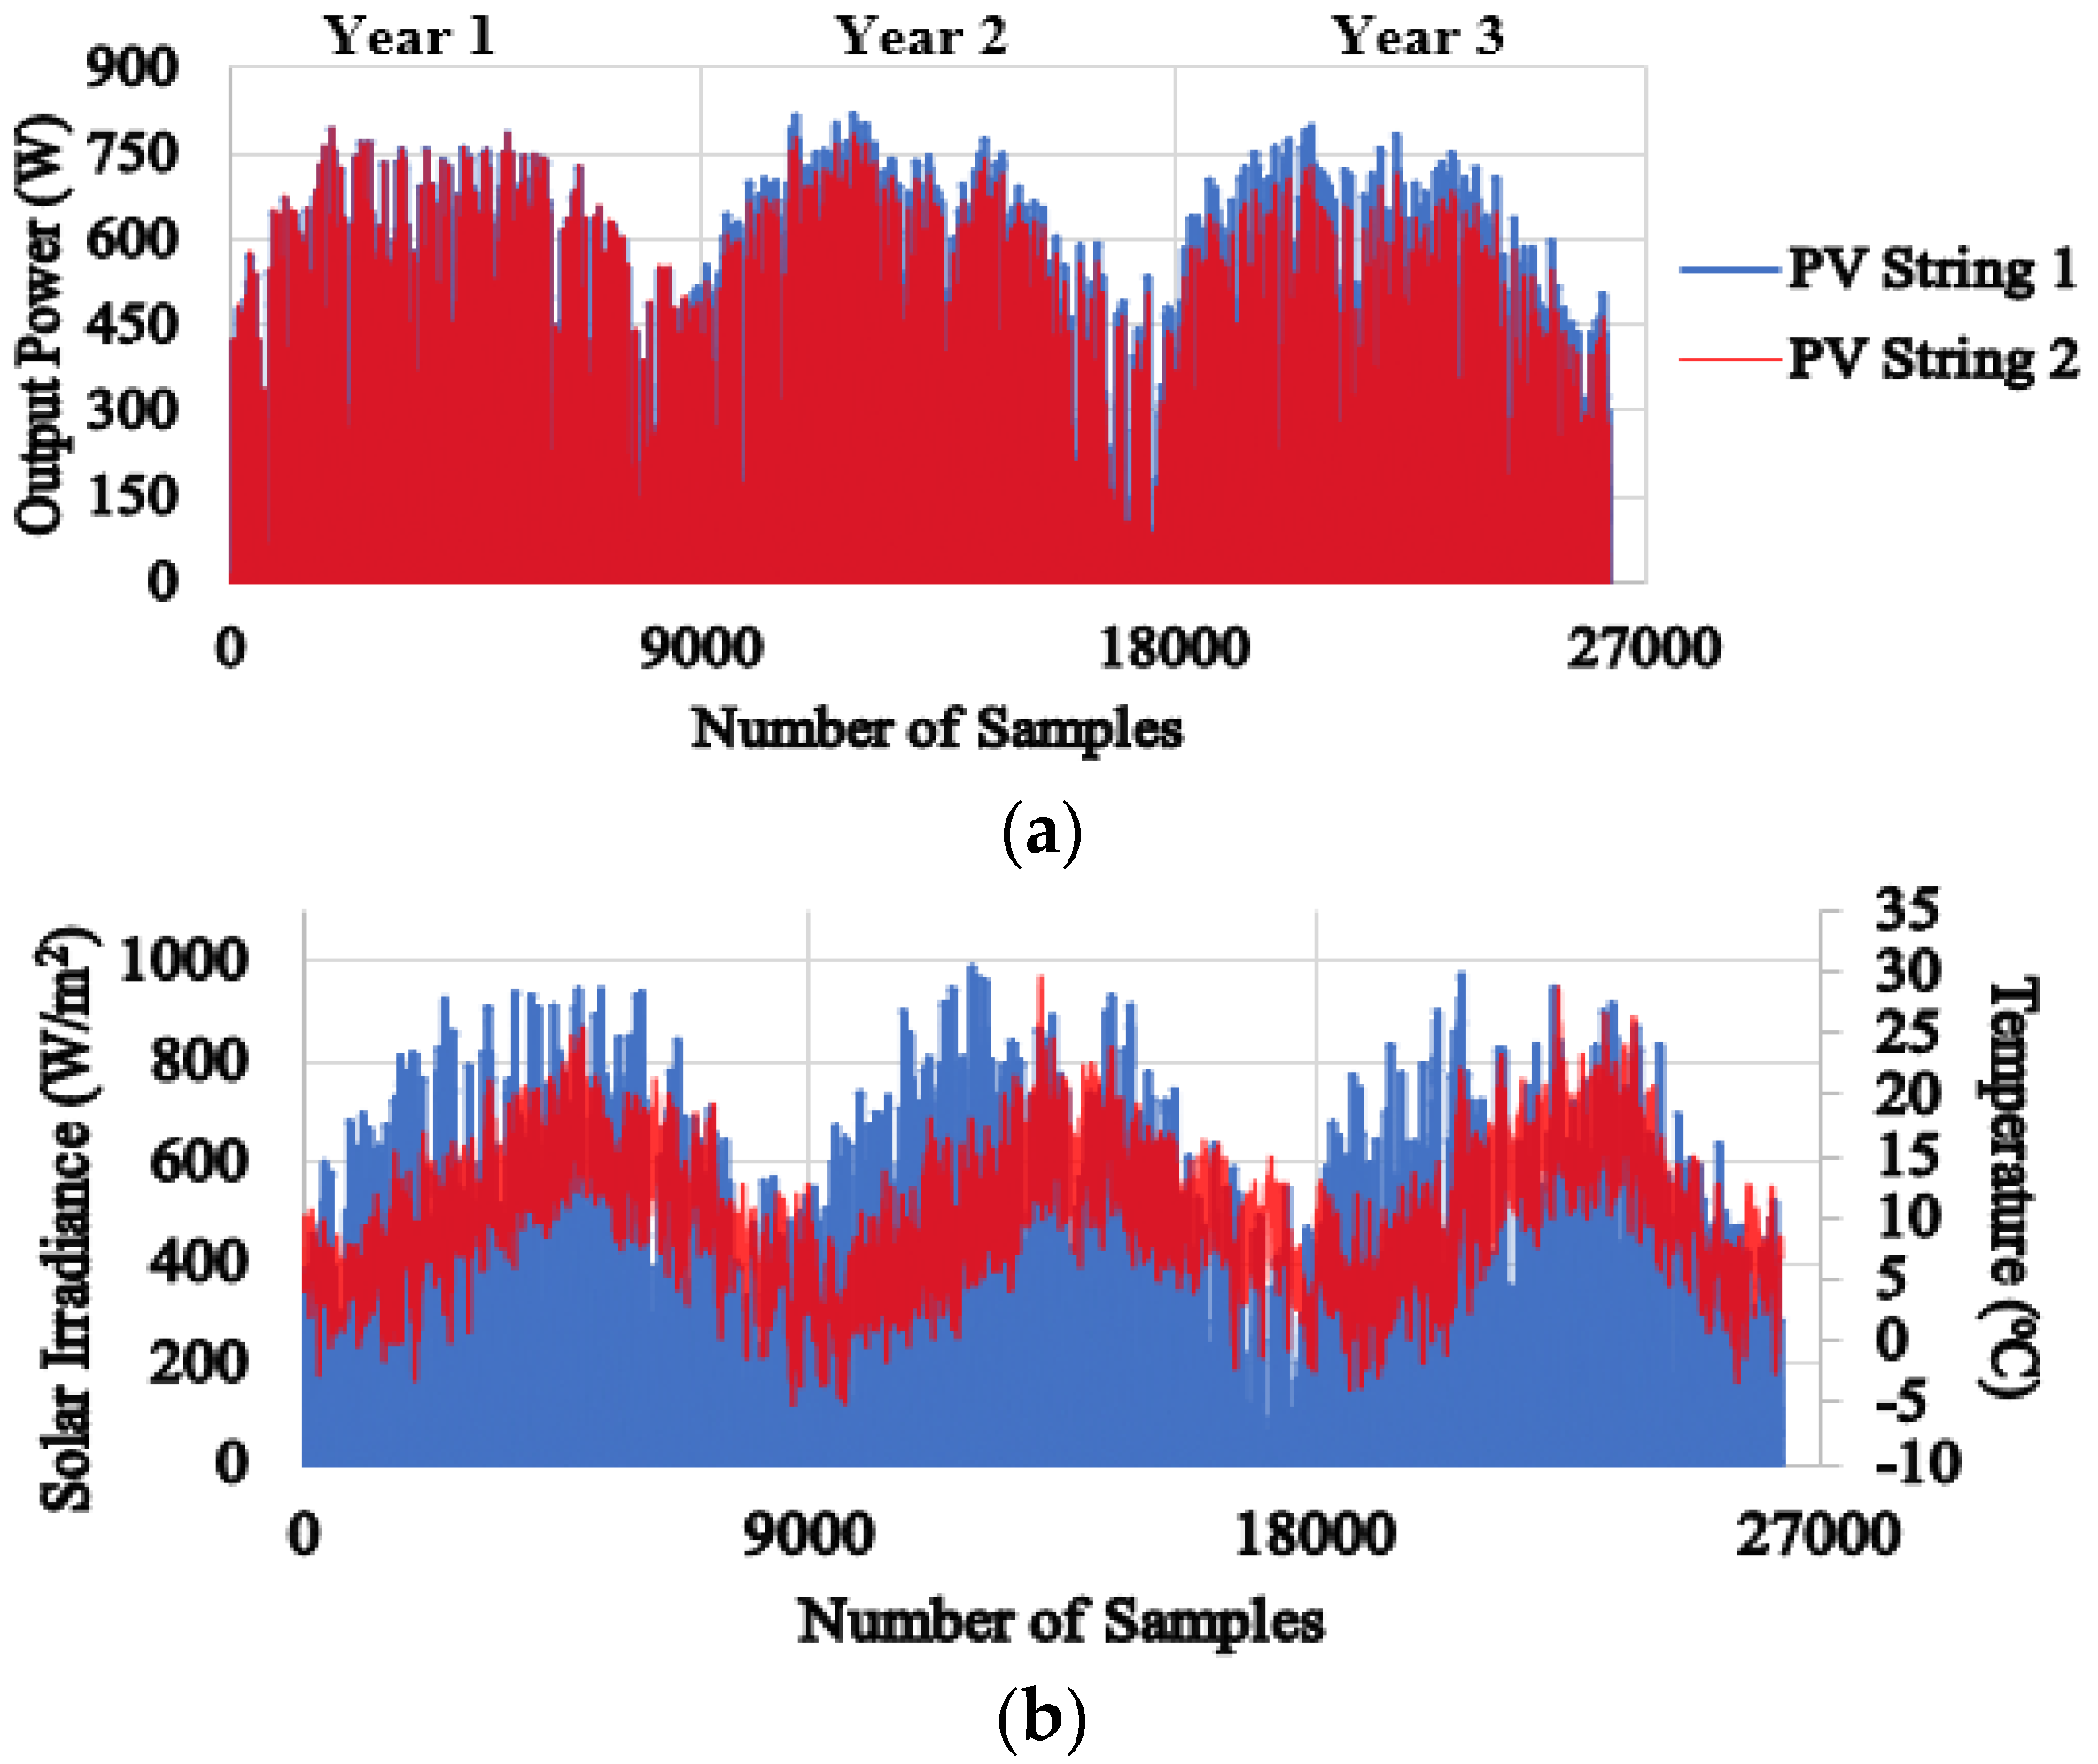
3.2. Inspecting the PV Strings after Three Years of Field Service

Both PV strings were in the field for three years, and no maintenance was required during their service. Both PV strings had also been affected by the same environmental conditions. Therefore, there was no need to adjust any of the measured parameters or consider the environmental impact on their performance. The PV string EL and UVF inspection after three years of field conditions are shown in Figure 5.
According to Figure 5, the first PV string (connected to the anti-PID inverter) only has one cracked solar cell. Modules were also found to be free of snail trails, PID, and other forms of cracks. Contrary to this, and as shown in Figure 5b, EVA degradation can be observed in seven solar cells (2.9% of the total solar cells in the PV string).
A growing number of solar cells in the second string (connected to an inverter without anti-PID recovery) were damaged. Eleven cells showed no illumination during the EL test, while two cells had significant cracks (labeled in red circles). According to Figure 5b, EVA degradation is observed in 17 solar cells (7% of the total solar cells in the PV string). The results confirm that PV modules with an anti-PID inverter are less likely to degrade and malfunction.
The I-V and P-V curves for the PV strings after their 3-year operation are presented in Figure 6. These curves were taken under solar irradiance at 827 W/m2 and a PV surface temperature of 23.3 °C. The difference in the output power was 5.87%, a considerable increase in the output difference compared with day 1, which was calculated at 0.95%.
All other electrical parameters are also compared and summarized in Table 2. Once again, it is noticed that the difference between string 1 and string 2 for I M P P is nearly 7.05%. The fill factor (FF) has also dropped by 3.31%, with a 5.86% power difference.

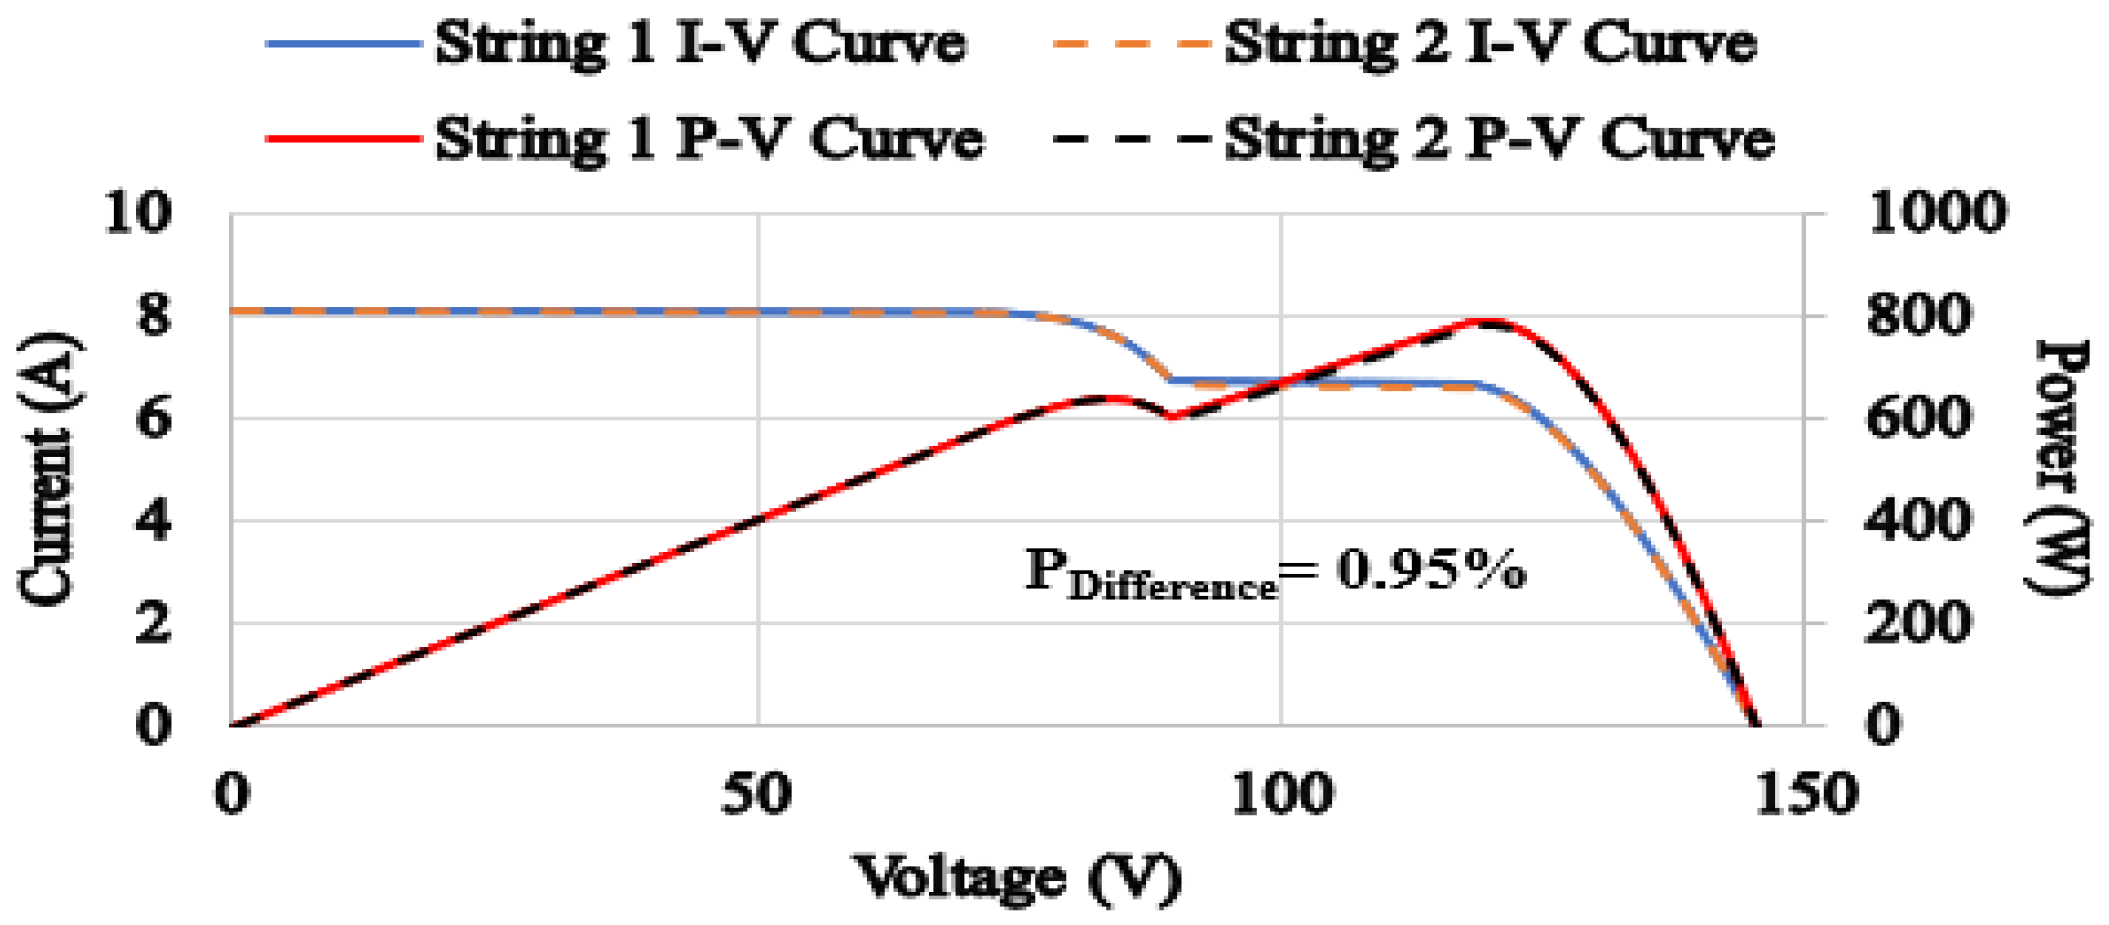
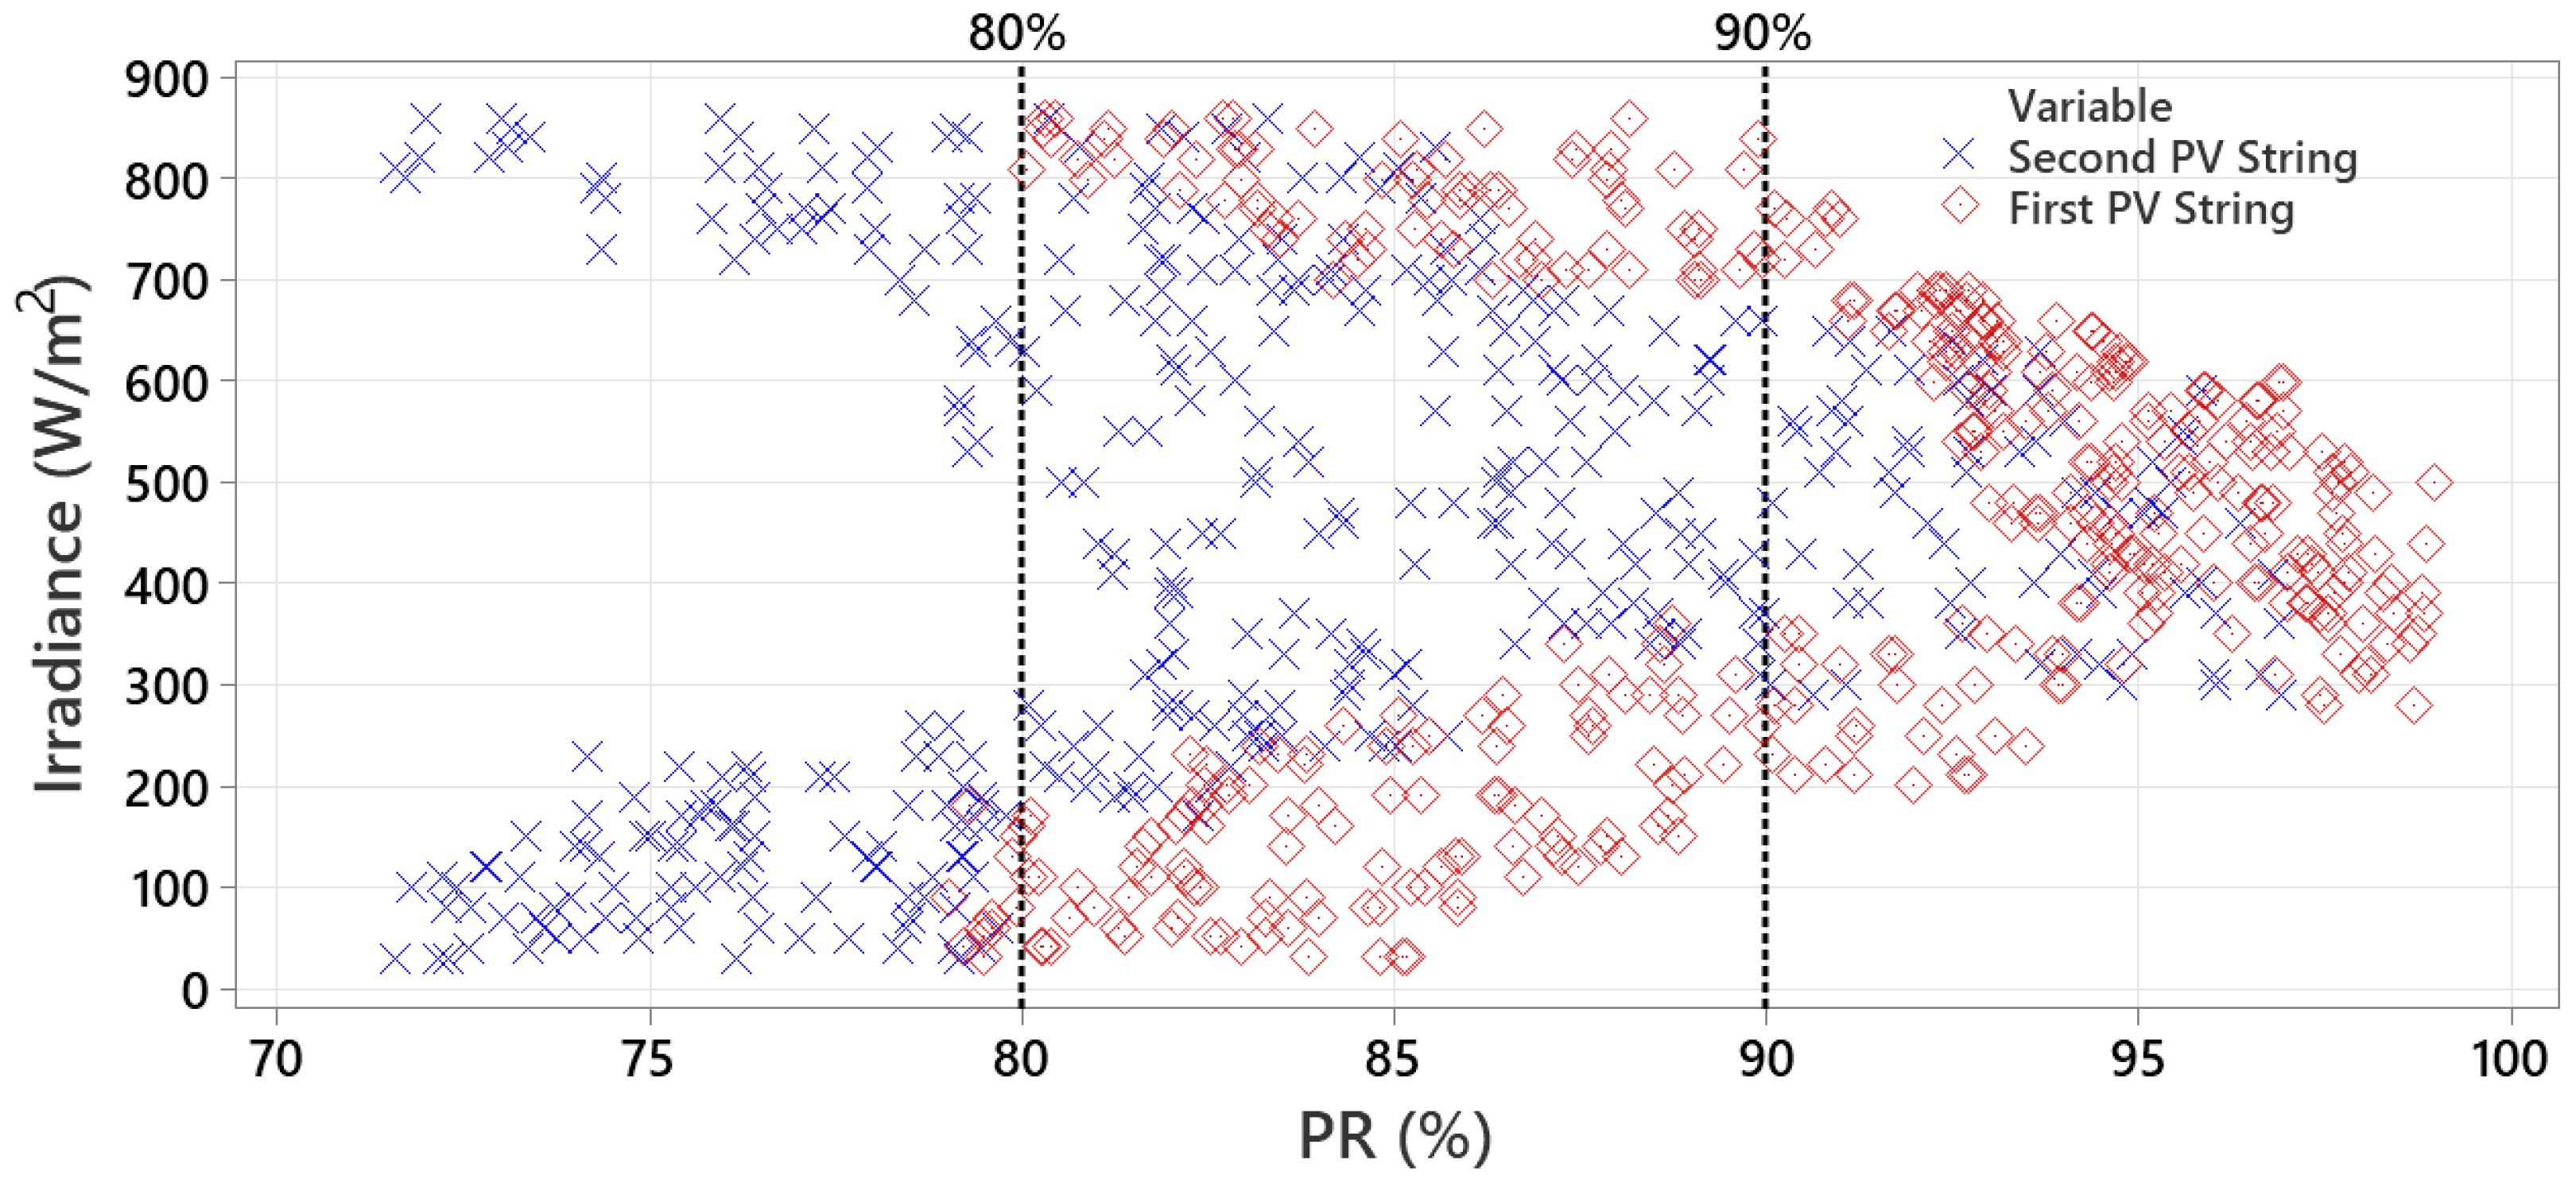
3.3. Performance Ratio Analysis

To investigate the actual differences in the output power, both PV strings’ performance ratios ( P R ) were examined. The PR is calculated as follows,
P R = P P S T C ,   r a t e d     G p o a G r e f     ( 1 + γ   ( T P V T r e f ) )
where P is the measured output power of the PV string in watts (Figure 7a), P S T C ,   r a t e d   is the rated power of the PV string in watts, G p o a is the plane-of-array irradiance (Figure 7b), G r e f is the reference irradiance at STC condition 1000 W/m2, γ is the temperature coefficient of the maximum power −0.33%/°C, T P V is the PV surface temperature in °C (Figure 7b), and   T r e f is the PV string reference temperature at STC condition 25 °C. The solar irradiance and PV surface temperature were taken using a weather station (Davis weather station), the precision of the solar irradiance and PV surface temperature was ±2 W/m2 and ±0.5 °C, respectively.
The boxplot in Figure 8b provides the output mean values of the yearly PR. The lowest PR for the first PV string, 90.5%, was discovered during its first year of operation. This result was expected [21,22,23,24] because the PV modules were exposed for the first time to UV light and fluctuations in the solar irradiance and ambient temperature. However, the PR remained at high percentages in subsequent years; 92.1% and 91.6% during the second and third years of operation, respectively. In contrast, the second PV string had a lower PR ratio compared with the first PV string. During its first year of operation, the PR was 89.5% (1% less than the first PV string). In contrast, the PR ratio decayed in the subsequent years; 87.3% and 86.6% during the second and third years of operation, respectively. This result suggests that cracks, early stage PID, and EVA degradation started to develop in the second PV string during the second to third years of service.
Furthermore, the analysis of the PR vs. month (January to December) is presented in Figure 8b. For both PV strings, it is seen that a higher PR ratio (>90%) is seen during the period April-June, while the lowest PR (<87%) is observed for January and December. In addition, there is a drop in the PR when the solar irradiance is high (July and August).
Based on this finding, we can conclude that the performance of the two PV strings is affected by environmental factors and may be impacted by degradation over time. The first PV string shows a high PR in its first year, which is expected due to exposure to environmental factors, but remains high in the following years. The second PV string has a lower PR in its first year and a decrease in PR in the following years, which suggests that PID, cracks, and degradation may start to develop over time. In terms of PR vs. month, both PV strings show the highest PR from April to June and the lowest PR in January and December. Additionally, a drop in PR is observed during months of high solar irradiance.
For further testing, the correlation between the solar irradiance and PR ratio for the PV strings was explored and is presented in Figure 9. For the second PV string, the PR is only 75% or lower when the solar irradiance is very high (>640 W/m2) or very low (<240 W/m2). In contrast, the PR is only 90% or higher when the solar irradiance is in the range of 320 W/m2 to 640 W/m2. These PR variations appear because EVA degradation and cracking impact the PV modules. We understand that a broken PV module can hardly produce maximum output power at high or deficient irradiance conditions. However, at the same time, it can maintain a good level of power production at the median irradiance level (500 W/m2).
In comparison, the first PV string has higher PR among all irradiance spectrum due to its healthy operation. However, we can also observe that at low and extremely high irradiance conditions, the actual PR is slightly lower than when the irradiance ranges between 300 and 600 W/m2.

3.4. Thermographic Inspection

In addition to the electrical and PR ratio analysis, thermal images of the PV modules were taken and are presented in Figure 10. These images were taken under 827 W/m2 and a PV surface temperature of 23.3 °C, using a FLIR E54 thermal camera with a thermal sensitivity of ±0.1 °C. The first PV string has only one hotspot located in the third PV module (0.42% of the total solar cells in the PV string). The hotspot temperature is approximately 40 °C compared with the temperature of adjacent solar cells, at nearly 23 °C. On the contrary, the second PV string is affected by 12 hotspot solar cells (5% of the total solar cells in the PV string). Their temperature varies from 35 to 40 °C.
The results of this study confirm that an anti-PID inverter is capable of preventing PID and, to some degree, other malfunctions in the PV module’s performance (e.g., leakage of current or degradation in EVA [25,26,27,28,29]). As a result, it can provide an alternative solution to hotspot recovery. In this application, anti-PID could not mitigate the hotspot temperature. Still, limiting PID in solar cells can help reduce the number of hotspots. Table 3 shows examples of EL and UVF images of solar cells. A notable crack is visible in the EL and UVF for cell #1, and severe PID affects cells #2 and #3. Thus, in all three cases, a hotspot was developed. Here, we conclude that anti-PID can protect PV modules against PID and EVA degradation. In such a case, we also found that anti-PID could not mitigate the increase in temperature of the hotspots and could not resolve the output power losses caused by PV hotspots.

4. Conclusions

We report our results on the importance of anti-PID inverters for PV installations in this paper. Two PV strings were examined, one with an anti-PID inverter, and the other without. As a result of three years of field operations, the following remarkable results were discovered: 2.9% of the total solar cells in the second PV string were affected by cracks or PID, while only 0.42% of the first string were affected by PID.
  • Only 0.42% of the first string had cracks or PID, compared to 2.9% of the second string.
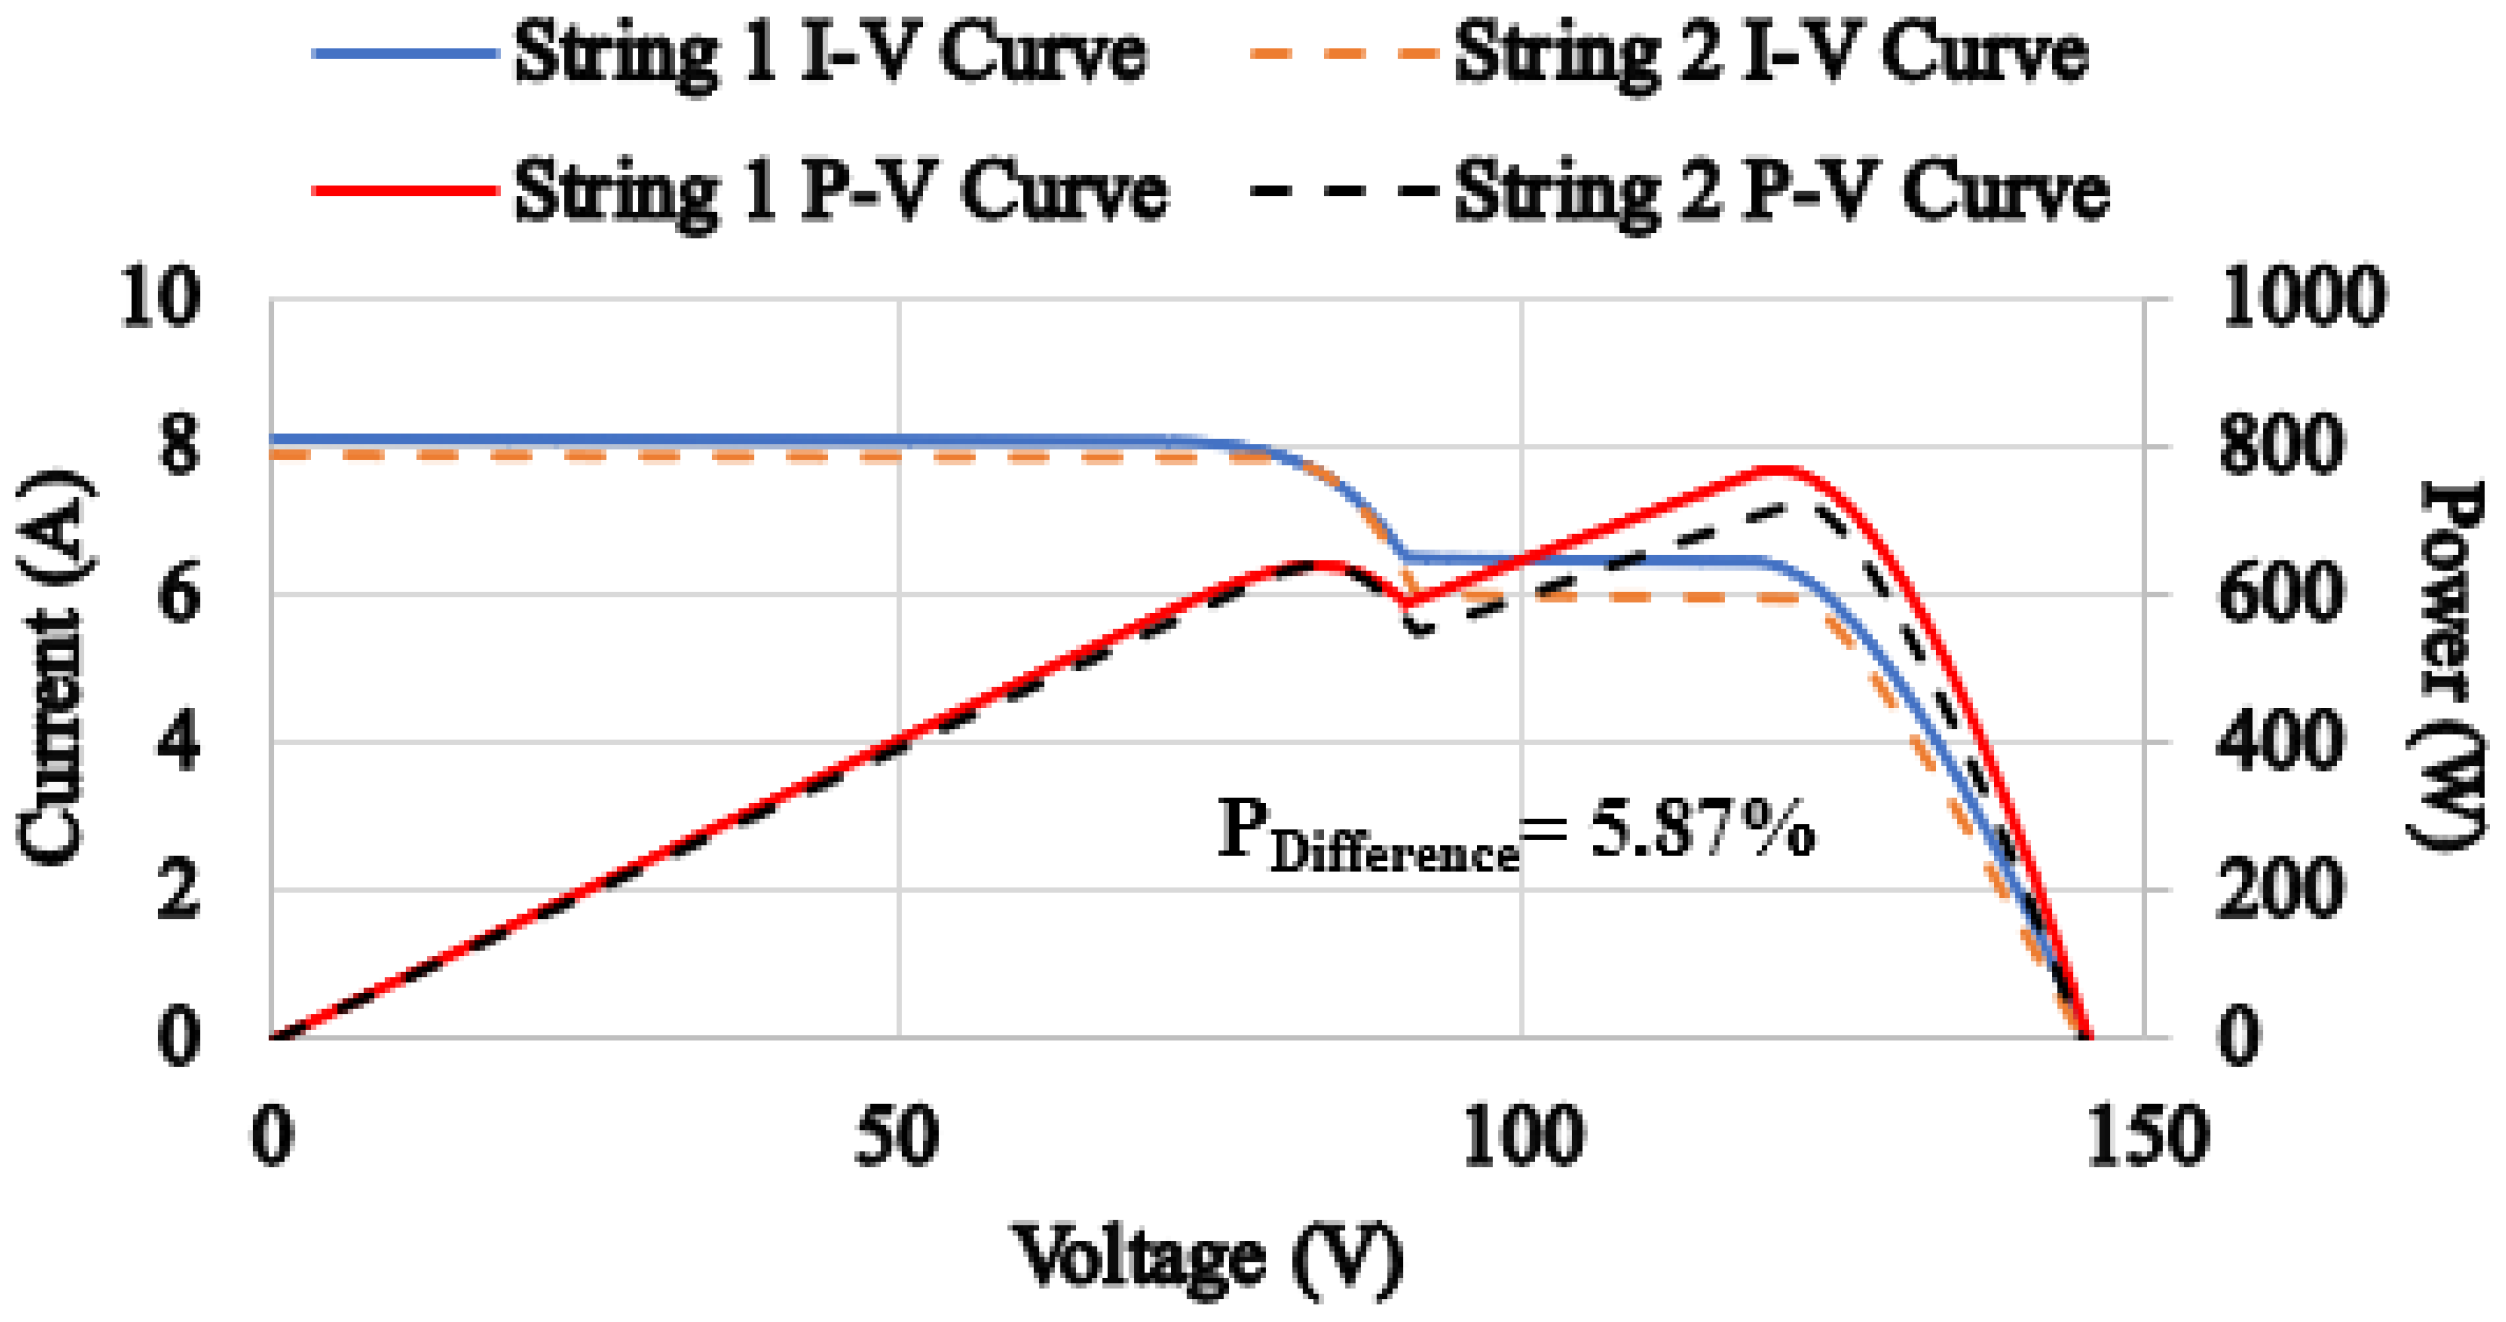
  • In comparison to the first PV string, the output power of the second PV string dropped by 5.86%.
  • First and second PV strings had average PR ratios of 91.4% and 87.8%, respectively.
  • In the second PV string, 5% of the total solar cells had hotspots, as opposed to 0.42% in the first string.
This conclusion highlights the importance of the results of this study for the PV industry. The findings suggest that anti-PID inverters play a critical role in improving output power yield and preventing PID, as well as other mismatched conditions in photovoltaic systems. By understanding the benefits of using anti-PID inverters, the photovoltaic industry can make informed decisions about how to design and operate their systems for optimal performance and longevity.

Author Contributions

Conceptualization, M.D.; methodology, M.D. and G.B.; validation, M.D. and G.B.; formal analysis, M.D.; data curation, G.B.; writing—original draft preparation, M.D.; writing—review and editing, G.B. All authors have read and agreed to the published version of the manuscript.

Funding

No funding was received for the work presented in this paper.

Institutional Review Board Statement

Not applicable.

Informed Consent Statement

Not applicable.

Data Availability Statement

The corresponding author of this article can provide data upon reasonable request.

Conflicts of Interest

The authors declare no conflict of interest.

References

  1. Hallam, B.; Herguth, A.; Hamer, P.; Nampalli, N.; Wilking, S.; Abbott, M.; Wenham, S.; Hahn, G. Eliminating Light-Induced Degradation in Commercial p-Type Czochralski Silicon Solar Cells. Appl. Sci. 2018, 8, 10. [Google Scholar] [CrossRef] [Green Version]
  2. Kopecek, R.; Libal, J. Bifacial Photovoltaics 2021: Status, Opportunities and Challenges. Energies 2021, 14, 2076. [Google Scholar] [CrossRef]
  3. Ascencio-Vásquez, J.; Kaaya, I.; Brecl, K.; Weiss, K.-A.; Topič, M. Global Climate Data Processing and Mapping of Degradation Mechanisms and Degradation Rates of PV Modules. Energies 2019, 12, 4749. [Google Scholar] [CrossRef] [Green Version]
  4. Aranda, C.A.; Caliò, L.; Salado, M. Toward Commercialization of Stable Devices: An Overview on Encapsulation of Hybrid Organic-Inorganic Perovskite Solar Cells. Crystals 2021, 11, 519. [Google Scholar] [CrossRef]
  5. Ren, H.; Zou, X.; Cheng, J.; Ling, T.; Bai, X.; Chen, D. Facile Solution Spin-Coating SnO2 Thin Film Covering Cracks of TiO2 Hole Blocking Layer for Perovskite Solar Cells. Coatings 2018, 8, 314. [Google Scholar] [CrossRef] [Green Version]
  6. Goudelis, G.; Lazaridis, P.I.; Dhimish, M. A Review of Models for Photovoltaic Crack and Hotspot Prediction. Energies 2022, 15, 4303. [Google Scholar] [CrossRef]
  7. Wang, H.; Zhao, P.; Yang, H.; Chang, J.; Song, D.; Sang, S. Performance variation of dark current density-voltage characteristics for PID-affected monocrystalline silicon solar modules from the field. Microelectron. Reliab. 2018, 81, 320–327. [Google Scholar] [CrossRef]
  8. Dhimish, M.; Hu, Y.; Schofield, N.; Vieira, R.G. Mitigating Potential-Induced Degradation (PID) Using SiO2 ARC Layer. Energies 2020, 13, 5139. [Google Scholar] [CrossRef]
  9. Wang, B.; Zhu, X.; Li, S.; Chen, M.; Lu, H.; Yang, Y. Ag@SiO2 Core-shell Nanoparticles Embedded in a TiO2 Mesoporous Layer Substantially Improve the Performance of Perovskite Solar Cells. Nanomaterials 2018, 8, 701. [Google Scholar] [CrossRef] [Green Version]
  10. Ho, W.-J.; Chen, G.-Y.; Liu, J.-J. Enhancing Photovoltaic Performance of Plasmonic Silicon Solar Cells with ITO Nanoparticles Dispersed in SiO2 Anti-Reflective Layer. Materials 2019, 12, 1614. [Google Scholar] [CrossRef] [Green Version]
  11. Wang, Q. Research on the effect of encapsulation material on anti-PID performance of 1500 V solar module. Optik 2020, 202, 163540. [Google Scholar] [CrossRef]
  12. Martínez-Moreno, F.; Figueiredo, G.; Lorenzo, E. In-the-field PID related experiences. Sol. Energy Mater. Sol. Cells 2018, 174, 485–493. [Google Scholar] [CrossRef] [Green Version]
  13. Dhimish, M.; Tyrrell, A.M. Power loss and hotspot analysis for photovoltaic modules affected by potential induced degradation. NPJ Mater. Degrad. 2022, 6, 11. [Google Scholar] [CrossRef]
  14. Balasubramani, G.; Thangavelu, V.; Chinnusamy, M.; Subramaniam, U.; Padmanaban, S.; Mihet-Popa, L. Infrared Thermography Based Defects Testing of Solar Photovoltaic Panel with Fuzzy Rule-Based Evaluation. Energies 2020, 13, 1343. [Google Scholar] [CrossRef] [Green Version]
  15. Ahmed, W.; Hanif, A.; Kallu, K.D.; Kouzani, A.Z.; Ali, M.U.; Zafar, A. Photovoltaic Panels Classification Using Isolated and Transfer Learned Deep Neural Models Using Infrared Thermographic Images. Sensors 2021, 21, 5668. [Google Scholar] [CrossRef] [PubMed]
  16. Dhimish, M.; Alrashidi, A. Photovoltaic Degradation Rate Affected by Different Weather Conditions: A Case Study Based on PV Systems in the UK and Australia. Electronics 2020, 9, 650. [Google Scholar] [CrossRef] [Green Version]
  17. Zhao, X.; Park, N.-G. Stability Issues on Perovskite Solar Cells. Photonics 2015, 2, 1139–1151. [Google Scholar] [CrossRef] [Green Version]
  18. Appelbaum, J.; Maor, T. Dependence of PV Module Temperature on Incident Time-Dependent Solar Spectrum. Appl. Sci. 2020, 10, 914. [Google Scholar] [CrossRef] [Green Version]
  19. Zikulnig, J.; Mühleisen, W.; Bolt, P.J.; Simor, M.; De Biasio, M. Photoluminescence Imaging for the In-Line Quality Control of Thin-Film Solar Cells. Solar 2022, 2, 1–11. [Google Scholar] [CrossRef]
  20. Dong, H.; Pang, S.; Zhang, Y.; Chen, D.; Zhu, W.; Xi, H.; Chang, J.; Zhang, J.; Zhang, C.; Hao, Y. Improving Electron Extraction Ability and Device Stability of Perovskite Solar Cells Using a Compatible PCBM/AZO Electron Transporting Bilayer. Nanomaterials 2018, 8, 720. [Google Scholar] [CrossRef] [PubMed] [Green Version]
  21. Dhimish, M. Performance Ratio and Degradation Rate Analysis of 10-Year Field Exposed Residential Photovoltaic Installations in the UK and Ireland. Clean Technol. 2020, 2, 170–183. [Google Scholar] [CrossRef]
  22. Romero-Fiances, I.; Muñoz-Cerón, E.; Espinoza-Paredes, R.; Nofuentes, G.; De la Casa, J. Analysis of the Performance of Various PV Module Technologies in Peru. Energies 2019, 12, 186. [Google Scholar] [CrossRef] [Green Version]
  23. Dhimish, M. Thermal impact on the performance ratio of photovoltaic systems: A case study of 8000 photovoltaic installations. Case Stud. Therm. Eng. 2020, 21, 100693. [Google Scholar] [CrossRef]
  24. Dhimish, M.; Hu, Y. Rapid testing on the effect of cracks on solar cells output power performance and thermal operation. Sci. Rep. 2022, 12, 12168. [Google Scholar] [CrossRef]
  25. Hasan, A.A.Q.; Ahmed Alkahtani, A.; Shahahmadi, S.A.; Nur, E.; Alam, M.; Islam, M.A.; Amin, N. Delamination-and Electromigration-Related Failures in Solar Panels—A Review. Sustainability 2021, 13, 6882. [Google Scholar] [CrossRef]
  26. Hassan, S.; Dhimish, M. Review of Current State-of-the-Art Research on Photovoltaic Soiling, Anti-Reflective Coating, and Solar Roads Deployment Supported by a Pilot Experiment on a PV Road. Energies 2022, 15, 9620. [Google Scholar] [CrossRef]
  27. Kuczyńska-Łażewska, A.; Klugmann-Radziemska, E. Influence of Fragment Size on the Time and Temperature of Ethylene Vinyl Acetate Lamination Decomposition in the Photovoltaic Module Recycling Process. Materials 2019, 12, 2857. [Google Scholar] [CrossRef] [Green Version]
  28. Badran, G.; Dhimish, M. Field study on the severity of photovoltaic potential induced degradation. Sci. Rep. 2022, 12, 22094. [Google Scholar] [CrossRef]
  29. Dhimish, M.; Ahmad, A.; Tyrrell, A.M. Inequalities in photovoltaics modules reliability: From packaging to PV installation site. Renew. Energy 2022, 192, 805–814. [Google Scholar] [CrossRef]
Figure 1. EL imaging of a PV module, this PID was carried out following the IEC628041 PID-testing standard, the tested PV module was under a temperature. of 60 °C with 80% humidity and subjected to a negative 1000 V load and operating under a short circuit current (8.18 A) for 96 h: (a) Before PID, (b) after PID.
Photonics 10 00225 g001
Figure 2. Examined PV system: (a) Physics picture of the PV strings, (b) Inverter’s internal circuit design, including the anti-PID functionality. A black box labels the first PV string, and a red box labels the second PV string.
Photonics 10 00225 g002
Figure 3. Inspection of the PV modules at day 1 of operation: (a) EL image, (b) UVF image. Circled cells in the UVF image indicate samples of solar cells with darker cells indicating early-stage defects.
Photonics 10 00225 g003
Figure 4. Inspection of the PV modules at day 1 of operation, the measured P-V and I-V curves for both PV strings at 822 W/m2 solar irradiance and a PV surface temperature of 19.7 °C.
Photonics 10 00225 g004
Figure 5. Inspection of the PV modules after three years of field service: (a) EL image, (b) UVF image. Those solar cells labeled in "red" have some major cracks.
Photonics 10 00225 g005
Figure 6. Inspection of the PV modules on after three years of field service, the measured P-V and I-V curves for both PV strings at 827 W/m2 solar irradiance and a PV surface temperature of 23.3 °C.
Photonics 10 00225 g006
Figure 7. PV and metrological data of the PV system: (a) PV strings measured output power taken from the inverters log (MPPT data log), (b) Solar irradiance and PV surface temperature.
Photonics 10 00225 g007
Figure 8. Performance ratio of the tested PV strings over the considered period of the study: (a) Boxplot and mean of the PR ratio, (b) Boxplot PR vs. months. For the analysis of the performance ratio, data in this particular region (containing symbol “Photonics 10 00225 i001“) can be excluded since they are unlikely to be true.
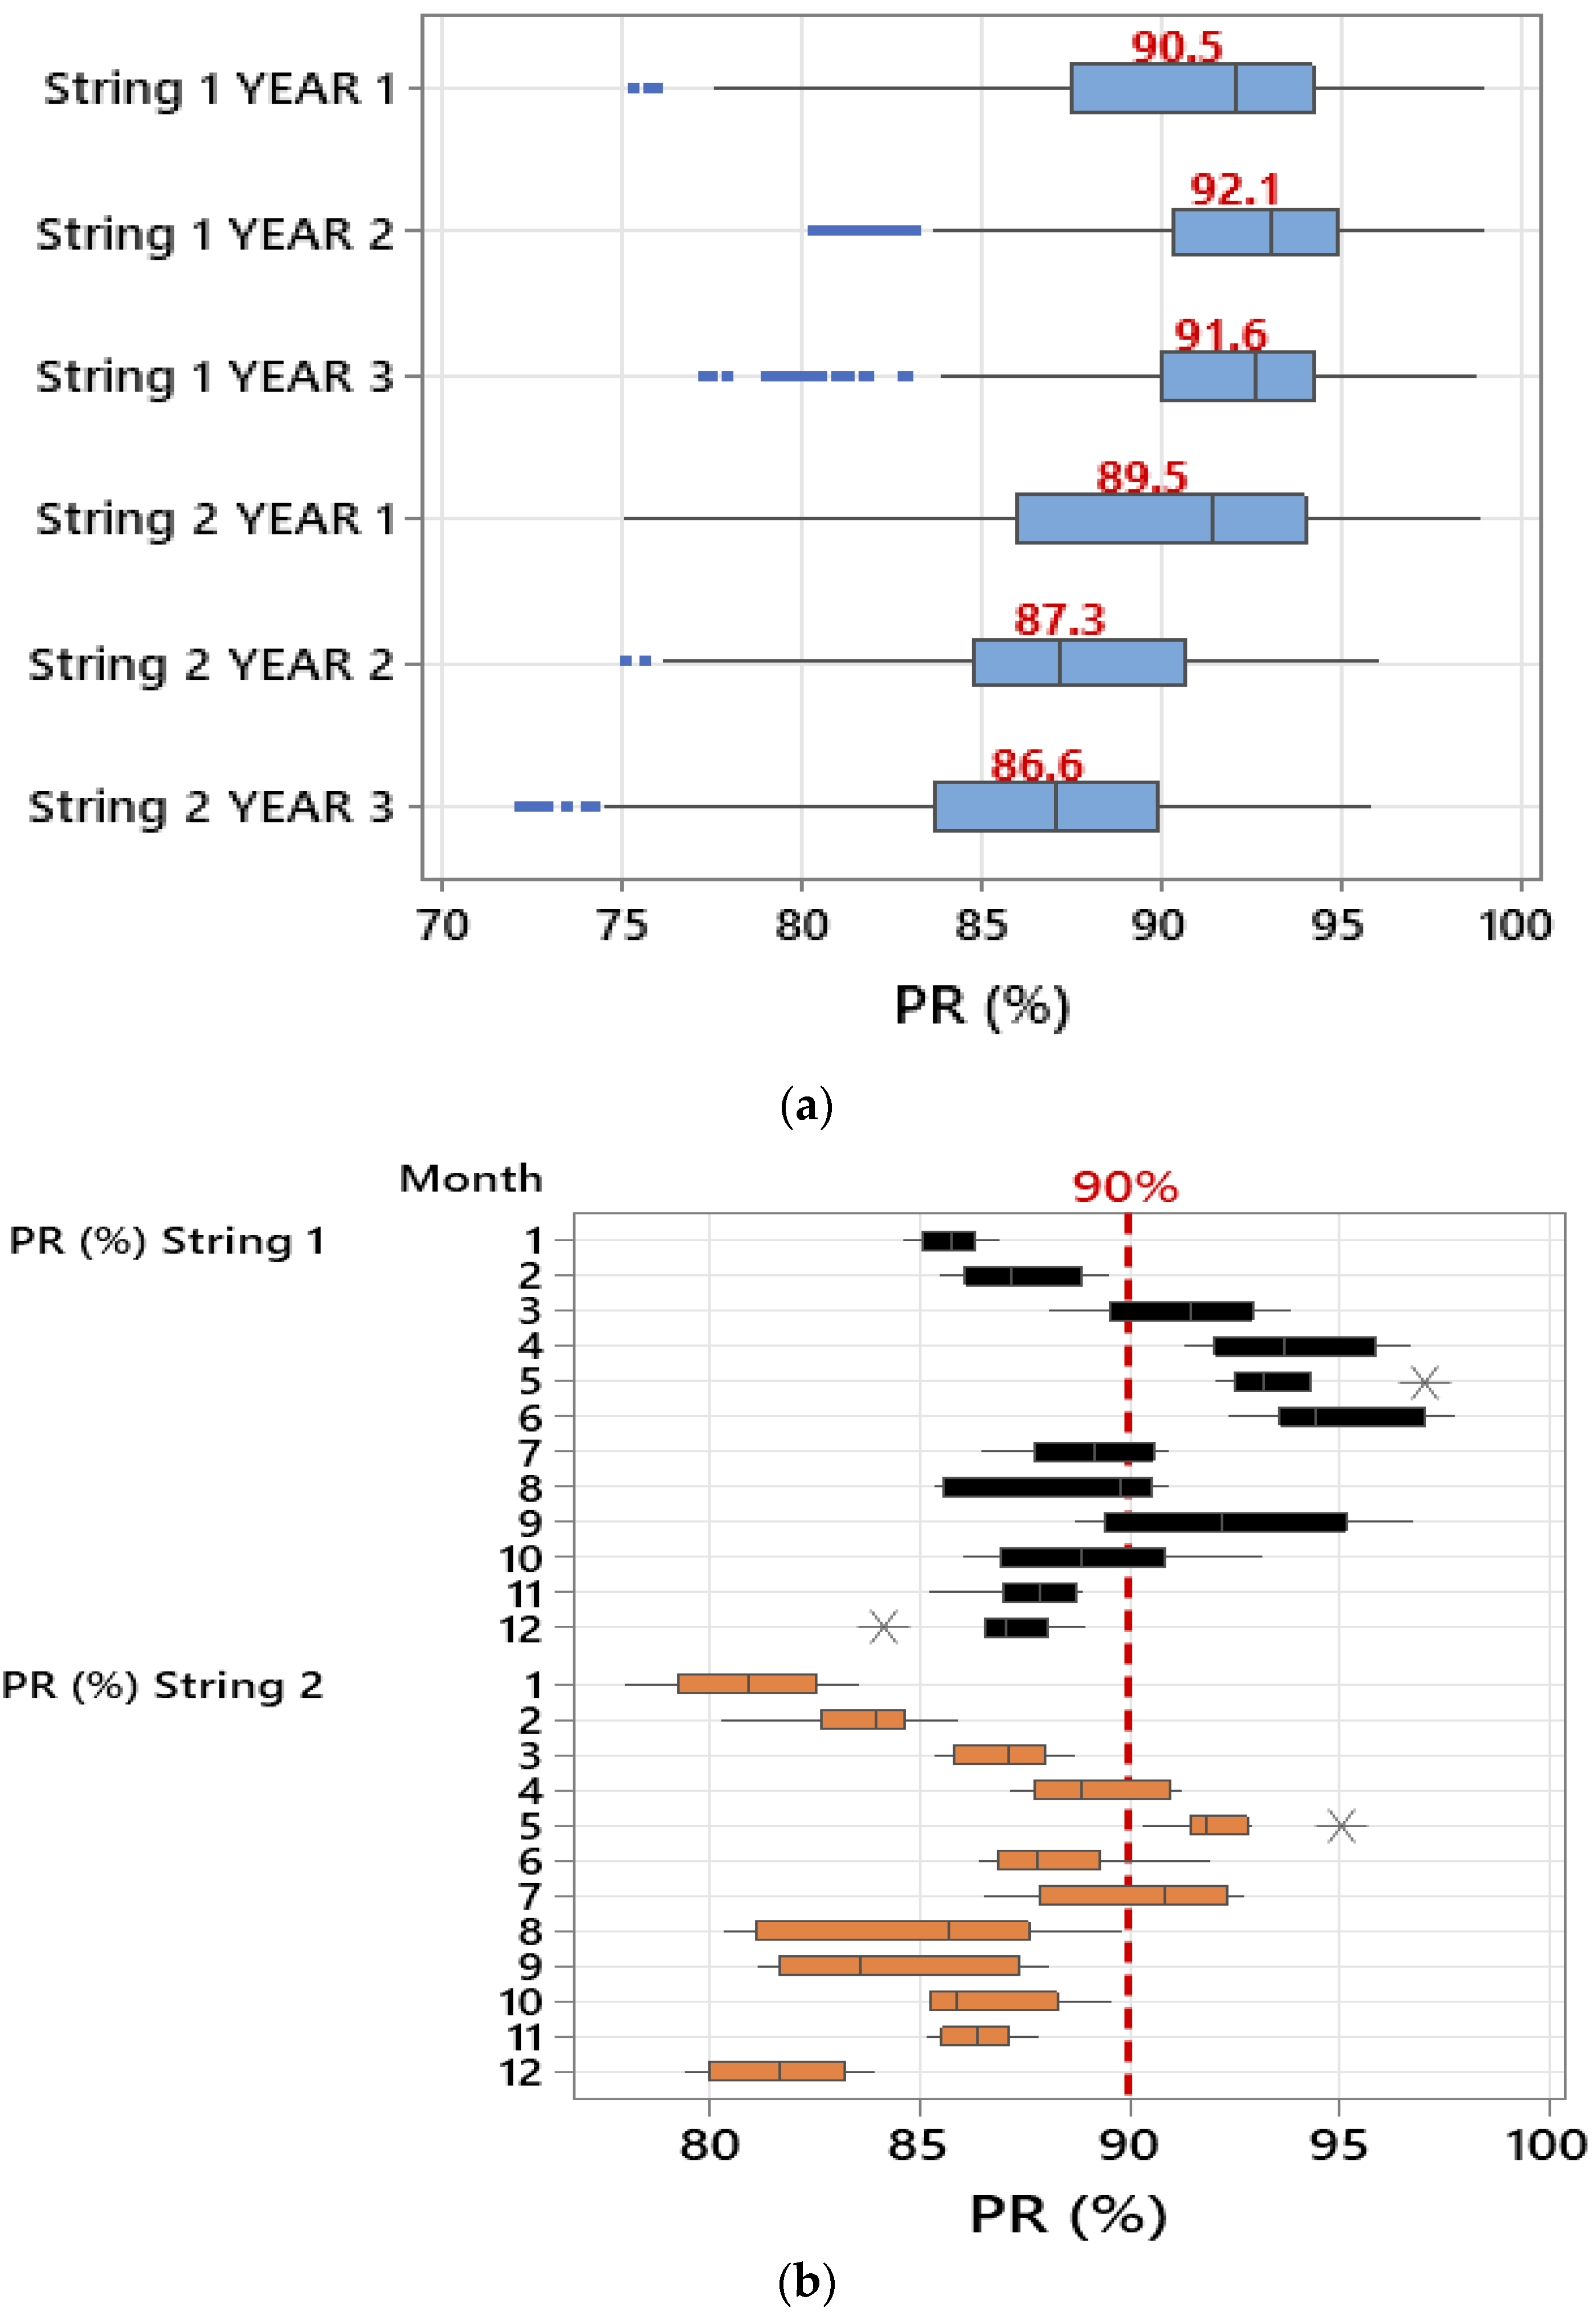
Photonics 10 00225 g008
Figure 9. Correlation between solar irradiance and the PR ratio for the examined PV strings.
Photonics 10 00225 g009
Figure 10. Thermal images of the tested PV strings after three years of field operation, taken under 830 W/m2 solar irradiance and a PV surface temperature of 23.3 °C: (a) PV string 1, (b) PV string 2.
Photonics 10 00225 g010
Table 1. Main electrical parameters of the examined PV modules at STC conditions.
ParameterValue
Power at maximum power point ( P M P P )220 W
Current at maximum power point ( I M P P )7.68 A
Voltage at maximum power point ( V M P P )28.65 V
Short circuit current ( I S C )8.10 A
Open circuit voltage ( V O C )36.6 V
Table 2. Measured electrical parameters at 827 W/m2 solar irradiance and a PV surface temperature of 23.3 °C.
ParameterString 1String 2Difference (%)
P M P P (W)770.4727.75.86
I S C (A)8.077.921.89
V O C (V)145.3144.90.27
I M P P (A)6.385.967.05
V M P P (V)120.4122.1−1.4
FF (%)65.5163.413.31
Table 3. Comparative examples of solar cell EL and UVF images.
PV StringSolar CellEL ImageUVF ImageThermal Image
Photonics 10 00225 i002
2#1, Day 1Photonics 10 00225 i003Photonics 10 00225 i004Photonics 10 00225 i005
#1, After three yearsPhotonics 10 00225 i006Photonics 10 00225 i007Photonics 10 00225 i008
2#2, Day 1Photonics 10 00225 i009Photonics 10 00225 i010Photonics 10 00225 i011
#2, After three yearsPhotonics 10 00225 i012Photonics 10 00225 i013Photonics 10 00225 i014
1#3, Day 1Photonics 10 00225 i015Photonics 10 00225 i016Photonics 10 00225 i017
#3, After three yearsPhotonics 10 00225 i018Photonics 10 00225 i019Photonics 10 00225 i020
Disclaimer/Publisher’s Note: The statements, opinions and data contained in all publications are solely those of the individual author(s) and contributor(s) and not of MDPI and/or the editor(s). MDPI and/or the editor(s) disclaim responsibility for any injury to people or property resulting from any ideas, methods, instructions or products referred to in the content.

