Communication

Research on the Linear Demodulation Range and Background Noise of Fiber-Optic Interferometer System

1
Shandong Key Laboratory of Optical Fiber Sensing Technologies, Laser Institute, Qilu University of Technology (Shandong Academy of Sciences), Jinan 250014, China
2
School of Electrical Engineering & Telecommunications, The University of New South Wales, Sydney, NSW 2052, Australia
*
Author to whom correspondence should be addressed.
Photonics 2023, 10(3), 283; https://doi.org/10.3390/photonics10030283
Submission received: 1 February 2023 / Revised: 28 February 2023 / Accepted: 4 March 2023 / Published: 7 March 2023
(This article belongs to the Special Issue Fiber Optics and Its Applications)

Abstract

:
The linear demodulation range and background noise of the Michelson interferometer system are investigated with a laser phase noise measurement system. We have theoretically and experimentally analyzed the performance of the interferometer system by changing the frequency modulation amplitude of the laser and the optical path difference (OPD) of the interferometer, respectively. It is shown that the linear demodulation range of the Michelson interferometer system is finite, which depends on the parameters of the system, such as the sample frequency, the delay time between two interferometer arms, and the system bandwidth. Furthermore, the experimental results indicate that the background noise of the interferometer system can be reduced by using a sufficiently long OPD so that the smaller true phase information can be detected with the demodulation system. The parameters of the measurement system could be optimized to satisfy the demand of the phase demodulation with different levels, which is of great significance for the phase monitoring interrogator, such as fiber-optical interferometer sensors and distributed acoustic sensors.

1. Introduction

Fiber-optic interferometers have drawn a great deal of attention in interferometric sensors [1,2], phase/frequency noise measurement of the single longitudinal mode laser [3,4], and distributed acoustic sensors [5,6,7] due to their high accuracy, high sensitivity, and quantitative measurement. An optical fiber interferometer based on a 3×3 optical fiber coupler can determine the phase angle from its three outputs with some advantages over other methods [8,9,10], such as its passive structure, its lack of carrier signal and active feedback control, its compactness, its lack of bandwidth limitation by active devices, and its lack of signal fading problem.
Interferometric sensors have the ability to create an interference pattern that enables them to demodulate information about desired parameters [11]. Their unique sensing abilities have been considerably improved by using innovative optical fiber technologies of distributed acoustic sensors. Indeed, fiber interferometers have been applied for real-time deformation monitoring of bridges, construction, and oil and gas industries [12,13,14]. However, the demodulation system based on fiber interferometers requires a better linear measurement range and much lower background noise to recover the variable of interest to be measured. For an interferometry demodulation system with a fixed analog–digital converter and photoelectric detectors, the performance of the system will be influenced by both its optical path difference (OPD) and the frequency noise of the probe laser simultaneously. Thus, figuring out an ideal scheme for analyzing the key factor quantificationally is of great significance for the measurement system of the fiber-optic interferometer.
In this paper, the linear demodulation range and background noise of a Michelson interferometer system based on a 3×3 optical fiber coupler are investigated with different frequency modulation amplitudes of the laser and the OPDs, respectively. Experimental results show that linear demodulation range is not constant at different modulation frequencies f m and decreases with an increase of f m . It is limited by the sample frequency and the delay time between the interferometer arms. The background noise is usually much larger than the phase fluctuation of the test laser in the experiment. The background noise normalized to OPD = 1 m would be decreased with an increase in OPD of the interferometer arms. The proposed scheme also provides a promising method to guide the optimization of the parameters of the interferometry demodulation system, such as the sample frequency, the OPD between the interferometer arms, and the system bandwidth.

2. Experimental Setup and Methods

The phase demodulation system based on Michelson interferometer is shown in Figure 1. The Michelson interferometer is composed of a 3×3 optical fiber coupler and two Faraday rotator mirrors (FRMs), which are able to convert the phase and frequency fluctuation of the laser into the variance of the light intensity. The FRMs will remove the polarization fading of the interferometer, caused by external disturbance on its two interferometer arms. The interference fringes are detected by PDs and recorded by the DAQ card. The phase demodulation system based on Michelson interferometer should take measures to protect against vibration and sound.
Generally, the optical field of a single-frequency laser can be modeled as a quasi-monochromatic amplitude-stabilized field undergoing a frequency/phase fluctuation [15,16].
E t = P 0 exp j 2 π ν 0 t + 0 t δ ν t d t
where P0 is the optical output power, ν0 is the optical frequency, and δν(t) is the laser frequency fluctuation. Alternatively, a high-frequency sinusoidal frequency modulation may be generated directly by a device located in the laser source. It could be considered that the laser frequency noise can be characterized as white noise with a broad spectrum of frequency components. In either case, the output of the unbalanced interferometer arms for the electric field E(t) is
I t , τ = P 0 + P 0 cos 2 π ν 0 τ + t τ t δ ν t d t
where τ is the delay time of the interferometer. Assuming that the modulated frequency of the light frequency is fm, the frequency noise δν(t) could be expressed as
δ ν t = ν m sin 2 π f m t
where νm is the modulation amplitude of the light frequency. The corresponding differential phase Δφ(t) induced by the interferometer is
Δ ϕ t , τ = 2 π ν 0 τ + 2 π t t + τ ν m sin 2 π f m t d t
When the delay time τ is far less than 1/fm, Δφ(t) has the following form
Δ ϕ t , τ   =   2 π ν 0 τ + 2 π ν m τ sin 2 π f m t
The interferometer fringe is given by
I t , τ = P 0 + P 0 cos 2 π τ ν 0 + ν m sin 2 π f m t
According to Jacobi–Anger Expansion [8,17], Equation (6), is written as
I t , τ = P 0 1 + cos 2 π τ ν 0 J 0 2 π τ ν m                                   + 2 cos 2 π τ ν 0 n = 1 J 2 n 2 π τ ν m cos 2 π 2 n f m t                                                                   2 sin 2 π τ ν 0 n = 1 J 2 n 1 2 π τ ν m sin 2 π 2 n 1 f m t
It is clear that the output light intensity of the interferometer includes not only fm component but also the components of k·fm (k = 2,3,4…). For the frequency and phase modulation with a single modulation frequency fm, the interferometer causes the frequency components of the interferometer fringes to increase. The frequency components in excess of half of the sample frequency fs cannot be factually recorded by the A/D converter according to sampling theory. This means that the demodulated amplitude may deviate from the true value. Furthermore, the parameters τ, νm, and fm decide the energies of the different frequency components in the interferometer fringes.
The background noise of the demodulation system includes the electronic noise and the optical noise from the interferometer arms induced by the external disturbance. The electronic and optical noises will be carried into the interferometer fringe I(t). They are further converted into the noise δ through the demodulation algorithm added into the differential phase signal. For a measured differential phase signal, the power spectrum densities (PSD) of the true value Δφ, its measurement value Δφd, and the measurement system noise δ are given by
Δ φ d 2 f = Δ φ 2 f + δ 2 f
It is considered that δ is the background noise of the demodulation system. The optical noise could be prevented by constant temperature and vibration isolation. In this case, it is considered that the background noise δ(f) keeps constant when different OPDs of the interferometer are utilized. Demodulation system usually gives the PSD of the phase fluctuation normalized to OPD =1 m or the frequency fluctuation. According to the relation of Δφ = 2πΔντ, the frequency fluctuation and the phase fluctuation normalized to OPD = 1 m are, respectively,
Δ ν d 2 = Δ ν 2 + δ 2 π τ 2
and
Δ φ m 2 = Δ φ @ 1 m 2 O P D 2 + δ 2
This means that the longer the OPD, the smaller the measurement noise of the measurement frequency fluctuation and background noise normalized to OPD = 1 m.

3. Experimental Results and Discussions

3.1. Linear Demodulation Range of the Interferometer System

As shown in Figure 1, the interferometer is powered by a pre-set frequency-modulated single-longitudinal-mode (SLM) fiber laser (NP Photonics, RFLM-25-1-1550). The SLM fiber laser could be frequency-modulated by a piezoelectric transducer (PZT) modulator. Different sine waveforms with frequency f m of 0.1 kHz, 0.5 kHz, 1.0 kHz, 2.0 kHz, and 5.0 kHz could be selected as the modulation signals for the PZT modulator. The corresponding laser frequency modulated rates to the drive voltage amplitudes are 32.4 MHz/V, 29.2 MHz/V, 27.0 MHz/V, 24.8 MHz/V, and 21.8 MHz/V, respectively. The sample frequency fs is fixed at 400 kHz. The demodulation algorithm shown in ref. [4] is used to obtain the information of the modulation signal.
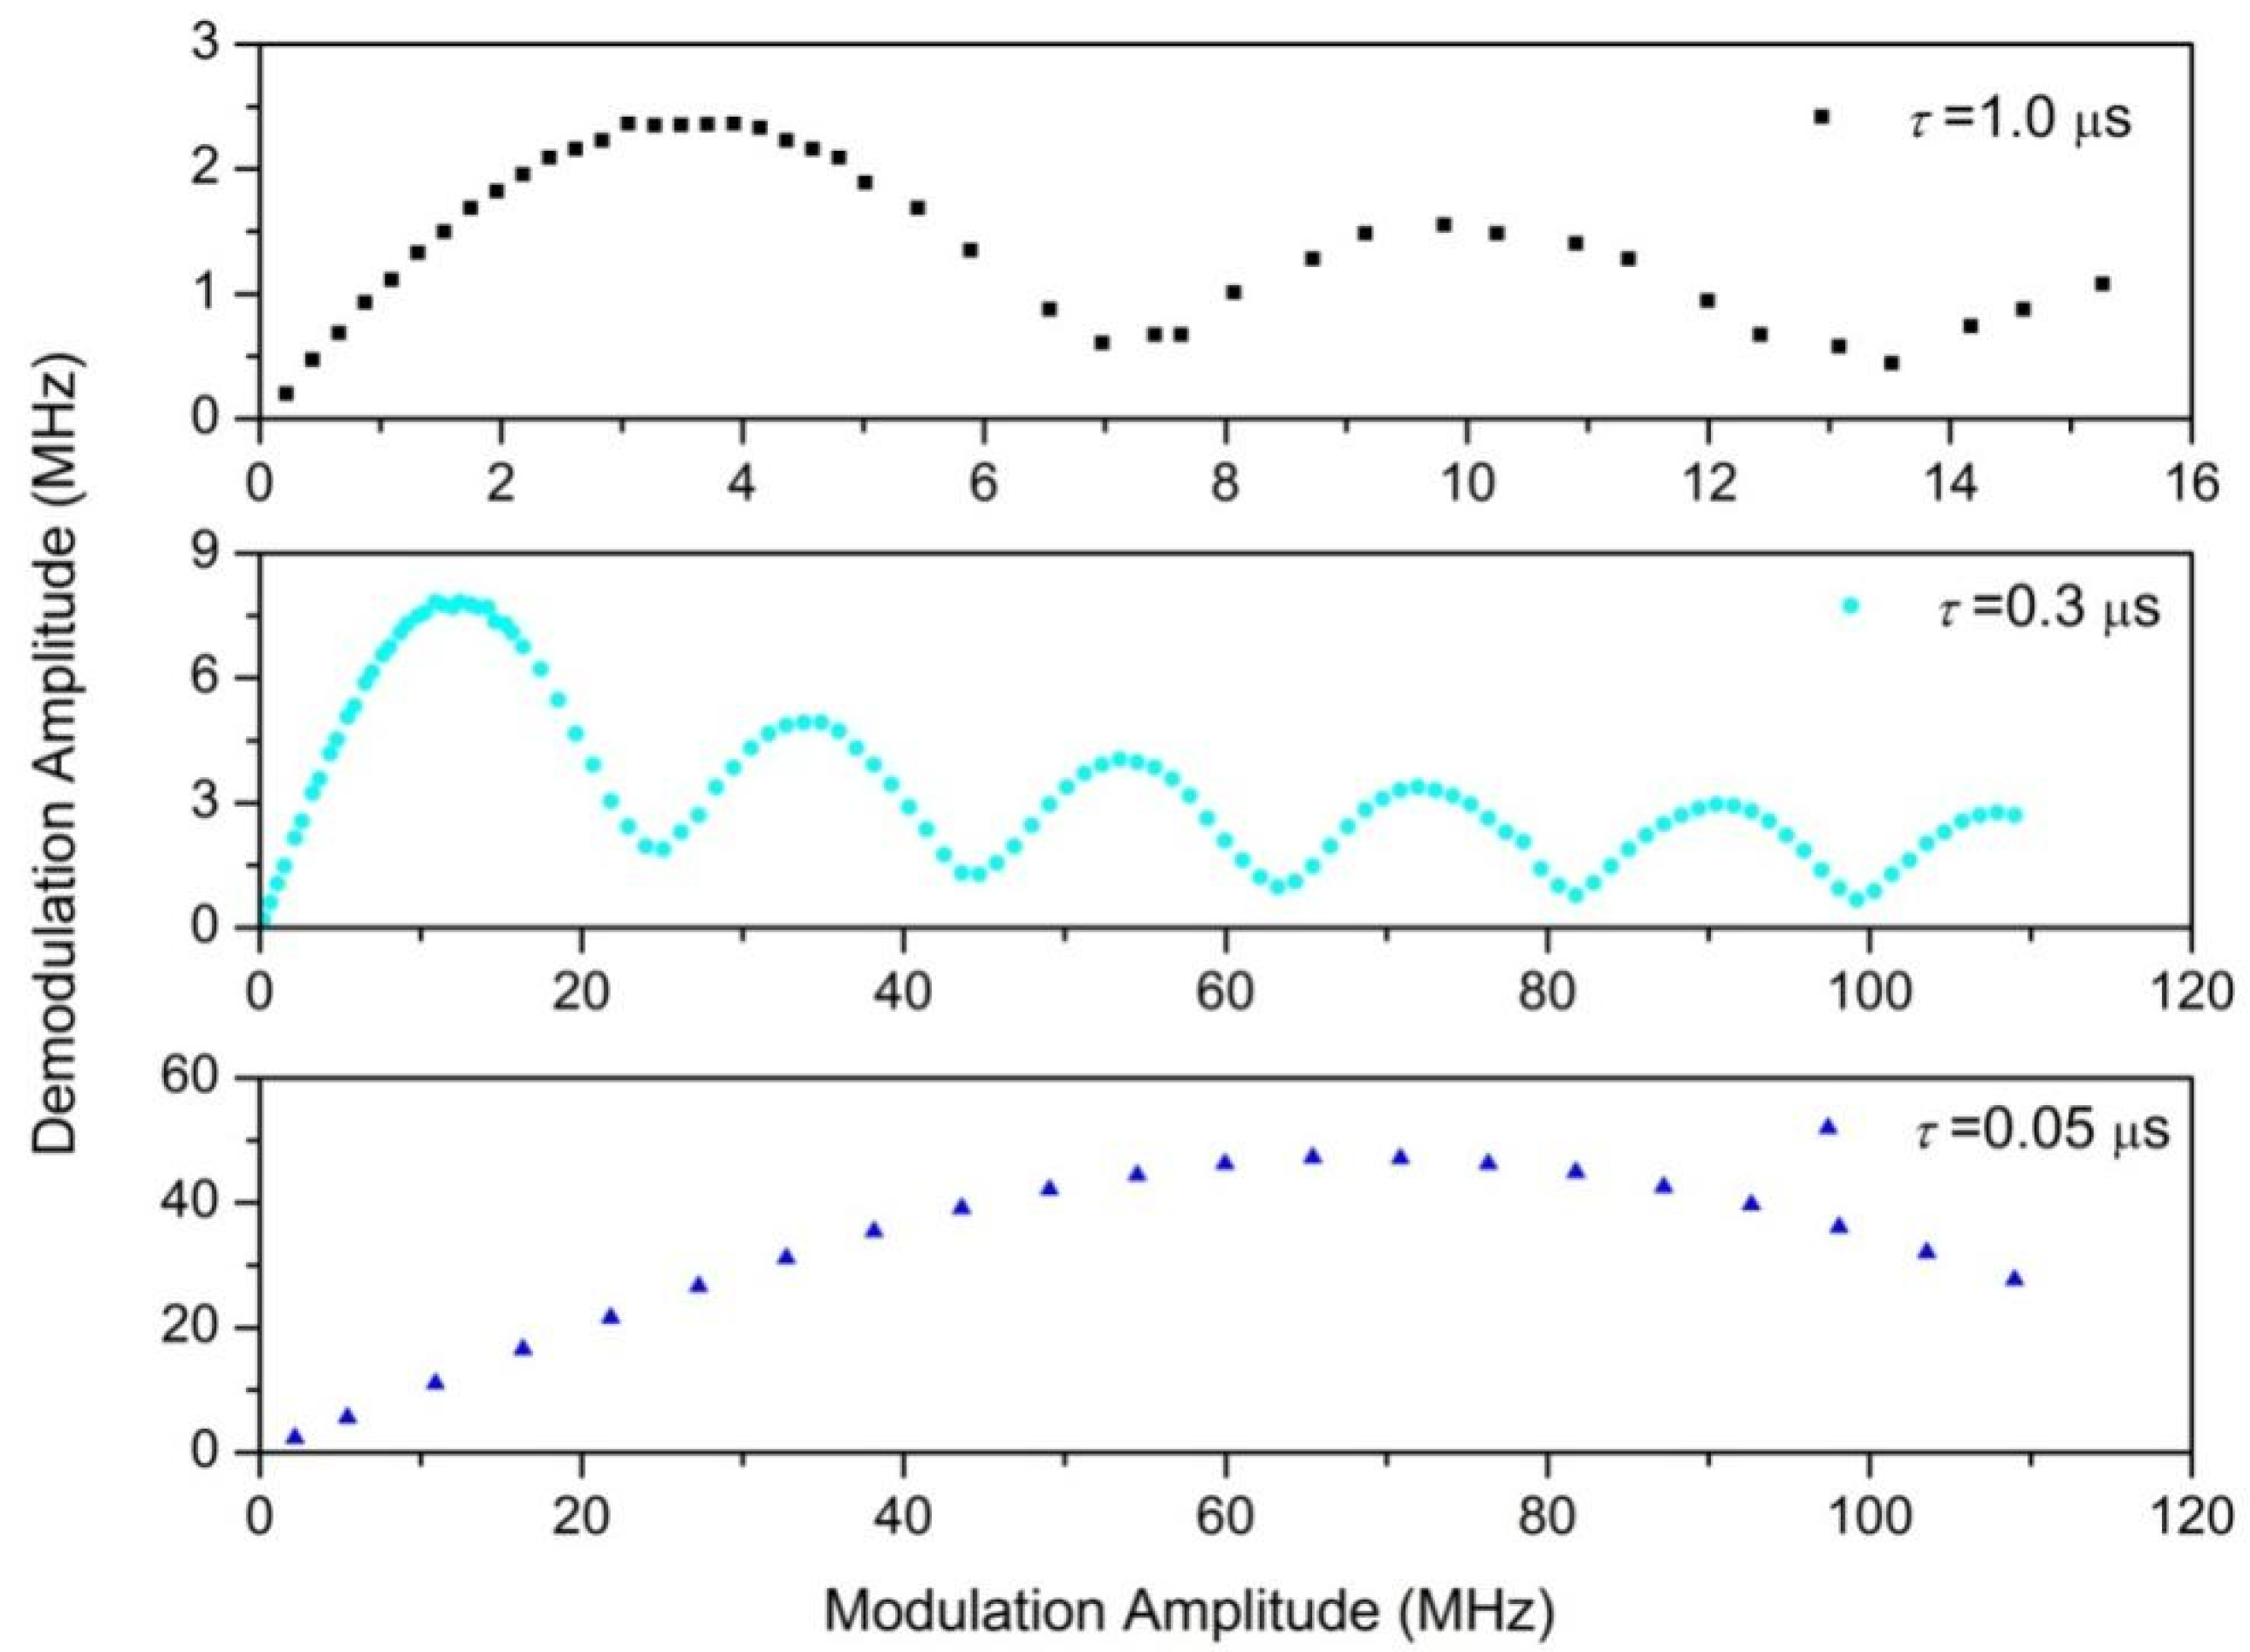
In order to study the influence of the delay time τ on the demodulation amplitude νd, the OPD between two arms of 15 m, 90 m, and 300 m are utilized in the experiment. The corresponding delay times τ are 0.05 μs, 0.30 μs, and 1.00 μs. Figure 2 shows the demodulation results at fm = 5.0 kHz. Generally, the demodulation amplitude νd should be linear to the modulation amplitude νm. However, as the modulation amplitude νm increases, the demodulation amplitude νd gradually begins to deviate from the modulation amplitude νm. With the increase of the delay time τ, the deviation occurs at the lower modulation amplitudes. This means that the linear demodulation range would be reduced with the increase of the delay time τ. In addition, when the modulation amplitude νm is over a certain value νM (75.2 MHz for τ = 0.05 μs, 12.4 MHz for τ = 0.30 μs, 3.7 MHz for τ = 1.00 μs), the demodulation amplitude νd oscillates instead of increasing monotonically. In this case, the demodulation system would lose its measurement validity. It is obvious that the demodulation systems with different delay times τ have different linear demodulation ranges and their demodulation ranges diminish with the increase of the delay time τ. From the Equation (7) in Section 2, it is apparent that the energies of different frequency components would change, and the frequency components over fs/2 may account for much more than that below fs/2 with the increase of the delay time τ.
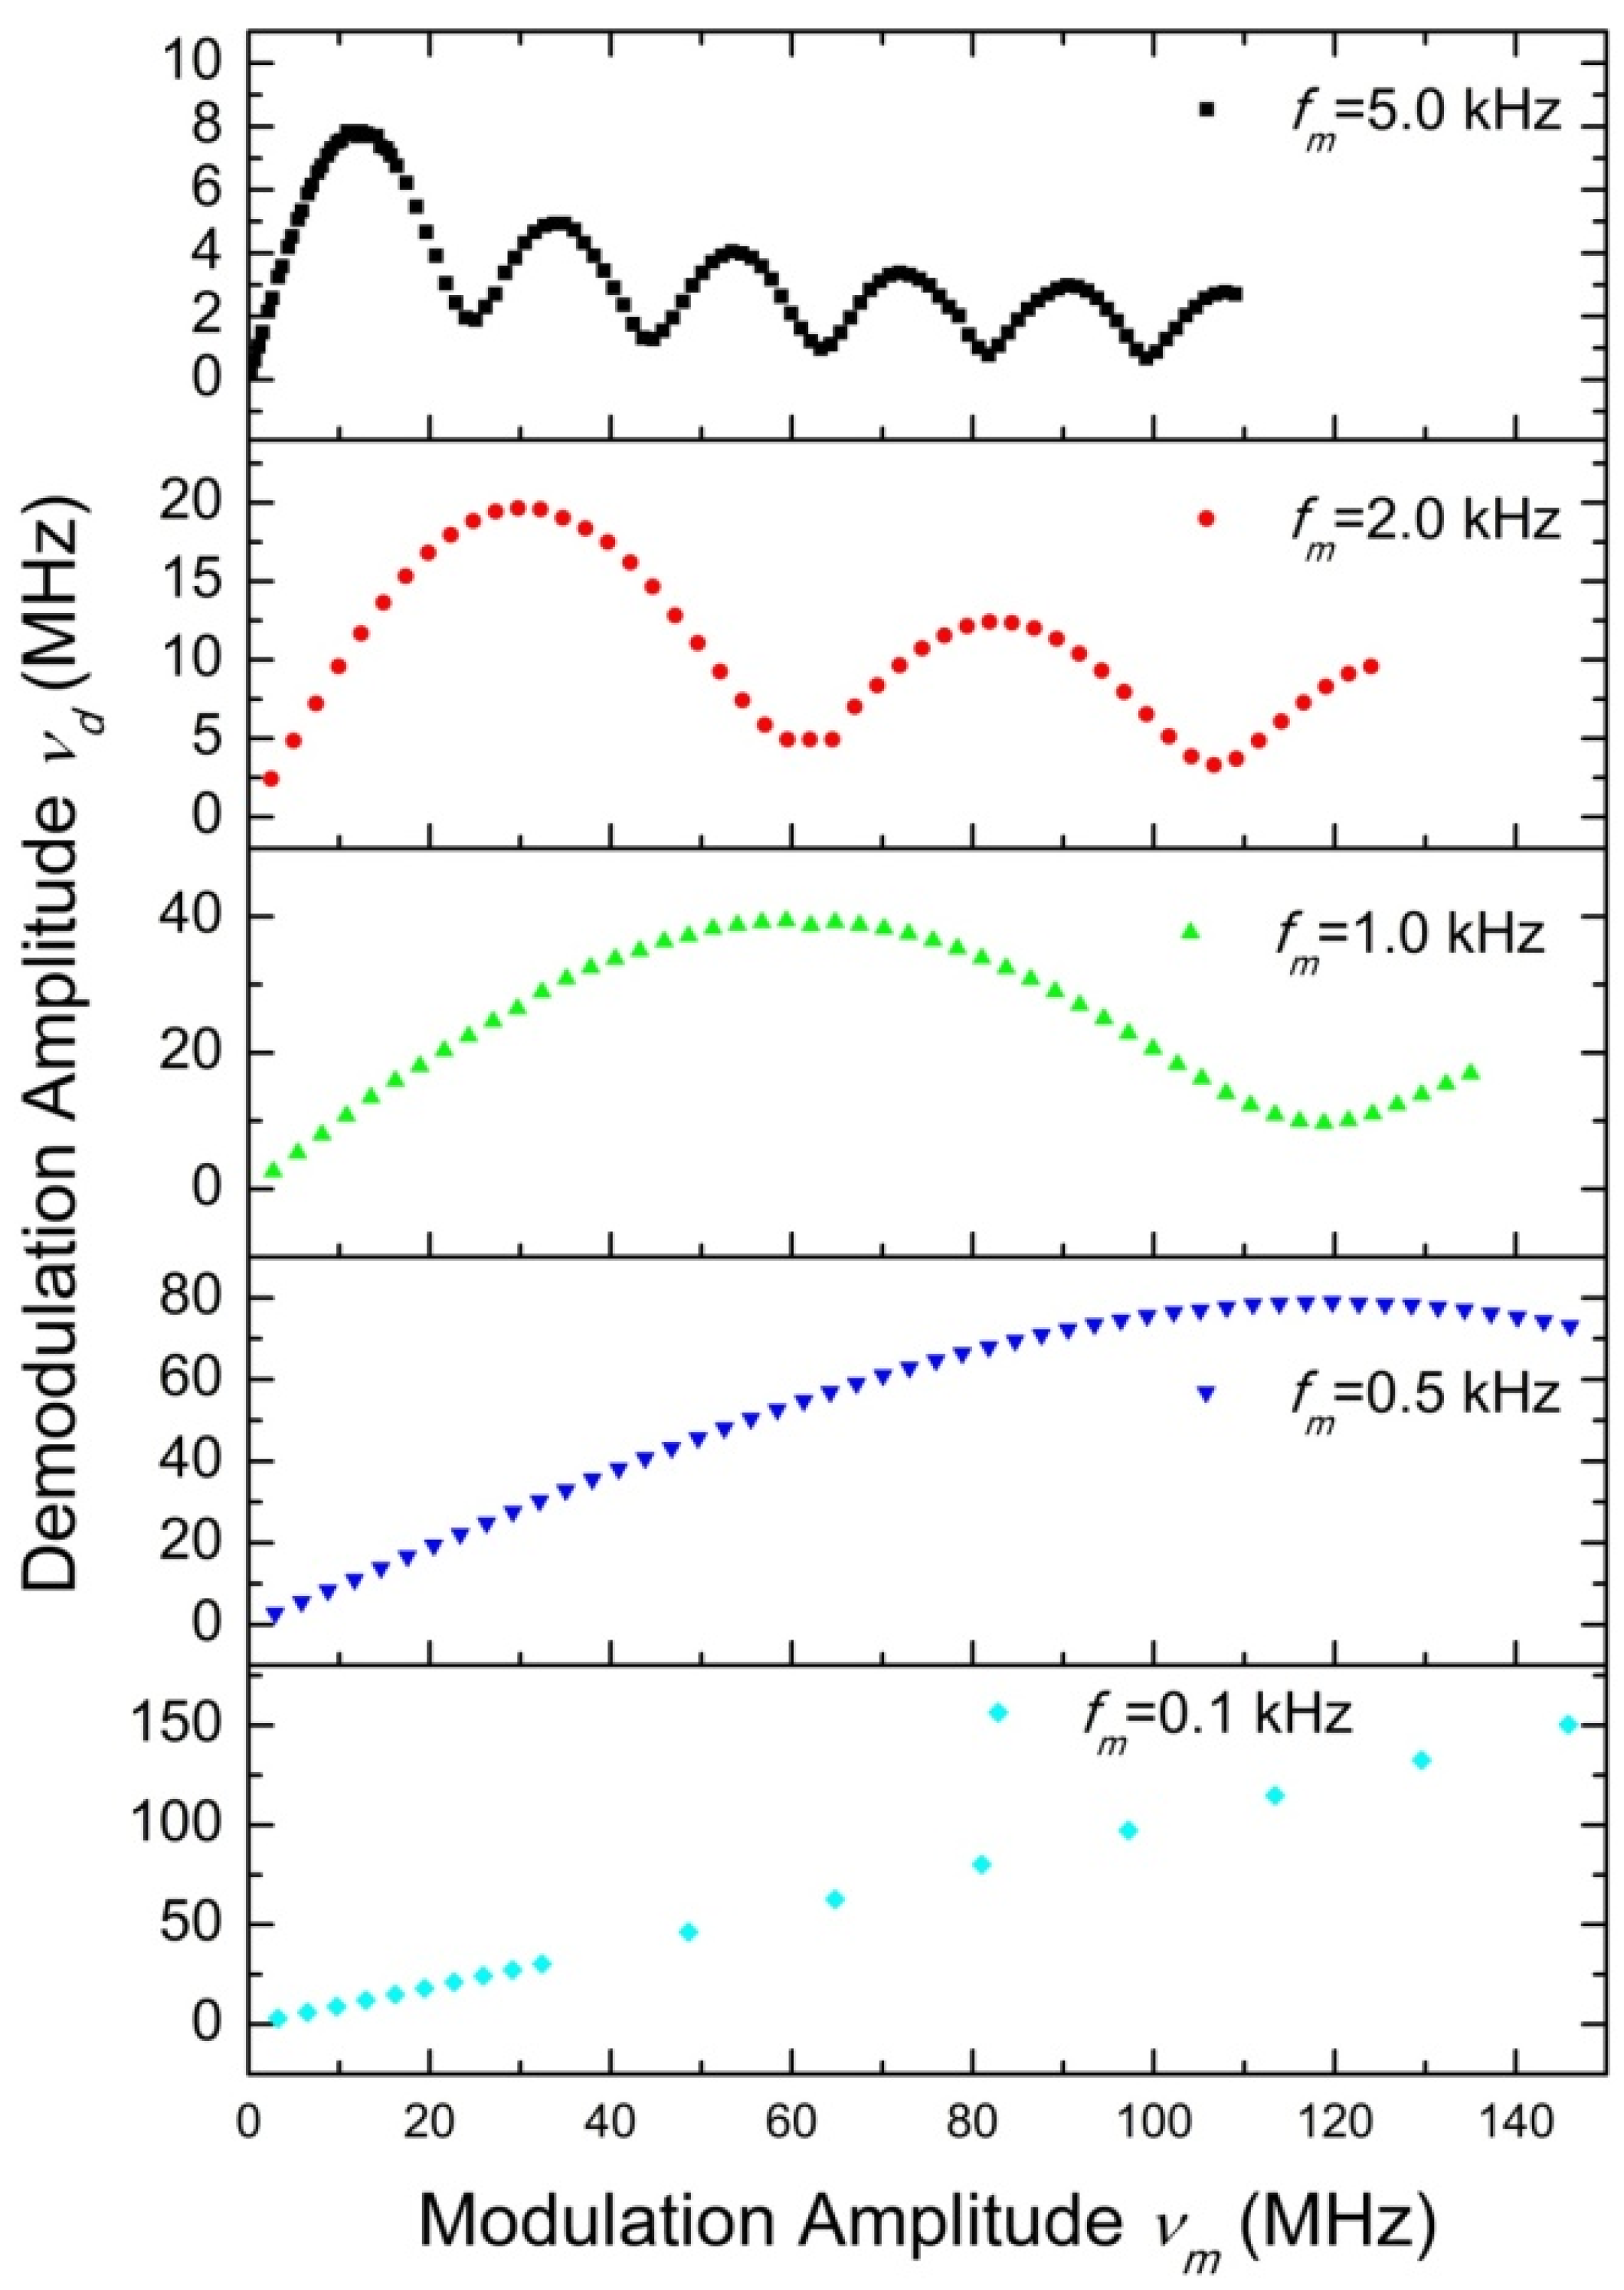
Furthermore, in order to decide on the change of the demodulation range at different modulation frequencies fm, the demodulation amplitudes νd are measured at fm = 0.1 kHz, 0.5 kHz, 1.0 kHz, 2.0 kHz, and 5.0 kHz. The results are shown in Figure 3 at a fixed delay time τ = 0.3 μs, which are similar to those at a fixed modulation frequency fm in Figure 2. The demodulation amplitude νd also deviates from the modulation amplitude νm when the modulation amplitude νm increases. This means that for a fixed demodulation system, the linear demodulation ranges at different modulation frequencies fm are different and they would reduce with the increase of fm.
In the experiment, although the modulation frequency fm is far less than the sampling frequency fs, the demodulation results deviate from the true value when the modulation amplitude νm is over a certain value. This means that the frequency components over fs/2 are present in the interferometer fringe and become more pronounced with an increase of νm, which is consistent with the analyses in Section 2. The information directly obtained by the demodulation system is the interferometer fringe converted by the interferometer rather than the light frequency/phase variation. The interferometer fringe includes the components over fs/2 according to the Equation (7). When fm and τ increase, the higher-frequency components of the interferometer fringe would be dominant. The components with frequency higher than fs/2 could not be demodulated by the system according to the sampling theory. This results in a deviation from the true value in this case.
From the above discussion, it is clear that the linear demodulation range of the system is finite. The demodulation results no longer increase monotonously and lose their measurement validity when the modulation amplitude is over a certain value νM. It is clear that the parameter νM at different modulation frequencies fm depends on the sampling frequency fs and delay time τ of the interferometer. However, it is hard to decide their relation from the Equation (7). In order to obtain their significant relation, the parameters fm, τ, fs, and νM in the experiment are shown in Table 1. It is obvious that the value of 4πνMτfm is almost equal to 0.59fs. As a guide parameter, the effective demodulation range of the frequency amplitude could be simply defined as 0.5fs/(4πτfm), noted as Ν. According to the parameter Ν, the delay time τ and sample frequency fs could be optimized. Meanwhile, it is indicated that the bandwidth and the demodulation range are mutually contradictory, like other measurement systems. While wide bandwidth is chosen, the measurement range has to yield to obtain the optimal demodulation results.

3.2. Background Noise of the Demodulation System

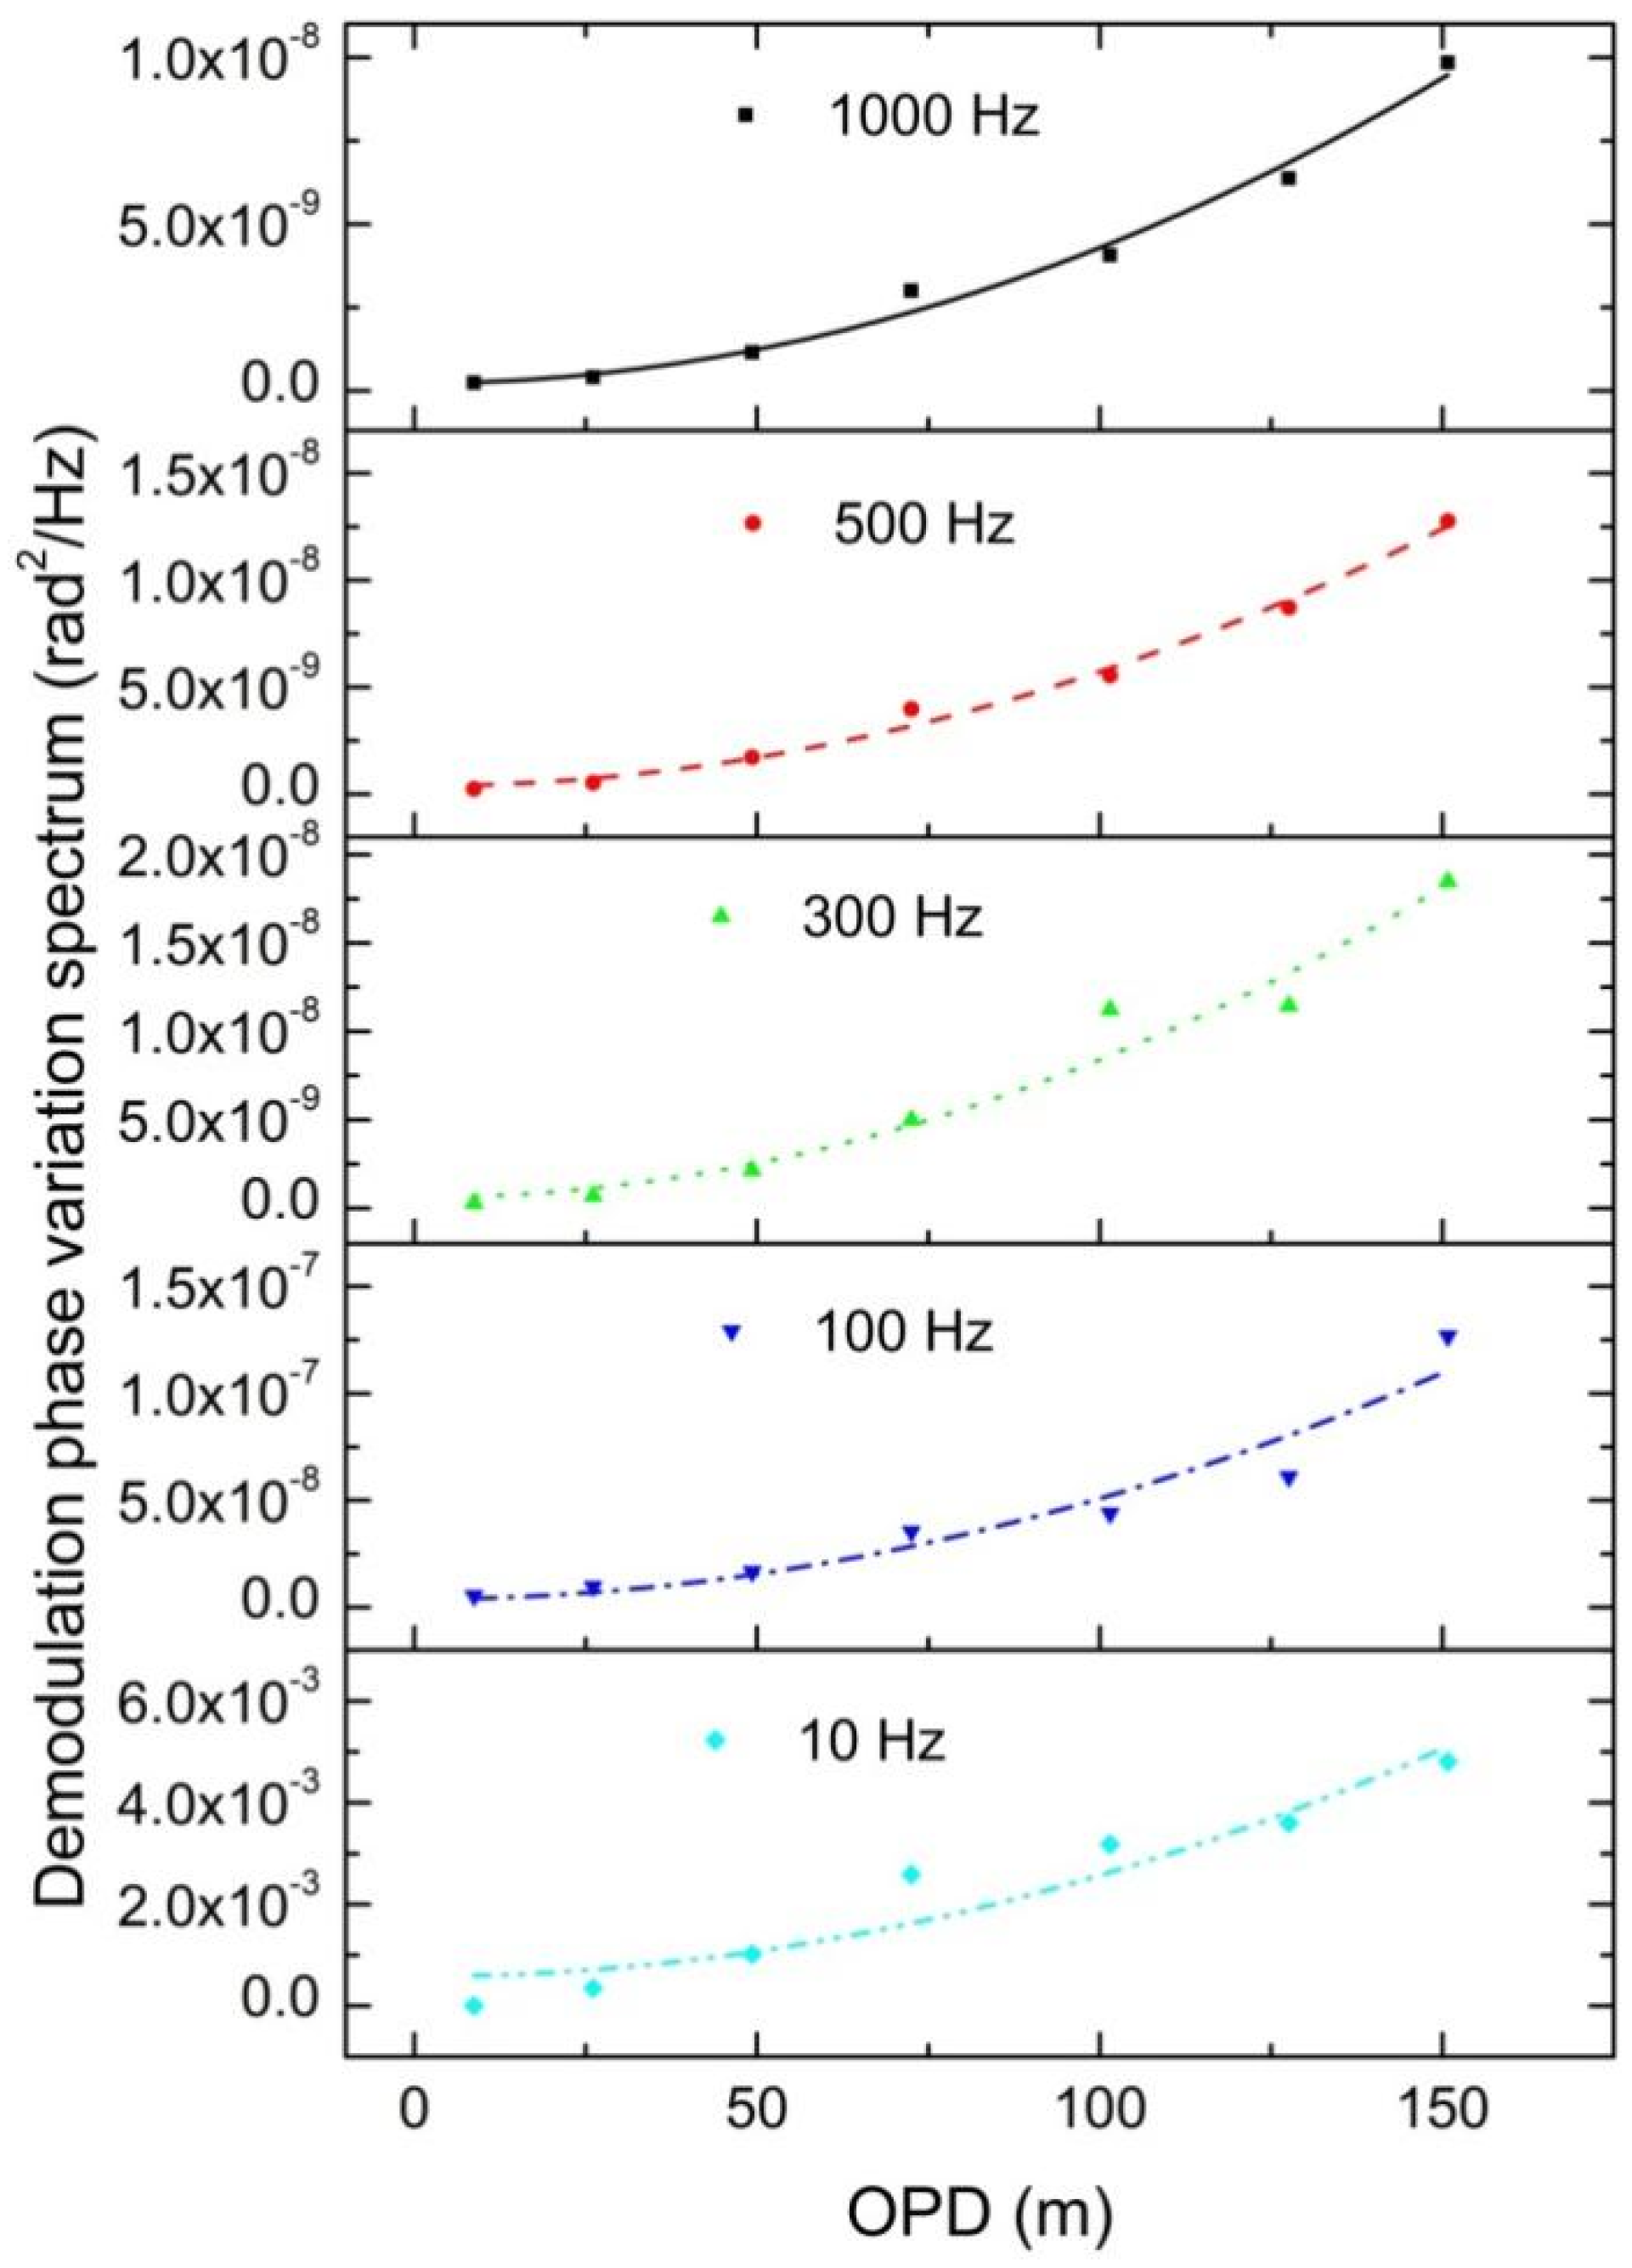
In order to obtain the system noise δ(f), a distributed feedback fiber laser with linewidth of less than 3 kHz is employed as the test source of the interferometer demodulation system. According to Equations (9) and (10), different OPD lengths are utilized. For the laser, its corresponding phase noise spectrum values at different frequencies fm of 10 Hz, 100 Hz, 300 Hz, 500 Hz, and 1000 Hz are recorded and are shown in Figure 4. According to Equation (10), the measured differential phase spectrums of the laser can be fitted by the curve y = C + Ax2, where C is δ2(f), y is PSD of the measured differential phase Δφm, A is PSD of the true phase fluctuation spectrum normalized to OPD = 1 m, and x is the OPD. The fitted curves are shown in Figure 4.
In addition, the corresponding noise δ(f) and true phase fluctuation Δφ@1m normalized to OPD = 1 m by fitting are shown in Table 2. It is clear that Δφ@1m is far less than the noise δ(f). Only when δ is far less than the true phase fluctuation Δφ@1m·OPD, δ is able to be ignored in the measurement value Δφm. As such, the OPD should be long enough to at least be satisfied:
Δ φ @ 1 m 2 f O P D 2 = 10 δ 2 f
Thus, the background noise could be reduced by increasing the length of the OPD so that the smaller true phase information can be detected by the interferometer system.

4. Conclusions

The linear demodulation range and background noise based on 3 × 3 optical coupler Michelson interferometer are studied in theory and experiment. The effective demodulation range Ν is finite and depends on the parameters of sampling frequency, interferometer delay time, and modulation frequency. The experiment shows that the reference value of Ν is 0.5fs/(4πτfm). It is also implied that the measurement range and bandwidth are inter-constrained. A method to obtain the background noise is demonstrated by measuring and fitting PSDs of the phase fluctuation with different OPD lengths. The background noise has the scale of tens μrad/√Hz at higher frequency range. In order to measure phase fluctuation accurately, the OPD of the interferometer must be long enough to make the differential phase of the interferometer arms far higher than noise level. Based on the above relationships, the parameters of a demodulation system, such as sampling frequency, OPD of the interferometer arms, and bandwidth could be optimized. It is also worth noting that this scheme is important to improve the performance of the phase monitoring system including the fiber-optical interferometer sensor and distributed acoustic sensor.

Author Contributions

Conceptualization, W.W. and S.Q.; methodology, C.W. and H.Q.; software, W.W. and C.W.; validation, Z.S.; investigation, J.G. and Z.S.; writing—original draft preparation, W.W.; writing—review and editing, S.Q.; visualization, W.W.; project administration, J.N. and G.P.; funding acquisition, P.J. and Y.S. All authors have read and agreed to the published version of the manuscript.

Funding

Innovation project of Computer Science and Technology of Qilu University of Technology (2021JC02006); Innovation Project of Science and Technology SMES in Shandong Province (2022TSGC2049); Colleges and Universities Youth Talent Promotion Program of Shandong Province (Precision Instrument Science and Technology Innovation Team); Supported by the Taishan Scholars Program; Science, education and industry integration innovation pilot project of Qilu University of Technology (2022PX002, 2022PY008); Joint Natural Science Foundation of Shandong Province (2021KJ049, ZR2021LLZ014); Key R&D Program of Shandong Province (Major Technological Innovation Project) (2021CXGC010704); Colleges and Universities Youth Innovation and Technology Support Program of Shandong Province (2019KJJ004); Natural Science Foundation of Shandong Province (ZR2020LLZ010, ZR2020QF092); National Natural Science Foundation of China (62005137).

Institutional Review Board Statement

Not applicable.

Informed Consent Statement

Not applicable.

Data Availability Statement

The data presented in this study are available upon reason able request from the corresponding author.

Conflicts of Interest

The authors declare no conflict of interest.

References

  1. Lee, B.; Kim, Y.; Park, K.; Eom, J.; Kim, M.; Rho, B.; Choi, H. Interferometric Fiber Optic Sensors. Sensors 2012, 12, 2467–2486. [Google Scholar] [CrossRef] [PubMed] [Green Version]
  2. Song, Q.; Zhou, P.; Peng, H.; Hu, Y.; Xiao, Q.; Wu, H.; Jia, B. Improved localization algorithm for distributed fiber-optic sensor based on merged Michelson-Sagnac interferometer. Opt. Express 2020, 28, 7207–7220. [Google Scholar] [CrossRef] [PubMed]
  3. Xu, D.; Yang, F.; Chen, D.; Wei, F.; Cai, H.; Fang, Z.; Qu, R. Laser phase and frequency noise measurement by Michelson interferometer composed of a 3 × 3 optical fiber coupler. Opt. Express 2015, 23, 22386–22393. [Google Scholar] [CrossRef] [PubMed]
  4. Wang, W.; Shang, Y.; Wang, C.; Song, Z.; Qi, H.; Sun, Z.; Zhang, X.; Ni, J.; Guo, J.; Zhang, F.; et al. Phase and frequency noise measurement using passive self-homodyne technique. Opt. Eng. 2017, 56, 066106. [Google Scholar] [CrossRef]
  5. Wang, C.; Shang, Y.; Liu, X.H.; Wang, C.; Yu, H.H.; Jiang, D.S.; Peng, G.D. Distributed OTDR-interferometric sensing network with identical ultra-weak fiber Bragg gratings. Opt. Express 2015, 23, 29038–29046. [Google Scholar] [CrossRef] [PubMed]
  6. Masoudi, A.; Belal, M.; Newson, T. A distributed optical fibre dynamic strain sensor based on phase-OTDR. Meas. Sci. Technol. 2013, 24, 085204. [Google Scholar] [CrossRef]
  7. Chen, M.; Masoudi, A.; Parmigiani, F.; Brambilla, G. Distributed acoustic sensor based on a two-mode fiber. Opt. Express 2018, 26, 25399–25407. [Google Scholar] [CrossRef] [PubMed]
  8. Dandridge, A.; Tveten, A.B.; Thomas, G.G. Homodyne demodulation scheme for fiber optic sensors using phase generated carrier. IEEE Trans. Microw. Theory 1982, 30, 1635–1641. [Google Scholar] [CrossRef] [Green Version]
  9. Alan, D.; Dandridge, A.; Tveten, A.B. Time-division multiplexing of interferometric fiber sensors using passive phase-generated carrier interrogation. Opt. Lett. 1987, 12, 775–777. [Google Scholar]
  10. Huynh, T.N.; Nguyen, L.; Barry, L.P. Delayed self-heterodyne phase noise measurements with coherent phase modulation detection. IEEE Photonic Technol. Lett. 2012, 24, 249–251. [Google Scholar] [CrossRef]
  11. Wang, C.; Wang, C.; Shang, Y.; Liu, X.; Peng, G. Distributed acoustic mapping based on interferometry of phase optical time-domain reflectometry. Opt. Commun. 2015, 346, 172–177. [Google Scholar] [CrossRef]
  12. Bao, X.; Chen, L. Recent progress in distributed fiber optic sensors. Sensors 2012, 12, 8601–8639. [Google Scholar] [CrossRef] [PubMed] [Green Version]
  13. Ashry, I.; Mao, Y.; Wang, B.; Hveding, F.; Bukhmisn, A.; Ng, T.; Ooi, B. A Review of Distributed Fiber–Optic Sensing in the Oil and Gas Industry. J. Light. Technol. 2022, 40, 1407–1431. [Google Scholar] [CrossRef]
  14. Lindsey, N.J.; Dawe, T.C.; Ajo-Franklin, J.B. Illuminating seafloor faults and ocean dynamics with dark fiber distributed acoustic sensing. Science 2019, 366, 1103–1107. [Google Scholar] [CrossRef] [PubMed]
  15. Gallion, P.; Guy, D. Quantum phase noise and field correlation in single frequency semiconductor laser systems. IEEE J. Quantum Electron. 1984, 20, 343–349. [Google Scholar] [CrossRef] [Green Version]
  16. Piazzolla, S.; Spano, P.; Tamburrini, M. Characterization of phase noise in semiconductor lasers. Appl. Phys. Lett. 1982, 41, 695–696. [Google Scholar] [CrossRef]
  17. Michael, J.C.; Galeti, J.H.; Kitano, C. Michelson interferometer vibrometer using self-correcting synthetic-heterodyne demodulation. Appl. Opt. 2015, 54, 5734–5738. [Google Scholar]
Figure 1. Experimental setup of the phase demodulation system based on Michelson interferometer. PD: photoelectric detector; DAQ: data acquisition; PC: personal computer.
Photonics 10 00283 g001
Figure 2. The demodulation frequency amplitude νd with respect to the modulation amplitude νm at different delay times of 0.05 μs, 0.30 μs, and 1.00 μs, respectively.
Photonics 10 00283 g002
Figure 3. The demodulation frequency amplitude νd with respect to the modulation amplitude νm at different modulation frequencies fm of 0.1 kHz, 0.5 kHz, 1.0 kHz, 2.0 kHz, and 5.0 kHz, respectively.
Photonics 10 00283 g003
Figure 4. The PSD of the measured differential phase with respect to OPD at different frequencies fm of 10 Hz, 100 Hz, 300 Hz, 500 Hz, and 1000 Hz. The lines are the corresponding fitted results.
Photonics 10 00283 g004
Table 1. The parameter νM at different modulation frequencies and delay times; ‘-’ represents that modulation amplitudes do not reach νM in these cases.
τ(μs) = 0.05τ(μs) = 0.30τ(μs) = 1.00
fm(kHz)νM
(MHz)
4πνMτfm
(kHz)
νM
(MHz)
4πνMτfm
(kHz)
νM
(MHz)
4πνMτfm
(kHz)
0.1------
0.5--125.6236.7537.8237.5
1.0--62.1234.1118.8236.25
2.0--31.1234.499.9236.25
5.075.2236.2512.4233.733.7232.48
Table 2. The PSD values of the background noise and the true phase fluctuation normalized to OPD = 1 m at different modulation frequencies.
Modulation Frequency
fm (Hz)
System Noise
δ(f) (rad/√Hz)
True Phase Fluctuation
Normalized to OPD = 1 m
Δφ@1m(f) (rad/√Hz)
102.41 × 10−24.46 × 10−4
1006.20 × 10−52.17 × 10⁻⁶
3002.47 × 10−58.83 × 10⁻⁷
5001.95 × 10−57.31 × 10⁻⁷
10001.50 × 10−56.38 × 10⁻⁷
Disclaimer/Publisher’s Note: The statements, opinions and data contained in all publications are solely those of the individual author(s) and contributor(s) and not of MDPI and/or the editor(s). MDPI and/or the editor(s) disclaim responsibility for any injury to people or property resulting from any ideas, methods, instructions or products referred to in the content.