Article

A Novel Measurement Method for Spin Polarization Three Axis Spatial Distribution in Spin-Exchange Relaxation Free Atomic Magnetometer

1
Key Laboratory of Ultra-Weak Magnetic Field Measurement Technology, Ministry of Education, School of Instrumentation and Optoelectronic Engineering, Beihang University, Beijing 100191, China
2
Zhejiang Provincial Key Laboratory of Ultra-Weak Magnetic-Field Space and Applied Technology, Hangzhou Innovation Institute, Beihang University, Hangzhou 310051, China
3
School of Physics, Beihang University, Haidian, Beijing 100191, China
*
Authors to whom correspondence should be addressed.
Photonics 2023, 10(3), 332; https://doi.org/10.3390/photonics10030332
Submission received: 20 February 2023 / Revised: 15 March 2023 / Accepted: 16 March 2023 / Published: 20 March 2023
(This article belongs to the Special Issue Optically Pumped Magnetometer and Its Application)

Abstract

:
The measurement of atomic spin polarization distribution in spin-exchange relaxation free (SERF) magnetometer is an important topic for improving the sensitivity and consistency of multi-channel magnetic field measurement applications. A novel spin polarization spatial distribution measurement method is presented based on the transient response of the magnetometer after modulating the pumped light with a chopper. Polarization is obtained by a slow-down factor based on the fast spin-exchange interaction effects. Longitudinal and transverse polarization distributions are measured simultaneously without interrupting the operation of the SERF status. Under different oscillating magnetic fields, the spin polarization is measured at the cell centroid. Residual magnetic field inside the magnetometer is obtained from the linear relationship between the precession frequency and the oscillating magnetic field. The one-dimensional polarization distributions in the x, y, and z axes are measured using a digital micromirror device with a resolution of 0.25 cm. The measurement results conform to the Lambert-Bier absorption law and the Gaussian distribution law. Furthermore, 7 × 7 two-dimensional spatial distribution measurements of polarization on the xy and yz planes are performed. Nonuniformity of 1.04 in the xy plane and 1.82 in the yz plane in the built magnetometer. Compared with other measurement methods, the distribution measurement method proposed is independent of optical depth and suitable for low polarization and high polarization applications. Based on the results of the proposed measurement method of spin polarization spatial distribution, further compensation can improve the application consistency of multi-channel magnetic field measurements and improve the sensitivity of single-channel differential measurements.

1. Introduction

Optically pumped alkali metals have been widely used in various areas, such as in atomic magnetometers [1,2,3], atomic comagnetometers [4,5], atomic clocks [6], nuclear magnetic resonance [7,8], quantum memory, and teleportation [9,10]. In the field of atomic magnetometer, the spin-exchange relaxation free (SERF) magnetometer achieved sub-fT level sensitivity due to the elimination of spin exchange relaxation between atoms [11]. The SERF magnetometer has characteristics such as low cost, miniaturization, and integration, with significant application potential in biological measurement fields, such as magnetoencephalography (MEG) and magnetocardiography (MCG) measurements [12,13,14]. The spin polarization of alkali metal atoms is a key factor affecting the performance of the SERF magnetometer systems [1]. The inhomogeneity of atomic polarization affects the imaging accuracy of MEG and MCG, and the polarization gradient limits the further improvement of the sensitivity of SERF magnetometer [15].
The spin polarization of atoms has a nonuniform distribution in space with the distribution of the light field. Realizing the SERF state requires conditions of extremely weak magnetic fields and high temperatures. The SERF magnetometer operates at a high atomic density of 1013–1014 cm3, resulting in a large optical depth in the direction of the pumped light [16]. The nonuniform distribution of polarizability in the longitudinal direction is due to the large optical depth that causes the light intensity to decay quickly [17]. In addition, the pumped light produces a transverse nonuniform polarization distribution for a Gaussian-distributed light field in the transverse direction [18]. The spatial distribution of polarization, rather than its mean value, is more important to us. The measurement of the spatial distribution of spin polarization is highly significant for achieving high-precision and high spatial resolution magnetic field measurement.
Currently, alkali atom polarization measurement methods mainly include the electron paramagnetic resonance (EPR) method, radio frequency spectroscopy (RFS) method, and pumping decay transient (PDT) method. Appelt et al. [19] used the EPR method to measure a two-dimensional spin polarization distribution. Young et al. [20] used the RFS method to apply a transverse RF field under a large background magnetic field and obtained the two-dimensional distribution of atomic electron spin polarizability in the xz plane with spatial resolution less than 0.25 cm under the condition of spatial position coding using magnetic field gradient. However, the normal operation of the SERF magnetometer was affected by large magnetic and radiofrequency fields. Walker et al. [21] measured the pumping and relaxation rate using a chopper to rapidly turn on and off the pumping light and determine the polarization of alkali metal atoms. Gusarov et al. [22] constructed an early model of on–off pumping light for the SERF magnetometer at very low polarizability with a constant slowing-down factor for scalar and vectorial magnetic field measurements. The slowing-down factor in the spatial spin polarization distribution of SERF systems could not be regarded as a fixed value. Li et al. [23] used the transmitted intensity attenuated by the pumping light to obtain the average initial intensity of the SERF magnetometer. When the optical depth was too large, the pumped light could hardly pass through the cell and the method could not measure the spatial distribution. In addition, the vast majority of the measured polarization distribution methods were longitudinal planes in the pumping light direction, with no transverse-plane-polarization distribution measurement method.
This study proposes a novel method for measuring alkali atoms’ spatial polarization distributions in a SERF magnetometer. Based on the fast spin-exchange interactions, the transverse and longitudinal plane distributions of alkali metal polarization can be obtained from the transient response of the magnetometer after modulating the pumped light using a chopper. Pumped light fully polarized alkali metal atoms in an open state and completely depolarized alkali metal in a closed state. This method is advantageous because it can measure the spin polarization spatial distribution in the SERF regime, and it is not affected by the optical depth and does not require the application of large background and radiofrequency fields. The method is suitable for both low and high polarization.
In addition, we used a digital micromirror device (DMD) for distribution measurements to acquire precise high spatial resolution spatial polarization distributions, which we have validated as a feasible high spatial resolution detection method [24]. Unlike the methods of moving the photodetector (PD) using a displacement console [25] and a large reflector [26], this method avoids variability in the measurement process and problems with the inability to precisely locate it, as well as avoids smear and blooming effects caused by the use of a charge-coupled device [27]. We used a square vapor cell in the experiments to avoid measurement error due to optical distortion caused by the vapor cell curvature. The resolution of spin polarization spatial distribution was 0.25 cm. The experimental results were consistent with the theoretical calculations and simulation results, demonstrating the validity and practicability of the proposed measurement method. The spin polarization spatial distribution measurement method optimized the performance of SERF magnetometers, and, as such, the application consistency of the multichannel measurement of the magnetic field can be improved after taking means of compensation. Our proposed measurement method is applicable to other types of optical pumping atomic magnetometers.

2. Basic Principles

2.1. Principle of Slowing-Down Effect in the SERF Regime

Spin-exchange collisions cause atomic spin relaxation. In traditional magnetometers, the accuracy of magnetometers is often limited by the relaxation caused by spin-exchange collisions. [28]. Under conditions of high density and low magnetic field, the spin-exchange collision relaxation rate between alkali metal atoms can be significantly attenuated to achieve a SERF state [29]. The spin-exchange collision rate between atomic spins is generally 105–106 s−1 in magnitude, which is much larger than the optical pumping and relaxation rates. Atomic spin obeys the spin temperature distribution between superfine Zeeman levels [30]. The spin temperature parameter β is related to the atomic polarization as follows [17]:
β = ln 1 + P z e 1 P z e .
The probability density is  ρ e β F z . Fz is the angular momentum size in the z direction of the Zeeman Sublevel, and Pz is the polarization in the z direction.
Atoms at two superfine levels, Fa = I + 1/2 and Fb = I − 1/2, obey the spin temperature distribution at each Zeeman level under the condition of fast spin-exchange collisions. In an external magnetic field along the y direction, the momentum causing the precession is mainly determined by the electron spin. The nuclear spin of an alkali metal atom and the electron spin coupling slows the frequency of the electron spin. The equivalent spin-to-magnetic ratio γequ that decreases due to the existence of the nuclear spin is as follows [31]:
γ e q u = ± γ e 2 I + 1 ,
where the gyromagnetic ratio of electrons is γe ≈ 2 π × 28 Hz/nT, and I is the nuclear spin quantum number, with different values for different types of alkali metals.
The sum of the mean total angular momentum of the spin of an atom at the superfine level of the ground state is  F a + F b  in the z direction. After the moment Δt, the counterclockwise rotation angle of an atom in a state a is ω0Δt, atoms in state b rotate the same angle clockwise ω0Δt, and their sum of total angular momentum is  F a + F b . Under SERF conditions, the Lamorr precession frequency of the atomic spin is significantly lesser than the spin-exchange collision rate between alkali metal atoms. According to the principle of conservation of angular momentum, the formula for the conservation of system angular momentum in the x direction is as follows:
ω 0 Δ t F a + ω 0 Δ t F b = ω Δ t F a + F b ,
where ω0 is the Larmor precession frequency of atomic spin in the external magnetic field under the condition of complete polarization, and ω is the precession frequency of the system’s total angular momentum. Combining with the above, mF is the angular quantum number of an alkali atom at the hyfine level F. The overall precession frequency is given as follows:
ω = m F = ( 2 I + 1 ) m F = 2 I + 1 m F e β m F + m F = ( 2 I 1 ) m F = 2 l 1 m F e β m F m F = ( 2 I + 1 ) m F = 2 I + 1 m F e β m F + m F = ( 2 l 1 ) m F = 2 I 1 m F e β m F ω 0 .
The precession frequency of the system is related to the spin temperature distribution parameter β, which is related to the atom’s spin polarization, according to Equation (1). According to the spin temperature distribution [32], (4) can be expressed as follows:
ω = ( 2 I + 1 ) ω 0 q ( P ) = γ e B q ( P ) .
The slow-down factor q(P) slows the precession frequency of the alkali metal atoms in the SERF regime. The ability to determine whether the precession frequency of the alkali metal atoms under the external magnetic field is further slowed based on the Larmor precession frequency is crucial in determining whether the atoms are in the SERF working state. q(P) is determined by the nuclear spin quantum number I and the spin polarization P. Table 1 shows the commonly used expressions of q(P) for alkali metal atoms. The q(P) is regarded as a function of spin polarization P in the accurate measurement of atomic spin polarization.

2.2. Theoretical Model of Spin Polarization Measurement

Under rapid spin-exchange conditions, the spin motion of alkali metal atoms can be described quantitatively by the evolution of the density matrix. The dynamic equation of the interaction between atomic spin and external magnetic field can also be described using a more intuitive and simple Bloch equation model [17]. If the x axis represents the direction of detection light and the z axis represents the direction of pumping light, the matrix form of the Bloch equation can be expressed as follows:
d d t P = G ^ P + 0 0 R o p T ,
where  P = P x , P y , P z T  is the spin polarizability vector, and  G ^  is the interaction matrix:
G ^ = R t o t q ( P ) γ e B z q ( P ) γ e B y q ( P ) γ e B z q ( P ) R t o t q ( P ) γ e B x q ( P ) γ e B y q ( P ) γ e B x q ( P ) R t o t q ( P ) ,
where Bx, By, and Bz are the magnitudes of the magnetic field applied by each of the three axes perceived by the alkali metal atoms;  R t o t = R o p + R r e l , and Rop are the pumping rates; and Rrel represents the total relaxation rate, excluding the relaxation effect caused by pumping light. The SERF regime, effectively, inhibits spin-exchange relaxation, with spin destruction relaxation being the main relaxation term. The spin destruction relaxation mainly comes from the binary collision between an alkali metal atom and a buffer gas He atom, the binary collision between an alkali metal atom and a quenched-gas N2 molecule, the binary collision between alkali metal atoms, and the collision relaxation between alkali metal atoms and the vapor cell wall.
In this study, we use a chopper to make square wave amplitude modulation of the pumping light at a 50% duty cycle; the pumping rate corresponding to the device’s initial pumping rate is RP, ignoring the higher-order harmonic retaining direct current and first harmonic, and the pumping rate can be written as follows:
R o p = R p 2 1 + 4 π cos ω mod t ,
when there is only a magnetic field By, and the pumping rate Rop is less than the relaxation rate Rrel. The solution of the Bloch Equation (6) above is given as follows [33]:
P x ( t ) = R p [ T 1 ( t ) + S 1 ( t ) ] P z ( t ) = R p [ T 2 ( t ) + S 2 ( t ) ]
The first term T(t) is the damping attenuation term in the dynamic solution:
T 1 ( t ) = e R r e l t q ( P z 0 ) R p ( k 0 + k 1 ) ω y cos ω y t q ( P z 0 ) + ( k 0 + k 1 ) R r e l sin ω y t q ( P z 0 ) , T 2 ( t ) = e R r e l t q ( P z 0 ) R p ( k 0 + k 1 ) R r e l cos ω y t q ( P z 0 ) ( k 0 + k 1 ) ω y sin ω y t q ( P z 0 ) ,
and the steady-state oscillation term S(t) is as follows:
S 1 ( t ) = ω y R p k 0 + 2 k 2 ω y 2 + R r e l 2 q ( P z 0 ) 2 ω mod 2 cos ( ω mod t ) + 4 k 2 q ( P z 0 ) ω mod R r e l sin ( ω mod t ) , S 2 ( t ) = R p k 0 R r e l + 2 k 2 R r e l ω y 2 + R r e l 2 + q ( P z 0 ) 2 ω mod 2 cos ( ω mod t ) + 2 k 2 q ( P z 0 ) ω mod ω y 2 + R r e l 2 + q ( P z 0 ) 2 ω mod 2 sin ( ω mod t ) .
where k0, k1, and k2 are given as follows:
k 0 = 1 2   R r e l 2 + ω y 2 , k 1 = 1 π   R r e l 2 + ω y q ( P z 0 ) ω mod 2 q ( P z 0 ) + ω y π   R r e l 2 + ω y + q ( P z 0 ) ω mod 2 , k 2 = 1 π   R r e l 2 + ω y q ( P z 0 ) ω mod 2   R r e l 2 + ω y + q ( P z 0 ) ω mod 2 .
A circularly polarized pumping laser is used to polarize alkali metal atoms, and another linearly polarized detuning laser is used to detect magnetic field signals in a dual-beam magnetometer. The optical eigenmode of linearly polarized light is the superposition of left and right circularly polarized light. Linearly polarized light shows circular birefringence through the polarized vapor cell, and the rotation angle is produced due to the Faraday rotation effect. When the detected light direction is along the x direction, the rotation angle θ is [34]:
θ = π 2 n l r e c P f D 2 v pr v D 2 v pr v D 2 2 Γ D 2 / 2 2 ,
where l is the distance at which the probe light interacts with alkali metal atoms, n is the rubidium atom’s density number, c is the propagation speed of light, re is the electron radius, and vpr is the frequency of the probe light. ΓD2, fD2, and vD2 are the pressure broadening, oscillation intensity, and resonance frequency of the probe light in the Rb D2 line.
To suppress low-frequency noise and improve detection sensitivity, a photo-elastic modulator (PEM) is used to detect the optical rotation angle, and a PD is used to convert optical signals into electrical signals. The final output Vout of the device is as follows:
V out   = η I 0 α e OD ( v ) θ ,
where η is the PD’s conversion coefficient, I0 is the incident probe light intensity, α is the modulation angle of PEM, and OD is the optical depth.
Figure 1 shows that when light is probed along the x direction, the output voltage Vx is proportional to Px, Vz is proportional to Pz, and the output signal records the oscillation and steady-state processes of Px and Pz according to Equations (9), (10), and (12); through the oscillation process, we can obtain the slow-down factor q(P) from the oscillation frequency ωof = ωy/q(P). Figure 2 shows the trajectory of atomic spin polarization with time inside the cell. The oscillation frequency of the output signal Pz can be used to obtain q(P) while probing light along the z direction. Table 1 shows that the value of the initial spin polarization P is calculated from the relationship between q(P) and P. We measure the spatial distribution of the spin polarization using the DMD to scan the x and z direction probe light to obtain the atomic polarization distribution in the longitudinal direction (yz- plane) and the transverse direction (xy plane) of the device, respectively.

3. Experimental Setup

The experimental measurement setup shown in Figure 2 is a dual-beam Rb atomic magnetometer in the SERF regime. The key component of the magnetometer was an aluminosilicate glass (GE180) 2.5-cm-length cubic vapor cell containing 50 Torr quenching gas N2 and 340 Torr buffer gas 4He in a liquid nitrogen environment and Rb alkali metals in natural abundance. The cell was placed in a boron nitride ceramic oven in the center of the device. The cell was heated with a nonmagnetic twisted heating wire with 75 kHz AC and real-time temperature monitoring using platinum resistors. The magnetometer had a vacuum inside it to maintain temperature stability, and the vacuum assembly was made of polyether ether ketone material. Laser absorption spectroscopy was used to determine atomic density at high temperatures, which was then calculated using Raoul’s law and the saturation vapor density equation. The magnetic shielding system was made up of five layers of stacked cylindrical high-permeability µ-metals [35]. A three-axis compensation coil was configured to further ensure an extremely weak magnetic environment. The magnetic coils were driven by two high-precision function generators (33500 B Keysight, the USA). This ensured that the atoms were in a SERF state.
The alkali atom was polarized by the distributed Bragg reflector (DBR) diode-pump-laser along the z axis. The pump light was 2.5 cm circularly polarized after a lens beam expansion system and a quarter-wave plate, and its wavelength tuned to the D1 resonance line of Rb. A noise eater (Thorlabs, NEM03L) was used to stabilize a laser power of 13.5 mW. The pumped light was modulated using a chopper. The probe light was generated by another DBR diode laser with a wavelength detuned by 1 nm over the D2 resonance line of Rb. The linearly polarized light of 2 cm after PBS was divided into two probe beams. One beam was used to detect the transverse polarization component Px along the x axis, as shown in part A of Figure 2, and the other beam was used to detect the longitudinal polarization component Pz along the z axis after beam splitter, as shown in part B. Only probe light passed through the filter at the barrel’s z axis exit. DMD (Texas Instruments V-9501) with a pixel size of 10.8 × 10.8 µm2 was used in our experiment to obtain the spatial distribution of polarization with high spatial resolution. The grayscale image loaded onto the DMD was used to control the probe light reflected onto the DMD. In the grayscale image, a pixel gray value of 0 indicated the on-state, whereas 256 indicated the off state. Only the probe light in the on-state could pass through the cell to detect the response signal in the spatial position. The probe light beam was divided into several units by DMD, each of which contained 232 pixels with an area of 0.25 × 0.25 cm2, with a detected optical power of 3 mW per unit. Experiments were conducted to measure the spatial distribution of longitudinal and transverse polarization in 7 × 7 units. The DMD and the cubic cell were precisely positioned to correlate to ensure a clear measurement position [24]. To reduce the measurement error, the two probe beams passed through the same PEM (Model-100, Hinds Instruments) and PD (Thorlabs, PDA36A2) after passing through the semitransparent and semi-reflective beam splitter. The output signal was transmitted to a phase-locked amplifier ZI (Zurich Instruments HF2LI) for demodulation.
In the experiment, there were two processes of pumping light on and off when a chopper was used to modulate the pumping light. The process of pumping light on required the consideration of both the optical pumping rate Rop, the atomic relaxation rate Rtot, and the pumping light off state Rop = 0. We simulated the aforementioned two processes under different By magnetic fields with time based on the solution of Equation (6) in continuous pump light. The experimental temperature was 150 °C. The atomic density n = 8.91 × 1013 cm−3 and the pumping rate Rop = 95.66 s−1 at the center of the vapor cell. Figure 3a shows the simulation of the pumped light on-state, and Figure 3b shows the simulation of the pumped light off state. Oscillatory processes of spin polarization increased as the By magnetic field increased. The oscillatory process of the polarization was more pronounced in the pumped light off state and was more beneficial for fitting and measuring our data. We also observed the polarization decay time during the pumping light off period to determine the frequency of chopper modulation of pump light. The atoms must be fully depolarized within the modulation period to ensure measurement accuracy. The spin polarization decay times to zero (~10−6) were 0.542, 0.52, 0.497, and 0.47 s when By was 1 nT, 4 nT, 7 nT, and 10 nT, respectively. This shows that the oscillatory process intensifies, as well as the decay process, when By increases. In addition, considering the requirement for fast measurements, the pump laser beam was modulated by a chopper with a duty cycle of 50% at a rate of 0.8 Hz.
The SERF magnetometer polarizability spatial distribution measurement procedure was as follows: First, the compensation coils compensated for the residual magnetic field after demagnetization, such that the residual magnetic field in the magnetometer was approximately zero. y axis coils generated a magnetic field By and turned on the chopper. The first gray image on the DMDs was loaded and selected the first measurement positions. The part A probe light path in Figure 2 was turned on, and the part B probe light path was turned off to measure the spatial polarization distribution of the yz plane through the Px signal response. The part B probe light path was turned on, and the part A probe light path was turned off to measure spatial polarization distribution of the xy plane through the Pz signal response. Signal response data were acquired using LabVIEW and stored in an NI (PXIe-1092PXIe, National Instruments) system. The periodic signal was extracted and fitted to Equation (10), and qxy(P) and qyz(P) were calculated from the fitting results. Therefore, Pyz and Pxy could be calculated according to Table 1. The grayscale image at the next spatial location was replaced to measure the next point of polarization, resulting in a two-plane 7 × 7 polarization spatial distribution measurement.

4. Results and Discussion

4.1. Polarization Measurements Based on Pump Light Modulation

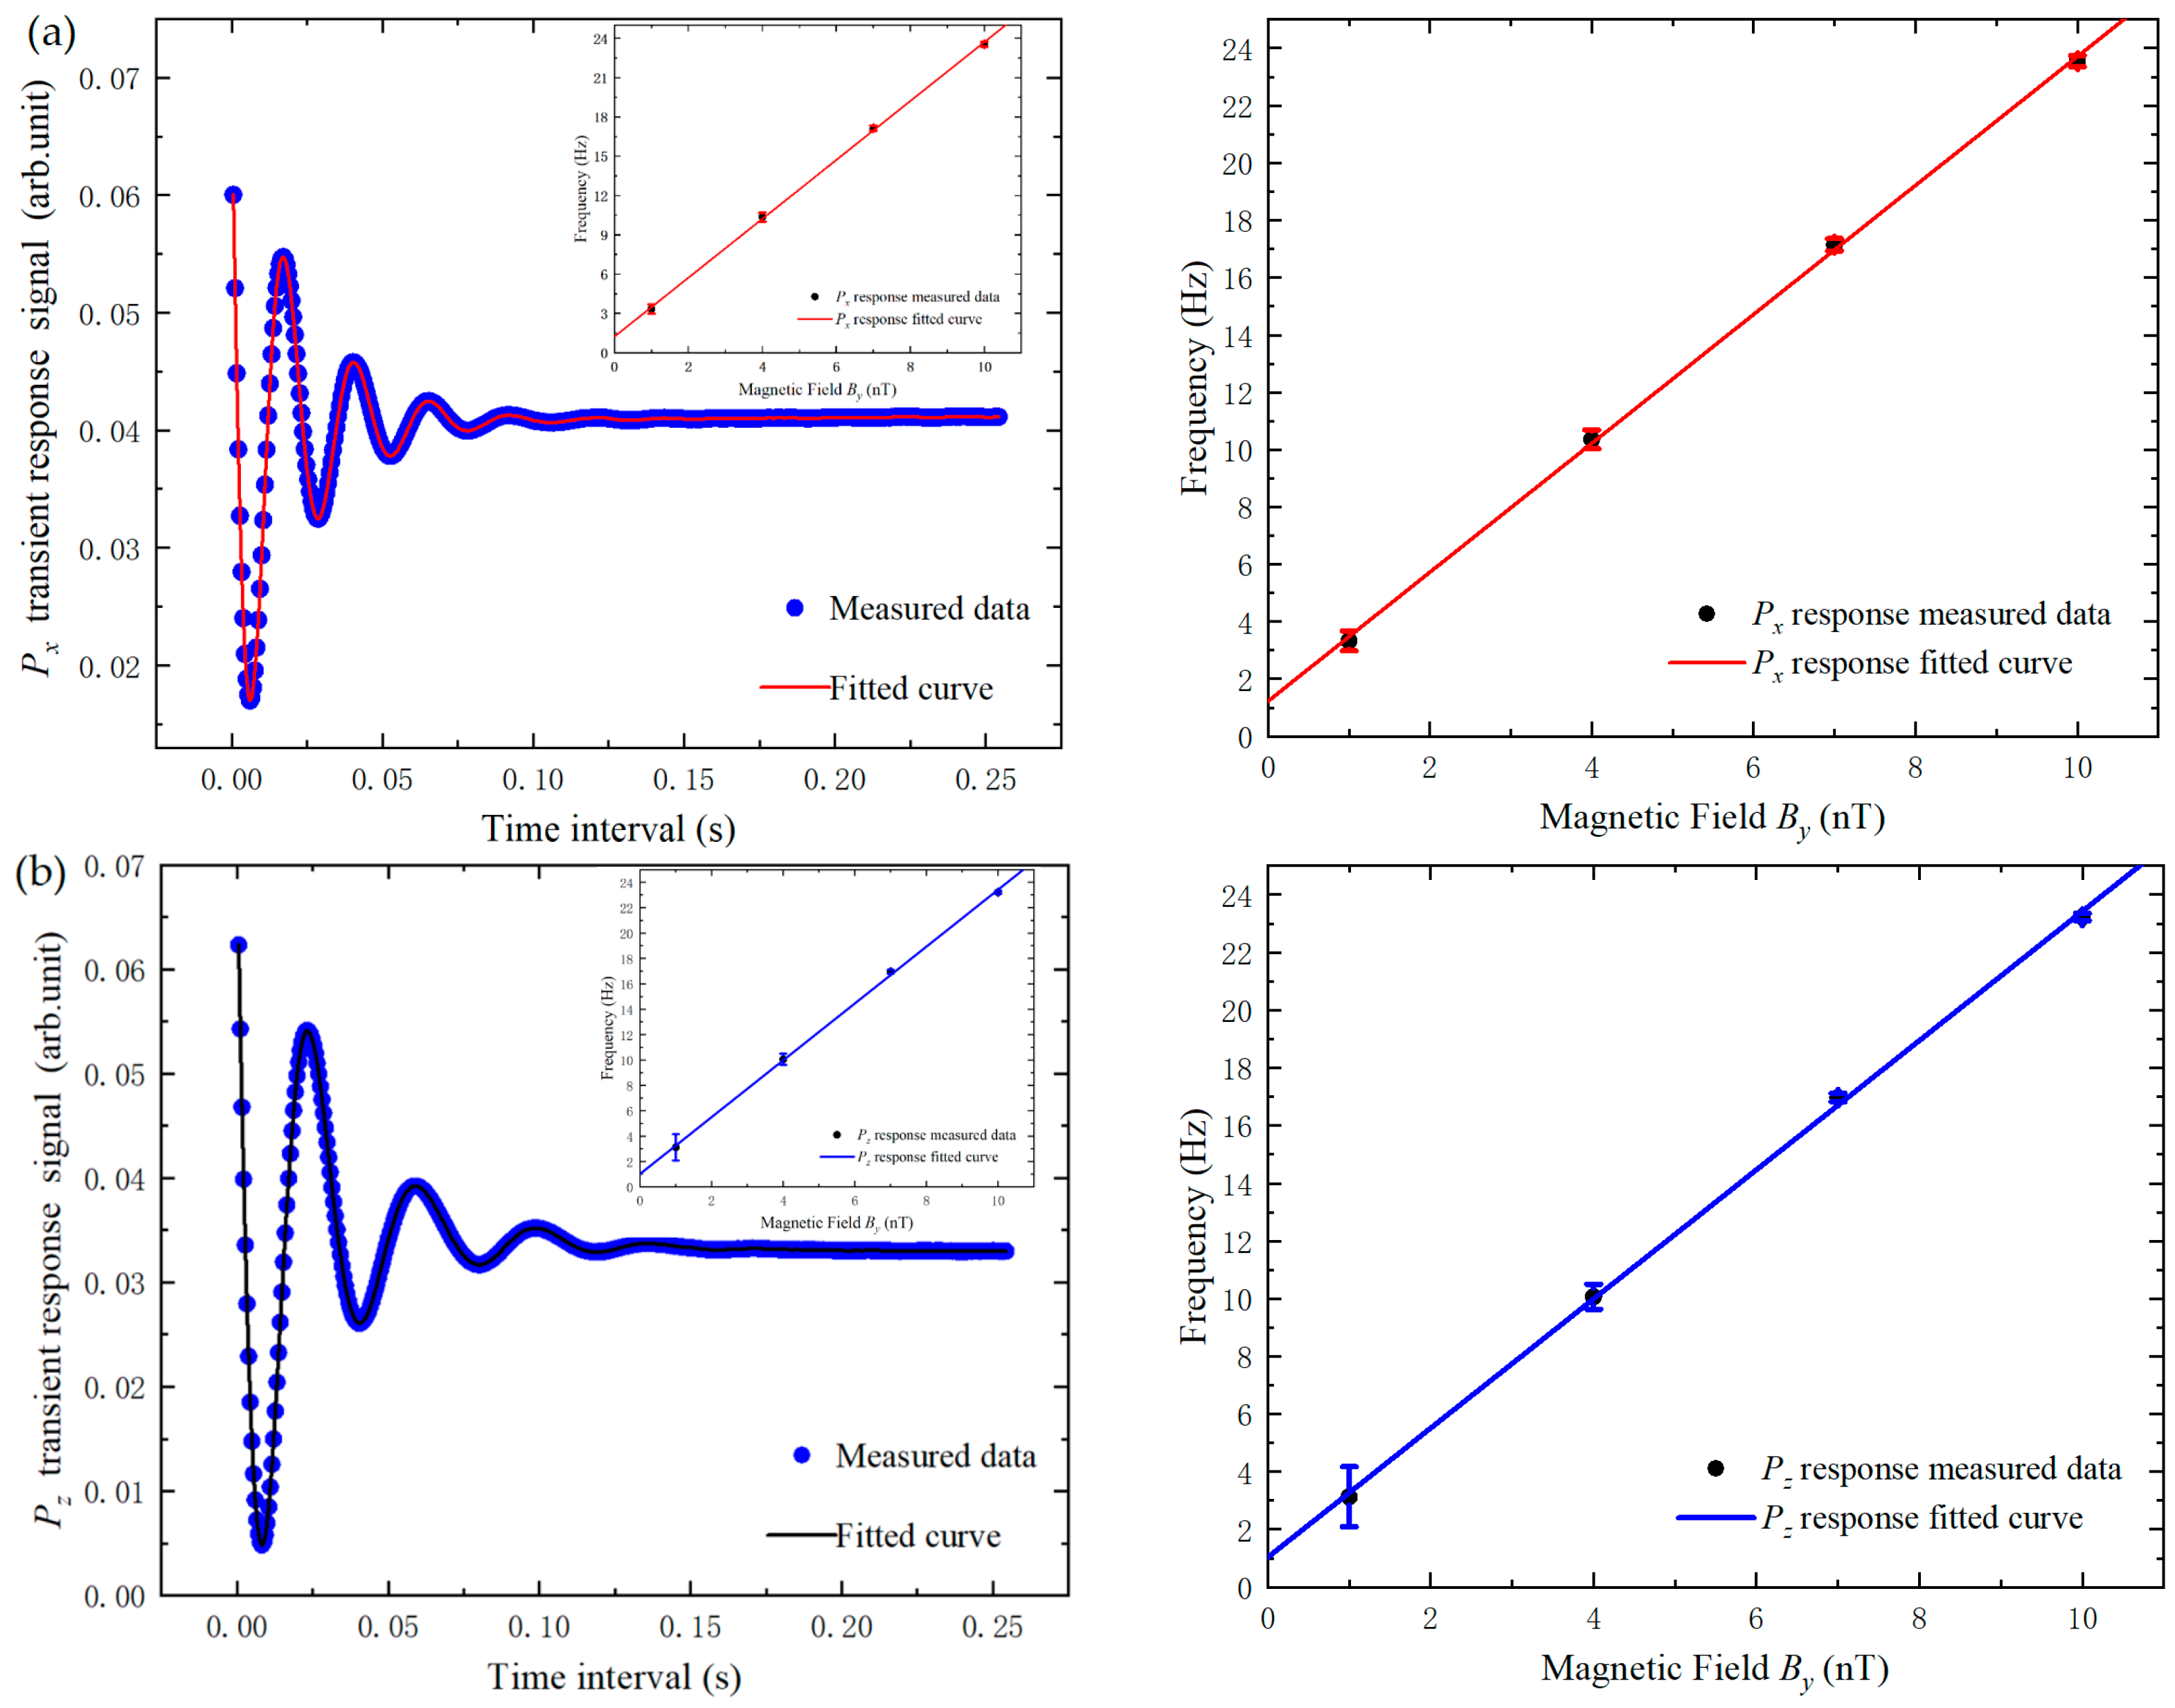
To investigate the practicability of the proposed method, the central point was used to measure the polarization by the pump light modulation on the transient response. Table 2 describes the experimental conditions. Figure 4a,b show the experimental measurement data using path A (Px transient response) and path B (Pz transient response) at By = 7 nT. The transient response signal of the magnetometer was fitted with oscillation attenuation in one cycle using Equation (10). The experimental values fit well with the theoretical equations, with an R-square value of 0.9997 for two fitting curves, indicating that the method based on the transient response of the magnetometer was feasible. Table 3 and Table 4 show the oscillation frequency ωof measured under different By. Then, we calculated the slow-down factor q(P) and precession frequency ω from By and ωof. The inset of Figure 4a,b shows the linear relationship between ω and By. The linear fit intercept is the residual magnetic field inside the magnetometer. The residual magnetic field Bres was 1.27 nT according to the fitting results, which included the residual magnetic field after the demagnetization of the magnetic shield caused by light shifts [36].
The experimental data under different By in Table 3 and Table 4 were compared. The polarization obtained using the Pz response was smaller than those obtained from the Px response. This was because the probe beam measured the average of the polarization rates in the path it goes through. The polarization distribution was proportional to the light intensity distribution in the cell. The Rop in the cell was different. When the probe light was perpendicular to the pump light (path A), its path was only affected by the integral of the laser Gaussian light field. When the probe light was parallel to the pump light (path B), the probe path was affected by the integration of the light field formed by the large OD. In our experiment, because the OD had a greater impact on the path integral of polarization, the polarization measured by the Pz response decreased. At low frequencies, the phase-locked capability caused error bars to increase as By decreased. In addition, the depolarization caused by the window plate and the cell and the pumping effect of the probe light on the atoms resulted in measurement errors.

4.2. Polarization Spatial Distribution Measurement

Inhomogeneity in the polarization distribution within the SERF magnetometer is caused by the inhomogeneous light field distribution within the cell, as described in the previous section [37]. The high density of alkali vapor absorbs the circularly polarized light as it passes through the cell, causing an attenuation of the light intensity in the longitudinal plane (yz plane). According to the Lambert–Beer absorption law, the pumping rate is related to the distance in the z direction by the following equation [17]:
R o p ( z ) = R r e l W R p R r e l exp n σ ( v ) z + R p R r e l ,
where σ(v) is the absorption cross-section as a function of the laser frequency, n is the density of the alkali atoms vapor, z is the pump light’s propagated distance in the cell, and the initial pumping rate Rp is proportional to the pump light intensity Ipump.
For the transverse plane (xy plane), the optical field inhomogeneity was mainly caused by the laser’s Gaussian light intensity distribution. The pumping rate was related to the distance in the x and y directions by the following equation:
R o p ( x , y ) = R p e 2 x 2 + y 2 r 2 ,
where r is the pump light beam radius. The atoms had sufficient collision mixing in the SERF state, and the initial electron spin polarization P0 can be written as follows:
P 0 = R o p R o p + R rel .
When only the By magnetic field exists, the steady-state solution of Equation (6) is as follows:
P z = P 0 1 + γ e B y R o p + R r e l 2 .
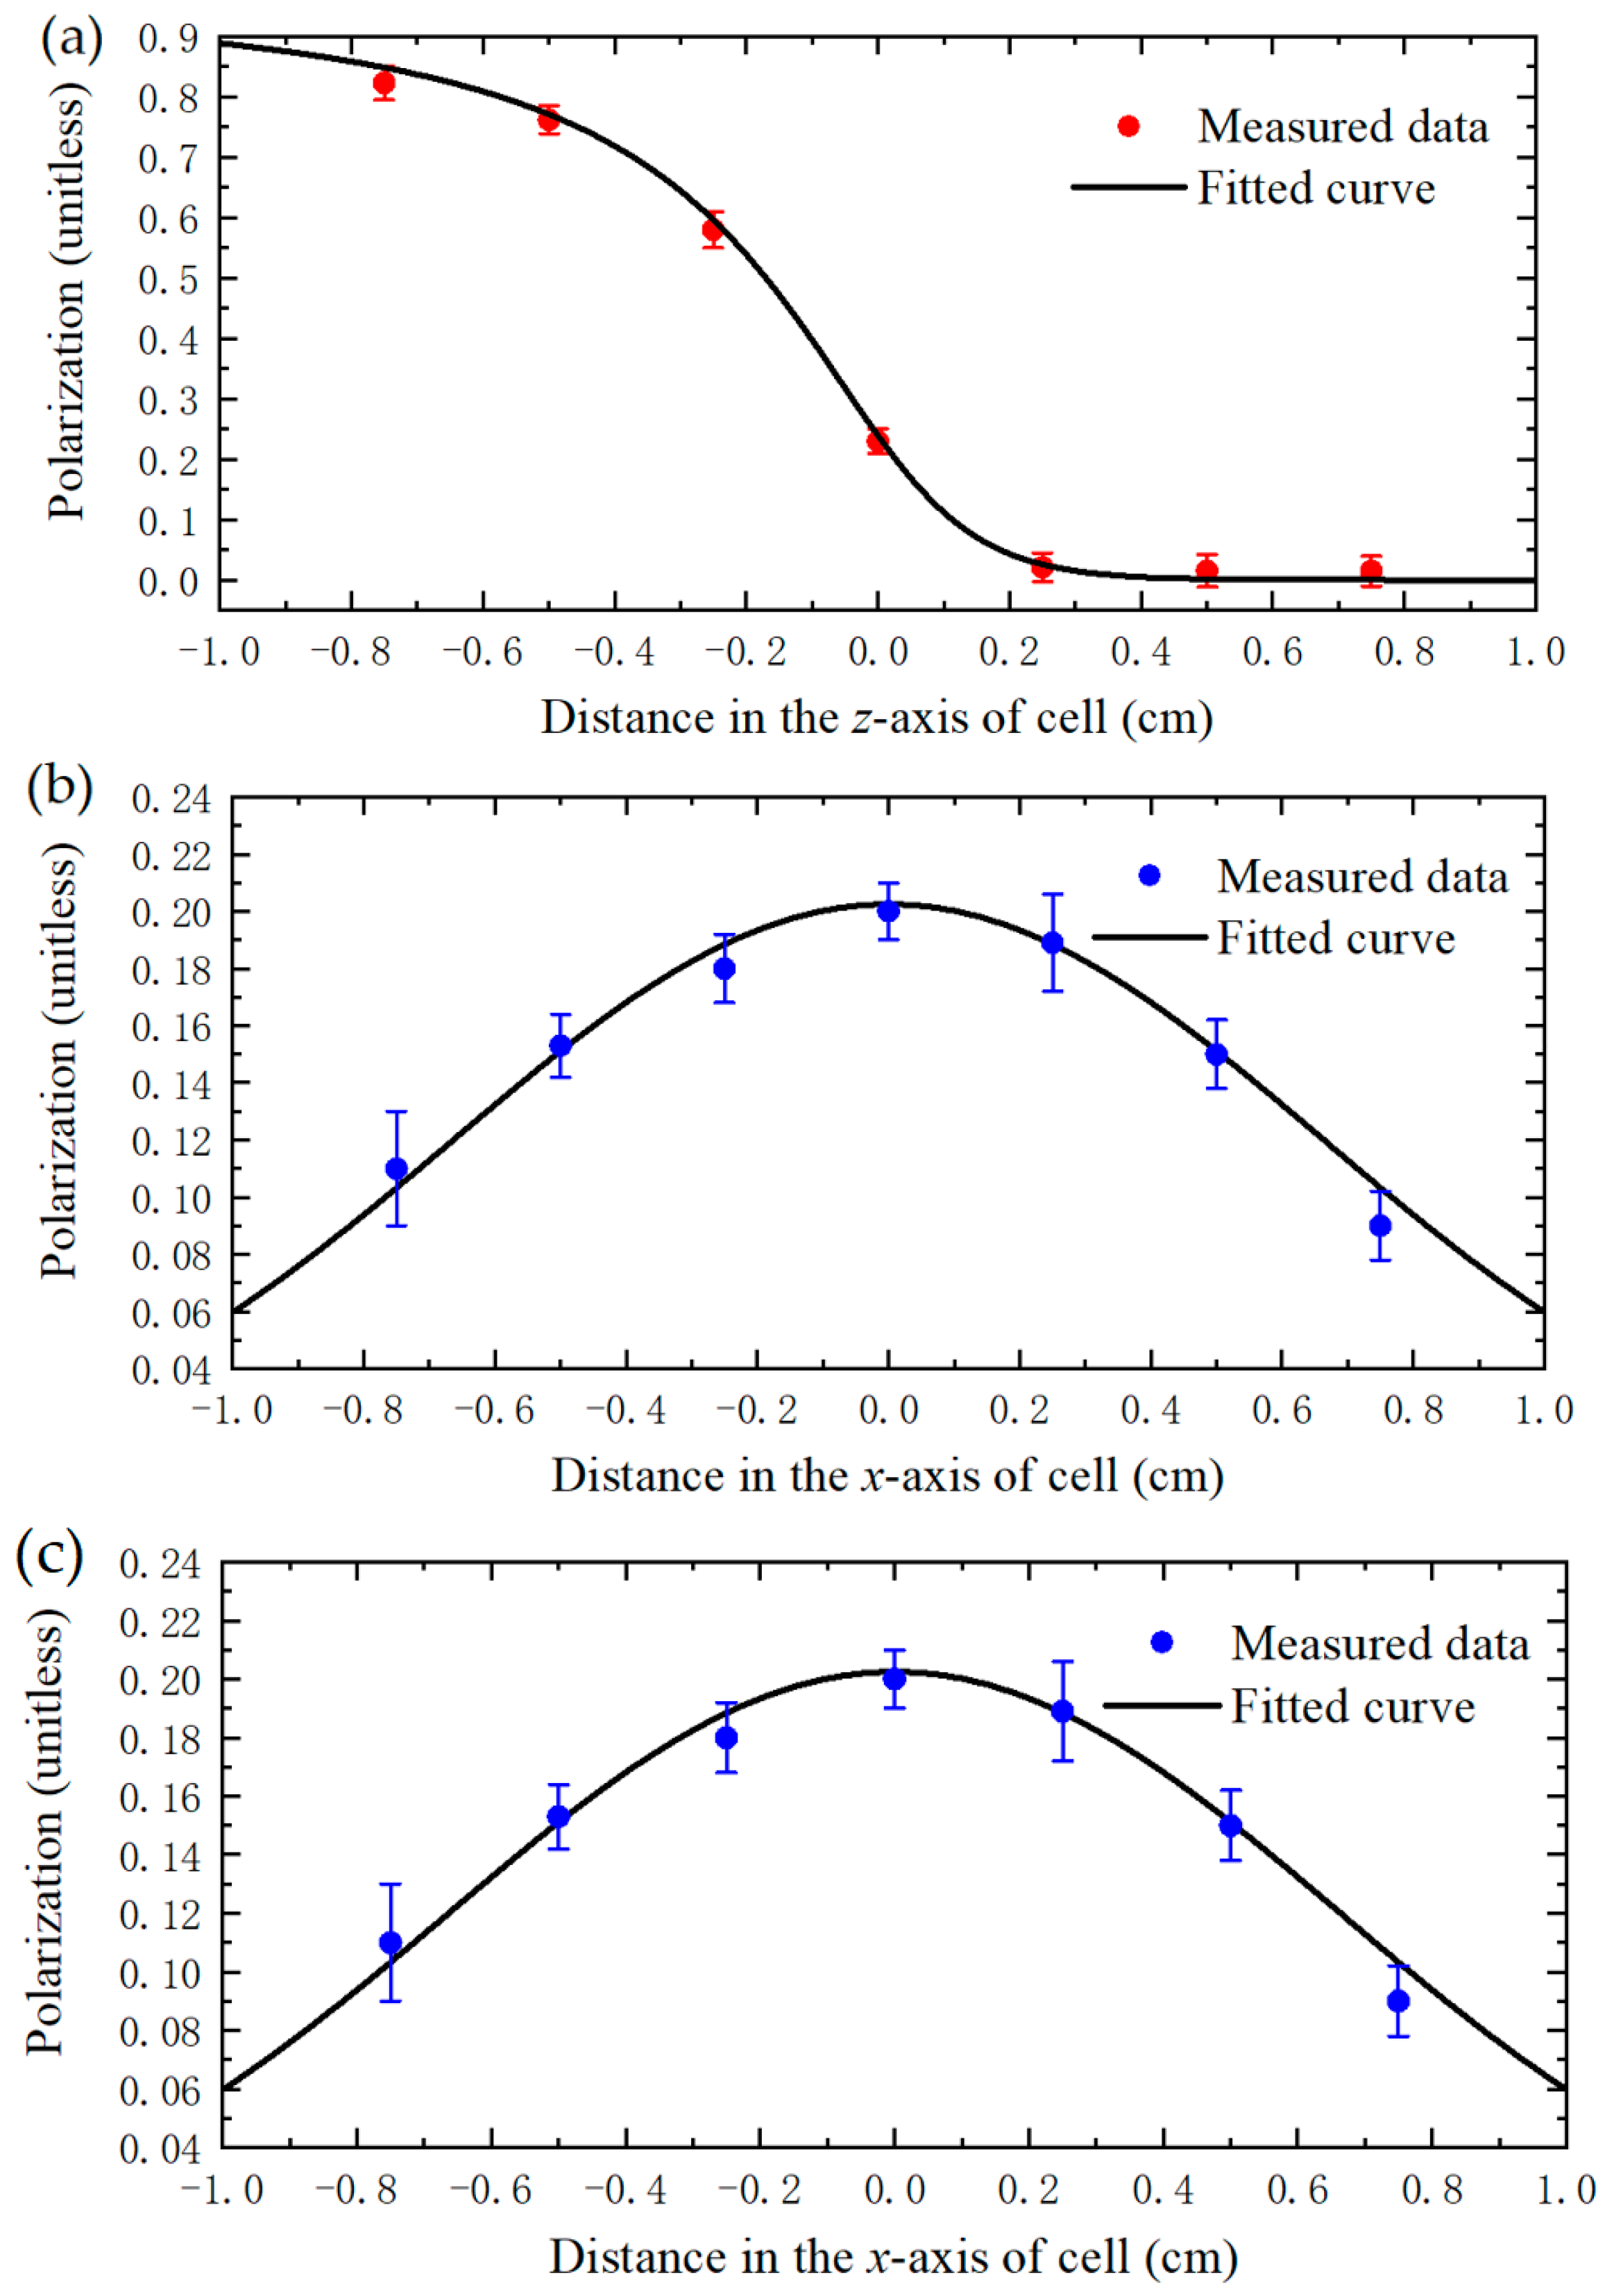
Figure 5 shows the spin polarization distribution in the z axis of the pump light propagation direction and the x and y axes of the pump light cross-section direction, which is fitted by Equations (16)–(18). Figure 5a is measured from the transient response of the magnetometer obtained using the experimental device optical A path, and Figure 5b,c are measured using the optical B path. The origin corresponds to the center of the cell. DMD is used for distribution measurement with a distance of 0.25 cm between each measuring point. The distribution measurement method can accurately locate the measurement position. In our measurement range of −0.75 to 0.75 cm, the polarization decreased by 98.18% due to the light intensity attenuation caused by alkali metal absorption and by 53.36% due to the Gaussian light intensity distribution. Although light intensity absorption is the primary cause of polarization inhomogeneity, Gaussian light causes transverse polarization inhomogeneity, which affects the sensitivity of magnetometer triaxial measurements and the application of biomagnetic detection.
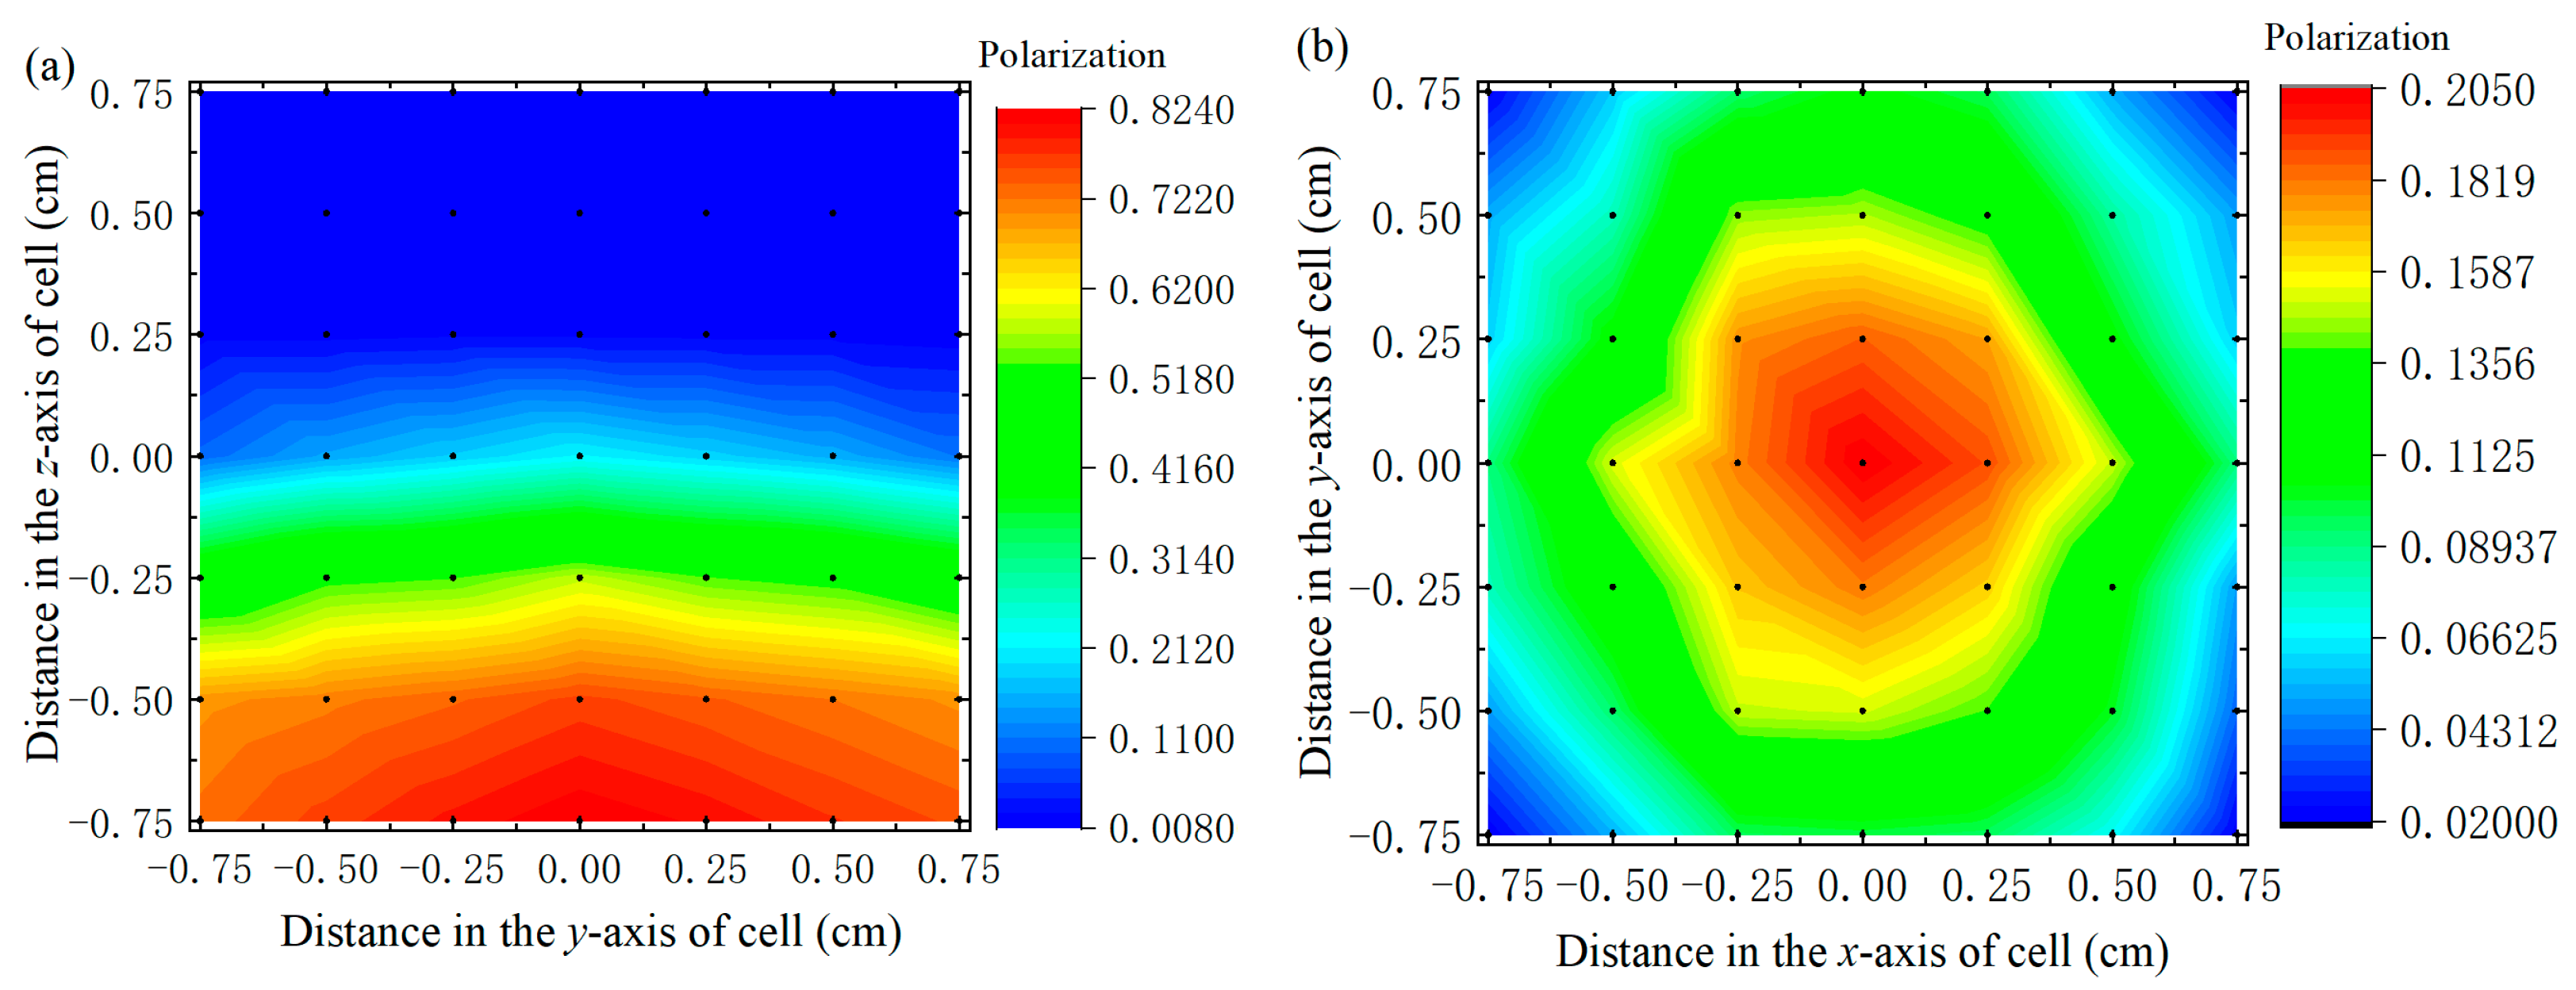
Figure 6 shows the measurement results of the spatial polarizability distribution of xy and yz planes with a spatial resolution of 0.25 cm using the experimental process shown in Figure 4. We measured 7 × 7 space points on each side, and each space point was measured three times. Table 2 shows the experimental conditions. We use δ to represent the measured polarization inhomogeneity, which can be described as follows:
δ = ( P P ¯ ) P ¯ 2 / ( m 1 ) ,
where m is the number of measurement points. Within our measurement range of 0.75 cm2 × 0.75 cm2, the nonuniformity of the xy plane is δ = 1.04, and that of the yz plane is δ = 1.82. The Gaussian light field also affects the nonuniformity of the yz plane. The measurement results of spatial distribution were affected by the interatomic diffusion effect, which could be further suppressed by increasing the pressure in the vapor cell. Based on the proposed method for measuring the spatial distribution of transverse and longitudinal polarization, the polarization inhomogeneity in the yz plane could be further suppressed by a hybrid optical pumping technique [38], and the polarization inhomogeneity in the xy plane can be further reduced by beam shaping technology [39] to further improve the sensitivity of the SERF magnetometer and the application performance of the SERF magnetometer.

5. Conclusions

In this study, we proposed a novel method for measuring both the transverse and longitudinal plane spatial distributions of alkali metal polarization for a SERF magnetometer using the transient response of the magnetometer after modulating the pumped light using a chopper at 1.6 Hz. The dynamics equation and working principle were demonstrated. The main conclusions that could be drawn were:
  • By using the Px and Pz transient responses, the slowing factor q(P) at the center point of the cell at different By magnetic fields was obtained, and the polarization was calculated based on the fast spin-exchange interaction effect.
  • The device’s residual magnetic field Bres was obtained from the linear relationship of precession frequency ωpr and By.
  • Measuring the one-dimensional polarization distribution of the x, y, and z axes with 0.1 cm resolution. The measurement results were consistent with the Lambert–Beer absorption law and the Gaussian distribution law.
  • Two-dimensional spatial distribution measurements of the polarization of the xy and yz planes with a measurement range of 0.75 cm2 × 0.75 cm2. The nonuniformity of the xy plane was 1.04, and that of the yz plane was 1.82.
Based on the results of the proposed measurement method of spin polarization spatial distribution, further compensation can improve the application consistency of multi-channel magnetic field measurements and improve the sensitivity of single-channel differential measurements. Compared with existing methods for measuring polarization distribution, this method has the following advantages:
  • It can measure three-axis spatial distribution spin polarization in the SERF region.
  • It is independent of the OD and does not require a large background or RF field for applications suitable for both low and high polarization.
  • It uses a square cell to avoid measurement errors caused by optical aberrations due to the circular cell’s curvature.
  • DMD distribution measurements provide high spatial resolution and are accurate in their positioning.
Our proposed measurement method applies equally to NMR magnetometers, all-optical atomic magnetometers, and comagnetometers.

Author Contributions

Conceptualization, X.F. and J.L.; methodology, K.W.; validation, X.F., Y.M., W.F. and J.L.; formal analysis, X.F.; investigation, X.F. and J.L.; data curation, X.F.; writing—original draft preparation, X.F.; writing—review and editing, Y.M. and W.F.; project administration, W.Q., Y.Z. and Z.X.; funding acquisition, W.Q. and W.F. All authors have read and agreed to the published version of the manuscript.

Funding

This work was supported by the National Science Fund for Distinguished Young Scholars, 61925301, and the National Natural Science Foundation of China under Grant No. 61903013, No. 62103026, and No. 61975005.

Institutional Review Board Statement

Not applicable.

Informed Consent Statement

Not applicable.

Data Availability Statement

The data presented in this study are available on reasonable request from the corresponding author.

Conflicts of Interest

The authors declare no conflict of interest.

References

  1. Romalis, M.V. Hybrid optical pumping of optically dense alkali-metal vapor without quenching gas. Phys. Rev. Lett. 2010, 105, 243001. [Google Scholar] [CrossRef]
  2. Lu, J.X.; Zhang, S.W.; Zhou, Y.; Yan, Y.G.; Lu, F.; Wang, K.; Zhai, Y.Y.; Ye, M. Optimal buffer gas pressure in dual-beam spin-exchange relaxation-free magnetometers. Sens. Actuator A Phys. 2022, 347, 113928. [Google Scholar] [CrossRef]
  3. Lu, F.; Lu, J.X.; Li, B.; Yan, Y.G.; Zhang, S.W.; Yin, K.F.; Ye, M.; Han, B.C. Triaxial Vector Operation in Near-Zero Field of Atomic Magnetometer with Femtotesla Sensitivity. IEEE Trans. Instrum. Meas. 2022, 71, 1501210. [Google Scholar] [CrossRef]
  4. Wei, K.; Zhao, T.; Fang, X.J.; Xu, Z.T.; Zhai, Y.Y.; Quan, W. Accurate Polarimetry of Hybrid K-Rb and 21Ne Atoms Based on Spin-Exchange Interactions. IEEE Sens. J. 2021, 21, 5879. [Google Scholar] [CrossRef]
  5. Xu, Z.T.; Wei, K.; Zhao, T.; Cao, Q.; Liu, Y.; Hu, D.; Zhai, Y.Y. Fast Dynamic Frequency Response-Based Multiparameter Measurement in Spin-Exchange Relaxation-Free Comagnetometers. IEEE Trans. Instrum. Meas. 2021, 70, 7007. [Google Scholar] [CrossRef]
  6. Gill, P. Precision measurements: Optical clocks coming of age. Nature 2000, 407, 6804. [Google Scholar] [CrossRef]
  7. Jiménez-Martínez, R.; Kennedy, D.J.; Rosenbluh, M.; Donley, E.A.; Knappe, S.; Seltzer, S.J.; Ring, H.L.; Bajaj, V.S.; Kitching, J. Optical hyperpolarization and NMR detection of 129Xe on a microfluidic chip. Nat. Commun. 2014, 5, 3908. [Google Scholar] [CrossRef] [PubMed] [Green Version]
  8. Yao, K.W.; Liu, M.; Zheng, Z.Y.; Shih, T.; Xie, J.Y.; Sun, H.J.; Chen, Z. Automatic Shimming Method Using Compensation of Magnetic Susceptibilities and Adaptive Simplex for Low-Field NMR. IEEE Trans. Instrum. Meas. 2021, 70, 6007012. [Google Scholar] [CrossRef]
  9. Sherson, J.; Krauter, H.; Olsson, R.K.; Julsgaard, B.; Polzik, E.S. Quantum memory and teleportation using macroscopic gas samples. Phys. B At. Mol. Opt. Phys. 2008, 41, 223001. [Google Scholar] [CrossRef]
  10. Vasilakis, G.; Shen, H.; Jensen, K.; Balabas, M.; Salart, D.; Chen, B.; Polzik, E.S. Generation of a squeezed state of an oscillator by stroboscopic back-action-evading measurement. Nat. Phys. 2015, 11, 389. [Google Scholar] [CrossRef] [Green Version]
  11. Dang, H.B.; Maloof, A.C.; Romalis, M.V. Ultra-high sensitivity magnetic field and magnetization measurements with an atomic magnetometer. Appl. Phys. Lett. 2010, 97, 15. [Google Scholar] [CrossRef] [Green Version]
  12. Sheng, J.; Wan, S.G.; Sun, Y.F.; Dou, R.S.; Guo, Y.H.; Wei, K.Q.; He, K.Y.; Qin, J.; Gao, J.H. Magnetoencephalography with a Cs-based highsensitivity compact atomic magnetometer. Rev. Sci. Instrum. 2017, 88, 9. [Google Scholar] [CrossRef] [PubMed]
  13. Boto, E.; Holmes, N.; Leggett, J.; Roberts, G.; Shah, V.; Meyer, S.S.; Munoz, L.D.; Mullinger, K.J.; Tierney, T.M.; Bestmann, S.; et al. Moving magnetoencephalography towards real-world applications with a wearable system. Nature 2018, 555, 7698. [Google Scholar] [CrossRef] [PubMed] [Green Version]
  14. Zhang, J.; Liu, K.N.; Zhang, J.F.; Wang, Z.J.; Shang, J.T. Magnetocardiography Measurements by Microfabricated Atomic Magnetometer with a 3-D Spherical Alkali Vapor Cell. IEEE Trans. Instrum. Meas. 2021, 70, 4007907. [Google Scholar] [CrossRef]
  15. Li, Z.; Wakai, R.T.; Walker, T.G. Parametric modulation of an atomic magnetometer. Appl. Phys. Lett. 2006, 89, 13. [Google Scholar] [CrossRef] [Green Version]
  16. Baranga, B.A.; Appelt, S.; Erickson, C.J.; Young, A.R.; Happer, W. Alkali-metal-atom polarization imaging in high-pressure optical-pumping cells. Phys. Rev. A 1998, 58, 3. [Google Scholar] [CrossRef] [Green Version]
  17. Seltzer, S.J. Developments in Alkali-Metal Atomic Magnetometry. Ph.D. Thesis, Princeton University, Princeton, NJ, USA, 2008. [Google Scholar]
  18. Gillen-Christandl, K.; Gillen, G.D.; Piotrowica, M.J.; Saffman, M. Comparison of Gaussian and super Gaussian laser beams for addressing atomic qubits. Appl. Phys. B 2016, 122, 131. [Google Scholar] [CrossRef] [Green Version]
  19. Appelt, S.; Unlu, T.; Zilles, K.; Shah, N.J.; Baer, S.; Halling, H. Experimental studies of rubidium absolute polarization at high temperatures. Appl. Phys. Lett. 1999, 75, 3. [Google Scholar] [CrossRef] [Green Version]
  20. Young, A.R.; Appelt, S.; Baranga, A.B.; Erickson, C.; Happer, W. Three-dimensional imaging of spin polarization of alkali-metal vapor in optical pumping cells. Appl. Phys. Lett. 1997, 70, 23. [Google Scholar] [CrossRef]
  21. Lancor, B.; Babcock, E.; Wyllie, R.; Walker, T.G. Circular dichroism of RbHe and RbN2 molecules. Phys. Rev. A 2010, 82, 43435. [Google Scholar] [CrossRef] [Green Version]
  22. Gusarov, A.; Levron, D.; Baranga, A.B.A.; Paperno, E.; Shuker, R. An all-optical scalar and vector spin-exchange relaxation-free magnetometer employing on-off pump modulation. J. Appl. Phys. 2011, 109, 130801. [Google Scholar] [CrossRef] [Green Version]
  23. Li, R.J.; Quan, W.; Fang, J.C. Polarization measurement of Cs using the pump laser beam. IEEE Photon. J. 2017, 9, 1. [Google Scholar] [CrossRef]
  24. Fang, X.J.; Wei, K.; Zhao, T.; Zhai, Y.Y.; Ma, D.Y.; Xing, B.Z.; Xiao, Z.X. High spatial resolution multichannel optically pumped atomic magnetometer based on spatial light modulator. Opt. Express 2020, 28, 26447–26460. [Google Scholar] [CrossRef] [PubMed]
  25. Zhao, J.P.; Ding, M.; Lu, J.X.; Yang, K.; Ma, D.Y.; Yao, H.; Liu, G. Determination of Spin Polarization in Spin-Exchange Relaxation-Free Atomic Magnetometer Using Transient Response. IEEE Trans. Instrum. Meas. 2022, 69, 845. [Google Scholar] [CrossRef]
  26. Kim, K.; Begus, S.; Xia, H.; Lee, S.K.; Jazbinsek, V.; Trontelj, Z.; Romalis, M.V. Multi-channel atomic magnetometer for magnetoencephalography: A configuration study. Neuroimage 2014, 89, 143. [Google Scholar] [CrossRef]
  27. Ito, Y.; Sato, D.; Kamada, K.; Kobayashi, T. Measurements of Magnetic Field Distributions with an Optically Pumped K-Rb Hybrid Atomic Magnetometer. IEEE Trans. Magn. 2014, 50, 1. [Google Scholar] [CrossRef]
  28. Ressler, N.W.; Sands, R.H.; Stark, T.E. Measurement of Spin-Exchange Cross Sections for 133Cs, 87Rb, 85Rb, 39K, and 23Na. Phys. Rev. 1969, 84, 102. [Google Scholar] [CrossRef]
  29. Happer, W.; Tang, H. Spin-Exchange Shift and Narrowing of Magnetic Resonance Lines in Optically Pumped Alkali Vapors. Phys. Rev. Lett. 1973, 31, 273. [Google Scholar] [CrossRef]
  30. Savukov, I.M.; Romalis, M.V. Effects of spin-exchange collisions in a high-density alkali-metal vapor in low magnetic fields. Phys. Rev. A 2005, 71, 23405. [Google Scholar] [CrossRef] [Green Version]
  31. Happer, W.; Tam, A.C. Effect of rapid spin exchange on the magnetic-resonance spectrum of alkali vapors. Phys. Rev. A 1977, 16, 1877. [Google Scholar] [CrossRef]
  32. Anderson, L.W.; Pipkin, F.M.; Baird, J.C., Jr. Hyperfine Structure of Hydrogen, Deuterium, and Tritium. Phys. Rev. 1960, 121, 1864. [Google Scholar] [CrossRef]
  33. Huang, H.C.; Dong, H.F.; Hu, X.Y.; Chen, L.; Gao, Y. Three-axis atomic magnetometer based on spin precession modulation. Appl. Phys. Lett. 2015, 107, 182403. [Google Scholar] [CrossRef]
  34. Duan, L.H.; Fang, J.C.; Li, R.J.; Jiang, L.W.; Ding, M.; Wang, W. Light intensity stabilization based on the second harmonic of the photoelastic modulator detection in the atomic magnetometer. Opt. Express 2015, 23, 32481. [Google Scholar] [CrossRef]
  35. Ma, D.Y.; Lu, J.X.; Fang, X.J.; Yang, K.; Wang, K.; Zhang, N.; Han, B.C.; Ding, M. Parameter modeling analysis of a cylindrical ferrite magnetic shield to reduce magnetic noise. IEEE Trans. Ind. Electron. 2022, 69, 991. [Google Scholar] [CrossRef]
  36. Lu, J.X.; Quan, W.; Ding, M.; Qi, L.; Fang, J.C. Suppression of light shift for high-density alkali-metal atomic magnetometer. IEEE Sens. J. 2019, 19, 492. [Google Scholar] [CrossRef]
  37. Ledbetter, M.P.; Savukov, I.M.; Acosta, V.M.; Budker, D.; Romalis, M.V. Spin-exchange-relaxation-free magnetometry with Cs vapor. Phys. Rev. A 2008, 77, 33408. [Google Scholar] [CrossRef] [Green Version]
  38. Ito, Y.; Ohnishi, H.; Kamada, K.; Kobayashi, T. Sensitivity improvement of spin-exchange relaxation free atomic magnetometers by hybrid optical pumping of potassium and rubidium. IEEE Trans. Magn. 2011, 47, 3550. [Google Scholar] [CrossRef]
  39. Chen, X.; Fang, X.J.; Ma, D.; Liu, Y.; Cao, L.; Zhai, Y.Y. Optimization of beam shaping for ultrasensitive inertial measurement using a phase-only spatial light modulator. Appl. Opt. 2022, 61, C55. [Google Scholar] [CrossRef]
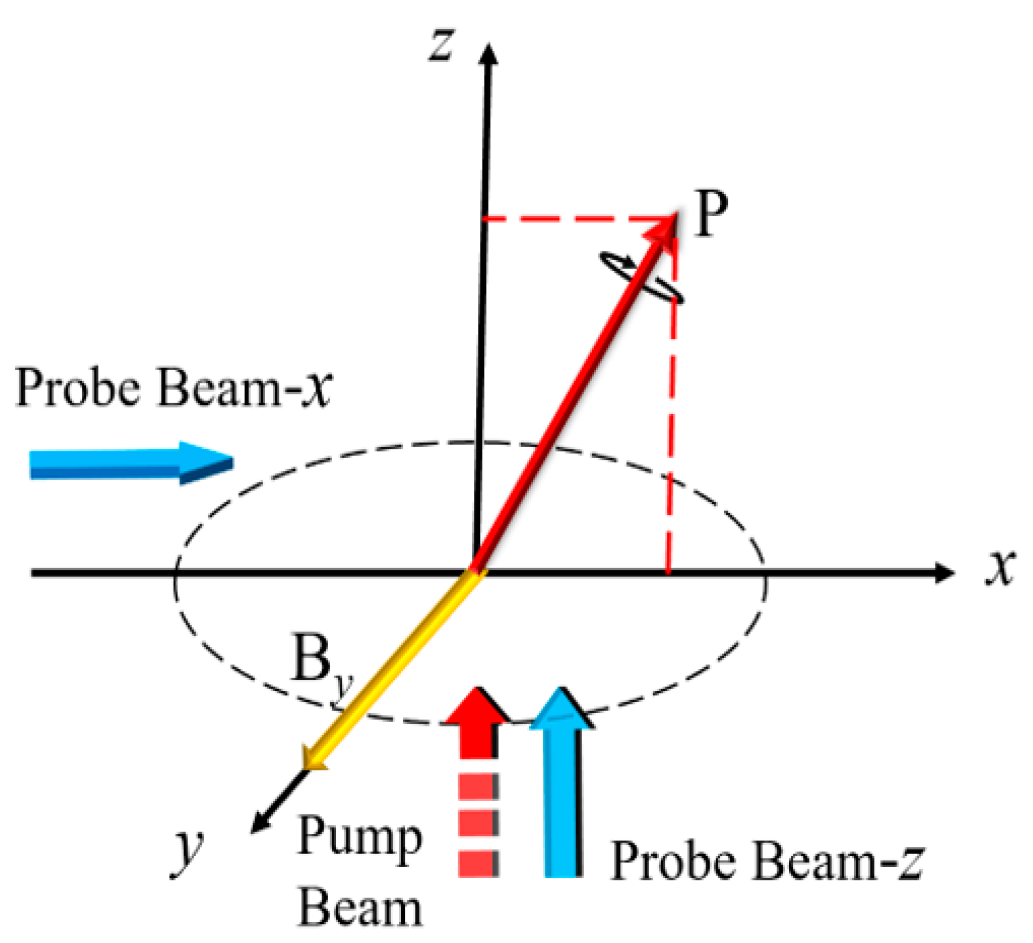
Figure 1. When the magnetic field is input along the y axis, the spin polarization of the atoms deviates from the pumping z axis and stabilizes at the angle between the z axis and the x axis; the x and z axis probe light undergoing an oscillation and decay process under the action of the pumping light modulation probes the x and z axis polarization responses, respectively.
Photonics 10 00332 g001
Figure 2. (a) Experimental diagram of the SERF magnetometer. NE: noise eater; PEM: photo elastic modulator; GT: Glan–Taylor polarizer; PD: photodetector. (b) Photographs of the five-layer magnetic shielding and nonmagnetic vacuum system. (c) Photographs of the nonmagnetic electric heating system and the square cell in the center.
Photonics 10 00332 g002
Figure 3. Simulation results of the magnetometer z axis polarization oscillation decay process at different magnetic fields By. (a) Pumping light in the on state. (b) Pumping light in the off state.
Photonics 10 00332 g003
Figure 4. Experimental measurement data of the magnetometer transient response at By = 7 nT. The dots are the measured data, and the solid line is the curve fitted to Equation (10). The inset measures the variation in ω with By, and the measurement results in a linear relationship between ω and By. The intercept is the residual magnetic field inside the magnetometer. (a) Probe light path A in Figure 2 (Px transient response). (b) Probe light path B in Figure 2 (Pz transient response). An expanded version of the inset is at the right of the image.
Photonics 10 00332 g004
Figure 5. Experimental measurement result of the spin polarization distribution in the z axis in the pump light propagation direction and in the x and y axes in the pump light cross-section direction. The measuring spatial resolution is 0.25 cm, with a measuring range of −0.75–0.75 cm. The error bars represent the expanded uncertainties of the results. The solid line is the fitted curve obtained by Equations (16)–(18). (ac) is the polarizability measured along the x-, y-, z- triaxial axis respectively.
Photonics 10 00332 g005
Figure 6. Experimental measurement result of spatial polarizability distribution of xy and yz planes with a spatial resolution of 0.25 cm. Each side measures 7 × 7 space points, and each space point is measured three times. (a) The measurement results of the spatial polarizability distribution of xy plane, (b) The measurement results of the spatial polarizability distribution of yz plane.
Photonics 10 00332 g006
Table 1. Nuclear spin Quantum Number and Slow-down Factor of Alkali Metal Atoms.
Alkali Metal AtomsNuclear Quantum Number INatural AbundanceSlow-Down Factor q(P)Range of Slow-Down Factor q(P = 0~1)
85Rb5/272.2%   38 + 52 P 2 + 6 P 4 3 + 10 P 2 + 3 P 4 38/3~6
87Rb3/227.8%   6 + 2 P 2 1 + P 2 6~4
39K3/293.3%   6 + 2 P 2 1 + P 2 6~4
41K3/26.7%   6 + 2 P 2 1 + P 2 6~4
133Cs7/2100%   22 + 70 P 2 + 34 P 4 + 2 P 6 1 + 7 P 2 + 7 P 4 + P 6 22~8
Table 2. Parameters of Measurement System.
ParameterValueUnit
Diameter of the cubic cell2.5cm
Coil constant of z axis114.03nT/V
Coil constant of y axis15.23nT/V
Coil constant of x axis15.24nT/V
Wavelength of the pump laser794.972nm
Wavelength of the probe laser779.242nm
Power of the pump laser23mW
Power of the probe laser (each point)15mW
Modulation frequency of PEM50kHz
Modulation amplitude of PEM0.08rad
Temperature150°C
Table 3. Px response measurement results under different magnetic fields.
Magnetic Fields By(nT)Precession Frequency
(Hz)
Slow-Down Factor q(P)Polarization
13.33 ± 0.358.42 ± 0.810.57 ± 0.11
410.35 ± 0.3310.82 ± 0.330.31 ± 0.04
717.14 ± 0.2111.43 ± 0.140.24 ± 0.01
1023.55 ± 0.2011.89 ± 0.100.18 ± 0.01
Table 4. Pz response measurement results under different magnetic fields.
Magnetic Fields By(nT)Precession Frequency
(Hz)
Slow-Down Factor q(P)Polarization
13.13 ± 0.418.94 ± 1.040.51 ± 0.13
410.07± 0.5211.12 ± 0.440.27 ± 0.05
716.97 ± 0.2211.55 ± 0.150.23 ± 0.02
1023.23 ± 0.2412.06 ± 0.120.16 ± 0.02
Disclaimer/Publisher’s Note: The statements, opinions and data contained in all publications are solely those of the individual author(s) and contributor(s) and not of MDPI and/or the editor(s). MDPI and/or the editor(s) disclaim responsibility for any injury to people or property resulting from any ideas, methods, instructions or products referred to in the content.