Article

Simulation and Design of a PIC-Based Heterodyne Optical Phase Locked Loop

1
School of Nano-Tech and Nano-Bionics, University of Science and Technology of China, Hefei 230026, China
2
Nano-Devices and Materials Division, Suzhou Institute of Nano-Tech and Nano-Bionics, Chinese Academy of Sciences, Suzhou 215123, China
3
Key Laboratory of Nanodevices and Applications, Suzhou Institute of Nano-Tech and Nano-Bionics, Chinese Academy of Sciences, Suzhou 215123, China
4
Division of Nanomaterials, Jiangxi Institute of Nanotechnology, Nanchang 330200, China
5
The School of Electronics and communication Engineering, Quanzhou University of Information Engineering, Quanzhou 362000, China
*
Author to whom correspondence should be addressed.
Photonics 2023, 10(3), 336; https://doi.org/10.3390/photonics10030336
Submission received: 16 February 2023 / Revised: 15 March 2023 / Accepted: 15 March 2023 / Published: 21 March 2023

Abstract

:
In this paper, we report on our simulation and design of a photonic integrated circuits (PIC)-based heterodyne optical phase-locked loop (OPLL). Our simulation reveals that the OPLL operation can be in one of three states, i.e., absolutely stable, metastable, and unstable states, depending on the relative position of the initial phase reversal point to the loop bandwidth. By systematically optimizing all of the loop parameters involved, the loop bandwidth of 247.8 MHz and the residual phase noise variance of 0.012 rad2 are theoretically obtained in such a PIC-OPLL system, which are better than any reported counterparts. In addition, the lowest required power of the master laser is also evaluated, assuming that the largest acceptable residual phase noise variance is 0.02 rad2, and it is found that the lowest master laser power is −54 dBm in our current OPLL system, and this value can be reduced to −56 dBm, providing that the summed linewidth is reduced to 10 kHz.

1. Introduction

The OPLL is an active phase-sensitive loop system, which uses electrical negative feedback control technology to establish a coherent link between the input optical signal (master laser, ML) and its current-controlled optical oscillator (slave laser, SL) [1]. Based on this specific characteristic, OPLLs can be utilized as a phase-sensitive filter or amplifier, and are widely used in coherent optical communications [2], coherent optical measurements [3], microwave photonics [4], and laser radar systems [5]. In accordance with its detection principle, OPLLs can be classified into heterodyne OPLLs and homodyne OPLLs. Compared with homodyne OPLLs, heterodyne OPLLs are more attractive in the above application fields, since they are able to identify the frequency offset of the optical signals and have the advantages of strong anti-interference and high-sensitivity detection also.
At present, two types of heterodyne OPLLs, including discrete space optics [6] and PIC optics [7,8], have been developed. Tremendous attention has been paid to PIC-based OPLLs, owing to their advantages of compact structure, short signal delay, convenient packaging, and low power consumption [9,10].
Over the last few decades, several PIC-based heterodyne OPLLs have been designed and demonstrated. Ristic et al designed an OPLL and revealed that the SL tuning sensitivity was proportional to the bandwidth of the feedback loop [11]. Satyan et al. demonstrated that the loop performances were affected by the loop delay and the SL’s frequency response [12]. Bałakier et al. theoretically analyzed the relationship between the loop delay and the laser linewidth, and experimentally demonstrated an InP-based heterodyne PIC-OPLL with phase noise of less than −100 dBc/Hz at 10 kHz offset from the carrier [13]. Overall, all of the OPLL literature has focused on the influence of the loop parameters, such as the loop bandwidth and loop delay on the phase-locking performance [14,15,16]. There is a lack of systematical optimizations of the loop parameters for the best loop performance. Meanwhile, the required lowest ML power is also one of the most important parameters for OPLL’s practical operations and applications, but this has been barely evaluated.
In this paper, a PIC-based heterodyne OPLL is systematically simulated and designed using a series of physics models based on the transfer function analysis method. Our simulation reveals that the OPLL operation can be in one of three states, i.e., absolutely stable, metastable, and unstable states, depending on the relative position of the initial phase reversal point to the loop bandwidth. Meanwhile, the optimization procedure of the OPLL system involved in all loop parameters is demonstrated, through which the PIC-OPLL with a loop bandwidth of 247.8 MHz and a residual phase noise variance of 0.012 rad2 is theoretically obtained. Such performances are better than any reported counterparts [17,18,19]. Furthermore, the required lowest ML power for the OPLL system still meets the noise specification, which is also evaluated. It is found that the lowest ML power of −54 dBm is required in our current OPLL system. However, it seems feasible to further reduce the power level to as low as −56 dBm, providing that the summed linewidth is reduced down to 10 kHz.

2. Models and Simulations

Our PIC-based heterodyne OPLL, which is mainly comprised of an optical path and its feedback electrical path for phase stabilization, is schematically shown in Figure 1. The optical path contains a distributed Bragg reflector (DBR) semiconductor laser, a 2 × 2 coupler, and a pair of PDs. The feedback electrical path contains a limiting amplifier (LIA), an analog mixer (MIX), and a first-order active proportional-integral loop filter.
Here, the DBR laser, which contains the front (rear) mirror section, gain section, and phase section, is used as the SL [20,21]. When this OPLL is operated, we first adjust the bias current of the front (rear) mirrors and gain section to ensure that the frequency offset between the ML and the SL is small enough, as well as to have the required output power. The PDs, which equally receive the optical signals from both the SL and the ML, then generate a beat signal and convert it into an electrical error signal. Then, the electric error signal, amplified by the LIA, and RF reference signal are mixed in the MIX, and the phase error signal is produced. Furthermore, the baseband phase error signal is generated after filtering out the high-frequency components of the phase error signal by the loop filter. Finally, such a baseband phase error signal is injected into the SL’s phase section to form a feedback loop. During the operation, such instantaneous baseband phase error signal continuously and finely adjusts the operation point of the phase section until the SL and the ML reach synchronization.
Based on the above-described loop operation process, Figure 2 shows the block diagram of our PIC-based heterodyne OPLL system, by which, a number of physical models can be established. Moreover, we assume that once the OPLL is locked, it can be linearly analyzed using approximation s i n   ( x ) x [22], so that all these models can be described by the transfer function analysis method.

2.1. Loop Frequency-Domain Model

The loop frequency-domain model, as a loop basic model, is used to numerically simulate the relationships between the loop characteristics and loop parameters.
From Figure 2, considering the loop delay e s τ L   and the residual phase ϕ e ( s ) = ϕ M L ( s ) ϕ S L ( s ) ϕ r ( s ) , we can obtain the following open-loop transfer function:
G O L ( s ) = ϕ S L ( s ) ϕ e ( s ) = k P D k L I A k m i x k L F k S L F L F ( s ) F S L ( s ) e s τ L s = K F L F ( s ) F S L ( s ) e s τ L s
where ϕ M L ( s ) ,   ϕ S L ( s ) ,   ϕ r ( s ) ,   and   ϕ e ( s ) are the ML phase, the SL phase, the reference phase, and the residual phase;   k P D = 2 R P D P M L P S L P r is the PD gain; R P D is the PD responsivity,   P M L , P S L , and   P r are the ML power, the SL power, and the reference power, respectively, k L I A ,   k m i x ,   k L F ,   and   k S L are the LIA gain, the MIX gain, the loop filter gain, and the SL phase tuning sensitivity, respectively; F L F ( s )   and   F S L ( s ) are the loop filter transfer function and the SL frequency modulation response, respectively. Therein, k S L   and F S L ( s ) can be calculated with the SL rate equation [23,24]. Furthermore, the loop gain is defined as K = k P D k L I A k m i x k L F k S L , and the loop filter transfer function is described as [25]
F L F ( s ) = 1 + τ 2 s τ 1 s
where τ 1   and   τ 2 are loop filter time constants.
Combining Equations (1) and (2), the closed-loop transfer function can be expressed as [25]
H C L ( s ) = ϕ S L ( s ) ϕ M L ( s ) = G O L ( s ) 1 + G O L ( s ) = K F L F ( s ) F S L ( s ) e s τ L s + K F L F ( s ) F S L ( s ) e s τ L

2.2. Loop Maximum Load Capacity Model

The loop maximum load capacity model is introduced to mark a boundary between the locked and unlocked OPLLs, with which the maximum tolerable loop delay and the maximum summed linewidth of lasers are calculated.
The maximum tolerable loop delay of this OPLL can be written as [26]
ω n τ L < P V   2 ζ arctan ( ζ 2 · ( 1 + ( 1 + ( 4 ζ ) 4 ) 1 2 ) 1 2 ) ζ 2 · ( 1 + ( 1 + ( 4 ζ ) 4 ) 1 2 ) 1 2
where PV is the principal value of the arctan function, ω n and ζ are the loop natural frequency and the damping factor, respectively [26]
ω n = K τ 1   , ζ = ω n τ 2 2
Then, the maximum summed linewidth of lasers is given by [27]
δ f m = π B P N [ 2 ln ( 4 T a v B S N π ) e B S N R P D P M L ]
where T a v is the cycle slip time, B P N   and   B S N are the loop phase noise bandwidth and the shot noise bandwidth, respectively [27]
B P N = 0 | 1 H C L ( f ) | 2 f 2 d f , B S N = 0 | H C L ( f ) | 2 d f

2.3. Loop Phase Noise Model

The loop phase noise model is used to evaluate the phase tracking ability of the SL to the input ML signal, which can be described by the loop residual phase noise variance. Using the Wiener-Sinchinl theorem [28], the residual phase noise variance σ ϕ e 2 can be obtained by integrating the residual phase noise power spectral density S ϕ e ( f ) in the frequency domain
σ ϕ e 2 = + S ϕ e ( f ) d f
Here, it is assumed that the noise introduced by electronic components and the noise induced by carriers injected into the OPLL is negligible. Therefore, the residual phase noise power spectral density S ϕ e ( f )   is given by
  S ϕ e ( f ) = [ S M L ( f ) + S S L f r ( f ) ] · | 1 H C L ( s ) | 2 + S P D ( f ) · | H C L ( s ) | 2
where S M L ( f ) , S S L f r ( f ) , and   S P D ( f ) are the ML phase noise, the SL phase noise in the free-running state, and the PD shot noise, respectively, which can be expressed as
S M L ( f ) = Δ f M L 2 π f 2 ,   S S L f r ( f ) = Δ f S L 2 π f 2 ,   S P D ( f ) = e ( P M L + P S L ) R P D P M L P S L
where Δ f M L   and   Δ f S L   are the spectral FWHM (the full width at half of the maximum) linewidth for the ML and the SL, respectively.
In addition, to simulate this PIC-based heterodyne OPLL based on the described above physical models, the loop parameters of the optical path [28] and the electrical path [22] for each component in our design are listed in Table 1.

3. Results and Discussion

3.1. Loop Stability Analysis

The loop stability is the precondition for the OPLL proper operation, which is analyzed via the open-loop amplitude/phase-frequency response and is characterized by the gain margin and the phase margin. Figure 3 shows such an open-loop amplitude/phase-frequency response. As it is shown, the phase margin is 49° at 46.6 MHz (corresponding to the amplitude response of 0 dB), and the gain margin is 7.3 dB at 235.68 MHz (corresponding to the phase response of −π). Both the gain margin and the phase margin above safely ensure our OPLL works in a stable status, since a feedback loop’s operation conditions can be judged using the Baud criterion, which states that a feedback loop is generally stable; providing that the gain margin is more than 6 dB, the phase margin is somewhere between 45~60° [29].

3.2. Loop Bandwidth Characteristics

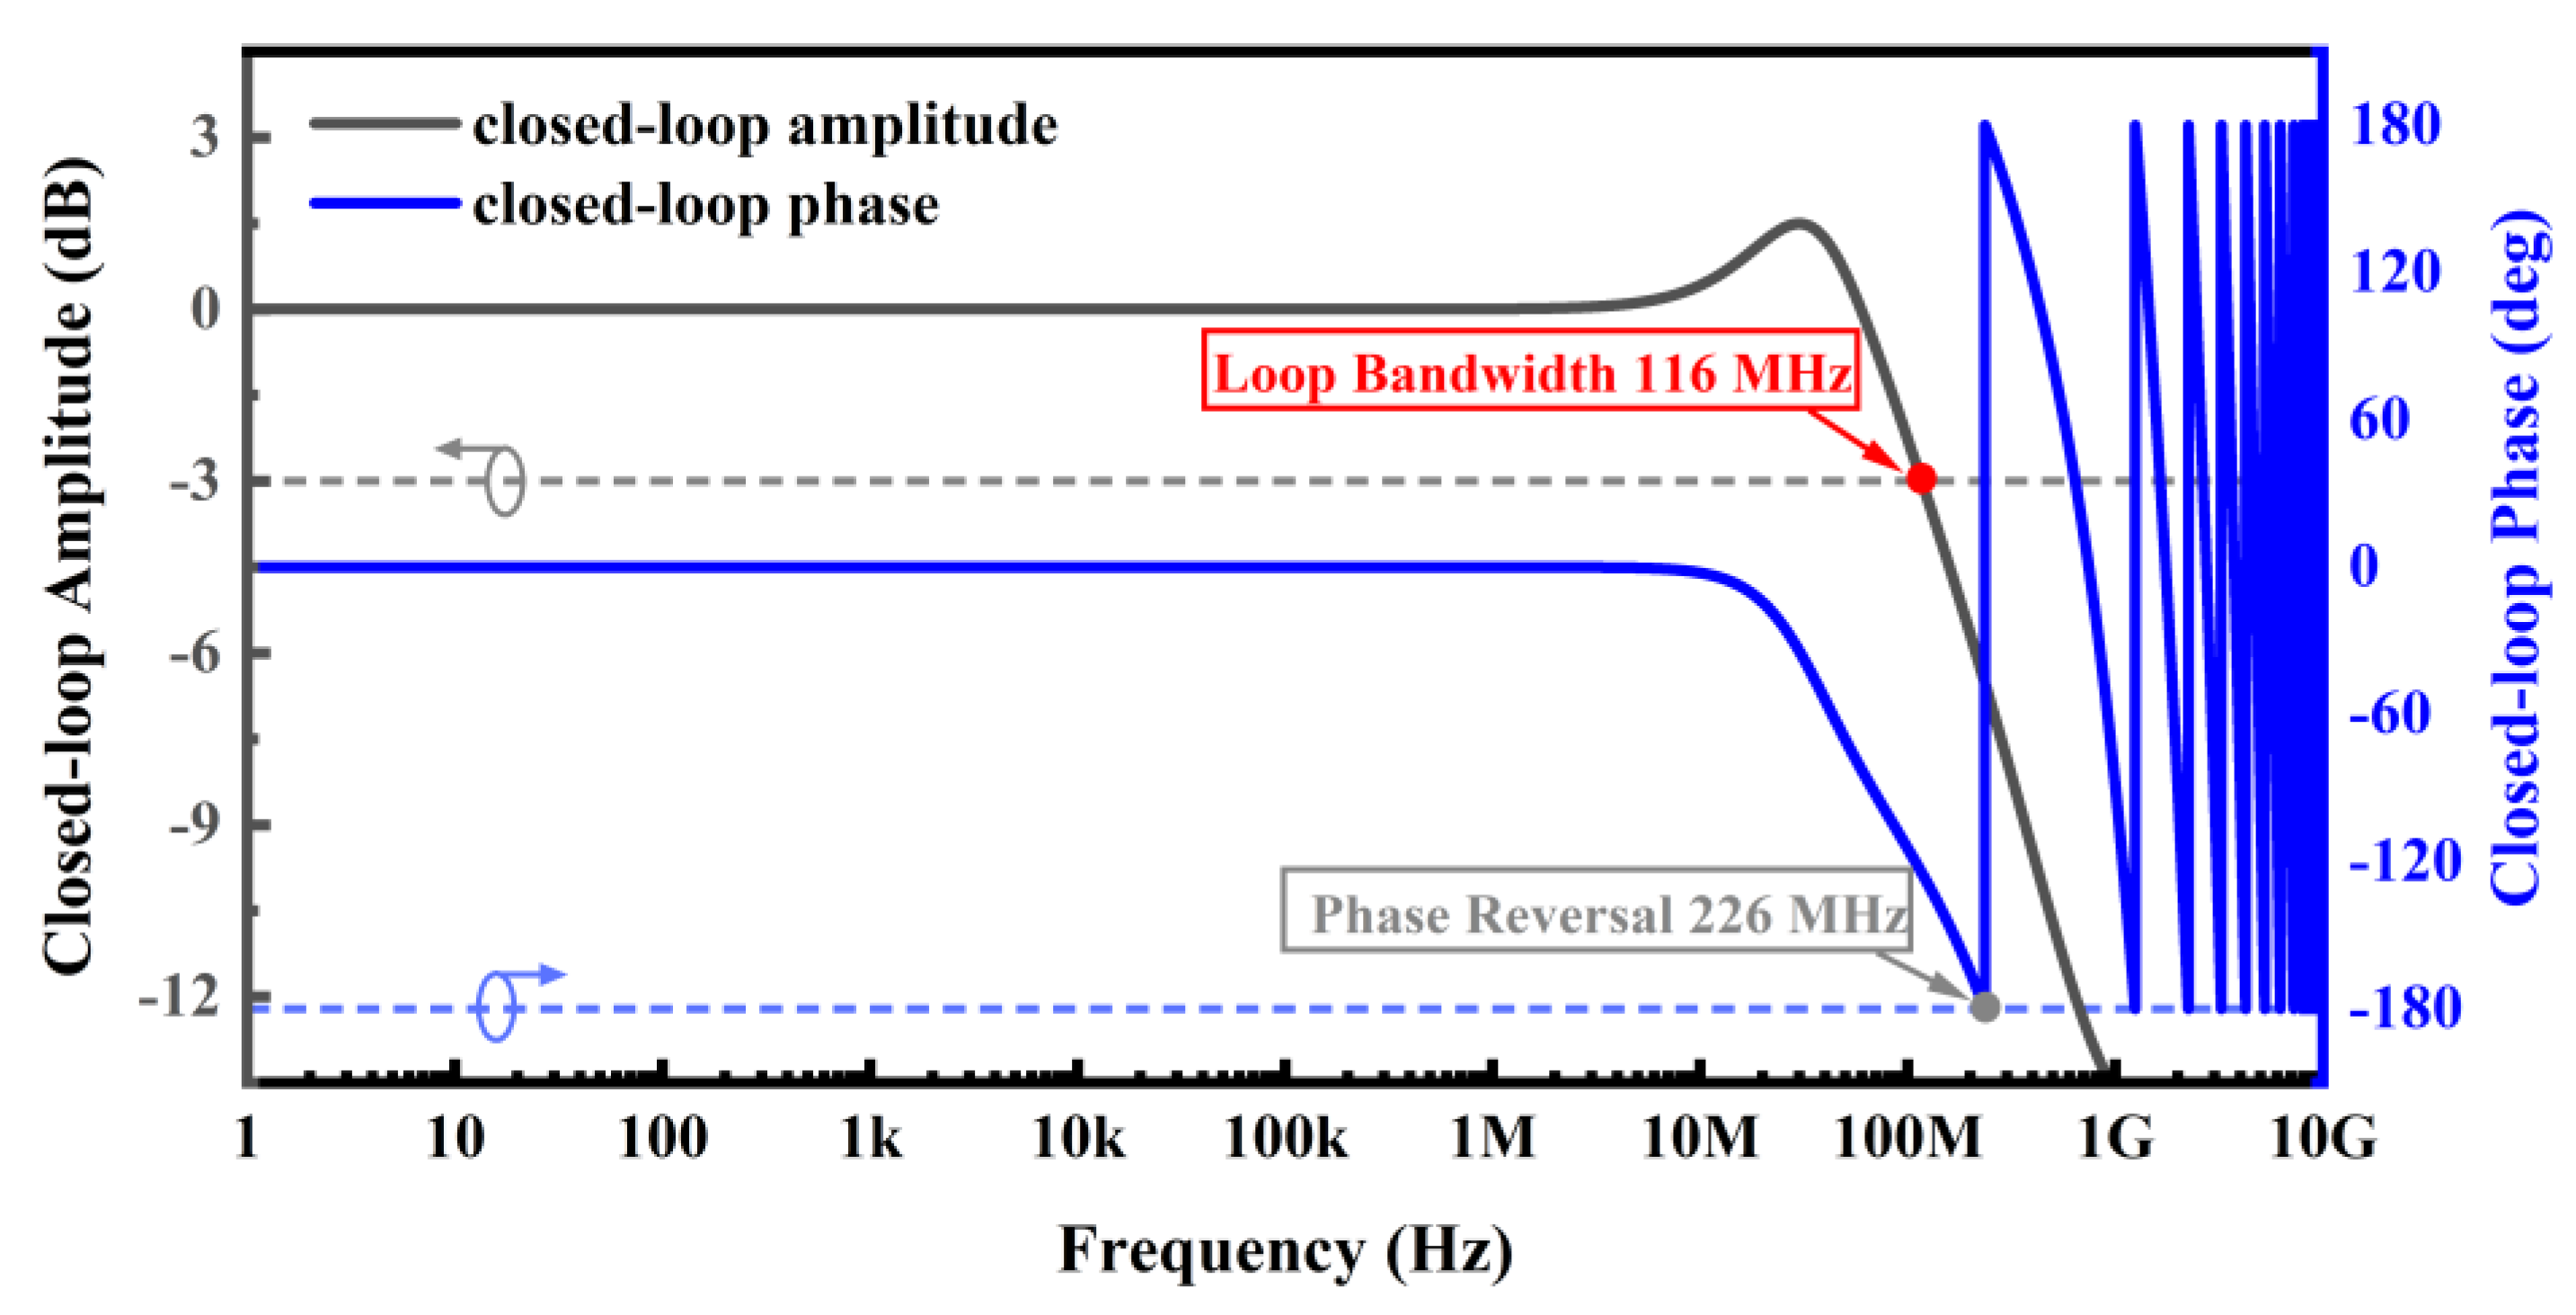
The loop bandwidth can be described by the response of phase noise in the frequency domain when it is in the closed-loop state. Figure 4 shows the initial closed-loop amplitude/phase frequency response, from which one can see that the initial loop bandwidth is 116 MHz. This is only 10 times wider than the initial summed linewidth of 10 MHz, and is far from enough to meet the high bandwidth requirement.
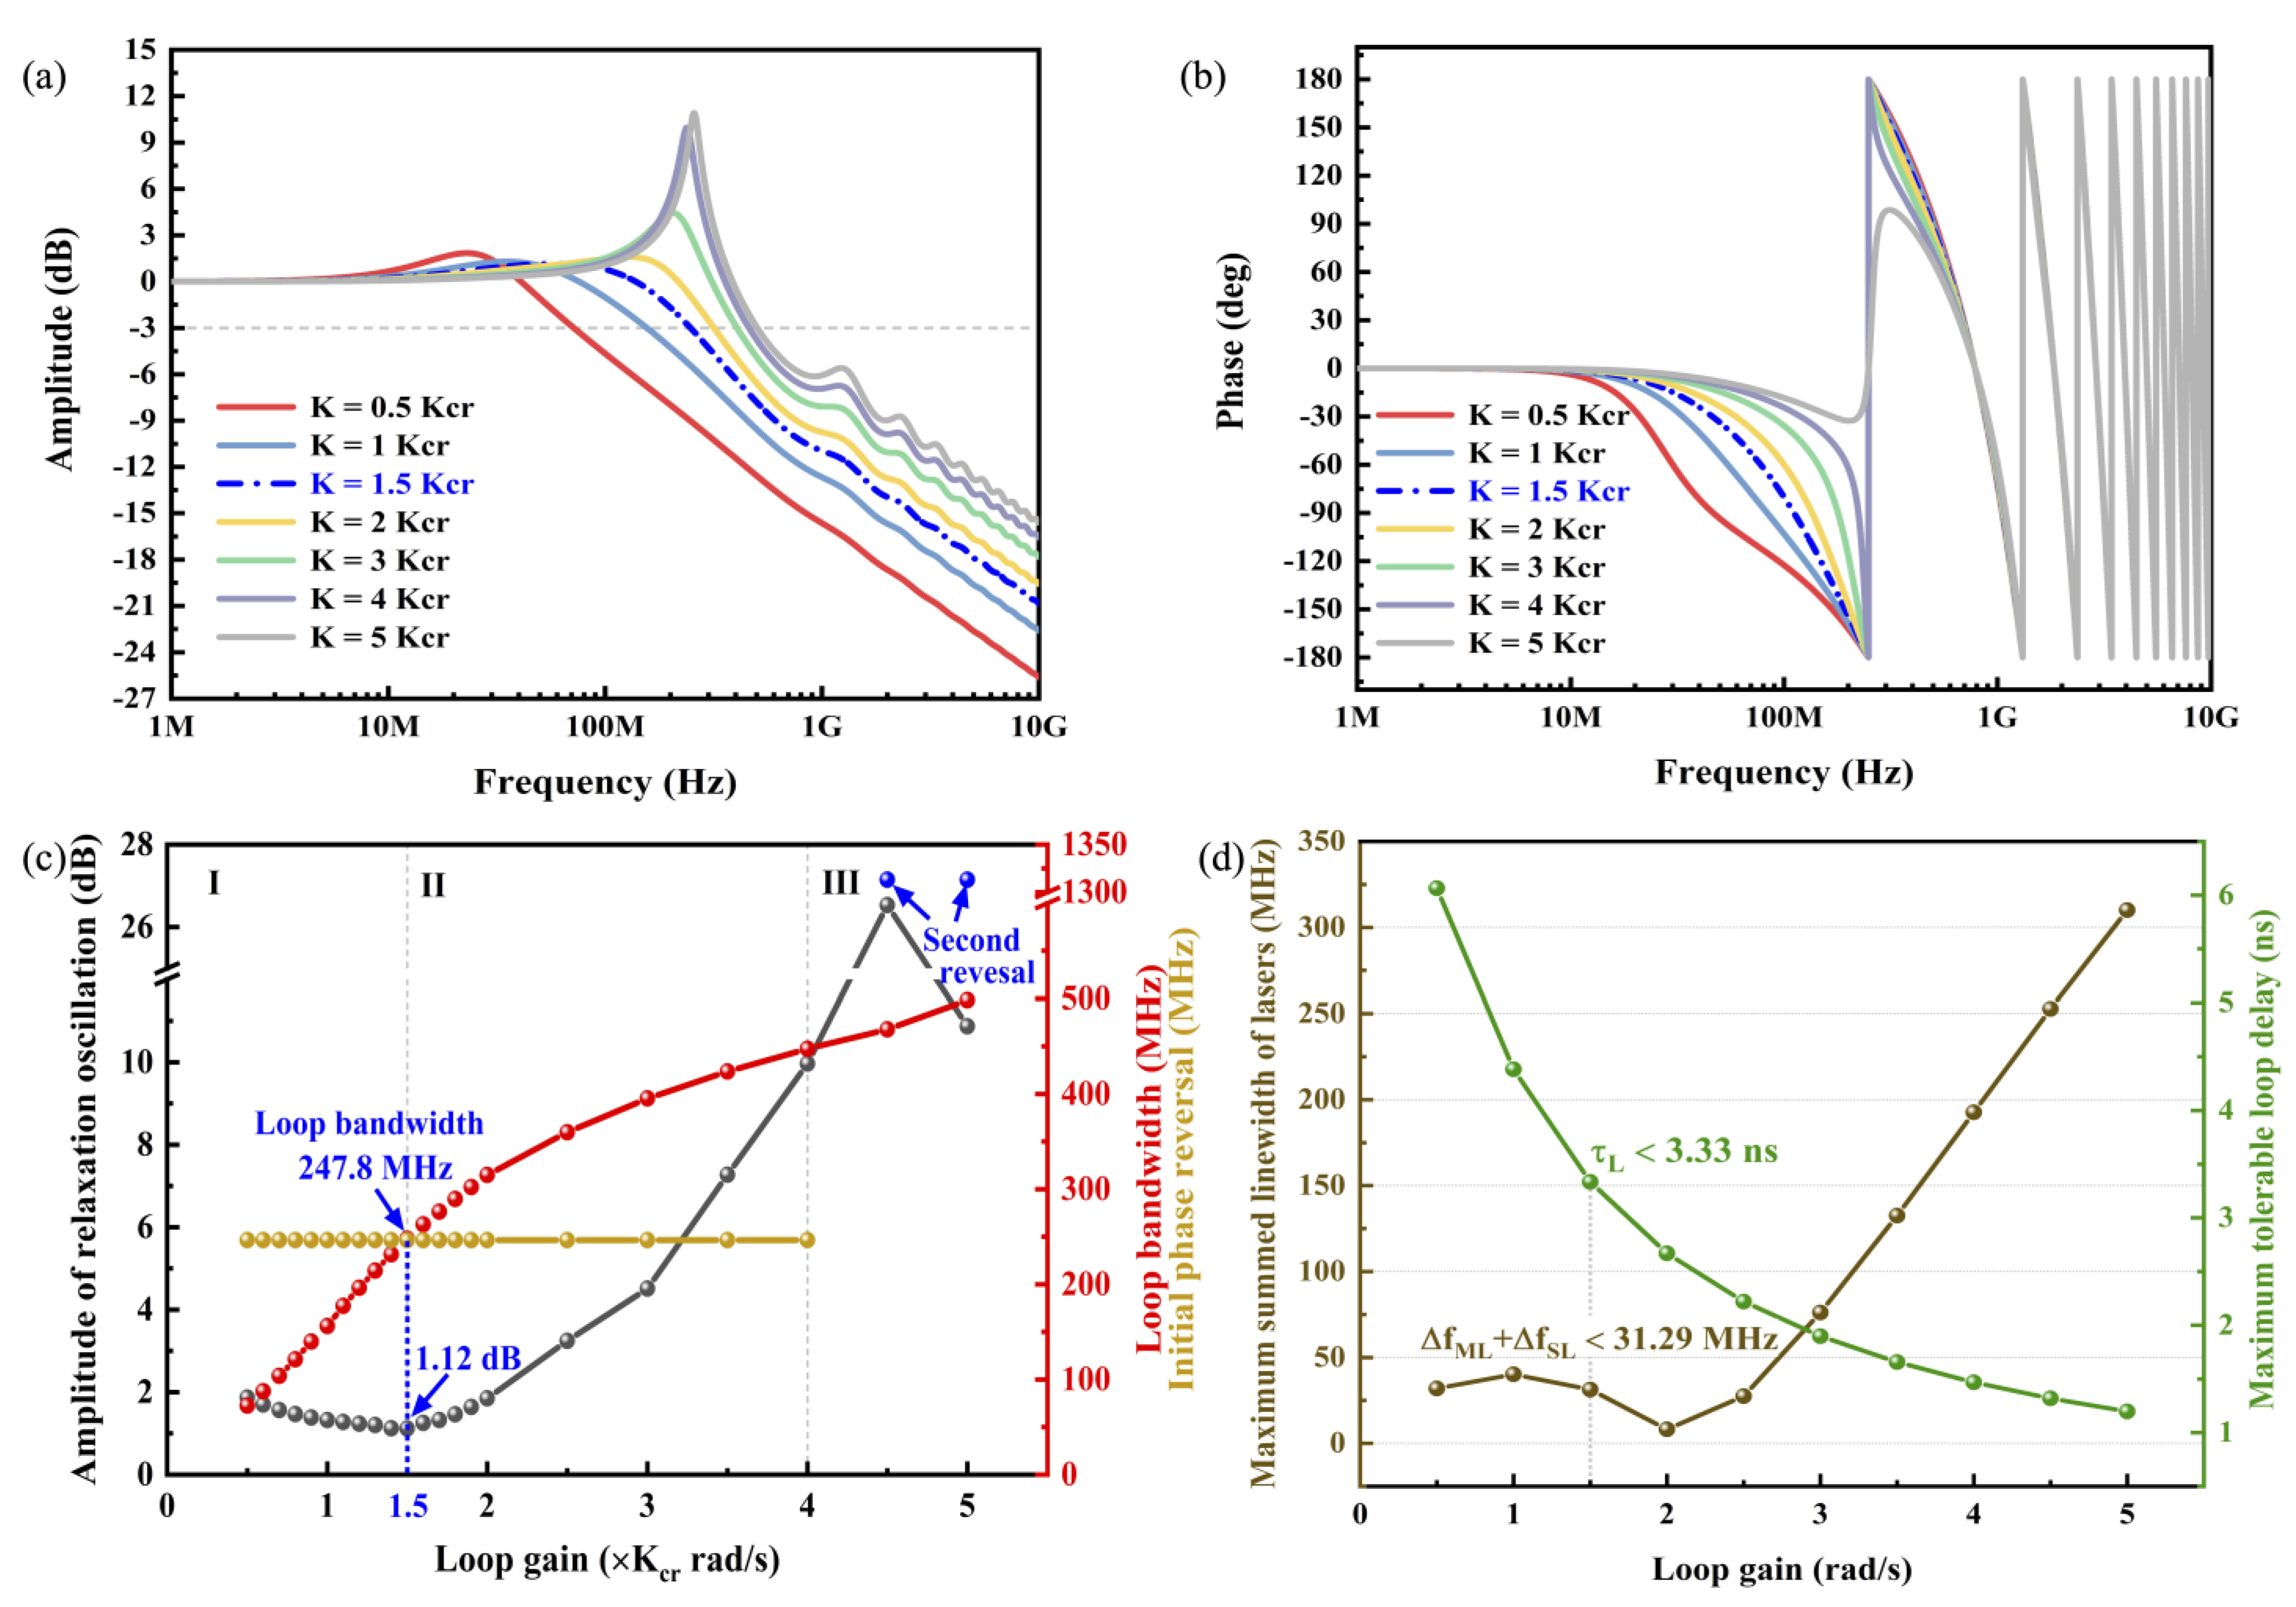
The loop bandwidth is determined by the loop gain and loop delay once F L F ( s ) and F S L ( s ) are fixed, as seen in Equation (3). Therefore, to further improve the loop bandwidth, the influence of the loop gain and delay on the loop bandwidth are investigated, and the results are shown in Figure 5 and Figure 6, respectively. To clearly describe the dependence of the loop gain on the loop bandwidth, a parameter Kcr, which is called the loop critical gain and is proportional to the loop gain, is introduced and calculated using the OPLL characteristic Equation (11) [30].
1 + G O L ( s ) = 0
Figure 5a plots the influence of the loop gain on the closed-loop amplitude-frequency response. Clearly, when the loop gain increases from 0.5 Kcr to 5 Kcr, the relaxation oscillation frequency monotonically increases, and the loop bandwidth gradually widens accordingly. When the loop gain varies from 3 Kcr to 5 Kcr, the amplitude-frequency response exhibits a strong overshoot and double-frequency jitter. Meanwhile, Figure 5b shows the influence of the loop gain on the closed-loop phase-frequency response, which exhibits the same initial phase reversal frequency of 247.5 MHz when the loop gain increases from 0.5 Kcr to 4 Kcr, but no initial phase reversal point once the loop gain is higher than 4 Kcr.
To appreciate the effects of the loop gain on the closed-loop amplitude/phase frequency response, several characteristic parameters, including the amplitude of relaxation oscillation, loop bandwidth, and phase reversal point, are extracted from Figure 5a,b, and the results are shown in Figure 5c. By looking at the relationship between the initial phase reversal frequency point and the loop bandwidth, one can divide the loop gain axis (Figure 5c) into three operation regimes. In regime I, the initial phase reversal point is always larger than the loop bandwidth, where its phase lag can be completely compensated by the phase margin, which results, in this case, to the loop being in an absolutely stable state. In regime II, when the loop gain varies from 1.5 Kcr to 4 Kcr, the loop bandwidth increases from 247.8 MHz to 465 MHz, which results in the initial phase reversal point remaining within the loop bandwidth, so that this OPLL is in a metastable state and the loop stability becomes increasingly deteriorated with the widened difference between the loop bandwidth and the initial phase reversal point. In regime III, when the loop gain exceeds 4 Kcr, one can see that although the loop bandwidth continuously increases, the initial phase reversal point no longer exists, which indicates that this OPLL is in an unstable state due to the phase margin not being enough to compensate for the phase lag. From the above analysis, it is found that the optimal loop gain is 1.5 Kcr, where the maximum loop bandwidth is 247.8 MHz. Obviously, this value is expanded by 2.14 times after the loop gain optimization, compared to the initial loop bandwidth.
In addition, Figure 5d reveals the influence of the loop gain on the loop maximum load capacity. It shows a tolerance delay of 3.33 ns and a maximum summed linewidth of 31.29 MHz at the optimal loop gain of 1.5 Kcr, both of which provides a basic operation limit for the current OPLL in the following optimization design.
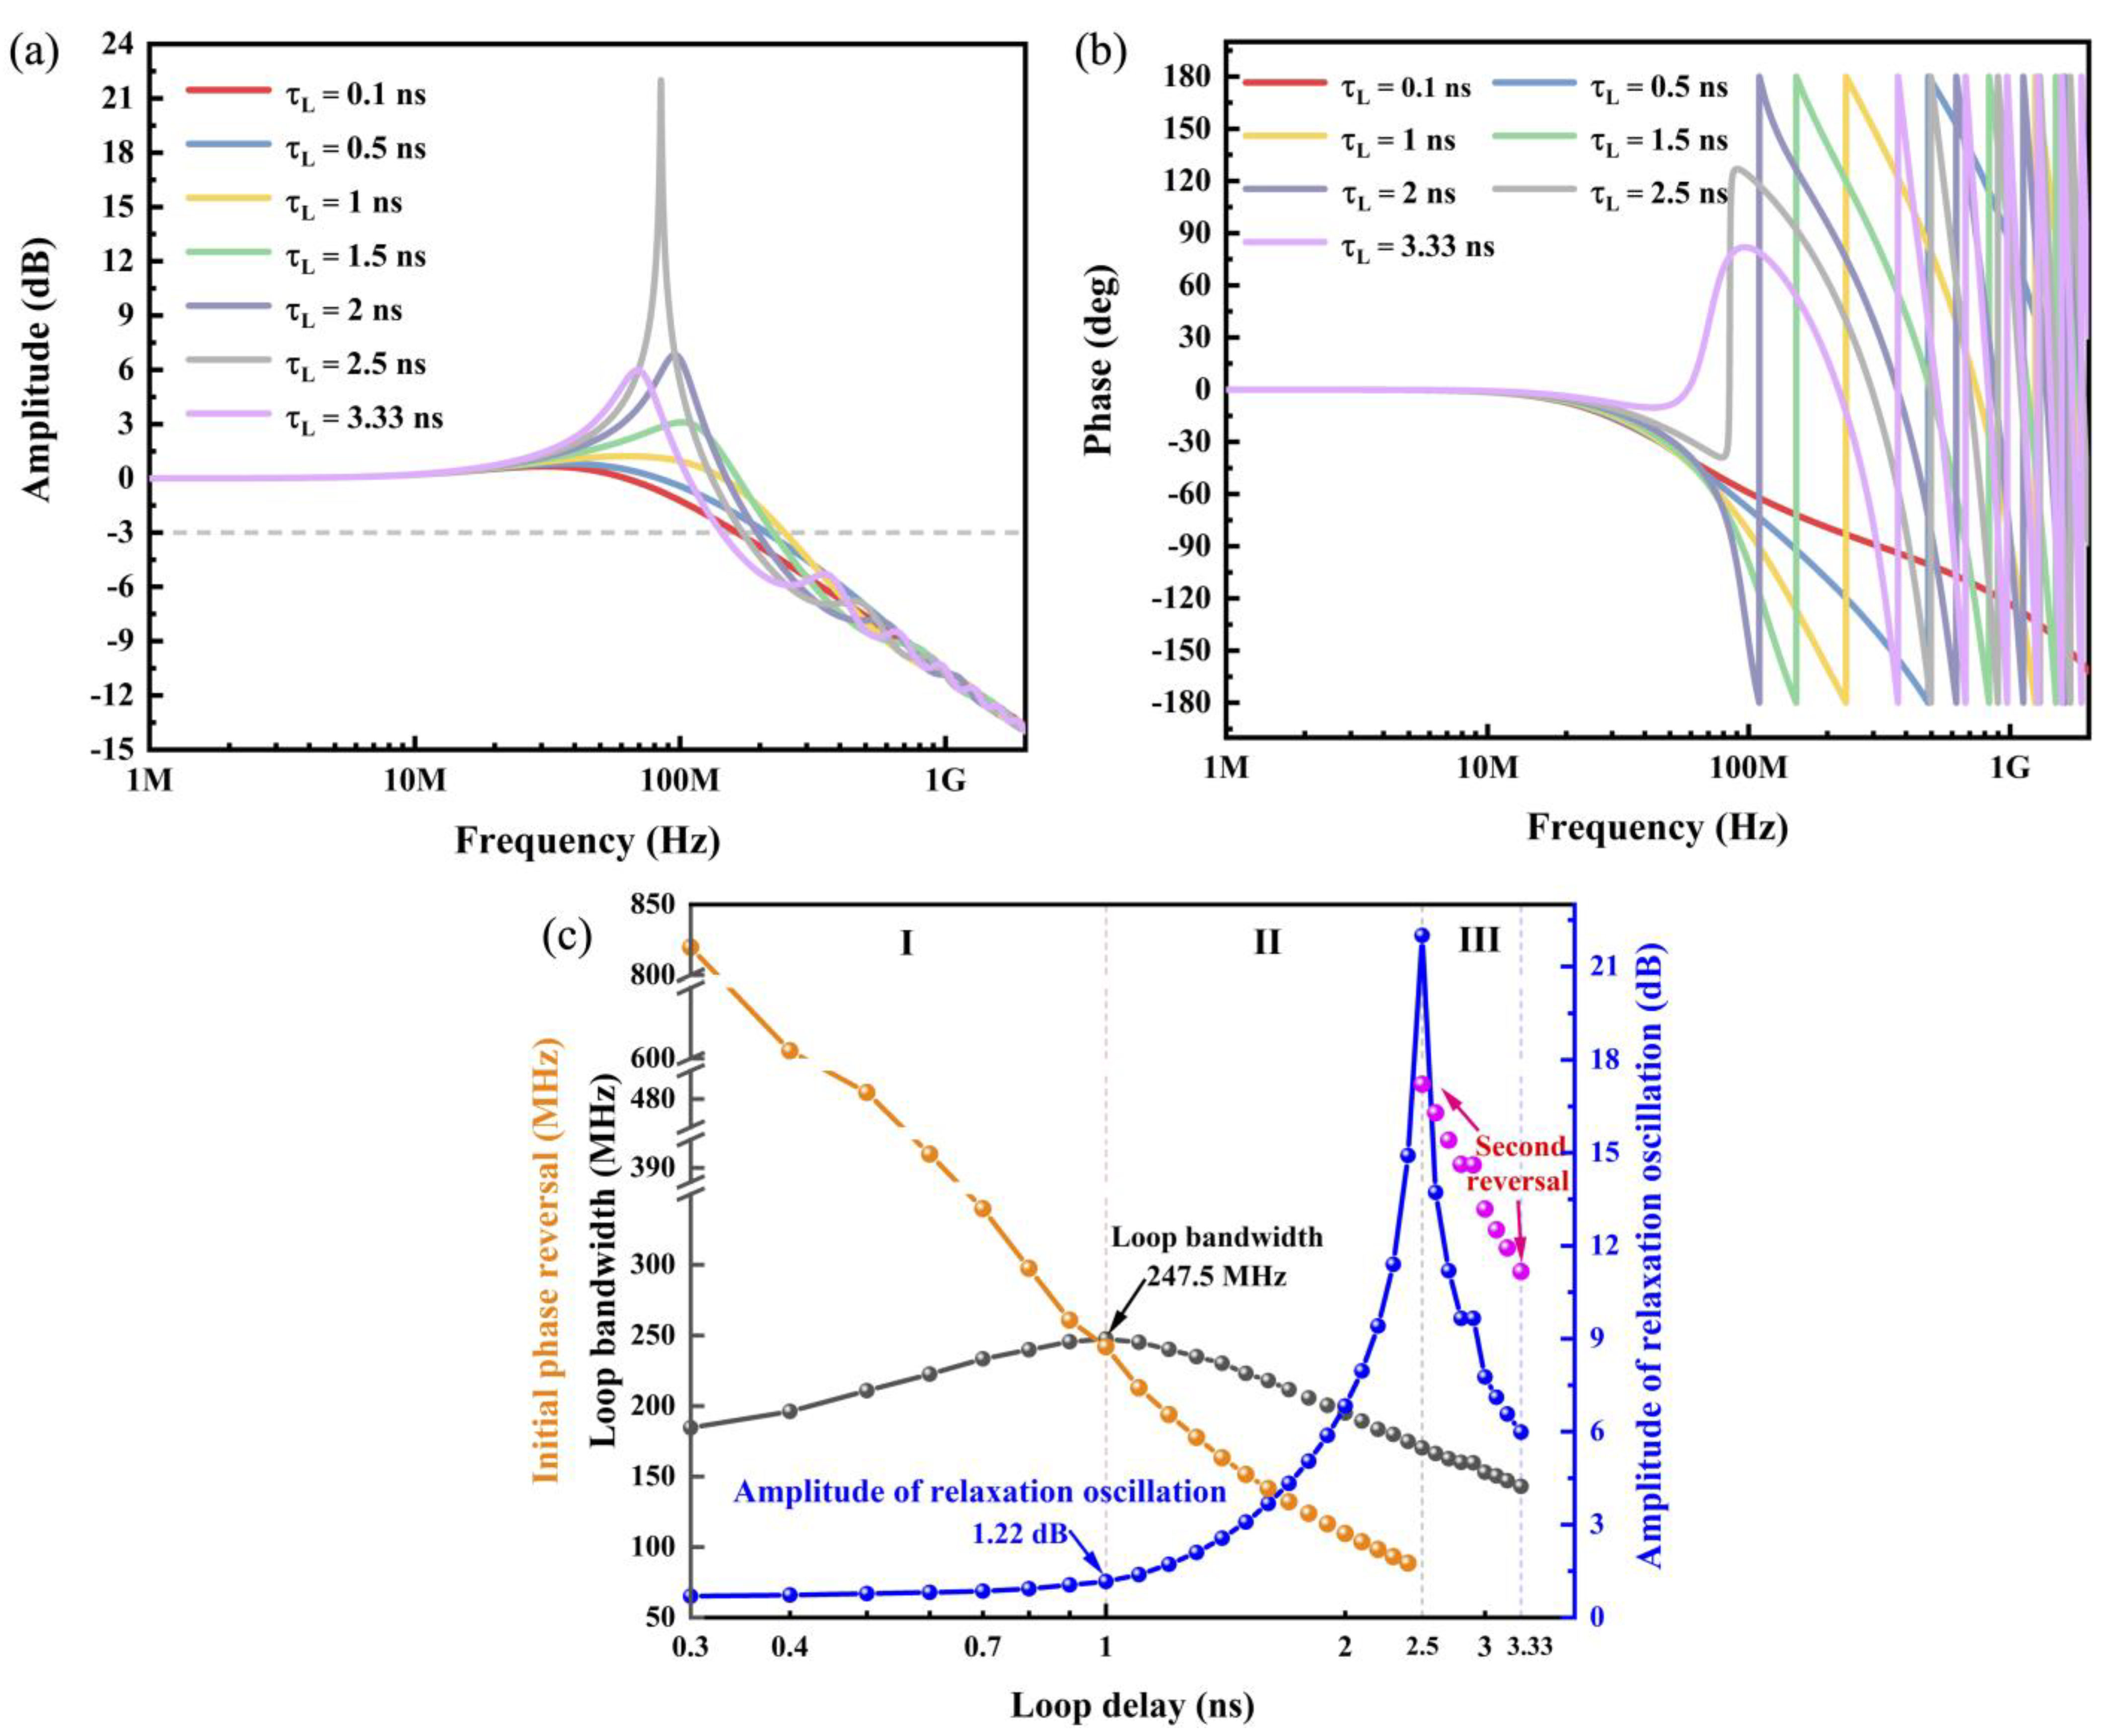
As mentioned above, Figure 6 is used to investigate the effects of the loop delay on the loop bandwidth with the optimal loop gain. In detail, Figure 6a shows the close-loop amplitude frequency response at the different loop delays. As it is shown, when the loop delay is less than 1 ns, the loop bandwidth increases with the loop delay, and there is no observable relaxation oscillation phenomenon. When the loop delay is in the range between 1.0–2.5 ns, not only does the relaxation oscillation frequency shift to the left, which directly results in a narrowing of the loop bandwidth, but the relaxation oscillation amplitude increases and the double-frequency jitter appears. When the loop delay further increases from 2.5 ns to 3.33 ns, the relaxation oscillation frequency is further left-shifted, and the relaxation oscillation amplitude gradually decreases, but the double-frequency jitter becomes strong. Figure 6b shows the closed-loop phase frequency response at the different loop delays. As it is shown, when the loop delay is in-between 0.1–2.5 ns, the initial phase reversal point is gradually left-shifted with the loop delay increase, and when the loop delay reaches 2.5 ns or more, there is no initial phase reversal point observed.
Again, the relative characteristic parameters are extracted from Figure 6a,b and the results are presented in Figure 6c. One can see that the initial phase reverse point monotonically decreases with the increase in the loop delay, and the loop bandwidth reaches its peak value of 247.5 MHz when the loop delay is 1 ns. Same as that shown in Figure 5c, three regimes can be divided by comparing the initial phase reversal frequency point with the loop bandwidth, and conclusions are exactly the same as those made in the previous section, i.e., in regime I, the OPLL is in an absolutely stable state because the initial phase reverse point is higher than the loop bandwidth. In regime II, this OPLL is in a metastable state and its instability becomes increasingly more sensitive with the larger difference between the initial phase reverse point and the loop bandwidth. In regime III, when the loop delay is more than 2.5 ns, there is no initial phase reversal point, as shown in Figure 6b, and the OPLL system is in an unstable state.
From the simulations shown above, one can see that the optimal loop delay is 1 ns, at which both the absolute stable operation state and the maximum loop bandwidth of 247.5 MHz are attained.

3.3. Loop Phase Noise Characteristics

The ultimate aim of the OPLL is to suppress the phase noise and further improve the signal-to-noise ratio of the input signal, and its noise behavior can be described by the residual phase noise power spectrum S ϕ e ( f )   and residual phase noise variance σ ϕ e 2 , which are completely dependent on the loop gain, loop delay, summed linewidth of lasers, and laser power injected into the PDs. The influence of the first three parameters on the phase noise behavior is shown in Figure 7. As shown in Figure 7a–c, when the OPLL is in the free-running state, the residual phase noise intensity follows the 1/f variation law and is independent of any loop parameters in the whole frequency domain. However, when it is in a locked state, the residual phase noise spectrum dramatically changes. Indeed, in the low-frequency range (1–100 kHz), the residual phase noise intensity is reduced down to −132 dBc/Hz, which is the evidence of noise suppression and independent of any loop parameters. In the mid-frequency range (from 100 kHz to the noise relaxation oscillation frequency), the loop residual phase noise becomes sensitive to the variations in the all parameters above. It is observed that higher loop gain, shorter loop delay, and narrower summed linewidth will lead to lower noise intensity in this frequency domain. When the operating frequency is above the noise relaxation oscillation frequency, the loop residual phase noise intensity has little dependence on the loop gain and delay, but can still be affected by the summed linewidth; the narrower the summed linewidth, the lower the residual phase noise is. This is an indication that the reduction of the SL’s linewidth is required for the PIC-OPLL to suppress the phase noise because the SL linewidth is the dominant term in the summed linewidth.
To further clearly evaluate the influence of the loop parameters on the loop noise behavior and achieve the optimal ones, the residual phase noise variances are calculated using Equation (8) and plotted in Figure 7d. First, we optimize the loop gain. As can be seen, the minimum residual phase noise variance is 0.007 rad2 when the loop gain is 5 Kcr, which is only 1/36.6 of the maximum value. This seems to suggest that the optimal loop gain should be 5 Kcr rather than the 1.5 Kcr calculated in the previous section. Obviously, we need to carry out further analysis to understand the effect of the loop gain on the system performance. Since the loop phase noise performance is actually determined by its signal-noise-ratio (SNR), which is in turn directly relates to the ratio of the noise bandwidth to the natural frequency B L / ω n for an OPLL system (the lower B L / ω n , the better SNR) and its effect can be modeled using Equation (12) [31], we are able to evaluate the effect of the loop gain on the noise performance by examining the relationship between B L / ω n and the loop gain (see Figure 7e).
B L ω n = 1 2 ( ζ + 1 4 ζ )
As shown in Figure 7e, the minimum value of B L / ω n is 0.5, where the loop gain is 0.3 Kcr, which means that the optimal loop gain is 0.3 Kcr in terms of the SNR for this OPLL. However, it is a bit disappointing that the loop bandwidth, corresponding to such loop gain, is only 78 MHz, which cannot meet the requirement of a wide loop bandwidth. Nonetheless, a trade-off can be made between the loop bandwidth and SNR by choosing the loop gain of 1.5 Kcr, at which, B L / ω n is 0.61, which is only slightly higher than that at the loop gain of 0.3 Kcr, but is considerably smaller than that at the loop gain of 5 Kcr.
In addition, Figure 7d also shows the dependence of the residual phase noise variance on the loop delay when the loop gain is 1.5 Kcr. Even though the residual phase noise variance gets worse with the increase in the loop delay up to 2.5 ns, fortunately, such performance deterioration is slow before the loop delay reaches 1 ns. Taking into account the effect of the loop delay on the loop bandwidth, as well as on the relaxation oscillation overshooting, we choose 1 ns as the optimal loop delay in our OPLL system, where, the residual phase noise variance is 0.06 rad2. Finally, we shall proceed to determine the optimized summed linewidth based on the optimal loop gain and delay. It is clearly seen that the residual phase noise variance increases with the summed linewidth, and further referring to Figure 7c, the residual phase noise over the whole frequency domain is always less than that at a free-running state when the summed linewidth is not wider than 3 MHz. Therefore, the optimized range of the summed linewidth should be narrower than 3 MHz. Under these optimized conditions, the residual noise variance value is only 0.018 rad2, even in the worst scenarios, which is comparable to the performance reported in [15].
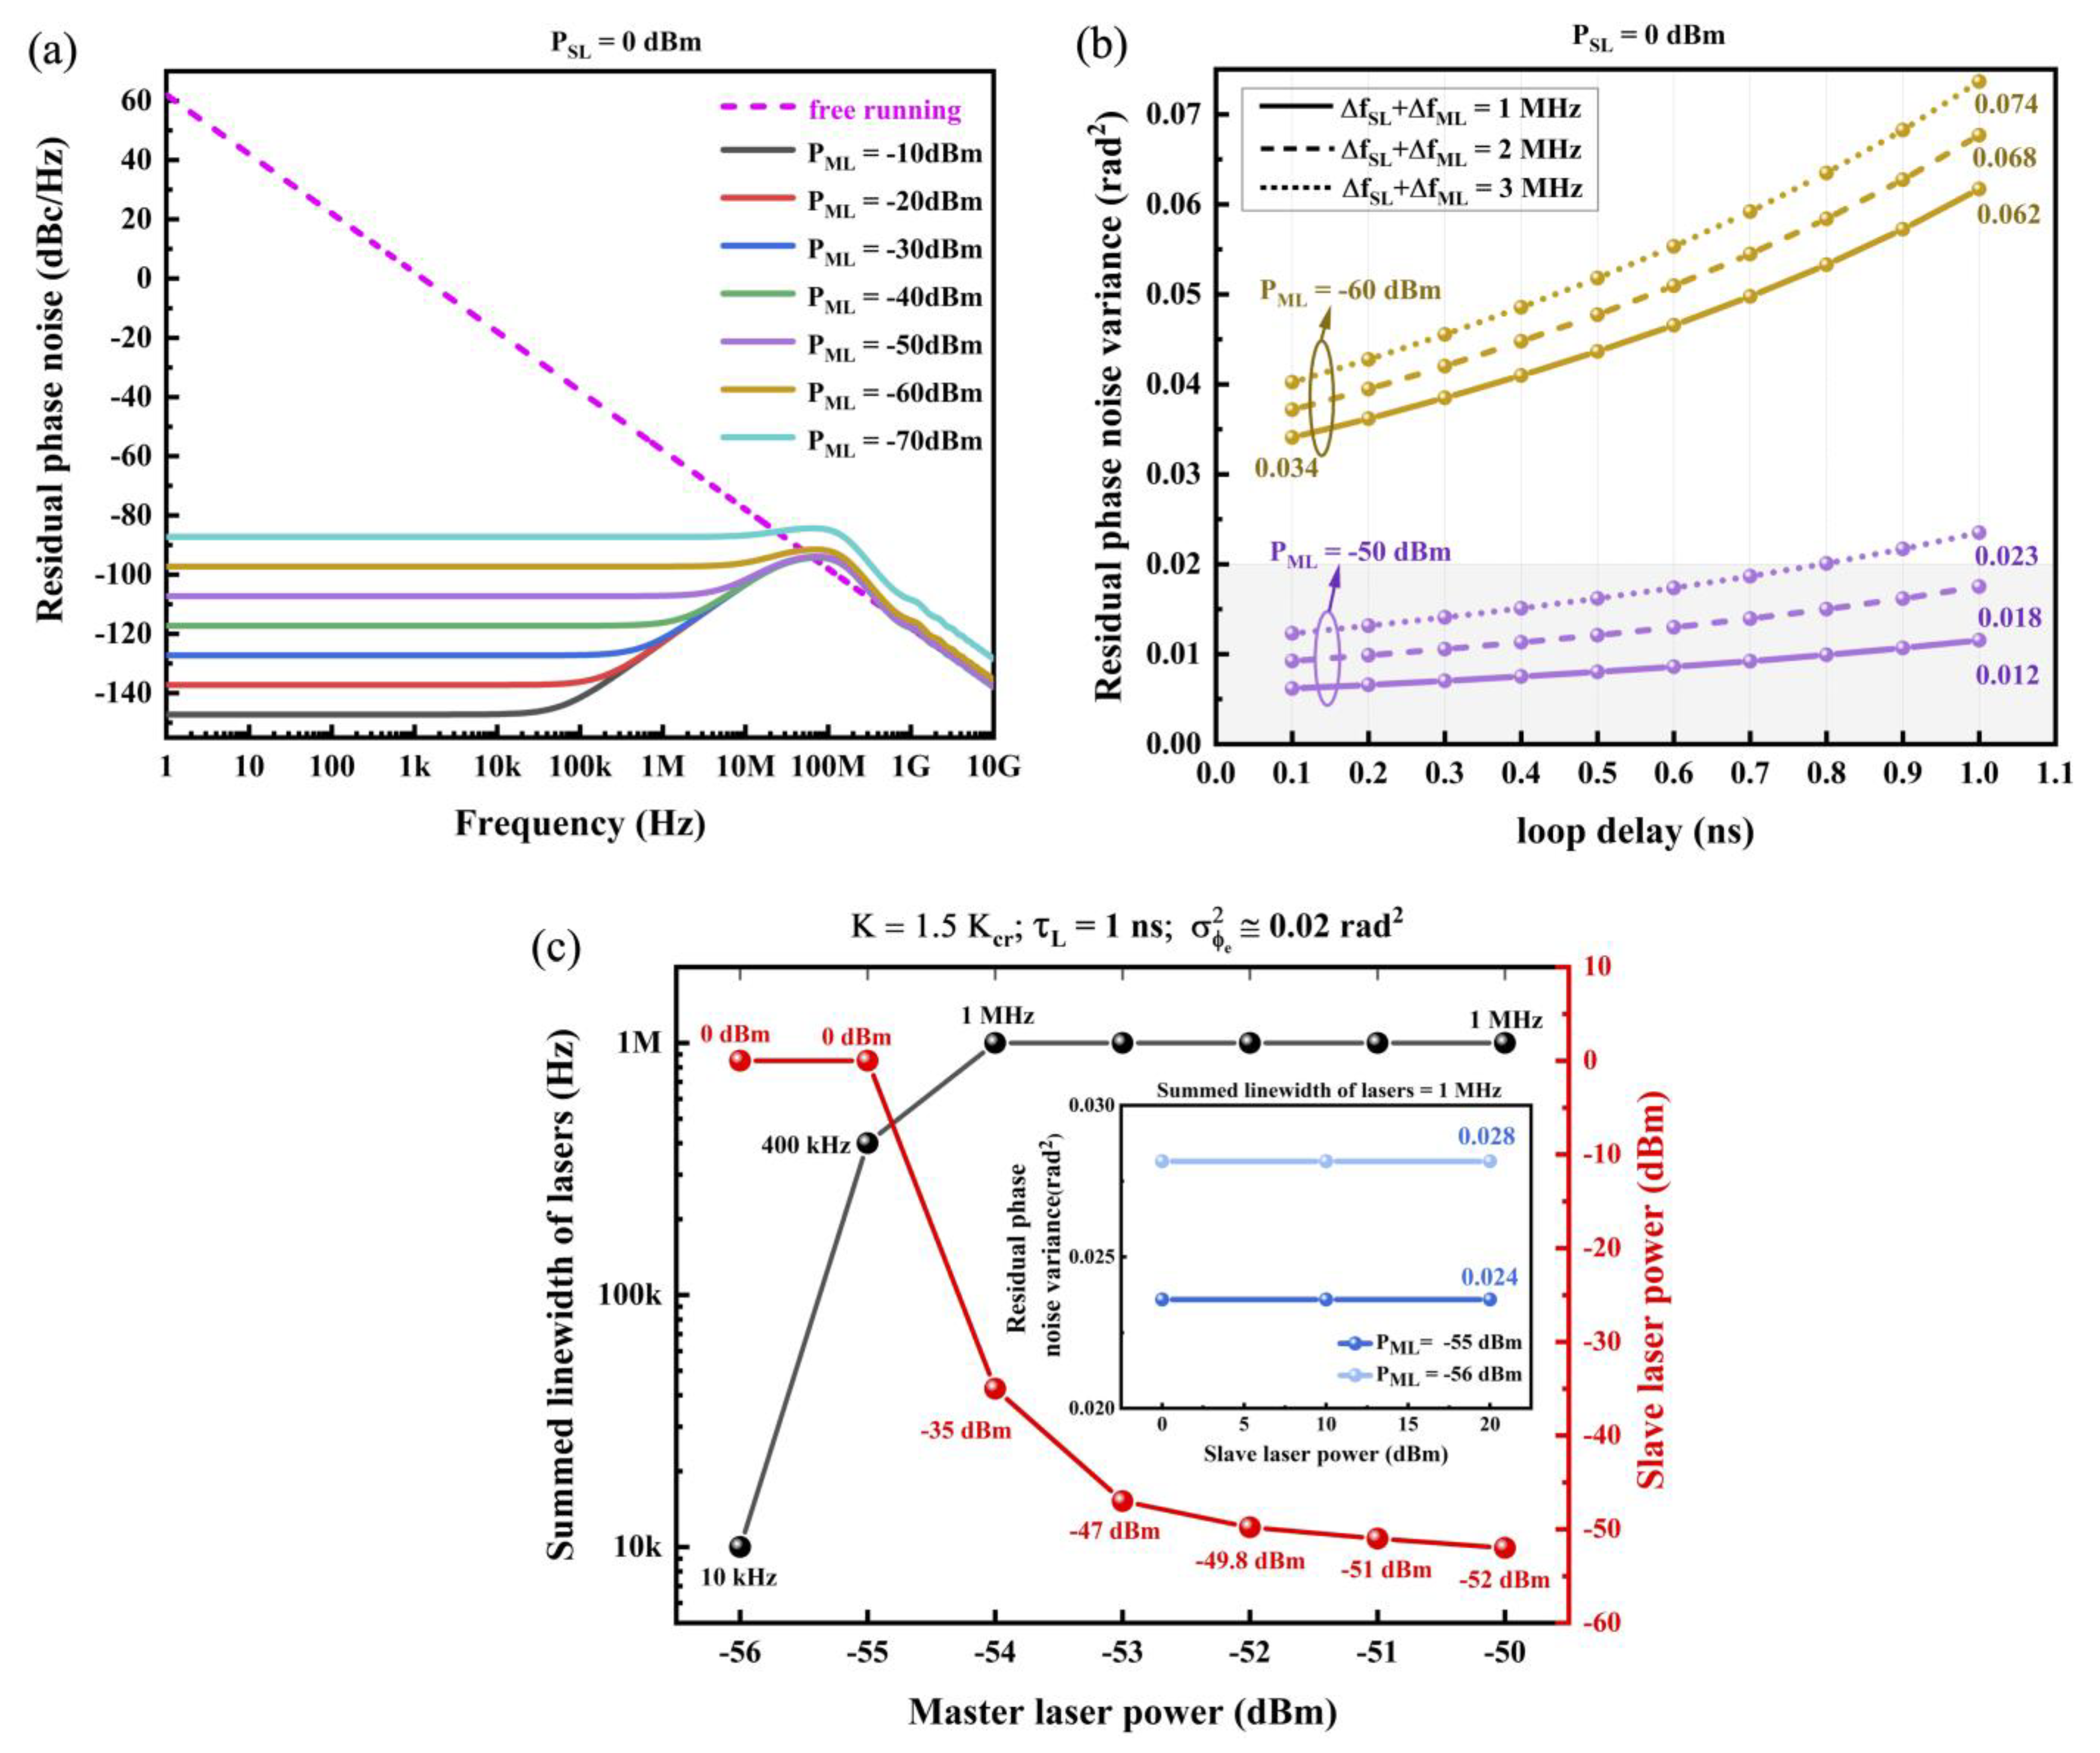
In addition to the above-discussed parameters, the influence of the laser power injected into the PDs on the noise performance is also investigated and the results are shown in Figure 8. Figure 8a shows the residual phase noise spectra of the OPLL system with the different ML power when the other parameters are fixed. As it can be seen, the lower the ML power, the higher the residual phase noise. From this relationship, one can see that to ensure the noise level below the specific value, there should be a lowest ML power for each individual OPLL system.
To further comprehensively evaluate the role that the ML power played in the noise performance for our OPLL system, the dependence of the residual phase noise variance on the loop delay, the summed linewidth, and the ML power is shown in Figure 8b, which clearly reveals that the residual phase noise variance is dominated by the ML power, though it is still affected by the other two parameters too. When the ML power is −50 dBm, a residual phase noise variance of 0.012 rad2 is observed at the summed linewidth of 1MHz and the loop delay of 1 ns, which is even better than the best results to date [28]. However, when the ML power is −60 dBm, the calculated lowest residual phase noise variance is 0.034 rad2, which is much higher than the reported one [28], even though the loop delay of 0.1 ns is selected.
Although the phase noise level can be readily improved by raising the ML power level, it is desirable to evaluate the lowest possible power level of the ML, at which the OPLL can still produce the required noise performance. Since the phase noise level has to be below a specified criterion for the OPLL systems to be beneficial in real applications, in our simulation, it is assumed that this criterion for residual phase noise variance is 0.02 rad2, which is a specified noise level for OPLL systems [28,32]. Owing to the fact that the noise level is affected by a number of parameters, including the SL power, the ML power, the summed spectral linewidth, as well as the loop delay, it is necessary to understand the constraints between these parameters and evaluate the lowest possible ML power for the given noise criterion; such constrained relationships can be seen in Figure 8c. As shown in this figure, the system can reach the noise criterion for the ML power of no less than −54 dBm when the SL power is at least −35 dBm and the summed linewidth is no wider than 1 MHz, both of which can be realized by the current OPLL system. However, when the ML power is less than −54 dBm, even though the summed linewidth is 1 MHz and the SL power increases up to 0 dBm or more, the residual phase noise variance still exceeds this noise criterion, as the inset plot shows. In spite of this, it is still possible to meet the system noise criterion for the ML power as low as −56 dBm, providing that the summed linewidth is 10 kHz and the SL power is at least 0 dBm, which could be realized by the future PIC-OPLL configuration. Therefore, the lowest ML power of −54 dBm and −56 dBm are expectantly attained in the current and future PIC-OPLL systems, respectively.

4. Conclusions

In summary, the simulation and design of a PIC-based heterodyne OPLL were demonstrated. The influences of the loop parameters on the loop performances, such as loop stability, closed-loop bandwidth, and phase noise characteristics, were systematically investigated. Our simulation revealed that the OPLL operation could be in one of three states, i.e., stable, metastable, and unstable states, depending on the relative position of the initial phase reversal point to the loop bandwidth. By systematically optimizing all parameters involved, such as the loop gain and delay, the summed linewidth, as well as laser powers, we were able to show that a loop bandwidth of 247.8 MHz and a residual phase noise variance of 0.012 rad2 were attainable, which was even better than the best result reported thus far. In addition, the lowest required power of the ML laser was also evaluated by assuming the largest acceptable residual phase noise variance was 0.02 rad2. It was found that an ML power of at least −54 dBm is required for the current PIC-OPLL system, and that it was possible to reduce the ML power down to as low as −56 dBm, provided the summed linewidth was reduced to 10 kHz. It is believed this simulation work is beneficial to future experimental demonstration.

Author Contributions

Conceptualization, X.Y. and R.Z.; methodology, X.Y., C.L., B.Z. and R.Z.; simulation, X.Y.; validation, X.Y. and R.Z.; formal analysis, X.Y., C.L. and R.Z.; data curation, X.Y. and R.Z.; writing—original draft preparation, X.Y. and R.Z.; writing—review and editing, R.Z. and B.Q.; supervision, R.Z.; project administration, R.Z.; funding acquisition, R.Z. All authors have read and agreed to the published version of the manuscript.

Funding

This research was funded by Jiangsu Province Key R&D Program (Industry Prospect and Common Key Technologies) under Grant BE2016083 and in part by Jiangxi Natural Science Foundation Project under Grant 20192ACBL20054.

Institutional Review Board Statement

Not applicable.

Informed Consent Statement

Not applicable.

Data Availability Statement

The data presented in this study are available from the corresponding author upon request.

Conflicts of Interest

The authors declare no conflict of interest.

References

  1. Lezius, M.; Wilken, T.; Deutsch, C.; Giunta, M.; Mandel, O.; Thaller, A.; Schkolnik, V.; Schiemangk, M.; Dinkelaker, A.; Kohfeldt, A.; et al. Space-Borne Frequency Comb Metrology. Optica 2016, 3, 1381. [Google Scholar] [CrossRef]
  2. Capmany, J.; Munoz, P. Integrated Microwave Photonics for Radio Access Networks. J. Light. Technol. 2014, 32, 2849–2861. [Google Scholar] [CrossRef]
  3. Cygan, A.; Lisak, D.; Morzyński, P.; Bober, M.; Zawada, M.; Pazderski, E.; Ciuryło, R. Cavity Mode-Width Spectroscopy with Widely Tunable Ultra Narrow Laser. Opt. Express 2013, 21, 29744. [Google Scholar] [CrossRef] [PubMed]
  4. Capmany, J.; Novak, D. Microwave Photonics Combines Two Worlds. Nat. Photon 2007, 1, 319–330. [Google Scholar] [CrossRef]
  5. Wang, G.; Jang, Y.-S.; Hyun, S.; Chun, B.J.; Kang, H.J.; Yan, S.; Kim, S.-W.; Kim, Y.-J. Absolute Positioning by Multi-Wavelength Interferometry Referenced to the Frequency Comb of a Femtosecond Laser. Opt. Express 2015, 23, 9121. [Google Scholar] [CrossRef] [Green Version]
  6. Schnatz, H.; Terra, O.; Predehl, K.; Feldmann, T.; Legero, T.; Lipphardt, B.; Sterr, U.; Grosche, G.; Holzwarth, R.; Hansch, T.W.; et al. Phase-Coherent Frequency Comparison of Optical Clocks Using a Telecommunication Fiber Link. IEEE Trans. Ultrason. Ferroelect. Freq. Contr. 2010, 57, 175–181. [Google Scholar] [CrossRef]
  7. Langley, L.N.; Elkin, M.D.; Edge, C.; Wale, M.J.; Gliese, U.; Huang, X.; Seeds, A.J. Packaged Semiconductor Laser Optical Phase-Locked Loop (OPLL) for Photonic Generation, Processing and Transmission of Microwave Signals. IEEE Trans. Microw. Theory Techn. 1999, 47, 1257–1264. [Google Scholar] [CrossRef] [Green Version]
  8. Xu, L.; Jin, S.; Ding, D.; Li, Y. Monolithically Integrated Virtual Balanced ACP-OPLL for PM RF Photonic Links. J. Light. Technol. 2018, 36, 789–796. [Google Scholar] [CrossRef]
  9. Steed, R.J.; Ponnampalam, L.; Fice, M.J.; Renaud, C.C.; Rogers, D.C.; Moodie, D.G.; Maxwell, G.D.; Lealman, I.F.; Robertson, M.J.; Pavlovic, L.; et al. Hybrid Integrated Optical Phase-Lock Loops for Photonic Terahertz Sources. IEEE J. Select. Top. Quantum Electron. 2011, 17, 210–217. [Google Scholar] [CrossRef]
  10. Li, Y.; Xu, L.; Jin, S.; Rodriguez, J.; Sun, T.; Herczfeld, P. Wideband OPLL Photonic Integrated Circuit Enabling Ultrahigh Dynamic Range PM RF/Photonic Link. Optica 2019, 6, 1078. [Google Scholar] [CrossRef]
  11. Ristic, S.; Bhardwaj, A.; Rodwell, M.J.; Coldren, L.A.; Johansson, L.A. An Optical Phase-Locked Loop Photonic Integrated Circuit. J. Light. Technol. 2010, 28, 526–538. [Google Scholar] [CrossRef]
  12. Satyan, N.; Liang, W.; Kewitsch, A.; Rakuljic, G.; Yariv, A. Coherent Power Combination of Semiconductor Lasers Using Optical Phase-Lock Loops. IEEE J. Select. Top. Quantum Electron. 2009, 15, 240–247. [Google Scholar] [CrossRef] [Green Version]
  13. Bałakier, K.; Fice, M.J.; Ponnampalam, L.; Graham, C.S.; Wonfor, A.; Seeds, A.J.; Renaud, C.C. Foundry Fabricated Photonic Integrated Circuit Optical Phase Lock Loop. Opt. Express 2017, 25, 16888. [Google Scholar] [CrossRef] [PubMed]
  14. Steed, R.J.; Pozzi, F.; Fice, M.J.; Renaud, C.C.; Rogers, D.C.; Lealman, I.F.; Moodie, D.G.; Cannard, P.J.; Lynch, C.; Johnston, L.; et al. Monolithically Integrated Heterodyne Optical Phase-Lock Loop with RF XOR Phase Detector. Opt. Express 2011, 19, 20048. [Google Scholar] [CrossRef] [PubMed] [Green Version]
  15. Satyan, N. Phase Noise Reduction of a Semiconductor Laser in a Composite Optical Phase-Locked Loop. Opt. Eng 2010, 49, 124301. [Google Scholar] [CrossRef] [Green Version]
  16. Imajuku, W.; Takada, A. In-Line Optical Phase-Sensitive Amplifier with Pump Light Source Controlled by Optical Phase-Lock Loop. J. Light. Technol. 1999, 17, 637–646. [Google Scholar] [CrossRef]
  17. Lu, M.; Park, H.; Bloch, E.; Sivananthan, A.; Bhardwaj, A.; Griffith, Z.; Johansson, L.A.; Rodwell, M.J.; Coldren, L.A. Highly Integrated Optical Heterodyne Phase-Locked Loop with Phase/Frequency Detection. Opt. Express 2012, 20, 9736. [Google Scholar] [CrossRef]
  18. Ponnampalam, L.; Fice, M.J.; Pozzi, F.; Renaud, C.C.; Rogers, D.C.; Lealman, I.F.; Moodie, D.G.; Cannard, P.J.; Lynch, C.; Johnston, L.; et al. Monolithically Integrated Photonic Heterodyne System. J. Light. Technol. 2011, 29, 2229–2234. [Google Scholar] [CrossRef]
  19. Arafin, S.; Simsek, A.; Kim, S.-K.; Dwivedi, S.; Liang, W.; Eliyahu, D.; Klamkin, J.; Matsko, A.; Johansson, L.; Maleki, L.; et al. Towards Chip-Scale Optical Frequency Synthesis Based on Optical Heterodyne Phase-Locked Loop. Opt. Express 2017, 25, 681. [Google Scholar] [CrossRef]
  20. Balakier, K.; Fice, M.J.; Ponnampalam, L.; Seeds, A.J.; Renaud, C.C. Monolithically Integrated Optical Phase Lock Loop for Microwave Photonics. J. Light. Technol. 2014, 32, 3893–3900. [Google Scholar] [CrossRef]
  21. Gliese, U.; Nielsen, T.N.; Bruun, M.; Lintz Christensen, E.; Stubkjaer, K.E.; Lindgren, S.; Broberg, B. A Wideband Heterodyne Optical Phase-Locked Loop for Generation of 3-18 GHz Microwave Carriers. IEEE Photon. Technol. Lett. 1992, 4, 936–938. [Google Scholar] [CrossRef] [PubMed] [Green Version]
  22. Grant, M.; Michie, W.; Fletcher, M. The Performance of Optical Phase-Locked Loops in the Presence of Nonnegligible Loop Propagation Delay. J. Light. Technol. 1987, 5, 592–597. [Google Scholar] [CrossRef]
  23. Tang, L.; Yang, S.; Chen, H.; Chen, M. Hybrid Integrated Low Noise Optical Phase-Locked Loop Based on Self-Injection Locked Semiconductor Laser. J. Light. Technol. 2022, 40, 2033–2039. [Google Scholar] [CrossRef]
  24. Herzog, F.; Kudielka, K.; Erni, D.; Bachtold, W. Optical Phase Locking by Local Oscillator Phase Dithering. IEEE J. Quantum Electron. 2006, 42, 973–985. [Google Scholar] [CrossRef]
  25. Feng, Z.; Zhang, X.; Wu, R.; Sun, Y.; Wei, F.; Yang, F.; Gui, Y.; Cai, H. High-Gain Optical Injection Locking Amplifier in Phase-Coherent Optical Frequency Transmission. IEEE Photonics J. 2019, 11, 1–9. [Google Scholar] [CrossRef]
  26. Ramos, R.T.; Seeds, A.J. Delay, Linewidth and Bandwidth Limitations in Optical Phase-Locked Loop Design. Electron. Lett. 1990, 26, 389. [Google Scholar] [CrossRef]
  27. Ramos, R.T.; Seeds, A.J. Comparison between First-Order and Second-Order Optical Phase-Lock Loops. IEEE Microw. Guid. Wave Lett. 1994, 4, 6–8. [Google Scholar] [CrossRef]
  28. Balakier, K.; Ponnampalam, L.; Fice, M.J.; Renaud, C.C.; Seeds, A.J. Integrated Semiconductor Laser Optical Phase Lock Loops. IEEE J. Select. Top. Quantum Electron. 2018, 24, 1–12. [Google Scholar] [CrossRef] [Green Version]
  29. Gardner, F.M. Phaselock Techniques; Wiley: Hoboken, NJ, USA, 2005; pp. 282–335. [Google Scholar]
  30. Bordonalli, A.C.; Walton, C.; Seeds, A.J. High-Performance Phase Locking of Wide Linewidth Semiconductor Lasers by Combined Use of Optical Injection Locking and Optical Phase-Lock Loop. J. Light. Technol. 1999, 17, 328–342. [Google Scholar] [CrossRef] [Green Version]
  31. Best, R.E. Phase-Locked Loops: Design, Simulation, and Applications; McGraw-Hill Education: New York, NY, USA, 2007; pp. 67–70. [Google Scholar]
  32. Arafin, S.; Simsek, A.; Lu, M.; Rodwell, M.J.; Coldren, L.A. Heterodyne Locking of a Fully Integrated Optical Phase-Locked Loop with on-Chip Modulators. Opt. Lett. 2017, 42, 3745. [Google Scholar] [CrossRef]
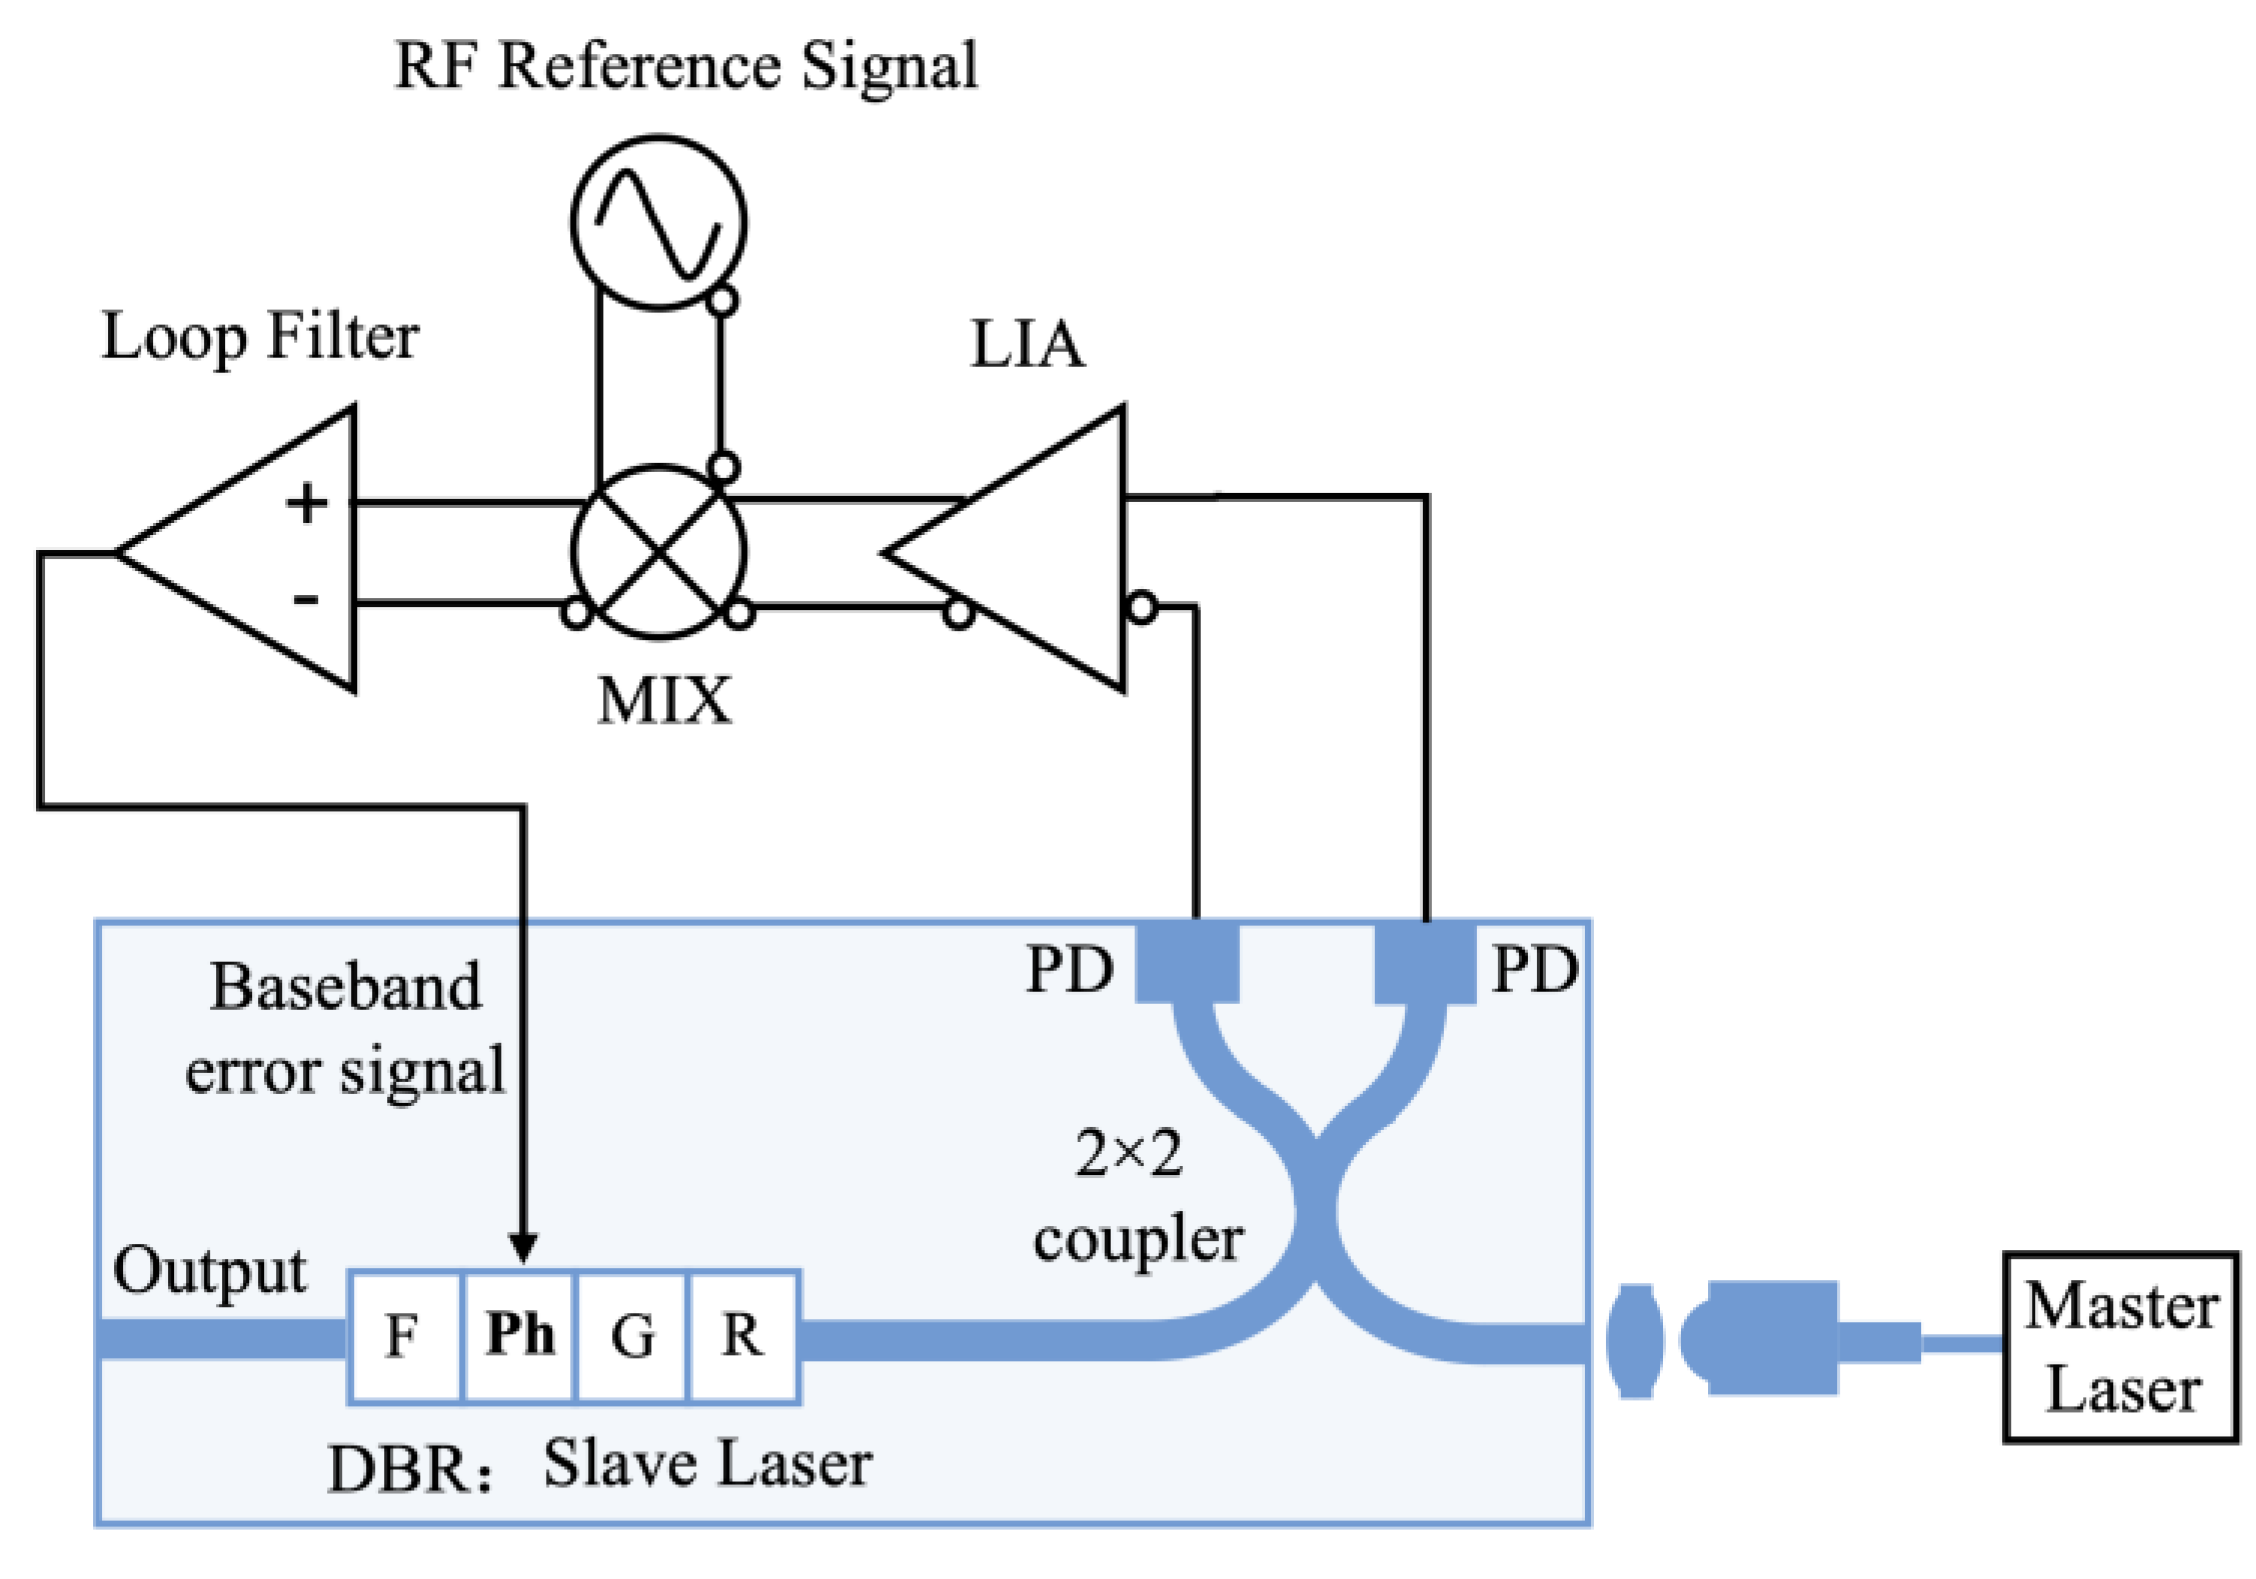
Figure 1. Schematic diagram of PIC-based heterodyne OPLL (PD: Photodetector, LIA: Limiting amplifier, MIX: Mixer, R: Rear DBR mirror, Ph: Phase, G: Gain, F: Front DBR mirror, DBR: Distributed Bragg Reflector).
Photonics 10 00336 g001
Figure 2. The block diagram of our PIC-based heterodyne OPLL (the definition of each parameter will be shown in paragraph 2 of Section 2.1).
Photonics 10 00336 g002
Figure 3. The open-loop amplitude/phase-frequency response of PIC-based heterodyne OPLL.
Photonics 10 00336 g003
Figure 4. The initial closed-loop amplitude/phase-frequency response of PIC-based heterodyne OPLL.
Photonics 10 00336 g004
Figure 5. The effects of the loop gain on the loop bandwidth (a) the closed-loop amplitude-frequency response; (b) the closed-loop phase-frequency response; (c) the influence of the loop gain on the amplitude of relaxation oscillation, loop bandwidth, and initial phase reversal frequency point; (d) the influence of the loop gain on the maximum summed linewidth and the maximum tolerable loop delay.
Photonics 10 00336 g005
Figure 6. The effects of the loop delay on the loop bandwidth (a) the closed-loop amplitude-frequency response; (b) the closed-loop phase-frequency response; (c) the influence of the loop delay on the loop bandwidth, relaxation oscillation amplitude, and initial phase reversal frequency point.
Photonics 10 00336 g006
Figure 7. The influences of three parameters on the phase noise characteristics (a) loop gain; (b) loop delay; (c) summed linewidth; (d) the dependence of the residual phase noise variance on the loop gain, loop delay, and summed linewidth; (e) the relationship between SNR and the loop gain.
Photonics 10 00336 g007
Figure 8. The influence of the laser power on the loop phase noise characteristics (a) the residual phase noise spectra with the different ML and same SL power; (b) the dependence of the residual phase noise variance on the loop delay, summed linewidth, and ML power; (c) the constrained relationships between these parameters with the residual phase noise variance of 0.02 rad2.
Photonics 10 00336 g008
Table 1. OPLL design parameters.
OPLLParametersSymbolValueUnits
optical pathML linewidth Δ f M L 100kHz
ML initial power P M L −10dBm
SL initial linewidth Δ f S L 10MHz
SL phase tuning sensitivity k S L 2.496 ×   10 6 GHz/A
SL initial power P S L 0dBm
RF reference signal power P r 6.98dBm
PD responsivity R P D 0.85A/W
electrical pathLIA gain k L I A 100-
MIX gain k m i x 10-
loop filter gain k L F 10-
loop filter time constant τ 1 7.49 ×   10 10 s
τ 2 7.49 ×   10 9 s
overall OPLLcycle slip time T a v 1000s
Disclaimer/Publisher’s Note: The statements, opinions and data contained in all publications are solely those of the individual author(s) and contributor(s) and not of MDPI and/or the editor(s). MDPI and/or the editor(s) disclaim responsibility for any injury to people or property resulting from any ideas, methods, instructions or products referred to in the content.