Article

Excimer Laser Surface Patterning for Photoluminescence Enhancement of Silicon Nanocrystals

1
Institut für Nanophotonik Göttingen e.V., Hans-Adolf-Krebs-Weg 1, 37077 Göttingen, Germany
2
IV. Physical Institute, University of Göttingen, Friedrich-Hund-Platz 1, 37077 Göttingen, Germany
*
Author to whom correspondence should be addressed.
Photonics 2023, 10(4), 358; https://doi.org/10.3390/photonics10040358
Submission received: 2 March 2023 / Revised: 20 March 2023 / Accepted: 21 March 2023 / Published: 23 March 2023

Abstract

:
A method for enhancing the photoluminescence of silicon nanocrystals in a silicon oxide matrix by fabrication of periodic surface structures through laser irradiation is demonstrated. ArF excimer lasers are used to produce periodic line structures by material ablation. Photoluminescence, Raman, and transmission electron microscope measurements consistently show the formation of crystalline silicon after high-temperature annealing. A 2.6-fold enhancement of photoluminescence signal is measured for a periodic line structure with 600 nm period. The influence of a surface structure on the photoluminescence from the silicon oxide layer is discussed in terms of a simple model describing the main effect.

1. Introduction

The development of a pure silicon-based light-emitting device would not only eliminate the need for more expensive and toxic III–V compound semiconductors, but would also enable the integration of photonics into silicon-based microelectronics. Therefore, the research on efficient light emission from silicon has become an important subject in recent years [1,2,3,4,5,6,7,8,9], which is a challenging task due to the indirect band gap of bulk silicon. Modifying the band structure of silicon can increase the efficiency of light emission as exemplified by silicon nanocrystals (Si-Nc) exhibiting a much higher light emission efficiency compared to bulk silicon [2,3,4]. Although details of processes underlying the Si-Nc photoluminescence are still under debate, it can be attributed, at least in part, to the quasi-direct band gap of Si-Nc due to confinement effects at a size of or below about 5 nm [2,10,11,12,13]. Details to be considered involve the effect of the Si-Nc surrounding matrix and size-related strain effects [14,15] as well as interaction between densely packed Si-Nc [16]. Finally, defect centers at the crystal surface also have a crucial impact on the efficiency of photoluminescence [10,13,14,17,18].
The increase in efficiency, however, is still too small for practical applications. Hence, there have been different approaches to enhance the light emission efficiency of silicon nanocrystals. Many approaches aim at the reduction of non-radiative recombination channels; a number of strategies are possible depending on the particular non-radiative channel under consideration.
First of all, the production method of the nanocrystalline silicon plays a major role. The chosen method not only determines the size of the crystals, which affects the optical band gap, but also the configuration of the surrounding matrix [19,20]. Canham discovered room temperature photoluminescence of nanoporous silicon produced by electrochemical dissolution of silicon wafers [2]. With the following growth in research interest about nanocrystalline silicon, other methods evolved for their generation. A simple method is a thermally driven phase separation of substoichiometric silica, e.g., SiO, into SiO2, and Si [19,20,21]. This is accomplished by heating to temperatures above 900 °C [19]. Further control on the size of silicon nanocrystals has been achieved by thermal annealing of multilayer systems of alternating SiO2 and SiO [4,13]. Additionally, locally resolved nanocrystal production is possible by laser-induced phase separation [22]. Other manufacturing methods include plasma-enhanced chemical vapor deposition [23,24,25], sputtering [1,26], and implantation of silicon ions into a host matrix [27,28,29].
Further focus has been put on the interface between silicon nanocrystals and the surrounding matrix, which may strongly affect the efficiency of light emission. Defect states at the interface of the nanocrystals potentially add non-radiative recombination channels and therefore lower light emission efficiency. Hence, defect engineering of such states has been extensively studied, proving hydrogen passivation, e.g., by heating in a hydrogen atmosphere [30], to be beneficial. Defects, in particular at the Si–SiO2 interface such as dangling bonds, are associated with deep states. Hence, they serve as (typically) non-radiative recombination channels (Shockley–Read–Hall recombination [31,32]) and thus reduce light emission. A saturation of these dangling bonds with hydrogen therefore reduces the non-radiative recombination rates considerably, and thus increases the light emission of Si-Nc [19]. Besides hydrogen passivation, oxygen, nitrogen, or carbon-based passivation have also been reported [33]. A positive aspect common to these methods is their mostly negligible effect on the core of the nanocrystals [33]. Moreover, doping with other elements like phosphorus or boron can increase the efficiency of light emission [1,33].
Finally, plasmonic nanoparticles, like gold nanoparticles, lead to efficiency enhancement of the nanocrystals’ light emission. Nanoparticles in close proximity to the nanocrystals can lead to an efficiency increasing coupling effect [34,35,36].
A fundamentally different approach used in many light-emitting devices aims at an improved outcoupling of emitted light from a highly refractive layer, e.g., by the periodic structuring of surfaces. As an example, enhanced photoluminescence (PL) was measured on GaN nanostructures in this way [37]. These improvements in emission efficiency are due to a reduction in losses due to total internal reflection in highly refractive layers.
The influence of surface structures on the PL of samples containing Si-Nc has barely been studied so far or in combination with other parameters. The correlation between PL and surface roughness was investigated. In this study, however, the roughness was varied by different growth temperatures during sample preparation. This not only changed the roughness, but also other properties such as the oxygen content [38]. Periodic platinum arrays were also used to increase the PL. In this case, plasmonic effects also play a role [39]. The effect by surface structures on the PL of Si-Nc, without plasmonic or other influences, was studied by surface structuring in the form of a two-dimensional photonic crystal. In this study, PL light propagating in a layer is Bragg diffracted out of the samples, leading to an increase in light extraction efficiency in a small spectral range [40].
In this work, the enhancement of PL of silicon nanocrystals inside a substoichiometric silicon oxide matrix (SiOx, x ≈ 1) by surface structuring is presented. It is shown that modifying the surface topography by irradiation of SiOx, with commercially available argon fluoride (ArF) excimer laser irradiation (λ = 193 nm), leads to a significant increase of the PL signal over the whole spectral range. Since laser irradiation potentially affects the Si-Nc [41,42], the strategy of our experiments is, besides merely proving enhanced PL, to elucidate nanostructural changes by means of Raman spectroscopy and transmission electron microscopy. Following this concept, such changes can be ruled out as the source of enhanced PL emission. Hence, periodic surface structuring is identified as its underlying mechanism, which is substantiated by model calculations.
The paper is structured as follows. First, the methods for sample preparation, processing, and analysis are presented. Subsequently, as the main observation, the enhanced PL emission is described and related to surface topography using scanning electron microscopy (SEM) and atomic force microscopy (AFM). Laser-induced structural modifications are described in Section 3.3 and Section 3.4. Finally, results are summarized and discussed in the light of model calculations.

2. Materials and Methods

2.1. Sample Preparation

The preparation of the samples is identical to the methods described in a previous work [34]. In summary, SiOx coatings were prepared by thermal evaporation of SiO on polished fused silica substrates. During a heating step in nitrogen atmosphere at 1050 °C for one hour, silicon nanocrystals (Si-Nc) were prepared. The formation of the Si-Nc is caused by a thermally induced partial phase separation of the SiOx into Si and SiO2. The silicon crystallizes, resulting in the formation of Si-Nc. An inert nitrogen atmosphere was ensured by nitrogen flow with 99.999% N2. The volume of the furnace is purged approximately 1.5 times per minute. A subsequent hydrogen passivation at 540 °C for two hours was performed to reduce surface–interface non-radiative recombination at defect states at the crystals surface. For this process, a forming gas with 5% H2 and 95% N2 was used at the same flow rate. Nitrogen purging was performed during the heating ramps. Heating was conducted in a quartz tube with a Nabertherm R50/250/13 furnace.

2.2. Laser Irradiation

Laser irradiation was performed with pulsed ArF excimer lasers (λ = 193 nm), with a pulse length of typically 20 ns. Three setups were used. One for areal irradiation with a homogeneous fluence profile, and two setups for structured irradiation with an inhomogeneous fluence profile to generate line gratings with different periods. The parameters for all three laser treatments are shown in Table 1. A more detailed description of the setup for homogeneous irradiation is also described in [34]. The processes for structured laser irradiation are similar, except for the imaging lens and the mask, and are schematically sketched in Figure 1. A homogeneous part of the laser beam traverses a rectangular chrome mask and fused silica phase mask (refractive index n = 1.56) with a binary height profile in the form of a line grating of certain periodicity [43]. As the height “d” of lines is chosen for destructive interference at a wavelength of λ = 193 nm (d = λ/(2 * (n − 1)) = 173 nm), the beam mainly splits up into the ±first orders. The first orders of the laser beam are then united on the sample surface by the imaging lens, and produce a sinusoidal interference pattern of period “P”. To suppress any superstructure, the zeroth order, the 2nd, and higher orders are blocked in front of the imaging lens for the setups using a fused silica phase mask. In all three setups, a variable attenuator in the beam path enables fluence variation. The energy deposited on the sample is measured with a pyroelectric sensor (Ophir, PE10BF-C, Jerusalem, Israel). Subsequent to the laser irradiation, a cleaning step is performed to remove any debris from the sample surface. A KOH-based cleaning agent (Deconex 15PF-x, Zuchwil, Switzerland) is mixed with deionized water at a ratio of 1:2. The samples were cleaned with this mixture for 10 min in an ultrasonic bath. To remove any residual detergent, the samples were then sonicated in deionized water for 10 min. Subsequently, the samples were dried by nitrogen flow without contact to avoid any contamination.
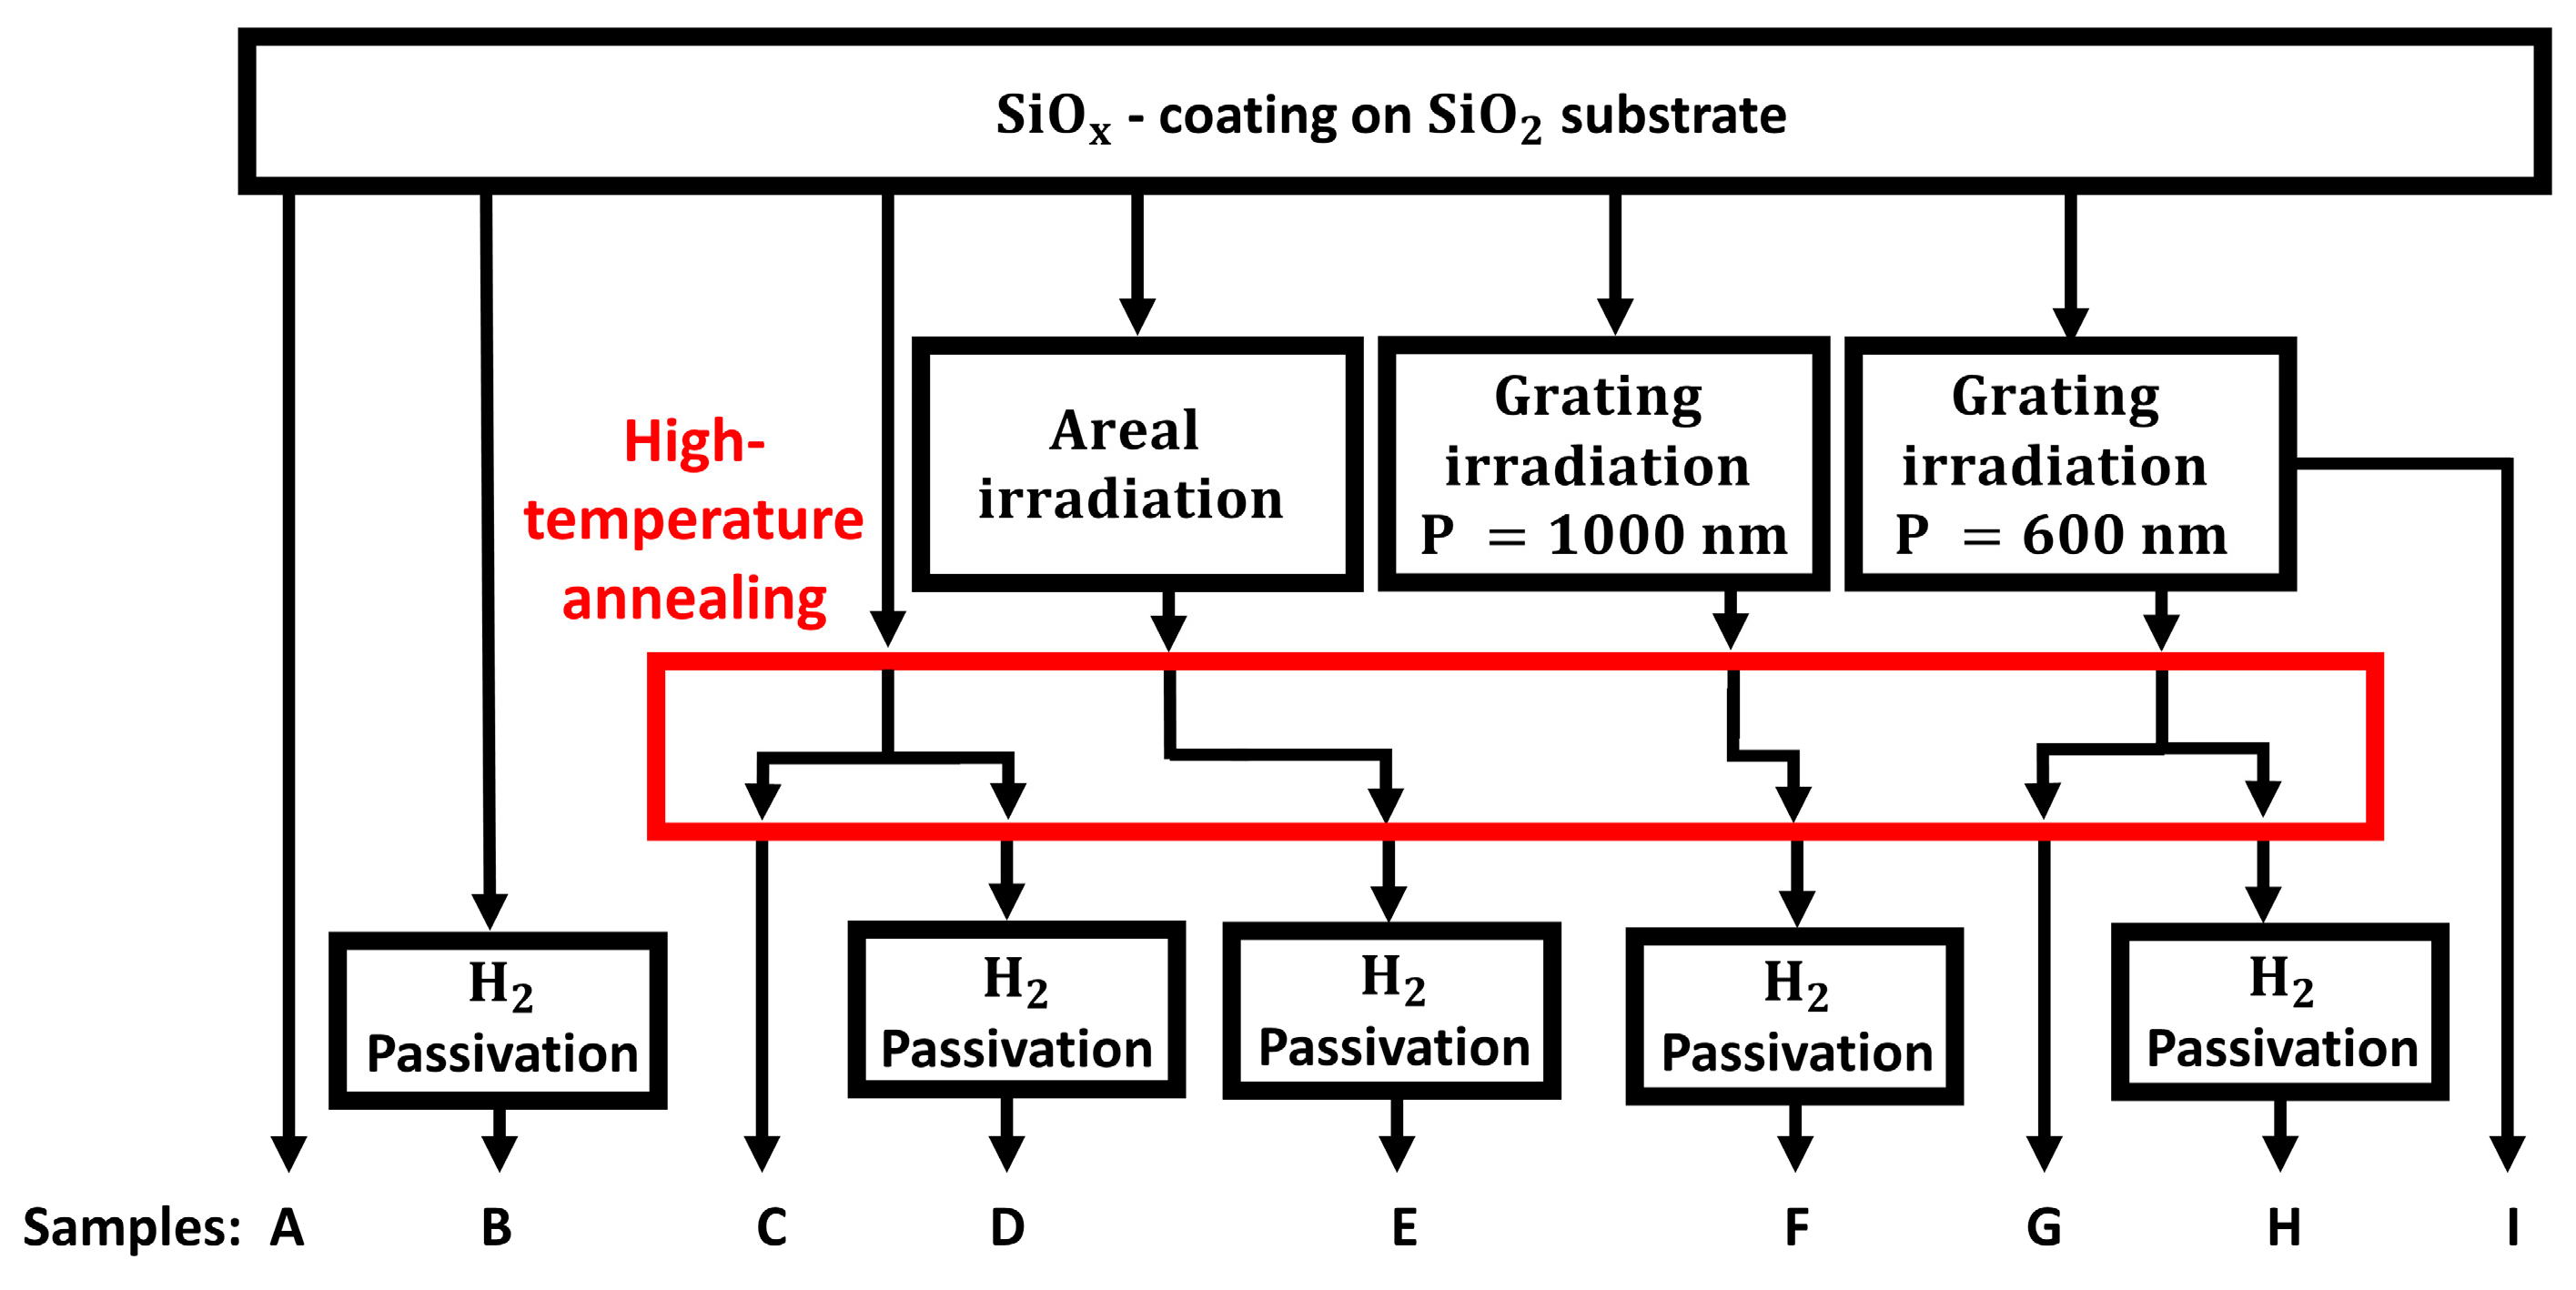
In order to precisely assign the samples to the respective treatments, a process diagram for all samples is shown in Figure 2. A letter is assigned to each individual sample as its name (“A” to “I”). In the following, a description of the processing procedure is given for each sample in addition to the process diagram. The thickness of the SiOx coating is always 1050 nm. Sample “A” is as coated. Sample “B” is hydrogen passivated after the coating process. Sample “C” is high-temperature annealed after the coating process. Sample “D” is high-temperature annealed after the coating process and subsequently hydrogen passivated. Sample “E” is laser irradiated with a homogeneous fluence after the coating process and subsequently high-temperature annealed and hydrogen passivated. Sample “F” is laser irradiated with the objective lens setup (line grating with P = 1000 nm) after the coating process and subsequently high-temperature annealed and hydrogen passivated. Sample “G” is laser irradiated with the Schwarzschild objective setup (line grating with P = 600 nm) after the coating process and subsequently high-temperature annealed. Sample “H” went through the same process as sample “G” with subsequent hydrogen passivation. Sample “I” was laser irradiated with the Schwarzschild objective setup (line grating with P = 600 nm) after the coating process.

2.3. Sample Analysis

The photoluminescence (PL) of the samples was analyzed with two customized fiber-coupled grating spectrometers (Ocean Optics HDX and NirQuest + 1.7) at room temperature. The measured data were not further smoothed; therefore, the difference between the two measuring instruments in the spectral interval of the data points as well as the signal-to-noise ratio is visible in the spectra. The photoluminescence setup was calibrated using a fiber-coupled calibration lamp (HL-2000-LL, Ocean Optics, Orlando, USA) in the sample position to include all optical components in the calibration. A smooth transition of the data of the two spectrometers was ensured by multiplying the data of the NIR spectrometer by a numeric factor. Excitation of the samples was performed with a continuous laser diode (λ = 405 nm, Coherent OBIS 405 nm LX 100 mW) on a homogeneous irradiated spot size of 220 µm diameter with a power of 0.85 mW, resulting in a power density of approximately 2240 mW/cm2. The photoluminescence light was measured in reflection while the excitation light was blocked by a dichroic mirror and a longpass filter. The numerical aperture of the lens was 0.6. A more detailed description of the PL setup can be found in our previous work [34]. Even though the intensity units are given in arbitrary units, the intensity scale is comparable between individual measurements.
The formation of silicon nanocrystals was analyzed by transmission electron microscopy (TEM) using a 300 kV FEI Titan G2 ETEM equipped with an image Cs-corrector (CEOS CETCOR) and Gatan Imaging Filter (GIF). Samples were prepared by focused ion beam thinning (FEI Helios FIB) of cross section lamellas, and thus coated with polycrystalline Pt in order to protect the surface during milling. High-resolution phase-contrast imaging (information limit dinfo ≈ 0.1 nm) reveals the local crystallinity of selected sample regions. Annular dark-field scanning transmission electron microscopy (STEM, 10 mrad beam convergence) reveals mass–thickness and diffraction contrast features across the entire layer thickness. The chemical composition of the samples, in particular the Si:O ratio, was measured to within ±3% from energy-dispersive X-ray spectroscopy (EDX) measurements in scanning mode, using the SiO2 substrate as an internal reference [44]. In addition, STEM energy loss spectroscopy data was recorded from the low-loss region of the spectra (0–100 eV). In this region, plasmon excitations generate strong peaks around 17 eV and 23 eV which can be correlated with silicon rich clusters and SiOx, respectively [45]. These peaks were fitted by Lorentzians of fixed position and variable width/height in order to enhance the contrast of the nanocrystalline Si-rich clusters. A surface analysis of the samples was performed by scanning electron microscopy (SEM; Zeiss EVO MA10, Oberkochen, Germany). Material analysis was performed by Raman microscopy (Raman Horiba Xplora Plus, λ = 532 nm, Kyoto, Japan). Surface topography of the samples was measured by atomic force microscopy (AFM; Park Systems, XE-150, Suwon, Korea). Film thickness and transmission data were measured with an optical layer thickness measurement device (Filmetrics F20-UV with LS-DT2 light source, Unterhaching, Germany).

3. Experimental Results

This section starts out from describing the enhanced PL resulting from laser-induced surface structuring and subsequent furnace annealing and hydrogen passivation (Section 3.1), followed by a thorough characterization of surface topographies deduced from SEM and AFM (Section 3.2). Subsequently, structural changes of Si-Nc related to laser irradiation are investigated by Raman spectroscopy (Section 3.3) and TEM-based techniques (Section 3.4).

3.1. Photoluminescence Measurements

First, the results of the PL measurements of all samples are presented. No sample shows measurable PL within our setup sensitivity without the high-temperature annealing. Therefore, the PL data of these samples (“A”, “B”, and “I”) are not presented.
After high-temperature heating, a PL signal is measurable as is shown in Figure 3 for samples without the final hydrogen passivation, i.e., samples “C” (no laser irradiation) and “G” (600 nm line grating). It is noteworthy, that unlike PL enhancement due to plasmonic effects, the laser treatment of the surface increases the PL across the whole spectrum. The increase in intensity is shown in Table 2. It is labeled “area fraction” and was calculated by integrating the PL spectra.
Since the shape of the PL signals indicates at least contributions from three individual bands, both data sets are fitted with three individual Gaussian functions (the fits of Figure 3 are shown exemplarily in the Supplementary Material in Figure S1). The resulting positions of the Gaussian functions (λi; i = 1,2,3) and their relative area fractions (fi) are listed in Table 2. As it can be seen from the positions of the Gaussian functions, the PL peaks undergo a blue shift when comparing the data of the laser-treated sample with the data of the non-laser-treated sample. The blue shift of the main peak amounts to 19 nm.
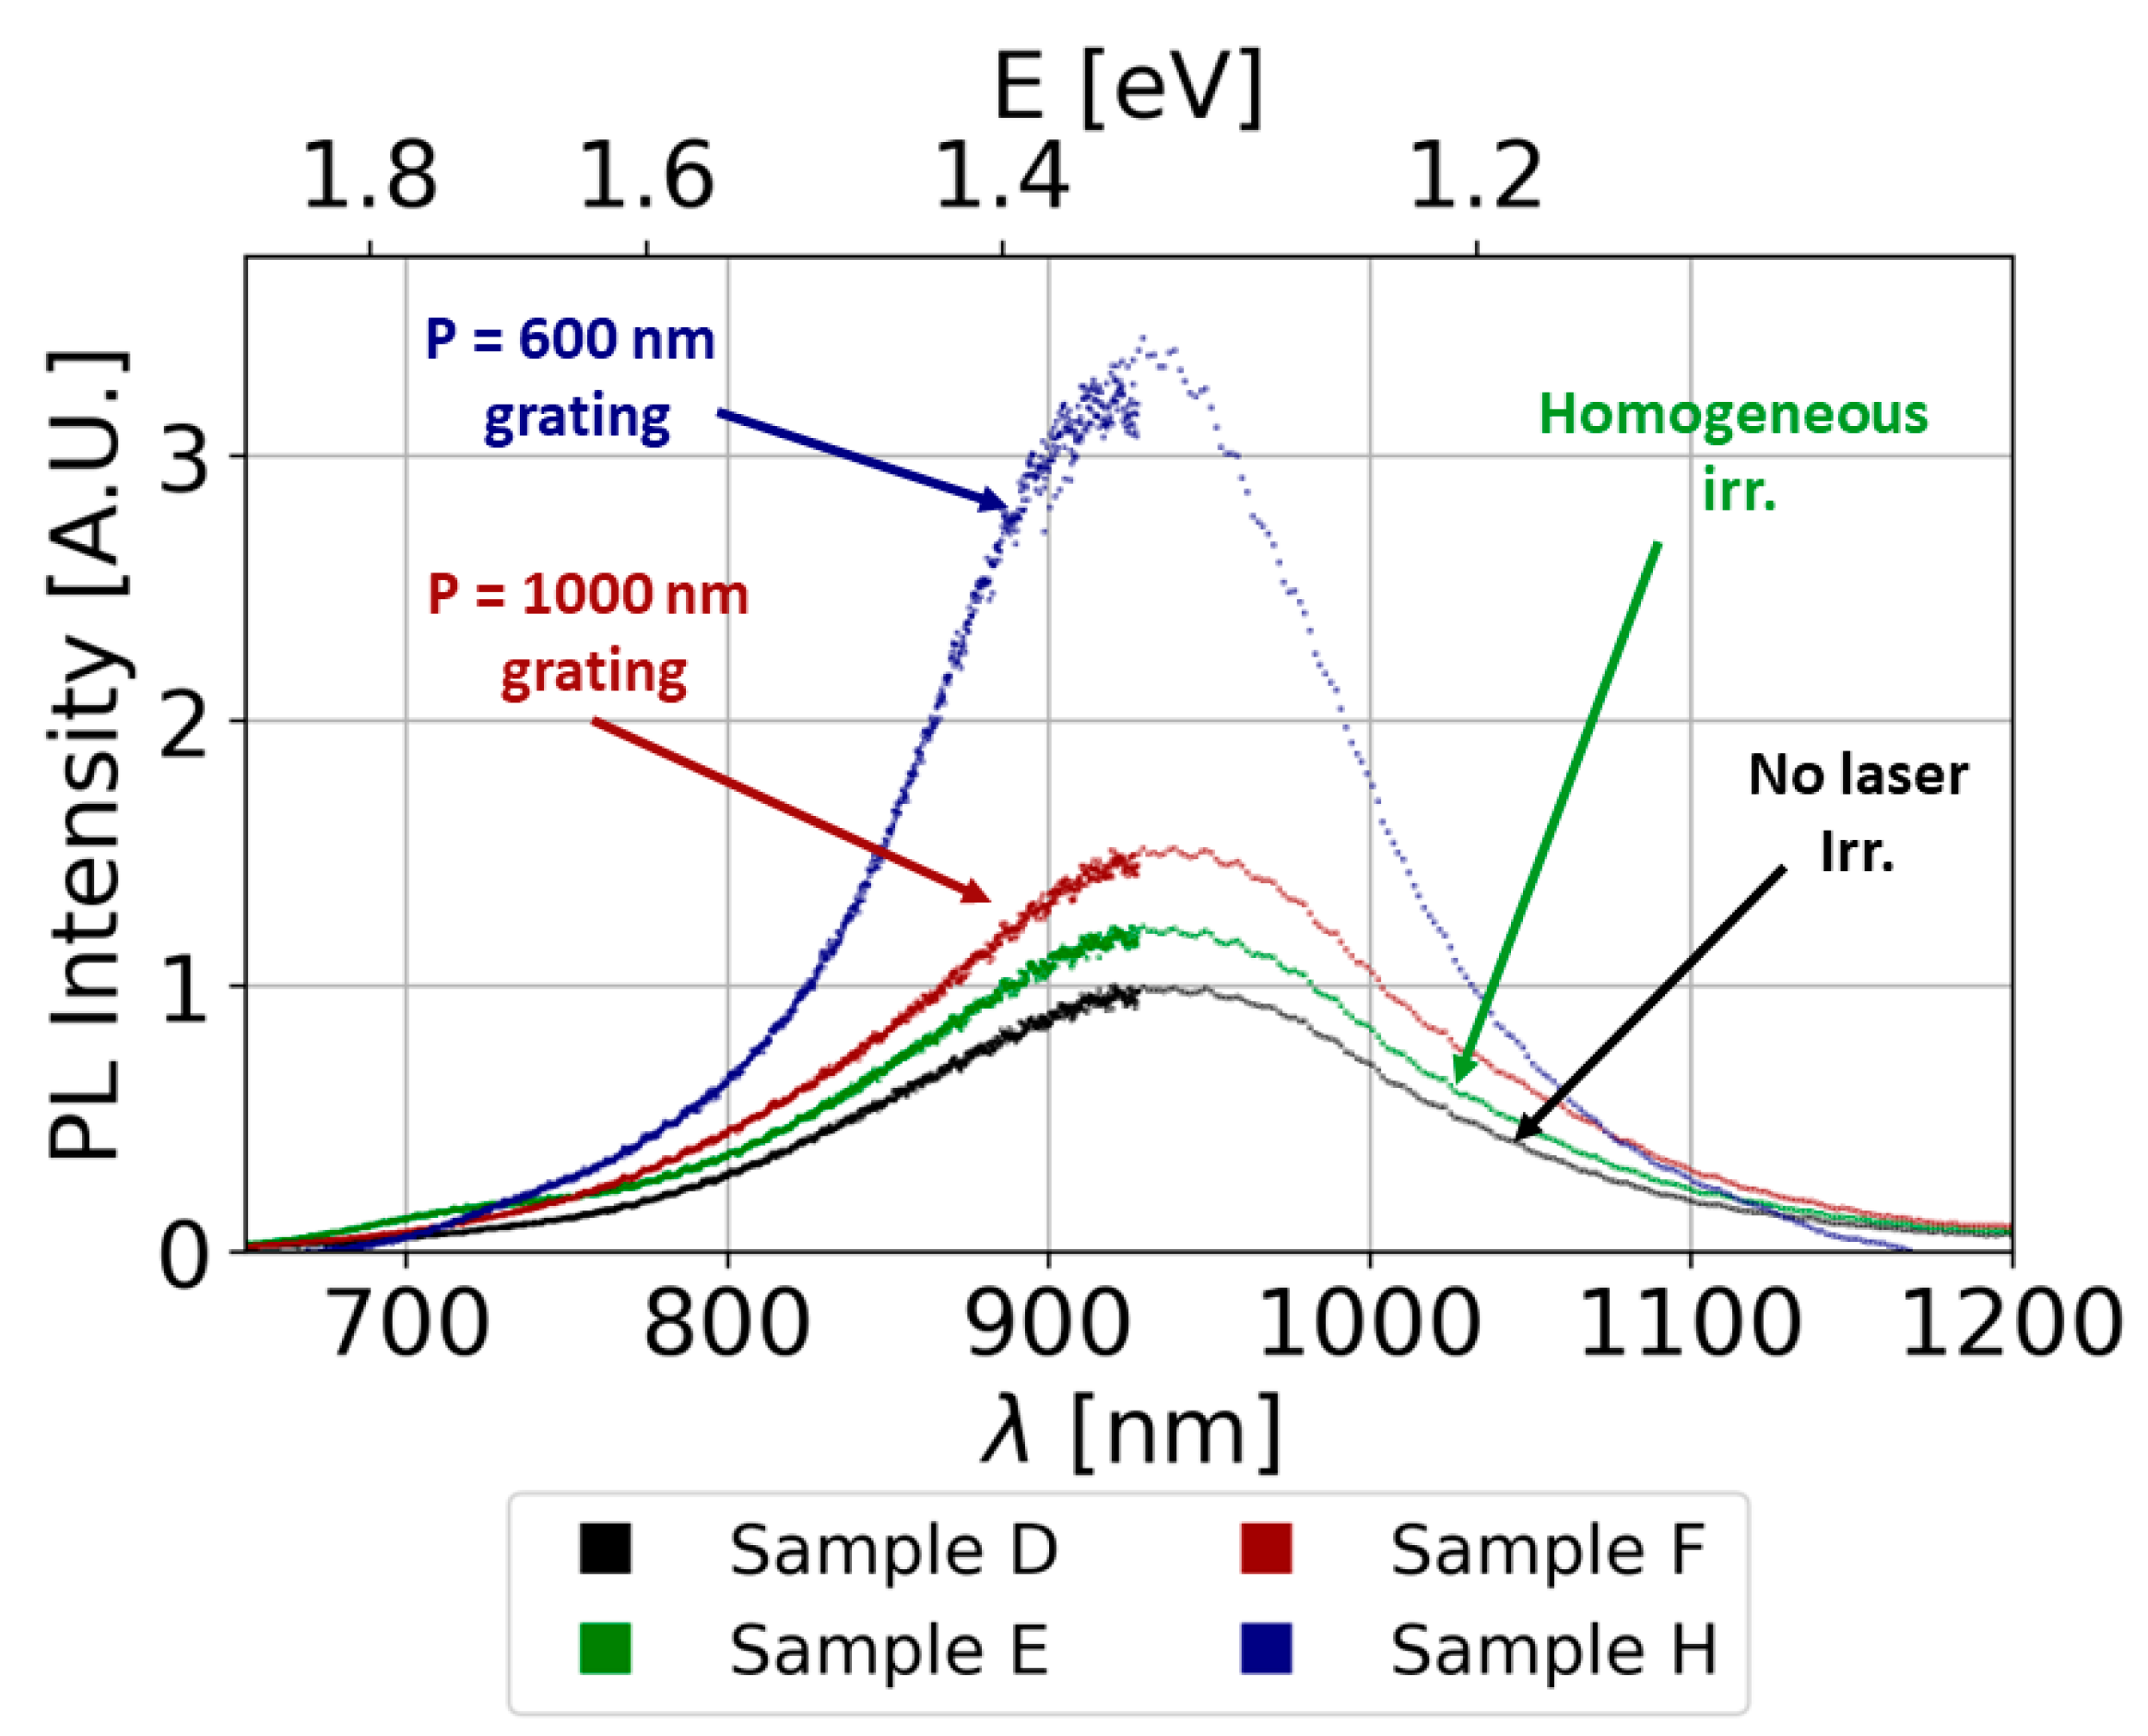
A further PL signal enhancement is obtained if a final hydrogen passivation is added to the processing scheme. This is shown in Figure 4 for those samples (“D”, “E”, “F”, and “H”) subjected to hydrogen passivation. The enhancement of the PL signal due to hydrogen passivation was calculated by integrating the PL spectra. The results are listed in Table 2. Besides the signal increase, a red shift of the main peak of about 8 nm for the samples without laser processing (sample “C” and “D”), and a red shift of about 20 nm for the samples with the grating structure with a period of 600 nm (samples “G” and “H”), can be measured. When comparing the shape of the PL spectra, it is also clear that the spectra are more symmetrical after hydrogen passivation than before hydrogen passivation. In detail, it can be seen that the increase in PL intensity mainly affects the main peak around 900 nm, while the side peaks around 700 nm to 800 nm are much less affected by the hydrogen passivation. This is evident from the small proportions of the area fractions f2 and f3 of the side peaks after hydrogen passivation in Table 2, compared to the samples before hydrogen passivation.
Furthermore, as before hydrogen passivation, the PL signal is dependent on the surface laser treatment. The enhancements are summarized in Table 2.
In summary, no PL is measurable without high-temperature annealing. High-temperature annealing results in measurable PL, which can be enhanced by subsequent hydrogen passivation. Specific laser structuring of the surface results in enhanced PL. In the following chapters, the individual studies of the samples for identifying the causes of the PL enhancement are presented.

3.2. AFM and SEM Measurements of the Laser Irradiated Samples

In this section, analyses of surface structures by AFM and SEM measurements of the laser-irradiated SiOx surfaces are shown (samples “E”, “F”, “G”, “H”, and “I”). The laser irradiation with homogeneous fluence (500 mJ/cm2, one laser pulse, sample “E”) across the area results in a rather smoothly ablated area with a depth of about 100 nm. Results of such experiments, concerning the ablation behavior, can be found in the literature [46].
The structured irradiation results in a line grating on the surface formed by SiOx ablation. Results regarding the ablation process can also be found in literature and are therefore only briefly discussed here [47]. The height profile corresponds to the fluence distribution on the sample during ablation and is sinusoidal in shape. The period of the line grating generated with the Schwarzschild objective is about 594 ± 16 nm, and the period of the grating generated with the objective lens is about 1020 ± 20 nm. In both cases, one laser pulse was used at a fluence of 640 mJ/cm2 (averaged over the entire area). An SEM image of the structured SiOx surface with the grating produced with the Schwarzschild objective (sample “H”) can be seen in Figure 5. The line structure shows a uniform period and mostly smooth surfaces. Some defects, like pores, can be seen on the surface. Isolated surface impurities are also visible. AFM measurements show a variation in the height of the structures ranging from 80 nm to 140 nm, depending on the location in the laser-irradiated spot. AFM measurements of the structured SiOx surface with the grating produced with the objective lens (sample “F”) show a structure height of 90 nm to 150 nm.

3.3. Raman Measurements

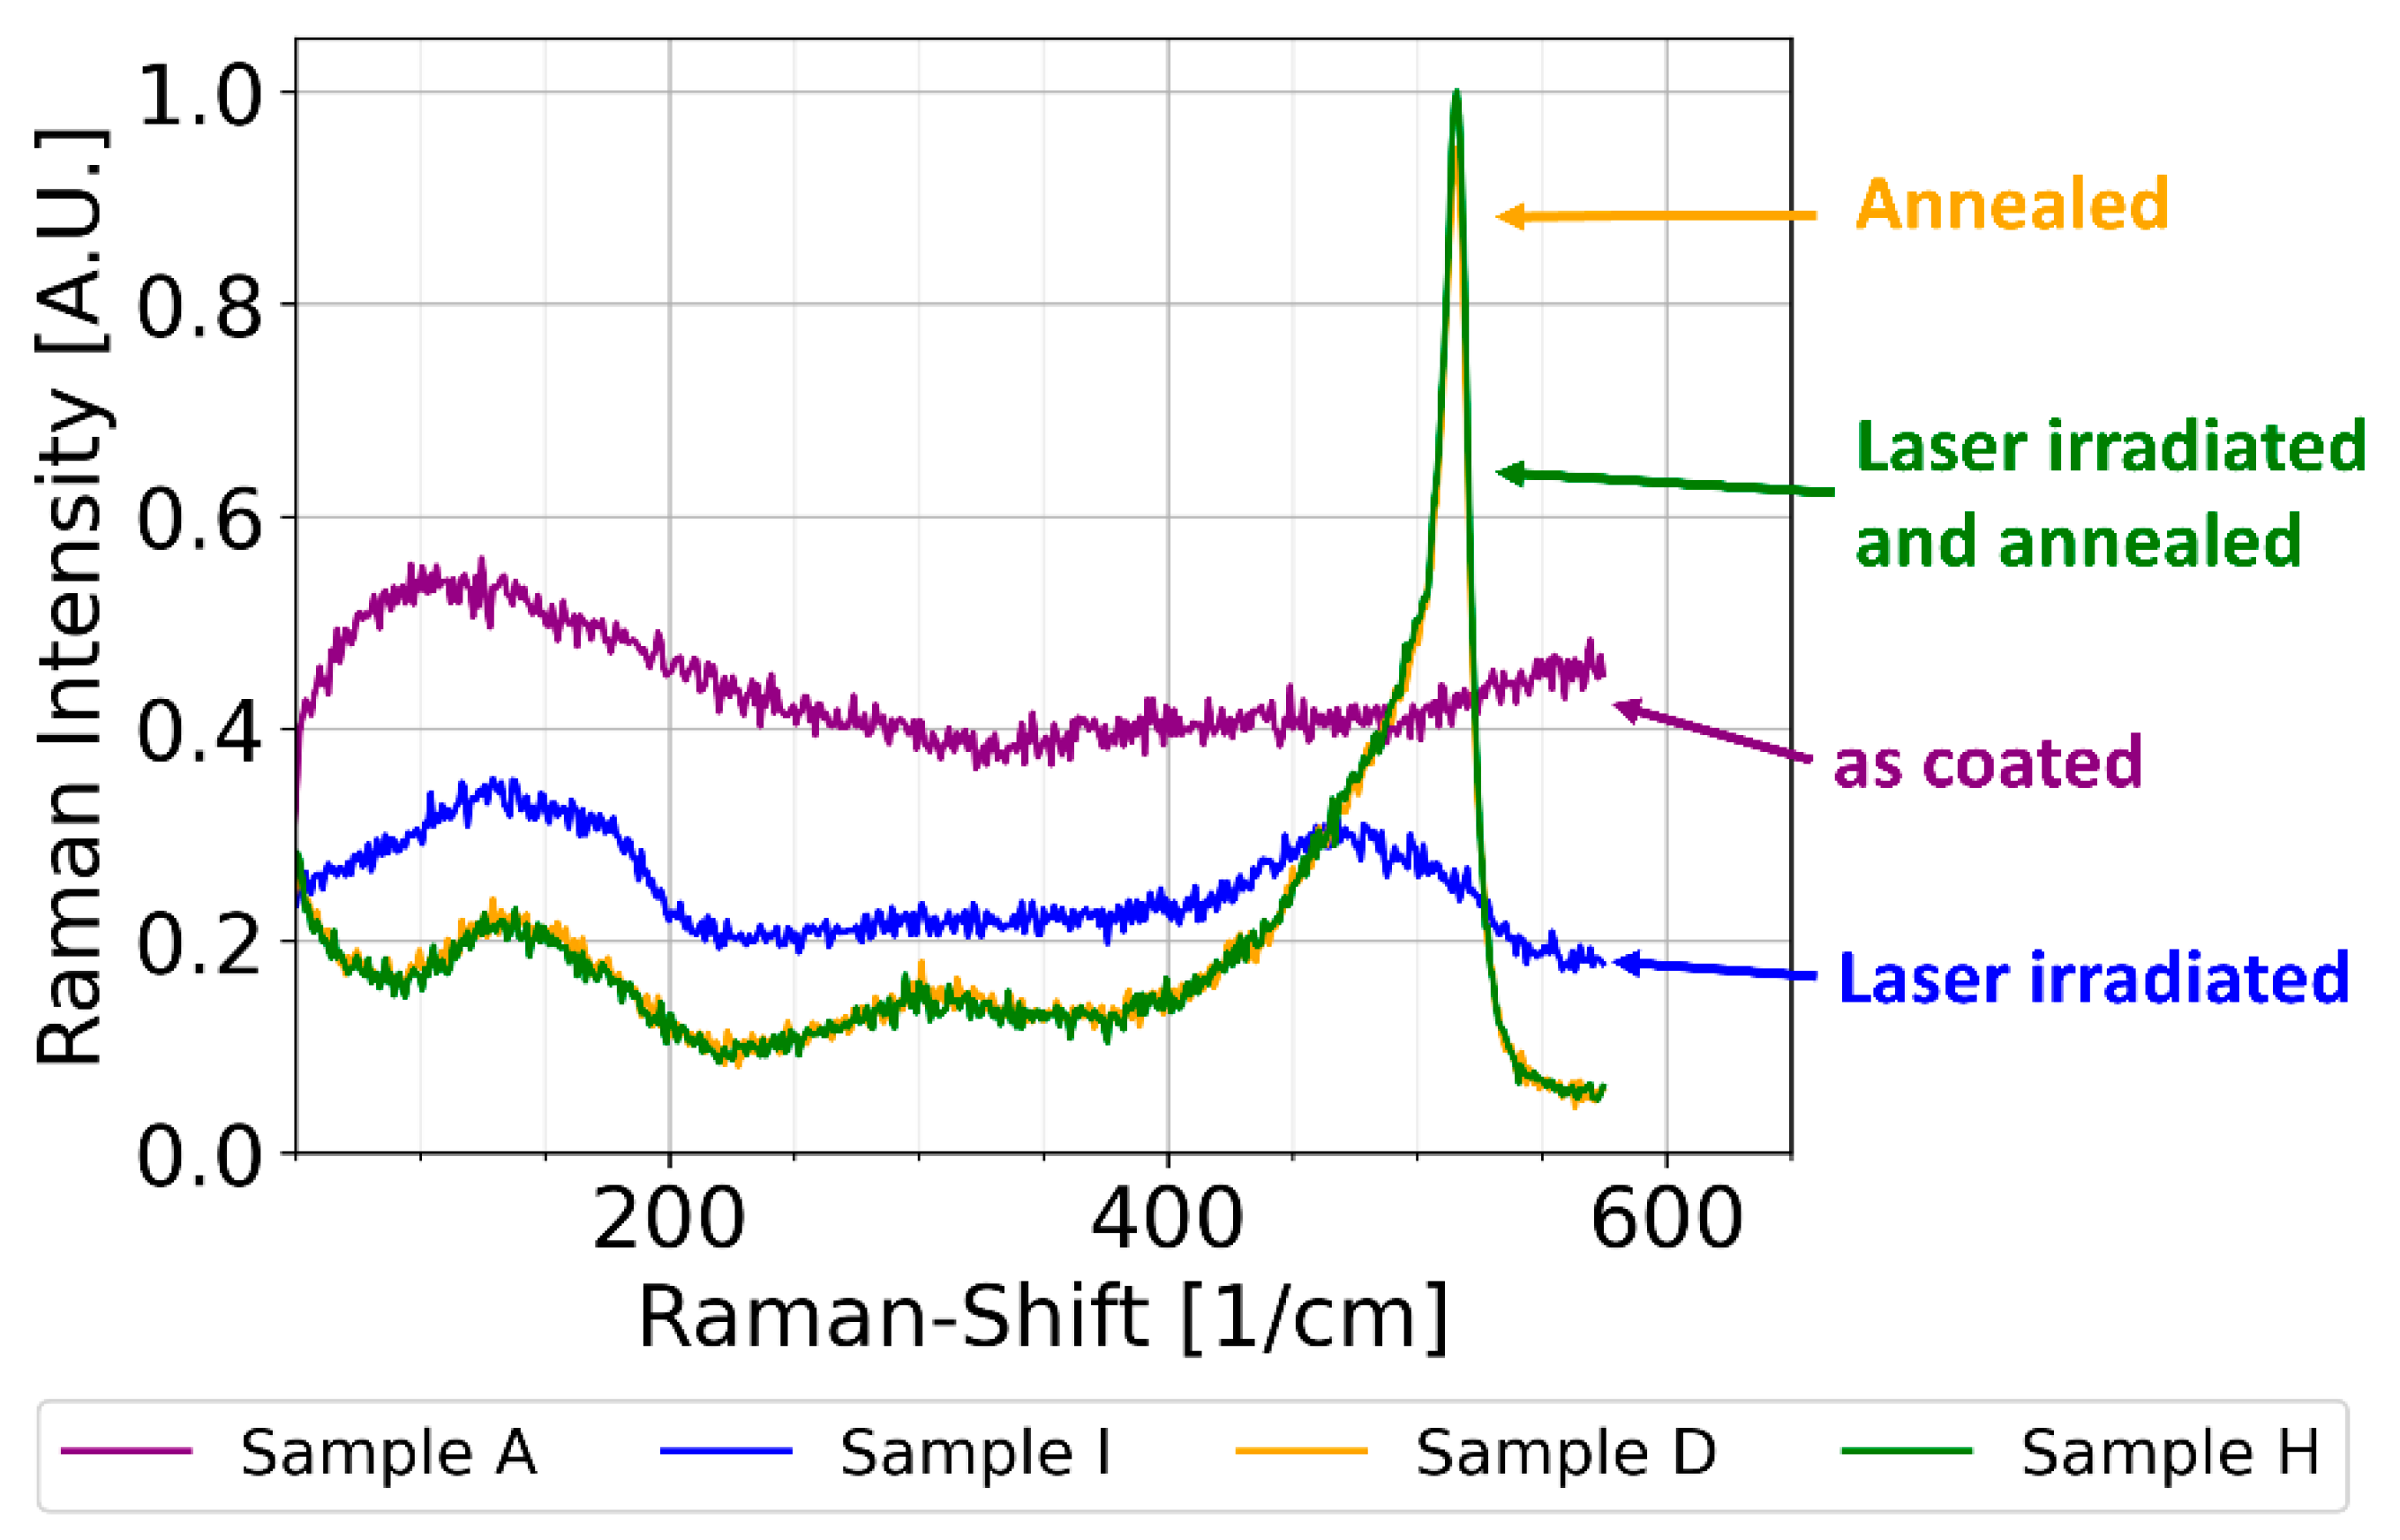
Raman measurements were carried out to investigate structural effects on the SiOx layers due to the furnace processes and laser processing. Prior to the high-temperature annealing, Raman measurements show an unspecific signal (Figure 6). Only a slight difference between the sample with the 600 nm grating (sample “I”) and the sample without laser processing (sample “A”) is visible around 470 cm−1 as a broad and non-intense peak. This peak could indicate amorphous silicon with a significant amount of (non-radiative) heterogeneous defect states [22,48]. Heating at low temperature for the purpose of passivation (540 °C, sample “B”) does not change the signal significantly. High-temperature annealing changes the Raman signal significantly. Measurements of a SiOx sample without laser processing (sample “D”) and with a 600 nm grating structure (sample “H”) are shown. The sharp peak at 515 cm−1 can be attributed to crystalline silicon [49]. This indicates the thermally induced phase separation, producing crystalline silicon. No clear difference is measurable between the Raman signals of the heated samples with and without laser irradiation. All Raman measurements have been corrected for a measurement of the SiO2 substrate. These structural studies are complemented by TEM analyses in the following chapter.

3.4. TEM Measurements

TEM measurements were performed to investigate the structural properties of the as-coated SiOx layer (sample “A”) and the influence of the furnace (sample “H”) and laser processes (sample “I”).
Without further processing, the SiOx coatings (sample “A”) show no indications of crystalline silicon nanoparticles. Therefore, the TEM images are not shown. A native oxide layer SiO2 of 3 nm thickness is measurable on the surface. This is also confirmed by measurements with the optical layer thickness measurement device.
STEM-EDX measurements show a constant ratio of silicon-to-oxygen throughout the SiOx layer, with an average composition of SiO1.08 ± 0.02 prior to the high-temperature annealing and SiO1.02 ± 0.02 after the high-temperature annealing. These minor differences in oxygen content may have occurred during production or processing and should not be attributed to the annealing process. Partial inhomogeneities inside the SiOx with a cluster size below 1 nm indicate the presence of amorphous silicon clusters.
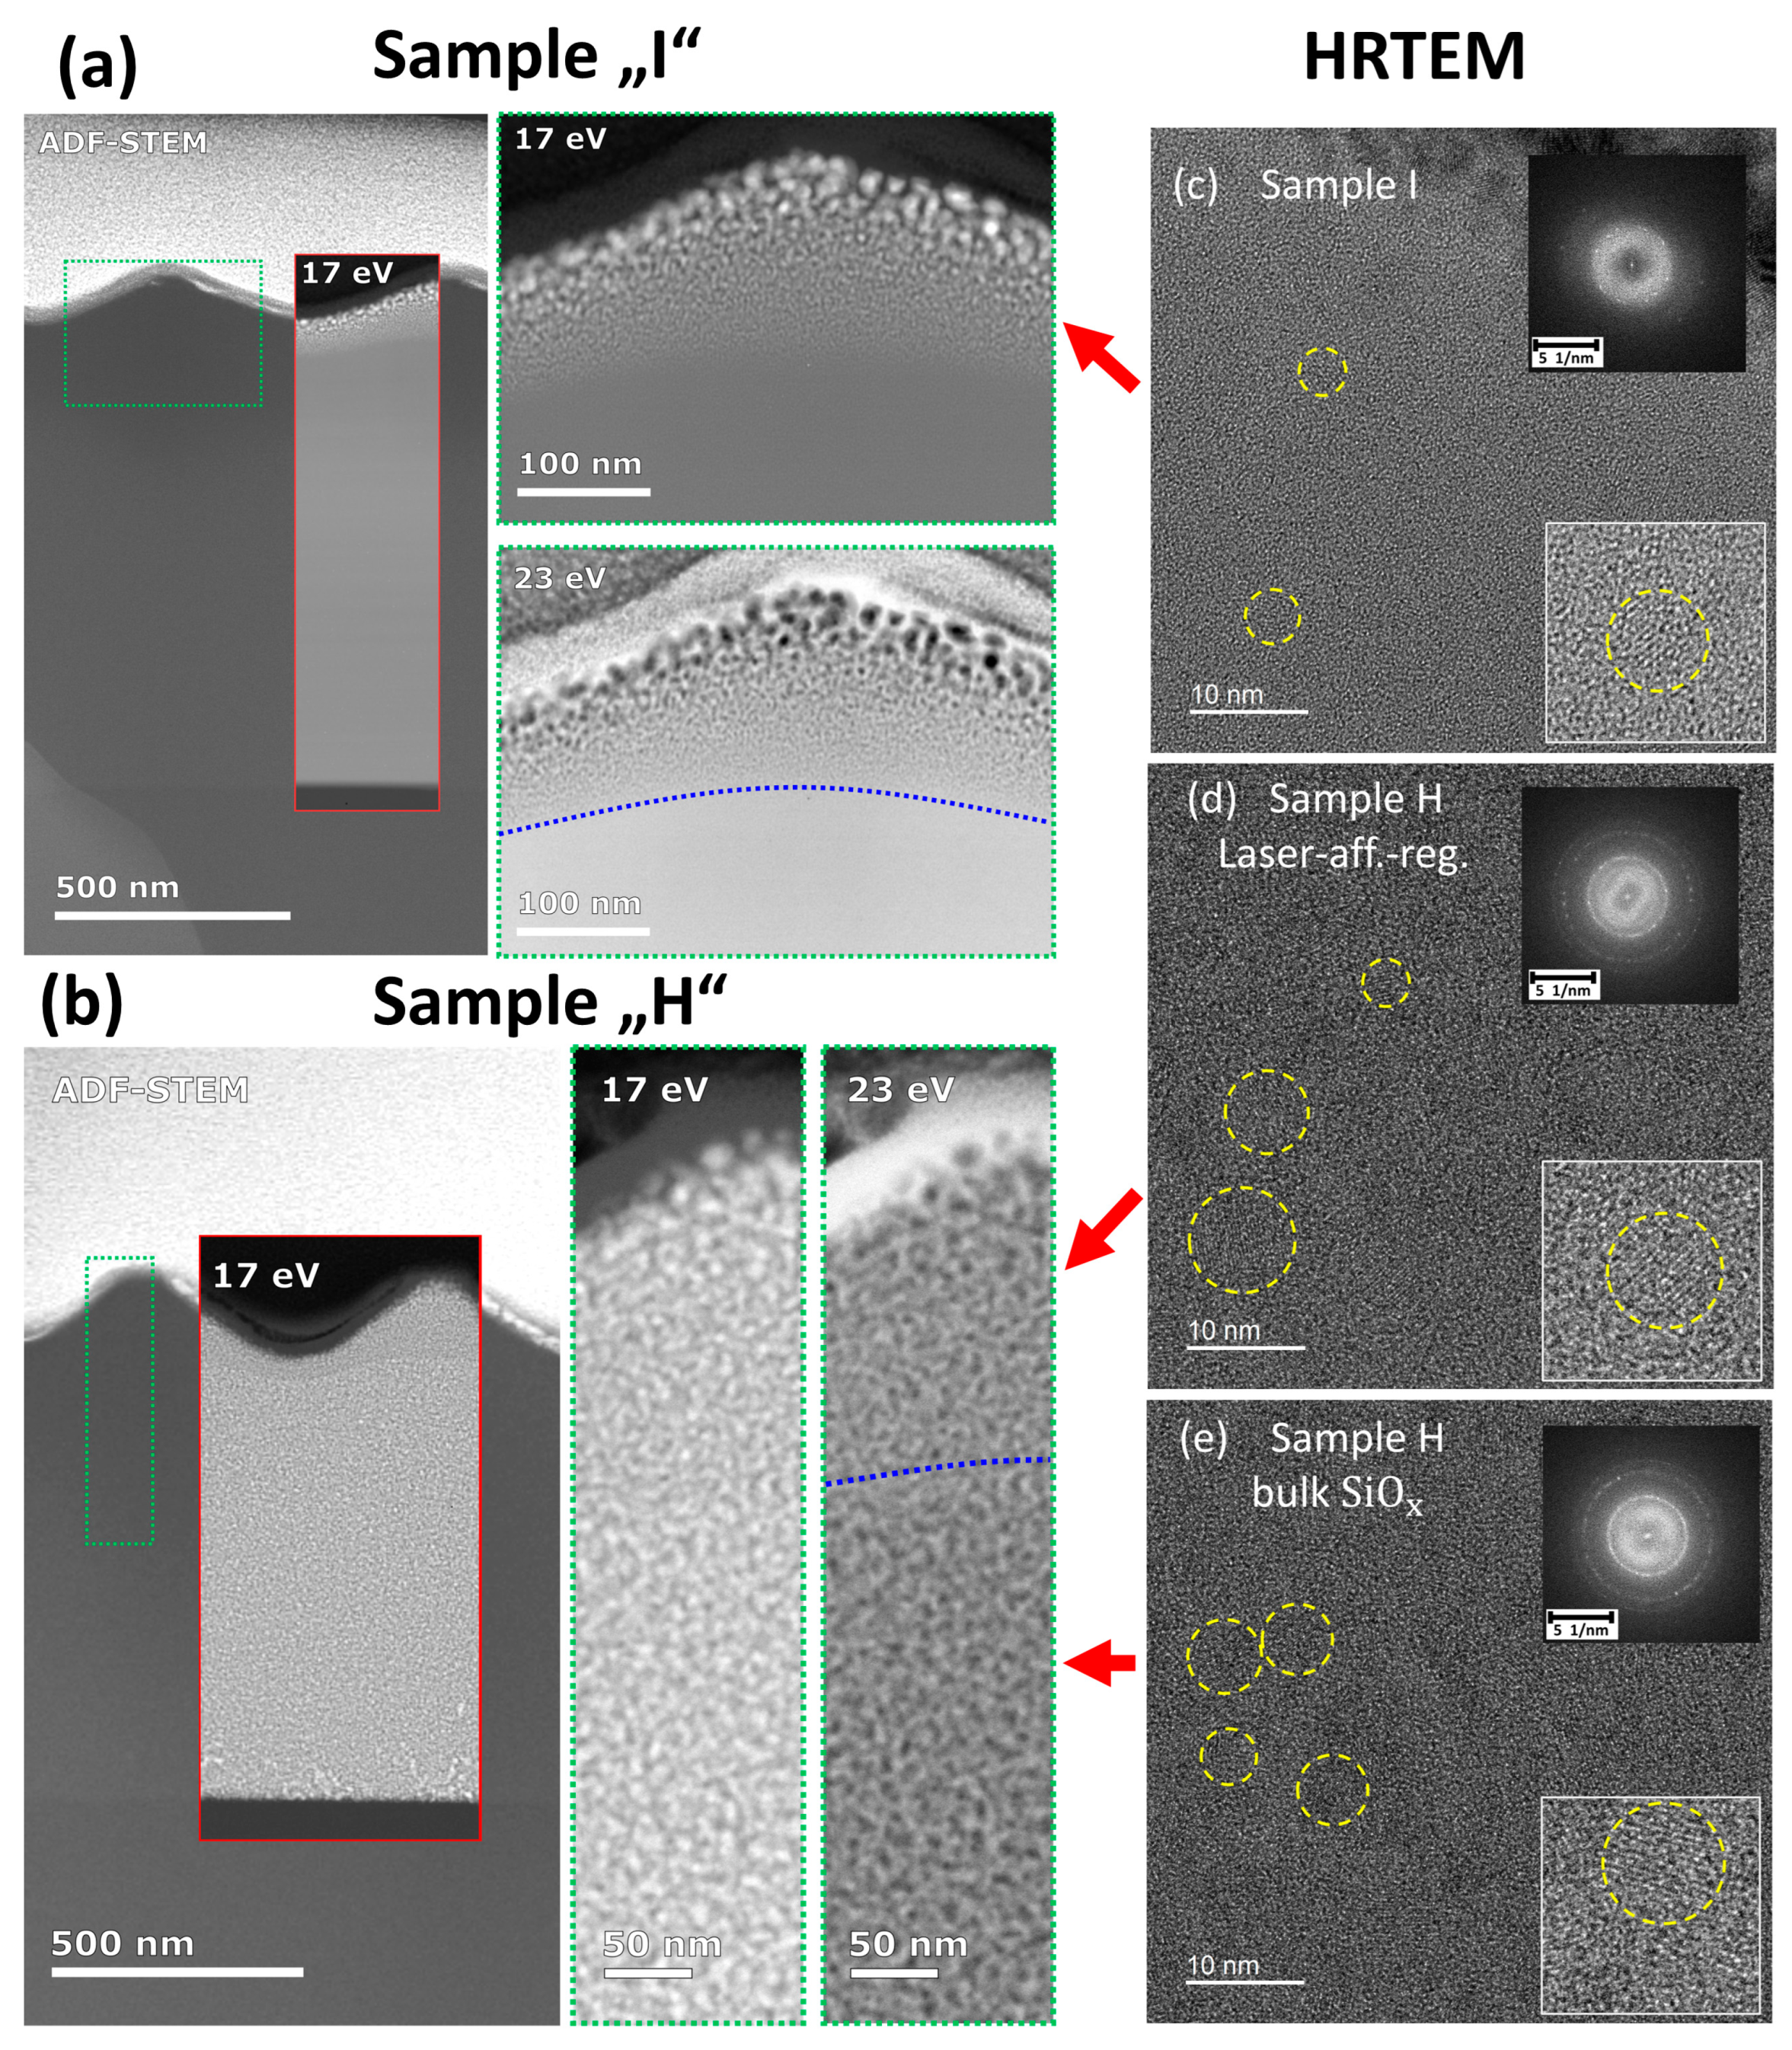
Laser structuring produces surface structures, as visible in the TEM cross sections in Figure 7a,b. Figure 7a shows a periodic surface profile with a peak height of 80 nm of the sample, which was laser structured with a grating with a period of 600 nm without subsequent furnace processes (sample “I”). This part will be discussed in more detail first. An overview of the cross section is shown in the left part. The entire SiOx layer, with the interface to the substrate in the lower part, is visible. Part of the image was replaced with the energy filtered image for 17 eV (silicon plasmonic energy loss, highlighting nanoparticles) to get an overview of the entire SiOx layer. It is evident that silicon nanoparticles are present near the surface. This can be deduced from the region marked green, which is shown as enlarged energy-filtered STEM images for energy losses of 17 eV and 23 eV corresponding to plasmonic losses in silicon and silicon oxide, respectively. Here, the occurrence of silicon nanoparticles near the surface is clearly visible. The presence of crystalline silicon nanoparticles is supported by HRTEM measurements close to the surface (Figure 7c). An important observation is a distinct size gradient with the size of the silicon nanoparticles decreasing with distance from the surface. The depth of the silicon nanoparticles layer is measured to be 110 nm under the hills and 75 nm under the valleys, and therefore roughly follows a ‘dampened’ profile of the surface topography as shown by the dashed blue line. Below these depths, no silicon nanoparticles are detectable. A relation of the depth of silicon nanoparticles to the thermal diffusion length of SiOx for 20 ns laser pulses is suggestive, since the depth of the silicon nanoparticles corresponds to this diffusion length [50]. In summary, laser irradiation, even without heating processes, produces silicon nanoparticles in a near-surface region with a distinct size gradient. The depth of the silicon nanoparticles corresponds to the thermal diffusion of the laser used for structure production. Note, however, that no PL signal within the detection limit is measurable for this sample.
For comparison, Figure 7b shows analogous data for sample ‘H’, which—in addition to the laser irradiation (sample ‘I’ shown in Figure 7a)—has been subjected to furnace annealing and final hydrogen passivation. As a result, silicon nanoparticles are obtained in the entire SiOx layer. The energy-filtered inset for 17 eV in the left part clearly shows two regions separated by a rather abrupt boundary with silicon nanoparticles, which differ in particle size. The boundary is indicated by the dashed blue line in the energy-filtered image for 23 eV. The top area again roughly follows a dampened profile of the surface topography. It is called “laser-affected-region” and has a different depth below the valley (43 nm) and peak (150 nm). This corresponds roughly to the thermal diffusion length of SiOx for 20 ns laser pulses [50]. The SiOx layer below this boundary is called “bulk-SiOx”. The typical sizes of the Si-Nc in the regions were determined using HRTEM measurements. Si-Nc diameters ranging from 3 nm to 5.3 nm in the “laser-affected-region”, and 3.8 nm to 11.5 nm in the “bulk-SiOx”, were measured (Figure 7d,e). The “bulk-SiOx” region shows the same Si-Nc size distribution as a sample that was not laser structured prior to the heating processes (sample “D”, not shown). In both cases, the energy loss measurements show a homogeneous distribution of amorphous silicon and silicon nanoparticles over the whole bulk SiOx region. However, an increase of the Si-Nc size in close vicinity to the substrate interface is shown, which we attribute to inhomogeneities in the initial SiOx deposition process.
Comparing the TEM measurements before and after the heating process (sample “I” and “H” respectively), some aspects are striking. First, each region, the “laser-affected-region” and the “bulk-SiOx”, exhibits a homogeneous size distribution of Si-Nc after the heating process. The size gradient of silicon nanoparticles, which had been formed by the laser irradiation, was erased by the heating process. Instead of the area with the size gradient of silicon nanoparticles, an area with smaller Si-Nc has formed as a result of the heating process. It is striking here that a clear boundary appears before and after the heating process. Second, the density of crystalline silicon nanoparticles is lower when comparing the laser-treated sample (sample “I”) with the sample after the furnace process (sample “H”). This can be deducted from the FT insets in the HRTEM images. In addition, the TEM measurements show a significantly thicker SiO2 layer (16–30 nm) on the surface of the heated sample (“H”) than the unheated sample (“I”). The largest oxide thickness occurs in the valleys, while the hills show a smaller oxide layer. The optical layer thickness measurement device measures a similar value with 20 nm, although no spatially resolved measurement is possible. The high-temperature annealing thus leads to a partial oxidation of the surface, despite the nitrogen atmosphere. Finally, we note that the apparently different amplitude of the surface gratings in Figure 7a (sample ‘I’) and Figure 7b (sample ‘H’) has to be attributed to a non-homogeneous fluence distribution in the laser spot during ablation, since AFM measurements show that the heating process leaves the surface line grating unaffected.

4. Discussion

4.1. Si-Nc Size, PL and Hydrogen Passivation

The fact that we cannot measure a PL signal from the laser-treated sample without a subsequent heating process (sample “I”) is caused by several aspects. First, the proportion of crystalline silicon in the silicon-rich clusters is less in this sample than in the furnace-heated samples. This can be deduced from the corresponding HRTEM measurement (Figure 7c). The FT inset shows a significantly lower density of crystalline material than the furnace-heated samples (Figure 7d,e). This observation is further confirmed by the Raman measurement (Figure 6), which shows peaks characteristic for amorphous silicon for this sample. A similar observation has been made in the literature for irradiation of silicon-enriched SiO2 with nanosecond lasers. Here, the formation of silicon-rich clusters without their crystallization was also observed [51]. It should be noted that the PL signal of amorphous silicon clusters is low compared to Si-Nc [19]. As a second cause, laser irradiation produces silicon-rich clusters only in a small volume of the sample. Since there is a size gradient in this area, many Si-Nc are too large to contribute to the PL in the spectral range covered in our experiment. This further reduces the proportion of laser generated Si-Nc that can cause a PL signal. Therefore, only a very weak PL signal is expected. A PL setup with increased sensitivity by using photomultiplier tubes and a sample cooling could enable the measurement of such low PL signals.
The main PL peak originates from quantum confinement in the Si-Nc with a broad size distribution. TEM measurements show mainly sizes between 3 nm and 6 nm. Similar spectra are also observed in literature, although the PL peak position heavily depends on the host matrix, the measurement temperature, and the surface chemistry beside the diameter of the crystals. A range of Si-Nc sizes and corresponding PL peak positions have been reported in literature, as summarized in Section 1. The PL peak position with respect to the Si-Nc size is in the range of values reported in the literature, especially for SiOx host matrix (see Refs. [4,19,20,52,53]).
The PL redshift due to hydrogen passivation has also been measured in the literature [54]. It is known that large Si-Nc (producing low-energy PL) have longer PL lifetimes compared to smaller Si-Nc [55]. As a result, hydrogen passivation, which reduces non-radiative processes, has a greater effect on the low-energy PL spectrum. This results in a redshift of the PL spectrum. Other authors suggest another explanation for the PL redshift induced by hydrogen passivation: they suggest that larger crystals, due to their larger surface area and volume, are more likely to have defects that can act as non-radiative recombination centers. Therefore, hydrogen passivation affects larger Si-Nc more, resulting in a redshift of the PL spectrum. Thus, the hydrogen passivation has a stronger effect on larger Si-Nc, which has been attributed to a redshift in the PL spectrum [54]. The increase in PL signal due to the hydrogen passivation is in good agreement with similar experiments in the literature [13,30,54]. It can be explained by the suppression of non-radiative recombination channels. For example, Si-dangling bonds at the Si–SiO2 interface are saturated by hydrogen and thus no longer contribute to non-radiative recombination.
The minor PL peaks around 700 nm to 800 nm are almost unaffected by hydrogen passivation. The literature mentions formation of defect-related PL due to oxygen vacancies and defects, such as non-bridging oxygen hole centers (NBOHC) and oxygen-deficiency center (ODC) causing PL signals below 900 nm [1,56,57,58]. Also, amorphous silicon nanoclusters with broad band PL in the range of 650 nm to 775 nm is reported [1,56]. In our STEM experiments, such amorphous nanoclusters should produce contrast in the energy-filtered images (17 eV) even in the absence of crystalline diffraction spots, which is not observed experimentally. Hence, this yields an indirect indication that defect-related PL results in these minor bands, instead of the presence of amorphous silicon clusters.

4.2. Influence of the Surface Grating on the PL

Regarding the topography, an increase in the PL signal is measurable for all samples with surface gratings compared to samples with flat surfaces. Firstly, the laser irradiation leads to structural changes in the material, as shown by the TEM analysis. The blue shift of the PL peaks and the PL enhancement could be due to the smaller Si-Nc size in the laser-affected-region resulting from an enhanced nucleation rate for Si-Nc there, as mentioned without further explanation in [41]. However, the PL enhancement cannot be explained by this effect alone. This is due to the fact that the samples irradiated with the laser with homogeneous fluence over a large area do not show such a strong increase of the PL signal as the samples with a surface grating. Meanwhile, the introduction of nucleation sites by the laser irradiation should occur similarly in both cases. Therefore, this can at best explain only a small portion of the PL signal enhancement and points to another effect. The dependence of the PL enhancement on the period of the gratings (samples “F” and “H”) suggests an optical effect.
The influence of the grating on the PL in connection with the excitation light can be neglected. A grating coupling of the PL excitation light into the SiOx layer, as known from grating couplers to planar waveguides, would be possible. However, due to the period of 600 nm and 1000 nm present here, only parts of higher orders can couple into the SiOx layer. Since the contributions of these high orders are very small, this effect can be neglected. A more detailed discussion of this point can be found in the supplementary material. Additional literature was used for this purpose [59,60,61,62,63].
We now discuss the effect of the grating on PL light emission. To analyze this behavior, finite element simulations were performed. A unit cell (size corresponding to the period of the surface grating) was simulated with the refractive indices nSiOx = 1.9 and nSiO2 = 1.45, neglecting any absorption [59,60]. Scattering boundary conditions with perfectly matched layers and periodic boundary conditions are assumed. The radiation of the PL from the Si-Nc is assumed to be isotropic. For simplification, a plane wave traveling in the direction of the sample surface with different angles (ψ) is assumed in the simulations (a schematic sketch is shown in the supplementary material: Figure S3). A wavelength of 950 nm is assumed, and the periodic surface structure is assumed to be sinusoidal in shape with an amplitude of 100 nm. This model is used to calculate the angular spectrum for total internal reflection. A “cutoff-angle” (denoted θ) was defined. For angles higher than θ, less than 1% of the PL light leaves the SiOx layer (meaning 99% of the PL light is reflected back into the substrate). The cutoff angle is plotted against the structure period in Figure 8 as the red data points (left axis). A clear decline in the cutoff angle for increasing period is observed, meaning less light can exit the SiOx layer for larger structure periods. The dashed line shows the angle of total reflection for a flat surface (θfl = 28 deg). Assuming isotropic PL emission from the Si-Nc, the PL enhancement due to the grating is estimated. The fraction of PL light that can leave the SiOx layer is approximated by the solid angle of a given period. Divided by the solid angle for a flat surface, this gives the enhancement (ε) of the PL by the structure period:
ε = sin θ 2 2 / sin θ fl   2 2
This calculation yields the blue data points in Figure 8 (right axis). Since this calculation assumes an isotropic solid angle, while the grating has a preferred direction, this is only an estimate for the PL enhancement. Another simplification is made because a linear increase of the PL light output with the solid angle is assumed. Since we do not expect a linear intensity distribution of the PL light for the solid angles, this estimate shows an upper limit for the increase in PL light. Nevertheless, this method provides a quantitative estimate of the PL enhancement. The PL enhancements measured experimentally are below the calculated values and thus confirm the assumption of an upper limit. On the other hand, the PL measurement data are limited by the numerical aperture of the objective in the PL setup. Therefore, the PL measurement data should be considered as a lower limit, since the entirety of the angular spectrum cannot be measured. These results finally lead to the conclusion that the enhancement of the PL can be explained by the periodic surface gratings. The PL losses due to total internal reflection in the SiOx layer with high refractive index are reduced by the periodic structures. Thereby, the light extraction efficiency is increased.
The values measured here for the PL enhancement by increased extraction efficiency are in agreement with observed values from the literature for periodic structures. It should be noted, however, that the experiments performed here differ from the literature in important respects, since the periodic structure is introduced here into the host matrix without extrinsic elements. For the use of periodic GaN nanorods, an enhancement by a factor of 2.5, compared to a flat GaN layer, was measured [37]. In the case of the two-dimensional photonic crystal leading to an improved PL extraction efficiency, enhancements of up to 8 were measured. However, enhancement only occurs in a small spectral range [40].
In summary, the underlying mechanisms for the increased PL signal are, to a small extent, structural changes induced by homogeneous or structured laser irradiation and, to a major extent, an increased light extraction efficiency due to the laser-induced structures from the highly refractive SiOx layer.
Though similar results may be obtained using other UV lasers, the short wavelength and the small penetration depth at 193 nm optimally ensure high-resolution patterning [50]. Femtosecond laser ablation utilizing multiphoton absorption could overcome the lack of absorption in the visible/IR. CW lasers, however, may substitute furnace heating [22], but are not suitable for this kind of surface patterning.

5. Conclusions

An increase in the PL intensity of Si-Nc inside a SiOx layer can be observed due to irradiation with an ArF excimer laser. In the case of homogeneous fluence, a slight increase in PL occurs. Structuring the surface with a periodic grating results in a significantly stronger enhancement of the PL. The enhancement depends on the period of the structure. The PL enhancement can be attributed to two effects. Of minor importance is a different Si-Nc crystallization behavior caused by laser irradiation of the SiOx layer prior to the high-temperature annealing. A volume near the surface of the SiOx layer, which is affected by the laser irradiation, exhibits significantly smaller Si-Nc compared to the Si-Nc at greater depth in the SiOx layer, which were not affected by the laser irradiation. But a large part of the PL enhancement is unrelated to these material modifications. The reduction in the loss of PL light due to total internal reflection by the periodic surface structure can explain the major part of the PL enhancements. A simple and inexpensive method for increasing the PL intensity of Si-Nc inside a SiOx layer has been demonstrated.

Supplementary Materials

The following supporting information can be downloaded at: https://www.mdpi.com/article/10.3390/photonics10040358/s1, Figure S1: PL spectra of SiOx samples after high-temperature annealing without hydrogen passivation; Figure S2: Simulation results of guided-mode resonance according to equation 2 for orders m = −3 to m = 3; Figure S3: Model of the finite element simulations regarding the “cutoff-angle” of the PL light.

Author Contributions

Conceptualization, L.J.R., U.R., M.S. and J.I.; methodology, L.J.R. and J.I.; software, L.J.R. and U.R.; validation, L.J.R. and U.R.; formal analysis, L.J.R., U.R. and M.S.; investigation, L.J.R. and U.R.; resources, L.J.R. and J.I.; data curation, L.J.R. and U.R.; writing—original draft preparation, L.J.R.; writing—review and editing, L.J.R., U.R., M.S. and J.I.; visualization, L.J.R. and U.R.; supervision, M.S. and J.I.; project administration, M.S. and J.I.; funding acquisition, M.S. and J.I. All authors have read and agreed to the published version of the manuscript.

Funding

We acknowledge the financial support of the Deutsche Forschungsgemeinschaft, project IH 17/27-1 and 217133147/SFB 1073, project Z02.

Institutional Review Board Statement

Not applicable.

Informed Consent Statement

Not applicable.

Data Availability Statement

The data presented in this study are available on request from the corresponding author.

Conflicts of Interest

The authors have no competing interests to declare that are relevant to the content of this article.

References

  1. Pavesi, L.; Turan, L. Silicon Nanocrystals Fundamentals, Synthesis and Applications; Wiley-VCH: Hoboken, NJ, USA, 2010; ISBN 978-3-527-32160-5. [Google Scholar]
  2. Canham, L.T. Silicon quantum wire array fabrication by electrochemical and chemical dissolution of wafers. Appl. Phys. Lett. 1990, 57, 1046. [Google Scholar] [CrossRef]
  3. Cullis, A.G.; Canham, L.T. Visible light emission due to quantum size effects in highly porous crystalline silicon. Nature 1991, 353, 335–338. [Google Scholar] [CrossRef]
  4. Zacharias, M.; Heitmann, J.; Scholz, R.; Kahler, U.; Schmidt, M.; Bläsing, J. Size-controlled highly luminescent silicon nanocrystals: A SiO/SiO2 superlattice approach. Appl. Phys. Lett. 2002, 80, 661. [Google Scholar] [CrossRef]
  5. Tiwari, S.; Rana, F.; Hanafi, H.; Hartstein, A.; Crabbé, E.F.; Chan, K. A silicon nanocrystals based memory. Appl. Phys. Lett. 1996, 68, 1377. [Google Scholar] [CrossRef] [Green Version]
  6. Pavesi, L.; Dal Negro, L.; Mazzoleni, C.; Priolo, F. Optical gain in silicon nanocrystals. Nature 2000, 408, 440. [Google Scholar] [CrossRef] [PubMed]
  7. Ledoux, G.; Guillois, O.; Porterat, D.; Reynaud, C.; Huisken, F.; Kohn, B.; Paillard, V. Photoluminescence properties of silicon nanocrystals as a function of their size. Phys. Rev. B 2000, 62, 15942. [Google Scholar] [CrossRef]
  8. Walters, R.J.; Bourianoff, G.I.; Atwater, H.A. Field-effect electroluminescence in silicon nanocrystals. Nat. Mater. 2005, 4, 143. [Google Scholar] [CrossRef]
  9. Jurbergs, D.; Rogojina, E. Silicon nanocrystals with ensemble quantum yields exceeding 60%. Appl. Phys. Lett. 2006, 88, 233116. [Google Scholar] [CrossRef]
  10. Sinelnikov, R.; Dasog, M.; Beamish, J.; Meldrum, A.; Veinot, J.G.C. Revisiting an Ongoing Debate: What Role Do Surface Groups Play in Silicon Nanocrystal Photoluminescence? ACS Photonics 2017, 4, 1920. [Google Scholar] [CrossRef]
  11. Ledoux, G.; Gong, J.; Huisken, F. Effect of passivation and aging on the photoluminescence of silicon nanocrystals. Appl. Phys. Lett. 2001, 79, 4028. [Google Scholar] [CrossRef]
  12. Wilson, W.L.; Szajowski, P.F.; Brus, L.E. Quantum Confinement in Size-Selected, Surface-Oxidized Silicon Nanocrystals. Science 1993, 262, 1242–1244. [Google Scholar] [CrossRef] [PubMed]
  13. Godefroo, S.; Hayne, M.; Jivanescu, M.; Stesmans, A.; Zacharias, M.; Lebedev, O.I.; Van Tendeloo, G.; Moshchalkov, V.V. Classification and control of the origin of photoluminescence from Si nanocrystals. Nat. Nanotechnol. 2008, 3, 174. [Google Scholar] [CrossRef] [PubMed] [Green Version]
  14. Lee, B.G.; Hiller, D.; Luo, J.-W.; Semonin, O.E.; Beard, M.C.; Zacharias, M.; Stradins, P. Strained Interface Defects in Silicon Nanocrystals. Adv. Funct. Mater. 2012, 22, 3223. [Google Scholar] [CrossRef]
  15. Hadjisavvas, G.; Jelire, P.C. Structure and Energetics of Si Nanocrystals Embedded in a−SiO2. Phys. Rev. Lett. 2004, 93, 226104. [Google Scholar] [CrossRef] [PubMed]
  16. Belyakov, V.A.; Burdov, V.A.; Lockwood, R.; Meldrum, A. Silicon Nanocrystals: Fundamental Theory and Implications for Stimulated Emission. Adv. Opt. Technol. 2008, 32, 279502. [Google Scholar] [CrossRef] [Green Version]
  17. Schmidt, T.; Chizhik, A.I.; Chizhik, A.M.; Potrick, K.; Meixner, A.J.; Huisken, F. Radiative exciton recombination and defect luminescence observed in single silicon nanocrystals. Phys. Rev. B 2012, 86, 125302. [Google Scholar] [CrossRef]
  18. Wang, L.; Li, Q.; Wang, H.Y.; Huang, J.-C.; Zhang, R.; Chen, Q.-D.; Xu, H.-L.; Han, W.; Shao, Z.-Z.; Sun, H.-B. Ultrafast optical spectroscopy of surface-modified silicon quantum dots: Unraveling the underlying mechanism of the ultrabright and color-tunable photoluminescence. Light Sci. Appl. 2015, 4, 245. [Google Scholar] [CrossRef] [Green Version]
  19. Kahler, U.; Hofmeister, H. Size evolution and photoluminescence of silicon nanocrystallites in evaporated SiOx thin films upon thermal processing. Appl. Phys. A 2002, 74, 13–17. [Google Scholar] [CrossRef]
  20. Iacona, F.; Franzò, G.; Spinella, C. Correlation between luminescence and structural properties of Si nanocrystals. Appl. Phys. 1999, 87, 1295. [Google Scholar] [CrossRef]
  21. Kahler, U.; Hofmeister, H. Visible light emission from Si nanocrystalline composites via reactive evaporation of SiO. Opt. Mater. 2001, 17, 83. [Google Scholar] [CrossRef]
  22. Fricke-Begemann, T.; Wang, N.; Peretzki, P.; Seibt, M.; Ihlemann, J. Generation of silicon nanocrystals by damage free continuous wave laser annealing of substrate-bound SiOx films. J. Appl. Phys. 2015, 118, 124308. [Google Scholar] [CrossRef]
  23. Kenyon, A.J.; Trwoga, P.F.; Pitt, C.W.; Rehm, G. The origin of photoluminescence from thin films of silicon-rich silica. J. Appl. Phys. 1996, 79, 9291. [Google Scholar] [CrossRef]
  24. Wu, X.L.; Siu, G.G.; Tong, S.; Liu, X.N.; Yan, F.; Jiang, S.S.; Zhang, X.K.; Feng, D. Raman scattering of alternating nanocrystalline silicon/amorphous silicon multilayers. Appl. Phys. Lett. 1996, 69, 523. [Google Scholar] [CrossRef] [Green Version]
  25. Kim, T.-W.; Cho, C.-H.; Kim, B.-H.; Park, S.-J. Quantum confinement effect in crystalline silicon quantum dots in silicon nitride grown using SiH4 and NH3. Appl. Phys. Lett. 2006, 88, 123102. [Google Scholar] [CrossRef]
  26. Charvet, S.; Madelon, R.; Gourbilleau, F.; Rizk, R. Spectroscopic ellipsometry analyses of sputtered Si/SiO2 nanostructures. J. Appl. Phys. 1999, 85, 4032. [Google Scholar] [CrossRef]
  27. Biteen, J.S.; Pacifici, D.; Lewis, N.S.; Atwater, H.A. Enhanced Radiative Emission Rate and Quantum Efficiency in Coupled Silicon Nanocrystal-Nanostructured Gold Emitters. Nano Lett. 2005, 5, 1768. [Google Scholar] [CrossRef] [PubMed] [Green Version]
  28. Kanemitsu, Y.; Shimizu, N.; Komoda, T.; Hemment, P.L.F.; Sealy, B.J. Photoluminescent spectrum and dynamics of Si+-ion-implanted and thermally annealed SiO2 glasses. Phys. Rev. B 1996, 54, R14329. [Google Scholar] [CrossRef]
  29. Shimizu-Iwayama, T.; Fujita, K.; Nakao, S.; Saitoh, K.; Fujita, T.; Itoh, N. Visible photoluminescence in Si+-implanted silica glass. J. Appl. Phys. 1994, 75, 7779. [Google Scholar] [CrossRef]
  30. López, M.; Garrido, B.; García, C.; Pellegrino, P.; Pérez-Rodíguez, A.; Morante, J.R.; Bonagos, C.; Carrada, M.; Claverie, A. Elucidation of the surface passivation role on the photoluminescence emission yield of silicon nanocrystals embedded in SiO2. Appl. Phys. Lett. 2002, 80, 1637. [Google Scholar] [CrossRef]
  31. Shockley, W.; Read, W.T., Jr. Statistics of the Recombination of Holes and Electrons. Phys. Rev. 1952, 87, 835. [Google Scholar] [CrossRef]
  32. Hall, R.N. Electron-Hole Recombination in Germanium. Phys. Rev. 1952, 87, 387. [Google Scholar] [CrossRef]
  33. Mangolini, L. Synthesis, properties, and applications of silicon nanocrystals. J. Vac. Sci. Technol. B 2013, 31, 020801. [Google Scholar] [CrossRef]
  34. Richter, L.J.; Ihlemann, J. Photoluminescence enhancement of silicon nanocrystals by excimer laser implanted gold nanoparticles. Appl. Phys. A 2022, 128, 764. [Google Scholar] [CrossRef]
  35. Shimizu, K.T.; Woo, W.K.; Fisher, B.R.; Eisler, H.J.; Bawendi, M.G. Surface-Enhanced Emission from Single Semiconductor Nanocrystals. Phys. Rev. Lett. 2002, 89, 117401. [Google Scholar] [CrossRef]
  36. Köthemann, R.; Golla, C.; Qu, H.; Meier, C. Influence of Gold Nanoantennas on the Photoluminescence of Silicon Nanocrystals. Photonics 2022, 9, 985. [Google Scholar] [CrossRef]
  37. Zhuang, Z.; Guo, X.; Zhang, G.; Liu, B.; Zhang, R.; Zhi, T.; Tao, T.; Ge, H.; Ren, F.; Xie, Z.; et al. Large-scale fabrication and luminescence properties of GaN nanostructures by a soft UV-curing nanoimprint lithography. Nanotechnology 2013, 24, 405303. [Google Scholar] [CrossRef] [PubMed]
  38. López, J.A.L.; López, J.C.; Valerdi, D.E.; Salgado, G.G.; Díaz-Becerril, T.; Pedraza, A.P.; Gracia, F.J.F. Morphological, compositional, structural, and optical properties of Si-nc embedded in SiOx films. Nanoscale Res. Lett. 2012, 7, 604. [Google Scholar] [CrossRef] [PubMed] [Green Version]
  39. Li, W.; Wang, S.; Hu, M.; He, S.; Ge, P.; Wang, J.; Guo, Y.Y.; Zhaowei, L. Enhancement of electroluminescence from embedded Si quantum dots/SiO2multilayers film by localized-surface-plasmon and surface roughening. Sci. Rep. 2015, 5, 11881. [Google Scholar] [CrossRef] [PubMed] [Green Version]
  40. Ondic, L.; Varga, M.; Hruska, K.; Kromka, A.; Herynkova, K.; Hönerlage, B.; Pelant, I. Two-dimensional photonic crystal slab with embedded silicon nanocrystals: Efficient photoluminescence extraction. Appl. Phys. Lett. 2013, 102, 251111. [Google Scholar] [CrossRef] [Green Version]
  41. Chen, Y.-B.; Ren, Y.; Xiong, R.-L.; Zhao, Y.-Y.; Lu, M. Modulation of the photoluminescence of Si quantum dots by means of CO2 laser pre-annealing. Appl. Surf. Sci. 2010, 256, 5116. [Google Scholar] [CrossRef]
  42. Cha, D.; Shin, J.H.; Song, I.-H.; Han, M.-K. Enhanced formation of luminescent nanocrystal Si embedded in Si/SiO2 superlattice by excimer laser irradiation. Appl. Phys. Lett. 2004, 84, 1287. [Google Scholar] [CrossRef] [Green Version]
  43. Rodríguez-de Marcos, L.V.; Larruquert, J.I.; Méndez, J.A.; Aznárez, J.A. Self-consistent optical constants of SiO2 and Ta2O5 films. Opt. Mater. Express 2016, 6, 3622. [Google Scholar] [CrossRef]
  44. Wang, N.; Fricke-Begemann, T.; Peretzki, P.; Ihlemann, J.; Seibt, M. Formation of porous silicon oxide from substrate-bound silicon rich silicon oxide layers by continuous-wave laser irradiation. J. Appl. Phys. 2018, 123, 093104. [Google Scholar] [CrossRef]
  45. Schamm, S.; Bonafos, C.; Coffin, H.; Cherkashin, N.; Carrada, M.; Assayag, G.B.; Claverie, A.; Tencé, M.; Colliex, C. Imaging Si nanoparticles embedded in SiO2 layers by (S)TEM-EELS. Ultramicroscopy 2008, 108, 346. [Google Scholar] [CrossRef] [PubMed]
  46. Jahn, M.; Richter, J.; Weichenhain-Schriever, R.; Meinertz, J.; Ihlemann, J. Ablation of silicon suboxide thin layers. Appl. Phys. A 2010, 101, 533. [Google Scholar] [CrossRef] [Green Version]
  47. Karstens, R.; Gödecke, A.; Prießner, A.; Ihlemann, J. Fabrication of 250-nm-hole arrays in glass and fused silica by UV laser ablation. Opt. Laser Technol. 2016, 83, 16. [Google Scholar] [CrossRef]
  48. Voutsas, A.T.; Hatalis, M.K.; Boyce, J.; Chiang, A. Raman spectroscopy of amorphous and microcrystalline silicon films deposited by low-pressure chemical vapor deposition. J. Appl. Phys. 1995, 78, 6999. [Google Scholar] [CrossRef]
  49. Parker, J.H.; Feldman, J.D.W.; Ashkin, M. Raman Scattering by Silicon and Germanium. Phys. Rev. 1967, 155, 712. [Google Scholar] [CrossRef]
  50. Ihlemann, J.; Meinertz, J.; Danev, G. Excimer laser ablation of thick SiOx-films: Etch rate measurements and simulation of the ablation threshold. Appl. Phys. Lett. 2012, 101, 091901. [Google Scholar] [CrossRef]
  51. Kachurin, G.A.; Cherkova, S.G.; Marin, D.V.; Yankov, R.A.; Deutschmann, M. Formation of light-emitting Si nanostructures in SiO2 by pulsed anneals. Nanotechnology 2008, 19, 355305. [Google Scholar] [CrossRef]
  52. Takeoka, S.; Fuji, M.; Hayashi, S. Size-dependent photoluminescence from surface-oxidized Si nanocrystals in a weak confinement regime. Phys. Rev. B 2000, 62, 16820. [Google Scholar] [CrossRef]
  53. Ledoux, G.; Gong, J.; Huisken, F.; Guillois, O.; Reynaud, C. Photoluminescence of size-separated silicon nanocrystals: Confirmation of quantum confinement. Appl. Phys. Lett. 2002, 80, 25. [Google Scholar] [CrossRef]
  54. Cheylan, S.; Elliman, R.G. Effect of hydrogen on the photoluminescence of Si nanocrystals embedded in a SiO2 matrix. Appl. Phys. Lett. 2001, 78, 1225. [Google Scholar] [CrossRef]
  55. Garcia, C.; Garrido, B.; Pellegrino, P.; Ferre, R.; Moreno, J.A.; Morante, J.R.; Pavesi, L.; Cazzanelli, M. Size dependence of lifetime and absorption cross section of Si nanocrystals embedded in SiO2. Appl. Phys. Lett. 2003, 82, 1595. [Google Scholar] [CrossRef]
  56. Yi, L.X.; Heitmann, J.; Scholz, R.; Zacharias, M. Si rings, Si clusters, and Si nanocrystals—Different states of ultrathin SiO𝑥 layers. Appl. Phys. Lett. 2002, 81, 22. [Google Scholar] [CrossRef]
  57. Sakruai, Y. Oxygen-related red photoluminescence bands in silica glasses. J. Non-Cryst. Solids 2003, 316, 389. [Google Scholar] [CrossRef]
  58. Lau, H.W.; Tan, O.K.; Liu, Y.; Ng, C.Y.; Chen, T.P.; Pita, K.; Lu, D. Defect-induced photoluminescence from tetraethylorthosilicate thin films containing mechanically milled silicon nanocrystals. J. Appl. Phys. 2005, 97, 104307. [Google Scholar] [CrossRef]
  59. Hass, G.; Salzberg, C.D. Optical Properties of Silicon Monoxide in the Wavelength Region from 0.24 to 14.0 Microns. J. Opt. Soc. Am. 1954, 44, 181. [Google Scholar] [CrossRef]
  60. Malitson, I.H. Interspecimen Comparison of the Refractive Index of Fused Silica. J. Opt. Soc. Am. 1965, 55, 1205. [Google Scholar] [CrossRef]
  61. Lin, J.H.; Liou, H.Y.; Wang, C.-D.; Tseng, C.-Y.; Lee, C.-T.; Ting, C.-C.; Kan, H.-C.; Hsu, C.C. Giant Enhancement of Upconversion Fluorescence of NaYF4:Yb3+,Tm3+ Nanocrystals with Resonant Waveguide Grating Substrate. ACS Photonics 2015, 2, 530. [Google Scholar] [CrossRef]
  62. Selle, A. Dielektrische Wellenleitergitter in Resonanz: Theorie, Charakterisierung und Anwendung. Ph.D. Thesis, Georg-August-Universität Göttingen, Göttingen, Germany, 2009. [Google Scholar] [CrossRef]
  63. Colier, R.J.; Burckhardt, C.B.; Lin, L.H. Optical Holography; Academic Press: Cambridge, MA, USA, 1971; ISBN 978-0-12-181050-4. [Google Scholar]
Figure 1. Optical setup to produce a line grating by ArF excimer laser irradiation of the samples. An attenuator offers fluence adjustment. A binary fused silica phase mask in contact with a transparent chromium mask is used. The structure of the mask, as well as the first diffraction orders, are shown enlarged, indicated by the red marking. A lens is used to recombine the first orders of the split-up beam on the sample surface (the Schwarzschild objective is shown here as an example). The sizes are not to scale. Crucial details of the setups are shown in Table 1.
Photonics 10 00358 g001
Figure 2. Process diagram for the production of the samples. All samples are SiOx coated on a SiO2 substrate and subsequently experience either no or different laser irradiation and thermal treatment processes. The letter on the bottom denotes the designation of the individual samples.
Photonics 10 00358 g002
Figure 3. PL spectra of SiOx samples after high-temperature annealing without hydrogen passivation. A significant enhancement of the PL due to the periodic structuring is measurable. The PL intensity is shown in uncalibrated units but scaled identically in all measurements.
Photonics 10 00358 g003
Figure 4. PL spectra of high-temperature annealed and hydrogen-passivated SiOx samples. Homogeneous laser irradiation of the SiOx layer results in a slight increase in the PL signal. Periodic structuring of the SiOx layer results in a significantly stronger enhancement of the PL signal. The enhancement depends on the period of the structure. PL intensity scaling identical to Figure 3.
Photonics 10 00358 g004
Figure 5. SEM image of the cleaned SiOx surface of sample “H”. To avoid charging during SEM inspection, the sample was homogeneously coated with 20 nm of gold. The laser irradiation results in a sine-shape line grating with a period of 594 ± 16 nm. Laser parameters: λ = 193 nm, 1 pulse, 640 mJ/cm2 (fluence averaged over entire area). SEM parameters: 0° observation angle; 20 kV; 5.5 mm Working Distance.
Photonics 10 00358 g005
Figure 6. Raman measurements of different SiOx samples. Prior to the high-temperature annealing, an unspecific signal is present (sample “A”). Laser treatment causes a shallow, broad peak around 470 cm−1 (sample “I”). The high-temperature annealing (1050 °C) results in a sharp peak at 515 cm−1, while there is no difference in Raman signals between laser-processed and unprocessed samples (samples “D” and “H”). The measurements of the substrate have been subtracted.
Photonics 10 00358 g006
Figure 7. Selected results of the TEM/STEM analysis. (a) ADF-STEM overview of sample “I”, laser-structured with a period of 600 nm and a peak height of 80 nm. The sample is coated with a polycrystalline/amorphous Pt-C layer for the FIB preparation. Inset on the left shows the EELS fit amplitude map of the 17 eV plasmon peak, with higher intensity corresponding to regions containing more silicon rich clusters. Enlarged panels in the middle correspond to higher-resolution STEM-EELS results for a region indicated by the dashed rectangle in the ADF image. The 17 eV fit amplitude map shows the presence of large silicon clusters at the surface, with gradually decreasing cluster size following the surface topography, and roughly corresponding to the thermal diffusion length of 20 ns laser pulses in SiOx. The 23 eV fit amplitude map correlates with the amorphous SiOx content within the sample; consequently, creating a roughly contrast-inverted image of the 17 eV map and showing highest intensity within the SiO2 surface layer. The dashed blue line indicates the boundary of the area containing silicon rich clusters. Panel (c) on the right displays the HRTEM structure at the top of the irradiated layer in (a), with selected Si-Nc visible by their lattice planes highlighted by dashed yellow circles. These irregularly shaped crystallites can possess a wide range of sizes, typically between 3 nm and 5.3 nm. Crystallinity within the HRTEM image is further highlighted by Bragg spot intensity in the Fourier-transformed (FT) of the image (top right inset in (c)). An enlarged view of individual Si-Nc from the same image is shown in the bottom right inset. Panel (b) is organized similarly, showing an ADF overview and STEM-EELS results from the laser-irradiated, high-temperature annealed, and hydrogen-passivated sample “H” with a period of 600 nm and increased peak height (140 nm). The 17 eV STEM-EELS results in particular reveal the presence of two crystalline domains of different average Si-Nc size, corresponding to the laser-crystallized and the bulk-annealed regions of the sample. The interface between the two regions is approximately indicated by the dashed blue line. This map also shows an increase in the thickness of the SiO2 surface layer. The HRTEM images in (d,e) demonstrate representative examples of the crystalline structures in the top (d) and bottom domain (e), and their corresponding FTs displaying diffraction rings from the Si-Nc. The bottom insets show an enlarged view of individual Si-Nc. Crystallite sizes in the annealed bulk are significantly larger than in the laser-affected region, ranging from 3.8 to 11.5 nm. Si-Nc in both layers are closely packed so that a more precise determination of sizes is not possible due to overlap between neighboring particles. Laser parameters: λ = 193 nm, 1 pulse, 640 mJ/cm2 (fluence averaged over entire area).
Photonics 10 00358 g007
Figure 8. Comparison of calculated cutoff angles and PL enhancement for varying structure period at fixed sinusoidal amplitude of 100 nm for a wavelength of 950 nm. The cutoff angle (red data, left axis) is defined as the emission angle at which less than 1% of PL light can exit the SiOx layer. The dashed line shows the cutoff angle for a flat sample (28 deg). The blue data shows the calculated and measured PL enhancement (right axis) due to the periodic surface grating compared to a flat surface.
Photonics 10 00358 g008
Table 1. Crucial parameters of the three different laser setups used for sample irradiation. Laser systems from Coherent, Göttingen, Germany.
SetupHomogeneous IrradiationGrating Irradiation
P = 600 nm
Grating Irradiation
P = 1000 nm
Laser systemLPX-Pro, CoherentNovatex, CoherentLPX-Pro, Coherent
Demagnification5.4:125:110:1
Mask aperture 3   ×   3     mm 2 2   ×   2     mm 2 1   ×   1     mm 2
Phase mask periodNot used30 µm20 µm
Imaging lensSpherical lensf = 100 mmSchwarzschild-Objective; NA = 0.4Imaging-Objective (Thorlabs LMU-10x-193); NA = 0.27
Resulting spot size 550   ×   550     μ m 2 78   ×   78   μ m 2 102   ×   102   μ m 2
Treated samplesEG, H, IF
Table 2. Results of PL measurements: area fraction denotes the integrated area relative to that of sample D. λi (I = 1,2,3) denote positions of three Gaussians fitted to each spectrum, and fi their relative area fraction. For each sample, it is indicated whether hydrogen passivation was performed. The structure period resulting from laser irradiation is indicated for each sample. “No Irr.” means that no laser irradiation was carried out.
SampleArea Fractionλ1 [nm]f1
[%]
λ2 [nm]f2
[%]
λ3 [nm]f3
[%]
Hydrogen PassivationPeriod [nm]
C0.27105.380023.392971.4No Irr.
D17362.9763093797.1+No Irr.
E1.37244.77930.593694.8+
F1.57322.47931.293996.4+1000
G0.57386.87862.391090.9600
H2.67391.77871.792996.6+600
Disclaimer/Publisher’s Note: The statements, opinions and data contained in all publications are solely those of the individual author(s) and contributor(s) and not of MDPI and/or the editor(s). MDPI and/or the editor(s) disclaim responsibility for any injury to people or property resulting from any ideas, methods, instructions or products referred to in the content.