Article

Performance Analysis and Power Tilt Mitigation of Ultra-Wideband WDM Transmission Systems

1
State Key Laboratory of Information Photonics and Optical Communications, Beijing Key Laboratory of Space-Ground Interconnection and Convergence, School of Electronic Engineering, Beijing University of Posts and Telecommunications, Beijing 100876, China
2
School of Physics and Optoelectronic Engineering, Nanjing University of Information Science and Technology (NUIST), Nanjing 210044, China
*
Author to whom correspondence should be addressed.
Photonics 2023, 10(5), 530; https://doi.org/10.3390/photonics10050530
Submission received: 19 February 2023 / Revised: 8 April 2023 / Accepted: 19 April 2023 / Published: 4 May 2023
(This article belongs to the Special Issue Optical Fiber Communication Systems)

Abstract

:
Ultra-wideband (UWB) wavelength division multiplexing (WDM) transmission, which utilizes low-loss spectral windows of single-mode fiber for data transmission, is a highly promising method for increasing the capacity of optical communication. In this paper, we investigate the performance of a UWB WDM transmission system that covers the widely used C+L band as well as the additional O-, E-, and S-bands. We establish the transmission system for UWB and discuss the effects of the channel, including Kerr nonlinearity and inter-channel interference from inter-channel stimulated Raman scattering (ISRS) between O-, E-, S-, C-, and L-bands. Moreover, we demonstrate an optimization scheme for compensating the spectral power tilt caused by SRS in the S+C+L band system, which utilizes the Raman amplifier and the partition particle swarm optimization (PPSO) algorithm. The results show that the power tilt value of the algorithm is reduced from 18 to 2.93 dB, and the iteration speed is improved by 10% compared with the normal particle swarm algorithm. The scheme provides an efficient way to improve the generalized mutual information (GMI) performance of UWB WDM systems.

1. Introduction

Recently, the demand for higher capacity backbone networks, data centers, and optical access networks has increased dramatically due to the popularity of 5G mobile communications and the transformation of online services driven by the impact of COVID-19 [1,2]. Currently, the transmission capacity of single-mode optical fiber has reached 100 Tbits/s [3], which is close to the capacity limit of single-mode optical fiber transmission systems. The contradiction between the lack of growth in fiber optic transmission capacity and the bandwidth requirements of internet services will lead to a “capacity crunch”. To expand the transmission capacity of coherent fiber optic communication systems, two available options are being investigated: space division multiplexing (SDM) and ultra-wideband (UWB) wavelength division multiplexing (WDM). For SDM, specialty fibers, such as multi-core fiber (MCF), few-mode fiber (FMF), and ring-core fiber (RCF) have been developed to enable multiplexing in several space and mode degrees of freedom [4,5,6,7,8]. This implies the deployment of new types of fibers and further research on transceivers and amplifiers for SDM. On the other hand, UWB WDM transmission is a technology that increases transmission capacity by extending the operating wavelength range of optical transmission systems to the entire low-loss spectral window of single-mode quartz fiber, i.e., O-, E-, S-, C-, L-, and U-bands [9]. By introducing transceivers and low-noise optical amplifiers that cover a wide wavelength range other than the Erbium-doped fiber amplifier (EDFA), a significant increase in fiber transmission capacity can be achieved without the need to redeploy the fiber transmission. This provides a practical solution for addressing the near-term “capacity crunch”.
Many studies have demonstrated UWB transmission experiments and systems beyond the C+L band (see Table 1). The first WDM optical transmission experiment with 250 wavelength channels of 12.7 THz with SOA has been demonstrated; a net throughput of 115.9 Tb/s is transmitted over a 100 km SSMF with 49 GBaud probabilistic constellation shaping (PCS) of 64-ary quadrature amplitude modulation (QAM) [10]. In [11], a 45 GBaud polarization division multiplexing (PDM) 128QAM signal was used to achieve a record capacity of 150.3 Tb/s of a low water peak fiber (LWPF) transmission over 40 km with 13.6 THz UWB, and an amplification scheme of EDFA and TDFA was adopted. In [12], hybrid distributed Raman/Doped fiber amplifiers were used to demonstrate the transmission of 660 × 25 GBaud geometric shaping (GS) QAM over 40 km, achieving a record throughput of 178.08-Tbits/s in a single-mode fiber network with 16.83 THz UWB. Moreover, a 5-band WDM transmission was demonstrated in [13]; the authors proposed an adaptive modulation format allocation of 100 G quadrature phase shift keying (QPSK) and 200 G 16QAM to exhaustively use the wavelength-dependent optical signal-to-noise ratio (OSNR). Recently, a 256.4 Tb/s transmission in the S-, C-, and L-bands with 19.8 THz UWB was demonstrated over 54 km by using a 25 GHz-spaced PDM-256QAM signal [14]. Reference [15] achieved a 46 Tb/s transmission over 10,072 km with 15.1 THz UWB utilizing doped fiber and distributed Raman amplification. In addition, a 25.8 THz UWB (E-, S-, C-, and L-bands) transmission using a multi-stage distributed Raman amplifier was achieved over 70 km by using 100 GHz-spaced 30 GBaud PDM-64QAM signals [16].
For UWB WDM transmission systems, the wavelength dependence (due to propagation loss) leads to capacity limitations. Additionally, as the system bandwidth increases, inter-channel stimulated Raman scattering (ISRS) plays an increasingly important role in limiting the capacity as a nonlinear impairment that redistributes optical power from short to long wavelengths during propagation [18]. Several models have been developed for nonlinear interference with the inclusion of ISRS [19,20,21,22], and various power optimization methods have been proposed to mitigate the partial depletion of short-wavelength channel power caused by ISRS [23,24,25,26,27,28]. In [23], the average fiber input power of the WDM signal in each S-, C-, and L-band is optimized by a sequential iterative search considering the power tilt caused by ISRS. Following the sweep optimization of the average input power for single-band transmissions in the S and C bands, the L and S band power is optimized with the optimal power in the other bands, thus obtaining a high-capacity record. Meanwhile, the power pre-tilt and offset strategies in the S, C, and L-band scenarios are proposed [24,25]. The local optimization global optimization (LOGO) algorithm is used to optimize the general signal-to-noise ratio (GSNR) by sweeping and combining the parameters of the launch power profile. The computational complexity is greatly reduced by optimizing the performance of a span transmission link to simplify the process. In [26], the simulated annealing algorithm is introduced to improve the LOGO strategy, allowing for a faster search for the optimal parameters of the transmit power; moreover, a higher transmission capacity can be obtained. In addition, a simple heuristic technique is used for individual band amplifiers in each S+C+L optical multiplexing section, and all amplifiers have static gain profiles that enable online compensation of span loss and adjustment of the launch power [27]. On the other hand, the scheme of embedding a Raman amplifier (RA) as an auxiliary amplifier after the fiber transmission has been proposed, and controlling the pumping wavelength and pumping power of the RA can compensate for short-wavelength signals with low signal power. Machine learning methods can be used to control the parameters of RAs. In [28], the proposed multi-band RA based on the machine learning framework uses up to 8 pumps to provide arbitrary gain over a 17.6 THz bandwidth in the S+C+L band. The power tilt caused by ISRS in UWB WDM systems will be effectively addressed by this type of method.
In this paper, a UWB WDM system is built for investigating the impacts of ISRS on the transmission performance between O-, E-, S-, C-, and L-bands with the consideration of Kerr nonlinearity. To further mitigate channel impacts and improve spectral efficiency, an optimization scheme to compensate for the power tilt is demonstrated using a RA, and a partition particle swarm optimization (PPSO) algorithm is introduced to find the optimal pump power and pump wavelength for the RA when the output signal power spectrum is flattest. The results show that the power tilt is reduced from 18 to 2.93 dB. The iteration speed is increased by 10% compared to the normal PSO algorithm.

2. Analysis of the UWB WDM Transmission System

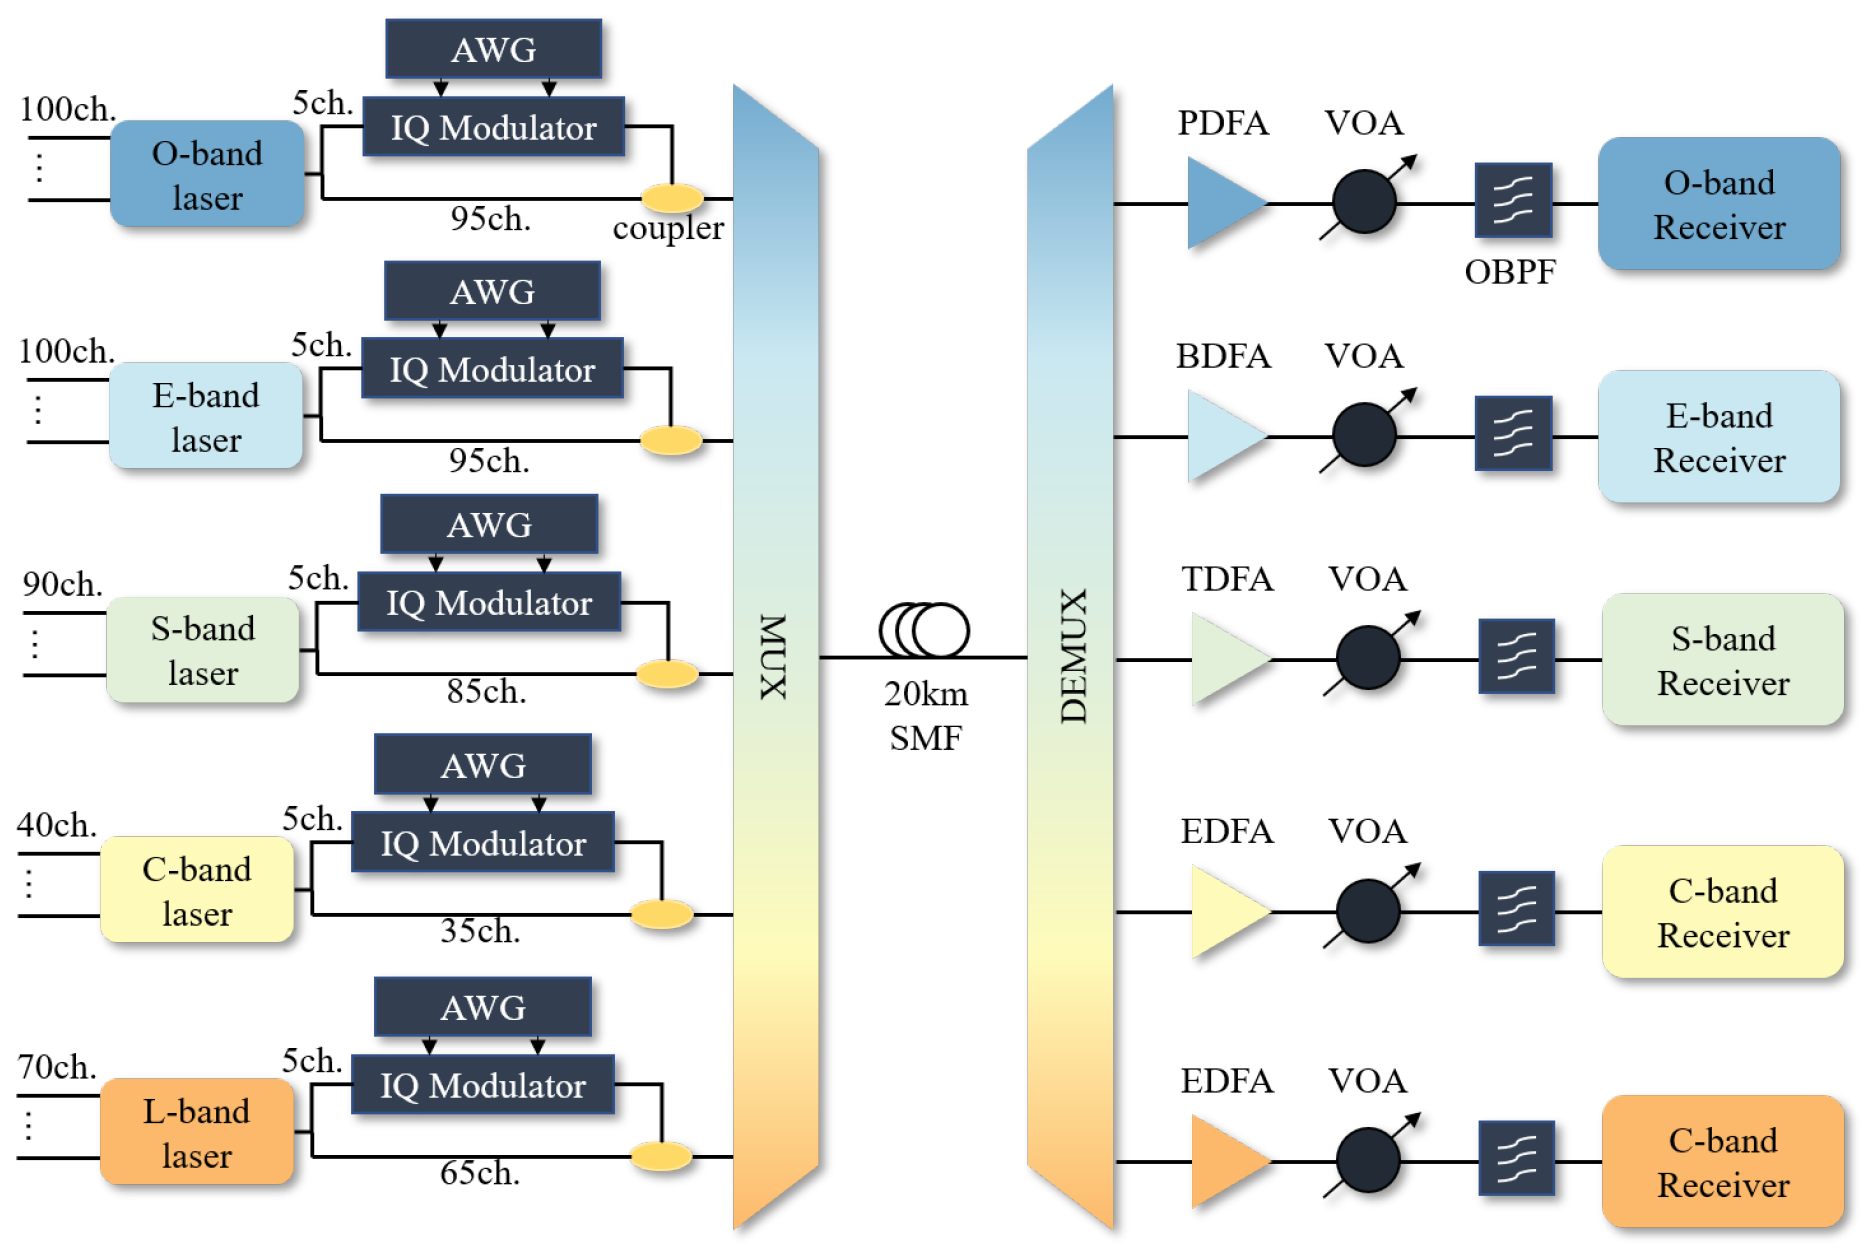
2.1. System Model and Simulation Setup

To investigate the effect of nonlinearity on the signal performance of UWB WDM systems, the nonlinear Schrödinger equation for optical pulse transmission in a single-mode fiber is first given as [29]
E i z = α 2 E i j β 2 2 2 E i T 2 + β 3 6 3 E i T 3 + j γ E i 2 + 2 k i N E k 2 E i .
where E i is the slow-varying envelope of the i-th channel optical field, z is the transmission distance, N is the number of channels, α is the attenuation coefficient, β 2 is the chromatic dispersion (CD) parameter, β 3 is the dispersion slope, and γ is a nonlinear coefficient. The first term on the right side of (Equation (1)) represents the loss of the optical field. The second and third terms represent the CD and dispersion slope of the fiber, while the third term is the phase change caused by nonlinear impairments, including the self-phase modulation (SPM) and cross-phase modulation (XPM). In UWB WDM systems, wavelength-dependent channel characteristics have to be coped with dispersion coefficient ranges from −5 ps/nm/km to 22 ps/nm/km; fiber loss α is 0.18 dB/km to 0.38 dB/km; and the nonlinear coefficient γ is 1.28 1/W/km to 1.6 1/W/km. Table 2 shows the attenuation and CD coefficients for the five bands (O→L-band) of the ITU-T G.652.D fiber measured in [9], and the nonlinear coefficients for each band can be considered constants.
Subsequently, a UWB WDM transmission system covering O-, E-, S-, C-, and L-bands was built in VPIphotonics based on the wavelength-dependent channel characteristics, and the nonlinear Schrödinger equation was solved by the split-step Fourier method (SSFM), commonly used for numerically solving the nonlinear Schrödinger equation and simulating WDM signal transmissions. The simulation setup is shown in Figure 1. At the transmitter, 100 continuous wave (CW) light sources were placed with a spacing grid of 100 GHz for WDM transmission in O and E bands. In the S-, C-, and L-bands, 90, 40, and 70 CW sources were placed, respectively. It should be noted that the simulation time of SSMF can be substantial even with fast computing hardware, especially for UWB WDM transmission beyond the C+L band. Therefore, to speed up the system computation process, the signal was modulated to the carriers of five channels in each band, and the carriers of the other channels were unloaded to reduce the computational complexity. The CW light of five channels in five bands were emitted to the IQ modulator (IQM) of each band with the linewidths of 100 kHz. The arbitrary waveform generator (AWG) was used to drive the IQM for the 32 GBaud polarization division multiplexing (PDM) signal modulation. The signals were root-raised cosine-shaped with a roll-off of 0.05. The light of the modulated channels and unmodulated channels were coupled together in each band. A multiplexer (MUX) was then used to combine the signals of the five bands. After 20 km of SMF transmission, the modulated WDM signals were separated by a de-multiplexer (DEMUX) for each band. Subsequently, the signal lights were amplified by the praseodymium-doped fiber amplifier (PDFA) in the O-band, BDFA in the E-band, thulium-doped fiber amplifiers (TDFAs) in the S-band, and EDFA in the C+L band, respectively. A variable optical attenuator (VOA) was used for power control, and an optical band-pass filter (OBPF) was used to filter light beyond the desired wavelength. At the receiver, band-ideal coherent receivers were used to detect the signal, which was then fed to digital signal processing (DSP) to compensate for the impairment. The receiver DSP consisted of the Gram–Schmidt orthogonalization procedure (GSOP), digital back-propagation (DBP), the constant modulus algorithm (CMA), and carrier recovery.

2.2. Five-Band Individual Channel Performance Analysis and Modulation Format Assignment

First, we investigated the performances of individual channels in each band and assigned the appropriate modulation format in each band. The dual polarization optical signal-to-noise ratio (OSNR) can be expressed as [30]
OSNR = R s B r e f SNR ,
where R s is the symbol rate and B r e f is the reference bandwidth. The reference bandwidths in this paper are 17.7 GHz, 15.3 GHz, 13.3 GHz, 12.5 GHz, and 11.7 GHz (O→L), respectively. In Figure 2, the SNR (in the five channels as a function of OSNR) is shown at 1300 nm, 1400 nm, 1500 nm, 1550 nm, and 1600 nm. With an OSNR of more than 36 dB, there is a ceiling of 22.5 dB and 22.7 dB for the O/E-band, respectively. For the S-, C-, and L-bands, the SNR peaks at approximately OSNR = 38 with 24.9 dB, 24.9 dB, and 24.2 dB, respectively. The SNR gap versus the theoretical, as well as the SNR ceiling, are caused by the amplified spontaneous emission (ASE) noise from the band-dependent optical amplifier and the transceiver noise. Depending on the resulting SNR, we chose PDM-16QAM or PDM-32QAM modulation schemes to reduce the excess margins for different bands. Assuming a BER threshold of 3.8 × 10 3 for FEC, the SNR at the FEC threshold should theoretically be about 16.5 dB at 16QAM and about 19.2 dB at 32QAM. In consideration of the SNR penalty in the WDM system, we allocated 16QAM to the O and E bands and 32QAM to the S-, C-, and L-bands to ensure an adequate SNR window. Figure 3 illustrates the OSNR of the individual 5-wavelength channels as a function of launch power. The OSNR of the channel is maximized when the launch power reaches 2 dBm, and then the OSNR of the system decreases due to nonlinear interference enhancement. Moreover, the OSNR of the O/E-band is from 29.8 dB to 37.8 dB, and the OSNR of the S-, C-, and L-bands is from 34.5 dB to 43.9 dB, which is in accordance with the requirements for the assigned modulation format.
Figure 4 shows the BER for each band as a function of the OSNR of each channel. With the lower modulation order, the BER of 16QAM signals in the O/E-band is generally lower than that of 32QAM signals in the S-, C-, and L-bands. When the OSNR is increased to 30 dB, all five-band channels are available at the FEC threshold. Figure 5 shows the BER for each band as a function of launch power. The BER of the five channels reaches their respective minima from 6 to 8 dBm, while the OSNR shown in Figure 3 achieves the respective maxima at 2 dBm. This is because, at the launch power < 6 dBm, the contribution of the launch power boost to SNR is greater than the performance degradation from nonlinearity. At the launch power > 8 dBm, nonlinear degradation dominates, and the system performance degrades. Additionally, it can be seen that the C-band performance is optimal, and the launch power increase is the most significant for the C-band performance improvement, which is consistent with the results in Figure 3.

2.3. Results of the Five-Band WDM Transmission

To evaluate the performance penalty of the five-Band WDM system transmission compared with the single-carrier transmission, the BER and generalized mutual information (GMI) are first calculated for the five test channels. The presence or absence of crosstalk essentially depends on the WDM frequency spacing, and inter-channel crosstalk becomes important as the channel spacing approaches the symbol rate. In our setup, the WDM frequency spacing is set to 100 GHz, and the impact of crosstalk is minimal or negligible [30]. This implies that the WDM penalty introduced by the five-band system is primarily from inter-channel nonlinearity. Figure 6 illustrates the BER of the test channel as a function of OSNR in five-band WDM transmission. The OSNR penalty of the E-band test channel is significantly larger in the five bands compared to the results in Figure 2, which suggests that the signal will be dominated by nonlinear interference in the E-band. The GMI versus OSNR for the five-band test channels is given in Figure 7. The value of GMI gives the maximum number of bits of information transmitted with the error vanishing probability and can be used to estimate the system throughput. The dashed line represents the GMI gap for WDM transmission, defined as Δ G M I = G M I S i n g l e G M I W D M . The test channel of the O-band features the lowest Δ G M I , even with the highest γ in the five bands. It is predicted that there is a correlation between the high noise tolerance of 16QAM assigned by the O-band and the higher noise factor of the optical amplifier, together with the transmission distance of 20 km, where the accumulated nonlinear interference is not dominant. For the S-, C-, and L-bands, the Δ G M I s are higher due to the lower noise tolerance of 32QAM, with the penalty being the highest for the L-band. Figure 8 shows the GMI as a function of the launch power for five-band WDM transmission. For the O/E-band, there is a narrower high GMI window for the E band due to nonlinear interference. Likewise, the test channel at 1600 nm in the S, C, and L-band features a smaller window of high GMI due to the higher penalty. The launch power of each band reaching the maximum GMI has different offsets. Considering the power consumption, we choose the launch power when the GMI just reaches the ceiling as the optimal launch power for the five-band WDM system, and the optimal launch powers for the O to L-band are 7, 5, 5, 6, and 7 dBm, respectively.
Furthermore, the effect of ISRS becomes non-negligible as the bandwidth of the WDM signal increases, especially in WDM systems beyond the C+L band. ISRS effectively causes energy transfers from shorter wavelengths to longer wavelengths, peaking at 100 nm. The coupling between the WDM ith channel and all other channels, considering ISRS and fiber attenuation, is described as [19,31]
P i z = α ( f i ) P i j = 1 i 1 f i f j g R ( f i f j ) + j = i + 1 N g R ( f i f j ) .
where P i represents the power of the ith channel, f i is the frequency of the ith channel, α ( f i ) is the fiber attenuation profile in the absence of ISRS, and k = 1 indicates the channel with the lowest frequency. The first term on the right-hand side of (3) describes the fiber attenuation of the i-th channel, the second term describes the power transfer from the i-th channel to the lower frequency channel, and the third term illustrates the power transfer from the higher frequency channel to the i-th channel. It is assumed that the Raman gain coefficient g R varies negligibly over the bandwidth of each channel. The nonlinear Schrödinger equation is still solved numerically by SSFM, considering the effect of ISRS. The wavelengths we chose for the WDM test channels were 1300, 1400, 1500, 1550, and 1600 nm, which are the central wavelengths of each band. They are mostly subject to interference from in-band nonlinearity and feature a wavelength difference of around 100 nm, providing the strongest ISRS. It has been shown that the crosstalk penalty originating from the amplitude fluctuations of the interaction channel is negligible [32,33]. Therefore, we focus exclusively on the ISRS-induced optical power tilt. Figure 9 shows the optical power transfer of each channel. Due to the aggregated power transfer effect of the five bands, the short-wavelength channels in the O-, E-, and S-bands provide power gain for the C and L-band signals as pump channels while being partially depleted. While the quality of the long-wavelength channels is guaranteed, the short-wavelength channels may be underpowered, resulting in a decrease in system throughput.
The relationship between GMI and launch power in the presence of ISRS is shown in Figure 8. The O/E/S band experience GMI penalties for each test channel compared to the absence of ISRS, while the C- and L-band acquire GMI gain, which is consistent with the results in Figure 9. Simultaneously, there is no effect of SRS on the launch power value of each test channel reaching the GMI ceiling. The relationship between SNR and GMI versus wavelength for five modulated channels per band in the five-band WDM transmission at optimal launch power is shown in Figure 10. The curves of OSNR and GMI with and without ISRS both intersect in the C-band, which is consistent with the results in Figure 9 that the C- and L-bands acquired performance gain in the O/E/S-band via ISRS. At the optimal launch power, the GMI of the test channel in the O/E/S-band decreases by 0.2 bits/symbol, 0.08 bits/symbol, and 0.09 bits/symbol, respectively, while the GMI of the test channel in the C- and L-bands increases by 0.09 bits/symbol and 0.1 bits/symbol, respectively. Since we only have five test channels for modulated signals in each band, the throughput is coarsely evaluated by considering each band. The throughput can be expressed as
T = ( N b a n d * G M I ¯ b a n d * R s ) ,
where T is the throughput, N b a n d is the number of channels per band, and G M I ¯ b a n d is the average GMI of the test channels for each band. Without ISRS, the G M I ¯ b a n d s of the O→L band test channels in Figure 10 are 7.94 bits/symbol, 7.87 bits/symbol, 9.89 bits/symbol, 9.79 bits/symbol, 9.69 bits/symbol, and the system throughput is 113.312 Tbits/s. Considering ISRS, the total system throughput is 112.496 Tbits/s, resulting in a throughput reduction of 816 Gbit/s.

2.4. Conclusions and Discussion

We demonstrate a five-band UWB WDM system with VPIphotonics, analyzing the single-wavelength performance per band and assigning an appropriate modulation format based on the SNR margin of the band. In addition, the five-band WDM transmission is demonstrated, and the launch power of each band is optimized on a band basis in this configuration. ISRS in the UWB WDM system is analyzed to evaluate the impact on the system, resulting in a system throughput degradation of 816 Gbit/s, ultimately leading to a total throughput of 112.496 Tbits/s. The transmission distance is limited to 20 km due to the cumulative nonlinearity and the computational complexity of the model. Therefore, in short-distance scenarios such as data center interconnects, where there is a high demand for dense network traffic and large-capacity UWB WDM transmission, it is expected that UWB WDM transmission will be applied first in this area.
In the simulation research, the total system bandwidth exceeded 50 THz, leading to a sharp increase in computational complexity and a system simulation time of up to 20 h even with a high-performance graphics processing unit (GPU). More efficient and fast methods can be introduced to evaluate the system performance for UWB WDM transmission, such as Gaussian noise (GN) models, which will be our focus for future work.
In addition, it is necessary to adequately address the impact of ISRS in the design of UWB WDM systems to reduce the throughput penalty. Several studies have been conducted to address the power tilt due to ISRS by optimizing the launch power profile or adding complementary fiber gratings. In Section 3, we focus on the power tilt compensation in S-, C-, and L-bands by introducing a RA as an auxiliary amplifier after fiber transmission to achieve simple and fast compensation of the power tilt by controlling the pumping wavelength and pumping power.

3. Compensation Scheme for Spectral Power Tilt

3.1. Compensation Scheme for ISRS

The gain spectrum of the RA is completely determined by its pump wavelengths and pump power. Therefore, a channel of any wavelength can be amplified by a RA with a proper pump source. Our compensation scheme is demonstrated in the S-, C-, and L-bands of the UWB WDM system described in Section 2. The optimization setup for the S-, C-, and L-bands in the UWB WDM system is shown in Figure 11. A RA is added after the fiber transmission, and the pump source of the RA is connected to a control unit, which introduces a PPSO algorithm to control the pump wavelength and pump power of the RA according to the flatness of the output power spectrum. The pseudo-code of the PPSO algorithm is shown in Algorithm 1.
Algorithm 1 Partitioned particle swarm optimization.
  • Initialize v k , v k , k = 1 , , m
  • Compute f ( x k , 0 ) , B k p x k k = 1 , , m
  •  for  i = 1 to N   do
  •       Compute f ( x k , i ) , k = 1 , , m
  •       Compute f x i ¯ mean f x k , i
  •       Compute B t g
  •       Compute Δ B g B g B t g
  •        if  Δ B g < δ  then
  •             c c + 1
  •        end if
  •        if   c > c max  then
  •             if   f x k , i < f x k , i 1 , k = 1 , , m  then
  •                  x k , i x k , i 1 Gaussian ( 1 , 1 )
  •             else
  •                  x k , i x k , i 1
  •             end if
  •        else
  •             if  f x k i > f x i ¯ , k = 1 , , m  then
  •                  n t ( t max t ) / t
  •                  x k , i x k , i 1 [ 1 + n t C ( 0 , 1 ) ]
  •             else
  •                  v k , i c 1 v k , i 1 + c 2 rand · B k , i 1 p v k , i 1
  •                            + c 3 rand · B k , i 1 g v k , i 1
  •                  x k , i x k , i 1 + v i
  •             end if
  •       end if
  • end for
Firstly, each parameter is bounded, including the particle swarm D, the number of particles m, maximum iteration N, velocity bounds v m i n and v m a x , learning factors c 1 , c 2 , c 3 , and the threshold of the global optimal solution δ . Then, the position and velocity of each particle in the particle swarm are randomly initialized. The fitness value (FV) of each particle f ( x k , i ) , k = 1 , , m , the individual optimal solution B k p , and the global optimal solution (GOS) of the particle swarm B k g are calculated. The variation of GOS Δ B g and the average value of FV f x i ¯ also need to be obtained. The count c will be incremented by one if Δ B g is less than the variation threshold δ . When c > c max , the optimization is considered to be caught in the local optimum, and then strategy 1 is introduced to move out of the local optimum. On the contrary, strategy 2 is used to update.
Strategy 1. The positions of the particles are updated by adding a Gaussian disturbance to avoid falling into the local optimum. The updated formula is as follows:
x k , i = x k , i 1 Gaussian ( 1 , 1 ) f x k , i < f x k , i 1 x k , i 1 f x k , i f x k , i 1
where Gaussian ( 1 , 1 ) denotes a Gaussian function with a mean of 1 and variance of 1. If the fitness of the updated parameter is less than that of the original, the parameters of the swarm will be updated according to (3). Otherwise, the original parameter array remains unchanged.
Strategy 2. The particles are grouped according to their fitness values. For f x k , i < f x i ¯ , the particle is considered a preferred particle, while for f x k , i f x i ¯ , the particle is considered a suboptimal particle. For the preferred particles, the Cauchy formula is introduced to update the parameters and more particles are generated in the preferred region to enhance the global detection of the particles. The formula is as follows:
X i + 1 = X i · 1 + n t · C ( 0 , 1 ) n t = t max t t max
where C ( 0 , 1 ) is the random number generated by the Cauchy distribution function, t max is the maximum number of iterations, and t is the current number of iterations. For the suboptimal particles, the particles should be accelerated to the evolution of the preferred particles, and the parameters are updated by the following formula:
v k , i = c 1 v k , i 1 + c 2 rand · B k , i 1 p v k , i 1 + c 3 rand · B k , i 1 g v k , i 1
x k , i = x k , i 1 + v i
where denotes a random value from 0 to 1.
Note that the particle update speed and position should be limited. If the velocity or the position of the particle exceeds the set range, the boundary value is used as the updated value. When the maximum number of iterations is reached, the optimization is terminated after updating all particles, and the optimal positions of the particles and the global optimal solution are produced as outputs.
For this algorithm, the population is dynamically divided into two subgroups, and different evolutionary mechanisms are designed for the particles in each subgroup, which can enhance the diversity of the population and accelerate the speed of obtaining the global optimal solution. Meanwhile, the algorithm overcomes the problem of being trapped in the local optimum by adding a Gaussian interference.

3.2. Simulation and Results

In the simulation, the optimal launch power values for the S, C, and L-band WDM transmissions are 4, 5, and 6 dBm, respectively, by using the method in Section 2. The power optimization scheme based on RA with PSO (Raman-PSO) or RA with PPSO (Raman-PPSO) is investigated for both the 3 dBm launch power scenario and the scenario with optimized launch powers. The pump wavelength and pump power are employed as optimization parameters, and the mean squared deviation of the output signal spectrum is considered the particle fitness. The exact form of fitness can be expressed as
σ = i = 1 n X I E ( X ) 2 n
where n is the initial number of particles, X I is the output signal power, E ( X ) is the average value of the output signal spectrum. The parameters of the algorithm and the optimization parameters of the two power optimization schemes are given in Table 3 and Table 4, respectively.
In Figure 12, the yellow carve indicates the tilt in the output power spectrum due to the transfer of the signal power from the S-band to the L-band induced by the ISRS. We define the power tilt Δ P = P m a x P m i n . For launch power = 3 dBm, the unoptimized Δ P is 9.55 dB and the Δ P s are 1.93 dB and 1.44 dB after optimization by both Raman-PSO and Raman-PPSO schemes, respectively. The latter scheme can effectively compensate for ISRS and it provides a 0.49 dB improvement over the Raman-PSO scheme. For optimal launch power, Δ P reaches a considerable 18 dB. After optimization, Δ P s are 4.45 dB and 2.93 dB for Raman-PSO and Raman-PPSO, respectively, which means a much flatter received power profile for Raman-PPSO. Figure 13 shows the fitness value as a function of the number of iterations, the proposed Raman-PPSO scheme iterates 10% faster than Raman-PPSO, which indicates more efficient power tilt mitigation.
To evaluate the system transmission performance, three wavelength channels from the S-, C-, and L-bands were received: 1496, 1550, and 1600 nm. Figure 14 shows the system performance without optimization, with Raman-PSO and Raman-PPSO optimization. For launch power = 3 dBm, the OSNR of the short-wavelength channel shows wavelength dependence due to the power transfer, and the OSNRs of the three channels in the S-, C-, and L-bands without optimization are 27.8, 32.3, and 35 dB. For the Raman-PPSO scheme, the OSNRs of the three channels are 34.2, 34.2, and 36.1 dB, respectively. For the Raman-PPSO scheme, the OSNRs of the three channels are 35.9, 34.7, and 36.2 dB, respectively. The OSNR of the short-wavelength channel is effectively enhanced. The GMI curves show a similar trend, with the GMI of the Raman-PPSO scheme being 2.5 bits/symbol higher than that of the unoptimized GMI in the S-band test channel. There is a slight improvement in the C/L band optimization. For the optimal launch power, the GMI of the Raman-PPSO scheme is 1.2 bits/symbol higher than the unoptimized GMI and 0.2 bits/symbol higher than the Raman-PSO scheme in the S-band test channel. The Raman-PSO scheme and Raman-PPSO scheme mitigate the wavelength-dependent performance degradation due to the power tilt and maintain the performance of long-wavelength channels. This implies that there is a significant performance in the machine learning-assisted RA after fiber transmission in compensating for the multi-band power tilt. In addition, the PPSO algorithm is superior in terms of convergence accuracy and convergence rate compared to the PSO algorithm.

3.3. Discussion

In this section, we utilize machine learning-assisted RAs to compensate for the power tilt induced by ISRS after optical fiber transmission. A PPSO algorithm is proposed in this study for controlling the pump wavelength and pump power of RAs. An analysis was conducted on the performance of the PPSO algorithm in compensating for the power tilt.
The limitations of the Raman-PPSO scheme also need to be discussed. Specifically, the scheme is limited to the S, C, and L wavelength bands, and finding a feasible solution becomes increasingly difficult when there are fewer particles involved. The stochastic nature of the PPSO algorithm further complicates the search for a solution that can compensate for all five wavelength bands. To address these challenges, future research will focus on developing machine learning-assisted Raman amplification schemes with wider bandwidths. Additionally, there is a need to further examine the performance and cost implications of applying this scheme to multi-span systems.

4. Conclusions

In this paper, we present a demonstration of a five-band WDM system that uses an adaptive modulation format assignment based on channel characteristics, employing 16QAM for the O/E-band and 32QAM for the S-, C-, and L-bands. We analyze the impairments of the five-band WDM transmission, including Kerr nonlinearity and ISRS, and optimize the transmission power for each band accordingly. The impact of the ISRS-induced wavelength-dependent power distribution on the system throughput was also analyzed. Furthermore, we propose a power tilt compensation scheme using RA and the PPSO algorithm that effectively mitigates the wavelength dependence of OSNR and power tilt in the S-, C-, and L-bands. Our results demonstrate that the power tilt is reduced from 18 to 2.93 dB, and the GMI of the S-band increases by 2.5 bits/symbol. We also discuss the potential applications of UWB WDM systems and highlight issues for future research. However, we acknowledge the bandwidth limitation of the Raman-PPSO scheme for S-, C-, and L-bands and suggest future research to develop machine learning-assisted Raman amplification schemes with wider bandwidths.

Author Contributions

Conceptualization, F.T.; methodology, Y.W.; software, Y.W. and X.Y.; validation, F.T., T.W. and Y.W; formal analysis, T.W.; investigation, T.W.; resources, Y.W.; data curation, Y.W. and T.W.; writing—original draft preparation, Y.W., X.Y.; writing—review and editing, T.W., X.Y., Y.C. and R.U.; visualization, T.W. and Y.G.; supervision, F.T. and Y.G.; project administration, F.T. and Q.Z.; funding acquisition, F.T. All authors have read and agreed to the published version of the manuscript.

Funding

This research was funded by the National Key R&D Program of China under grant number 2018YFB1800900, in part by the National Natural Science Foundation of China (NSFC) under grants 62021005, 62027819, supported by BUPT Excellent Ph.D. Student Foundation under grant number CX2022122,  the joint fund project of the Ministry of Education for equipment advance research under grant number 8091B032133 and Key Research and Development Plan of Changzhou City under grant number CE20225005.

Institutional Review Board Statement

Not applicable.

Informed Consent Statement

Not applicable.

Data Availability Statement

Data underlying the results presented in this paper are not publicly available at this time but may be obtained from the authors upon reasonable request.

Conflicts of Interest

The authors declare no conflict of interest.

References

  1. Cisco. Cisco Annual Internet Report (2018–2023) White Paper; Cisco: San Jose, CA, USA, 2020. [Google Scholar]
  2. Cisco. 2021 Global Networking Trends Report; Cisco: San Jose, CA, USA, 2020. [Google Scholar]
  3. Qian, D.; Huang, M.F.; Ip, E.; Huang, Y.K.; Shao, Y.; Hu, J.; Wang, T. 101.7 Tb/s (370 × 294-Gb/s) PDM-128QAM-OFDM transmission over 3 × 55-km SSMF using pilot-based phase noise mitigation. In Proceedings of the Optical Fiber Communication Conference, Los Angeles, CA, USA, 6–10 March 2011; p. PDPB5. [Google Scholar]
  4. Puttnam, B.J.; Rademacher, G.; Luís, R.S. Space-division multiplexing for optical fiber communications. Optica 2021, 8, 1186–1203. [Google Scholar] [CrossRef]
  5. Rademacher, G.; Puttnam, B.J.; Luís, R.S.; Eriksson, T.A.; Fontaine, N.K.; Mazur, M.; Chen, H.; Ryf, R.; Neilson, D.T.; Sillard, P.; et al. 1.01 Peta-bit/s C+ L-band transmission over a 15-mode fiber. In Proceedings of the 2020 European Conference on Optical Communications (ECOC), Brussels, Belgium, 6–10 December 2020; pp. 1–4. [Google Scholar]
  6. Rademacher, G.; Puttnam, B.J.; Luís, R.S.; Sakaguchi, J.; Klaus, W.; Eriksson, T.A.; Awaji, Y.; Hayashi, T.; Nagashima, T.; Nakanishi, T.; et al. Multi-span transmission over 65 km 38-core 3-mode fiber. In Proceedings of the 2020 European Conference on Optical Communications (ECOC), Brussels, Belgium, 6–10 December 2020; pp. 1–4. [Google Scholar]
  7. Kong, D.; Jørgensen, A.; Henriksen, M.; Klejs, F.; Ye, Z.; Helgason, Ò.; Hansen, H.; Hu, H.; Yankov, M.; Forchhammer, S.; et al. Single dark-pulse kerr comb supporting 1.84 Pbit/s transmission over 37-core fiber. In Proceedings of the CLEO: QELS_Fundamental Science, Washington, DC, USA, 10–15 May 2020; p. JTh4A–7. [Google Scholar]
  8. Singh, J.; Ahrens, A.; Lochmann, S. Joint Pre-and Post-Equalization with Higher-Order Modulation Formats in SDM-Based Optical MIMO Systems. Photonics 2022, 9, 876. [Google Scholar] [CrossRef]
  9. Ferrari, A.; Napoli, A.; Fischer, J.K.; Costa, N.; D’Amico, A.; Pedro, J.; Forysiak, W.; Pincemin, E.; Lord, A.; Stavdas, A.; et al. Assessment on the achievable throughput of multi-band ITU-T G. 652. D fiber transmission systems. J. Light. Technol. 2020, 38, 4279–4291. [Google Scholar] [CrossRef]
  10. Renaudier, J.; Meseguer, A.C.; Ghazisaeidi, A.; Tran, P.; Muller, R.R.; Brenot, R.; Verdier, A.; Blache, F.; Mekhazni, K.; Duval, B.; et al. First 100-nm continuous-band WDM transmission system with 115Tb/s transport over 100km using novel ultra-wideband semiconductor optical amplifiers. In Proceedings of the 2017 European Conference on Optical Communication (ECOC), Gothenburg, Sweden, 17–21 September 2017; pp. 1–3. [Google Scholar]
  11. Hamaoka, F.; Minoguchi, K.; Sasai, T.; Matsushita, A.; Nakamura, M.; Okamoto, S.; Yamazaki, E.; Kisaka, Y. 150.3 Tb/s ultra-wideband (S-, C-, and L-bands) single-mode fibre transmission over 40-km using > 519Gb/s/A PDM-128QAM signals. In Proceedings of the 2018 European Conference on Optical Communication (ECOC), Rome, Italy, 23–27 September 2018; pp. 1–3. [Google Scholar]
  12. Galdino, L.; Edwards, A.; Yi, W.; Sillekens, E.; Wakayama, Y.; Gerard, T.; Pelouch, W.S.; Barnes, S.; Tsuritani, T.; Killey, R.I.; et al. Optical fibre capacity optimisation via continuous bandwidth amplification and geometric shaping. IEEE Photonics Technol. Lett. 2020, 32, 1021–1024. [Google Scholar] [CrossRef]
  13. Okamoto, S.; Minoguchi, K.; Hamaoka, F.; Horikoshi, K.; Matsushita, A.; Nakamura, M.; Yamazaki, E.; Kisaka, Y. A study on the effect of ultra-wide band WDM on optical transmission systems. J. Light. Technol. 2019, 38, 1061–1070. [Google Scholar] [CrossRef]
  14. Puttnam, B.J.; Luís, R.S.; Rademacher, G.; Mendez-Astudillio, M.; Awaji, Y.; Furukawa, H. S-, C-and L-band transmission over a 157 nm bandwidth using doped fiber and distributed Raman amplification. Opt. Express 2022, 30, 10011–10018. [Google Scholar] [CrossRef] [PubMed]
  15. Puttnam, B.J.; Luís, R.S.; Rademacher, G.; Awaji, Y.; Furukawa, H. Investigation of Long-Haul S-, C-+ L-Band Transmission. In Proceedings of the Optical Fiber Communication Conference, Washington, DC, USA, 6–11 June 2022; p. W3C-5. [Google Scholar]
  16. Hazarika, P.; Tan, M.; Donodin, A.; Noor, S.; Phillips, I.; Harper, P.; Stone, J.S.; Li, M.J.; Forysiak, W. E-, S-, C-and L-band coherent transmission with a multistage discrete Raman amplifier. Opt. Express 2022, 30, 43118–43126. [Google Scholar] [CrossRef] [PubMed]
  17. Ghazisaeidi, A.; Arnould, A.; Ionescu, M.; Aref, V.; Mardoyan, H.; Etienne, S.; Duval, M.; Bastide, C.; Bissessur, H.; Renaudier, J. 99.35 Tb/s Ultra-wideband Unrepeated Transmission Over 257 km Using Semiconductor Optical Amplifiers and Distributed Raman Amplification. J. Light. Technol. 2022, 40, 7014–7019. [Google Scholar] [CrossRef]
  18. Virgillito, E.; London, E.; D’Amico, A.; Correia, B.; Napoli, A.; Curri, V. Single-vs. Multi-Band Optimized Power Control in C+ L WDM 400G Line Systems. In Proceedings of the 2021 Optical Fiber Communications Conference and Exhibition (OFC), San Francisco, CA, USA, 6–11 June 2021; pp. 1–3. [Google Scholar]
  19. Roberts, I.; Kahn, J.M.; Harley, J.; Boertjes, D.W. Channel power optimization of WDM systems following Gaussian noise nonlinearity model in presence of stimulated Raman scattering. J. Light. Technol. 2017, 35, 5237–5249. [Google Scholar] [CrossRef]
  20. Semrau, D.; Killey, R.I.; Bayvel, P. The Gaussian noise model in the presence of inter-channel stimulated Raman scattering. J. Light. Technol. 2018, 36, 3046–3055. [Google Scholar] [CrossRef]
  21. Shevchenko, N.A.; Nallaperuma, S.; Savory, S.J. Maximizing the information throughput of ultra-wideband fiber-optic communication systems. Opt. Express 2022, 30, 19320–19331. [Google Scholar] [CrossRef] [PubMed]
  22. Lasagni, C.; Serena, P.; Bononi, A.; Antona, J.C. A Generalized Raman Scattering Model for Real-Time SNR Estimation of Multi-Band Systems. J. Light. Technol. 2023; early access. [Google Scholar]
  23. Hamaoka, F.; Nakamura, M.; Okamoto, S.; Minoguchi, K.; Sasai, T.; Matsushita, A.; Yamazaki, E.; Kisaka, Y. Ultra-wideband WDM transmission in S-, C-, and L-bands using signal power optimization scheme. J. Light. Technol. 2019, 37, 1764–1771. [Google Scholar] [CrossRef]
  24. Correia, B.; Sadeghi, R.; Virgillito, E.; Napoli, A.; Costa, N.; Pedro, J.; Curri, V. Optical power control strategies for optimized C+ L+ S-bands network performance. In Optical Fiber Communication Conference; Optica Publishing Group: Washington, DC, USA, 2021; p. W1F-8. [Google Scholar]
  25. Correia, B.; Sadeghi, R.; Virgillito, E.; Napoli, A.; Costa, N.; Pedro, J.; Curri, V. Power control strategies and network performance assessment for C+ L+ S multiband optical transport. J. Opt. Commun. Netw. 2021, 13, 147–157. [Google Scholar] [CrossRef]
  26. Luo, H.; Lu, J.; Huang, Z.; Yu, C.; Lu, C. Optimization strategy of power control for C+ L+ S band transmission using a simulated annealing algorithm. Opt. Express 2022, 30, 664–675. [Google Scholar] [CrossRef] [PubMed]
  27. Landero, S.E.; de Jauregui Ruiz, I.F.; Ferrari, A.; Le Gac, D.; Frignac, Y.; Charlet, G. Link Power Optimization for S+ C+ L Multi-band WDM Coherent Transmission Systems. In Proceedings of the 2022 Optical Fiber Communications Conference and Exhibition (OFC), San Diego, CA, USA, 24–28 March 2022; pp. 1–3. [Google Scholar]
  28. De Moura, U.C.; Iqbal, M.A.; Kamalian, M.; Krzczanowicz, L.; Da Ros, F.; Brusin, A.M.R.; Carena, A.; Forysiak, W.; Turitsyn, S.; Zibar, D. Multi–band programmable gain Raman amplifier. J. Light. Technol. 2020, 39, 429–438. [Google Scholar] [CrossRef]
  29. Agrawal, G.P. Lightwave Technology: Telecommunication Systems; John Wiley & Sons: Hoboken, NJ, USA, 2005. [Google Scholar]
  30. Carena, A.; Curri, V.; Bosco, G.; Poggiolini, P.; Forghieri, F. Modeling of the impact of nonlinear propagation effects in uncompensated optical coherent transmission links. J. Light. Technol. 2012, 30, 1524–1539. [Google Scholar] [CrossRef]
  31. Semrau, D.; Sillekens, E.; Bayvel, P.; Killey, R.I. Modeling and mitigation of fiber nonlinearity in wideband optical signal transmission. J. Opt. Commun. Netw. 2020, 12, C68–C76. [Google Scholar] [CrossRef]
  32. Minoguchi, K.; Okamoto, S.; Hamaoka, F.; Matsushita, A.; Nakamura, M.; Yamazaki, E.; Kisaka, Y. Experiments on stimulated Raman scattering in S-and L-bands 16-QAM signals for ultra-wideband coherent WDM systems. In Proceedings of the Optical Fiber Communication Conference, San Diego, CA, USA, 11–15 March 2018; p. Th1C-4. [Google Scholar]
  33. Saavedra, G.; Semrau, D.; Tan, M.; Iqbal, A.; Elson, D.J.; Galdino, L.; Harper, P.; Killey, R.I.; Bayvel, P. Inter-channel stimulated Raman scattering and its impact in wideband transmission systems. In Proceedings of the 2018 Optical Fiber Communications Conference and Exposition (OFC), San Diego, CA, USA, 11–15 March 2018; pp. 1–3. [Google Scholar]
Figure 1. System schematic for the 5-band WDM transmission.
Photonics 10 00530 g001
Figure 2. SNR versus OSNR for five wavelengths in different bands.
Photonics 10 00530 g002
Figure 3. OSNR versus launch power for five wavelengths in different bands.
Photonics 10 00530 g003
Figure 4. BER of individual channels in five bands as a function of OSNR.
Photonics 10 00530 g004
Figure 5. BER of individual channels in five bands as a function of launch power.
Photonics 10 00530 g005
Figure 6. The BER of the test channel as a function of OSNR in five-band WDM transmission.
Photonics 10 00530 g006
Figure 7. The GMI and Δ G M I of the test channel as a function of OSNR in five-band WDM transmission.
Photonics 10 00530 g007
Figure 8. The GMI of the test channel with and without ISRS as a function of launch power in five-band WDM transmission.
Photonics 10 00530 g008
Figure 9. Power transfer in the 5-band transmission.
Photonics 10 00530 g009
Figure 10. SNR and GMI as functions of the wavelength in the five-band WDM transmission at the optimal launch power. The illustration below shows the constellation of each band.
Photonics 10 00530 g010
Figure 11. The optimization setup for the S-, C-, and L-bands in the UWB WDM system.
Photonics 10 00530 g011
Figure 12. Output power spectrum for no optimization, and optimization with Raman-PSO and Raman-PPSO, respectively. (a) Launch power = 3 dBm; (b) the launch power is the optimal launch power.
Photonics 10 00530 g012
Figure 13. Fitness value versus iteration for optimization schemes.
Photonics 10 00530 g013
Figure 14. OSNR and GMI versus wavelength for no optimization, and optimization with Raman-PSO and Raman-PPSO, respectively. (a) Launch power = 3 dBm; (b) the launch power is the optimal launch power.
Photonics 10 00530 g014
Table 1. Trends of the SMF transmission beyond the C+L band.
Reference[13][16][15][17][10][11][12][14]
Capacity
(Tbits/s)
-~354699.35115.9150.3178.08256.4
Distance
(km)
607010,072257100404054
Bandwidth
(THz)
23.525.815.112.3312.713.616.8319.8
WDM
band
O, E, S, C, LE, S, C, LS, C, LS, C, LS, C, LS, C, LS, C, LS, C, L
Transmission
fiber
LWPFSSMFSSMFPSCFSSMFLWPFCorning®
SMF-28®
ULL fiber
SSMF
AmplifierSOA
PDFA
TDFA
EDFA
DRA
BDFA
TDFA
EDFA
TDFA
EDFA
SOA
DRA
SOAEDFA
TDFA
EDFA
TDFA
DRA
TDFA
EDFA
Number
of channels
625148552247250272660793
WDM spacing
(GHz)
37.5100255050100/5025.525
Baud rate
(Gbaud)
323024.54949452524.5
Modulation
format
QPSK
16QAM
16QAMQPSK16QAM
PCS-64QAM
PCS-64QAM128QAMGS-64QAM
GS-256QAM
GS-1024QAM
256QAM
SSMF = standard single mode fiber, PSCF = pure silica core fiber, SOA = semiconductor optical amplifier, LWPF = low water peak fiber, DRA = distributed Raman amplifier, BDFA = bismuth-doped fiber amplifier, TDFA = thulium-doped fiber amplifier, PDFA = praseodymium-doped fiber amplifier, EDFA = erbium-doped fiber amplifier, PCS = probabilistically constellation shaped, GS = geometrically shaped.
Table 2. Parameters of different bands [9].
BandWavelength
(nm)
Frequency
(THz)
Bandwidth
(THz)
Nonlinear
Coefficient
(1/W/km)
Attenuation
Coefficient
(dB/km)
CD
Coefficient
(ps/nm/km)
O1260–1360220.59–238.1017.251.60.38–0.28−5–4
E1360–1460205.48–220.5914.811.50.28–0.224–12
S1460–1530196.08–205.489.131.40.22–0.1812–16
C1530–1565191.69–196.084.131.30.1816–18
L1565–1625184.62–191.696.961.280.1818–22
Table 3. The parameters of the PPSO algorithm.
ParameterValueParameterValue
D30 x m i n 1579 nm
m20 c 1 0.3
v m a x 10 c 2 1.5
v m i n −10 c 3 1.5
x m a x 1250 nm δ 0.1
Table 4. Optimization parameters of Raman-PSO and Raman-PPSO.
Raman-PSO Raman-PPSO
Pump Wavelength
(nm)
Pump Power
(dBm)
Pump Wavelength
(nm)
Pump Power
(dBm)
Figure 11a1476.7231498.822.6
1419.6201367.824.2
144121.21494.919.2
Figure 11b1466.2221375.223.2
1409.121.51498.622.4
1388.220.1145520.1
Disclaimer/Publisher’s Note: The statements, opinions and data contained in all publications are solely those of the individual author(s) and contributor(s) and not of MDPI and/or the editor(s). MDPI and/or the editor(s) disclaim responsibility for any injury to people or property resulting from any ideas, methods, instructions or products referred to in the content.

