Article

Development of Taper-in-Taper-Based Optical Fiber Sensors for Chemical and Biological Sensing

1
Shandong Key Laboratory of Optical Communication Science and Technology, School of Physics Science and Information Technology, Liaocheng University, Liaocheng 252059, China
2
College of Agronomy, Liaocheng University, Liaocheng 252059, China
*
Authors to whom correspondence should be addressed.
Photonics 2023, 10(5), 567; https://doi.org/10.3390/photonics10050567
Submission received: 14 April 2023 / Revised: 9 May 2023 / Accepted: 10 May 2023 / Published: 11 May 2023
(This article belongs to the Special Issue Optically Active Nanomaterials for Sensing Applications)

Abstract

:
This paper presents the development of taper-in-taper fiber (TITF)–optical fiber-based sensors for chemical and biological detection. TITF structure is a fiber structure formed by fabricating a taper again on the taper region of the traditional taper fiber. The experimental results show that the TITF structure has a lower transmitted intensity than the common taper fiber structure. It is demonstrated that the structure of TITF is more conducive to evanescent waves, thereby making it more sensitive to changes in the refractive index (RI) of the external environment. To confirm this, measurements of ethanol solutions with different water contents are taken using the TITF structure to showcase the chemical sensing, thus verifying its sensitivity to RI changes in the external environment. The sensor can measure ethanol solutions from 0 to 100% with a sensitivity of 4.06 a.u./%. Thereafter, the TITF sensor is modified with ZnO-NPs to enhance its sensitivity for biological sensing (creatinine detection). The transmitted intensity of different concentrations of creatinine solution (0–2000 μM) is measured using the proposed sensor. The sensor showed good linearity and a high sensitivity of 0.11 a.u./μM for creatinine solution. Therefore, it is demonstrated that the TITF sensor with ZnO-NPs can be used for effective biological sensing.

1. Introduction

In recent years, biological and chemical sensors have a wide range of applications in environmental monitoring, medical health monitoring, and food safety quality testing [1]. Due to biological and chemical sensors playing an important role in many fields, manufacturing a low-cost and highly sensitive sensor remains an important challenge [2]. Ethanol is a versatile substance that plays a significant role in various industries, including food, electronics, biomedical, and chemical [3]. Testing for ethanol in aqueous solutions is crucial to ensure safety and quality in these fields [4]. However, traditional detection methods, such as mass spectrometry and high-performance liquid chromatography, have limitations, including complex operations, larger test samples, and professionally trained operators [5]. Furthermore, the use of traditional sensors that rely on resistance and voltage changes is restricted by the high volatility, corrosion, and flammability of ethanol. Therefore, there is a need for more advanced and efficient sensors that can accurately and reliably detect ethanol in aqueous solutions, without the limitations of traditional methods. Similarly, biological products such as creatinine are the end-products of human muscle metabolism that are filtered out of the body by the glomeruli [6]. The precise determination of creatinine concentration in bodily fluids and urine holds significant clinical implications, as it reflects the normal functioning of the kidneys [7]. Generally, serum creatinine levels in healthy humans range between 0 μM and 150 μM [8], but in individuals with abnormal kidney function, it can exceed 800 μM [9], while patients with severe uremia may have levels reaching up to 2000 μM [10]. Thus, it is necessary to develop a sensor that can accurately and conveniently detect creatinine concentrations. The traditional methods for measuring creatinine include spectrophotometry [11], colorimetry, high-pressure liquid chromatography (HPLC) [12], capillary zone electrophoresis, and nuclear magnetic resonance (NMR). There are problems with each of these approaches. For example, spectrophotometry and colorimetry require the use of standard curves, and the preparation and preservation of standard curves have a great influence on the accuracy of measurement results. HPLC and capillary zone electrophoresis require high technical level and expensive equipment, but also have problems in separation efficiency, repeatability, stability and so on. NMR has very high resolution and accuracy, but it is not suitable for routine clinical testing because it is expensive, complex to operate, and requires a large number of samples. In order to overcome these problems of traditional creatinine measurement methods, modern creatinine measurement methods are using nanotechnology. Molecular imprinting polymer (MIP) is a method based on molecular recognition, which can design sensors with high selectivity and sensitivity according to the structural characteristics of creatinine [13]. The electrochemical method can measure the concentration of creatinine by measuring the electrochemical reaction between creatinine and the electrodes [14]. The amperometric biosensor, potential biosensor, conductance biosensor, impedance sensor, and chemiluminescence sensor use the interaction between creatinine and specific biomolecular or chemical substance to achieve measurement [15,16]. Fiber optic biosensors can measure biomolecules using specially treated optical fibers and enhanced sensing by coating the fiber with nanoparticles (NPs). These methods are not only highly sensitive and selective, but also simple, rapid, and accurate, and have become one of the main means of modern clinical creatinine detection.
Optical fiber as a transmission medium has been a great success in the field of information transmission [17]. It has many advantages over other transmission media, such as small size, high immunity to electromagnetic interference, corrosion resistance, and high sensitivity [18]. Besides communication, optical fiber can also be used for sensing various physical parameters, including temperature, humidity, and pressure [19]. Optical fiber sensors have applications in different fields, such as biomedical [20], civil engineering [21], aerospace [22], and environmental protection [23]. To date, several kinds of optical fiber sensors with different structures have been developed, including photonic crystal fiber [24], fiber Bragg grating [25], long-period fiber grating [26], optical microfiber [27], and taper optical fiber (TOF) [28]. Among them, TOF has gradually become a research hotspot because of its simple structure, easy production, production precision control, and many other advantages [29]. Due to the advantages of TOF, it is often used in combination with other fiber structures to form new fiber structures such as chirped tapered FBGs [30], it has good applications for measuring temperature and stress [31]. The taper-in-taper fiber (TITF) structure is formed by fabricating a second TOF structure on the taper region of the TOF. Wang et al. propose a TITF structure, that is based on a TOF due to the addition of a taper treatment to the traditional taper structure, the new taper region shape is more suitable for exciting evanescent fields in sensitive areas, resulting in more high-power electromagnetic waves [32]. Gong et al. develop a highly sensitive TITF sensor using mode–mode interference technology. The influence of optical fiber physical parameters on the sensor performance is systematically studied and optimized [28].
Fiber optic biosensors are a type of biosensor that use specially treated optical fibers to measure biomolecules. These fibers are typically coated with a thin layer of a bioreceptor, which is a molecule that binds specifically to the target biomolecule of interest. When the target biomolecule binds to the bioreceptor, it causes a change in the optical properties of the fiber, which can be detected and quantified using various optical techniques [33]. To enhance the sensitivity and selectivity of fiber optic biosensors, NPs can be functionalized with specific biomolecules to increase the binding affinity and specificity towards the target analyte [34]. Fiber optic biosensors are a promising new technology with a wide range of potential applications, including environmental monitoring, food safety, and clinical diagnostics.
With the development of nanotechnology, biosensors based on nanomaterials (NMs) have gradually become a research hotspot. NPs are materials that have at least one dimension in the nanoscale range (1–100 nm), that can effectively improve the execution capacity of biosensor devices [3]. In particular, metal oxide NPs are a type of NMs with unique properties that enable them to facilitate rapid electron exchange between the electrode and the enzyme active site [35]. As a direct band-gap semiconductor material, the zinc oxide nanoparticles (ZnO-NPs) possess a high electron-transfer rate and good biocompatibility [36]. Meanwhile, as the functional material, the ZnO-NPs have the advantages of low cost, environmental protection, and excellent photoelectric characteristics [37].
This paper introduces an experimental study on the development of TITF structures for chemical and biological sensing. The TITF structure is produced by the Combiner Manufacturing System (CMS) through programmed control. Ethanol solutions with different water contents are measured using the proposed TITF structure to verify its sensitivity to RI changes in the external environment. To ensure the repeatability of the experiment, three TITF structures are used to measure their diameter distribution and transmitted intensity. The sensing region is enhanced by modifying TITF with ZnO-NPs and functionalizing it with creatinase. Then, different creatinine solutions (0–2000 μM) are measured with ZnO-NPs and creatinase-functionalized TITFs to showcase their effective biological sensing.

2. Materials and Methods

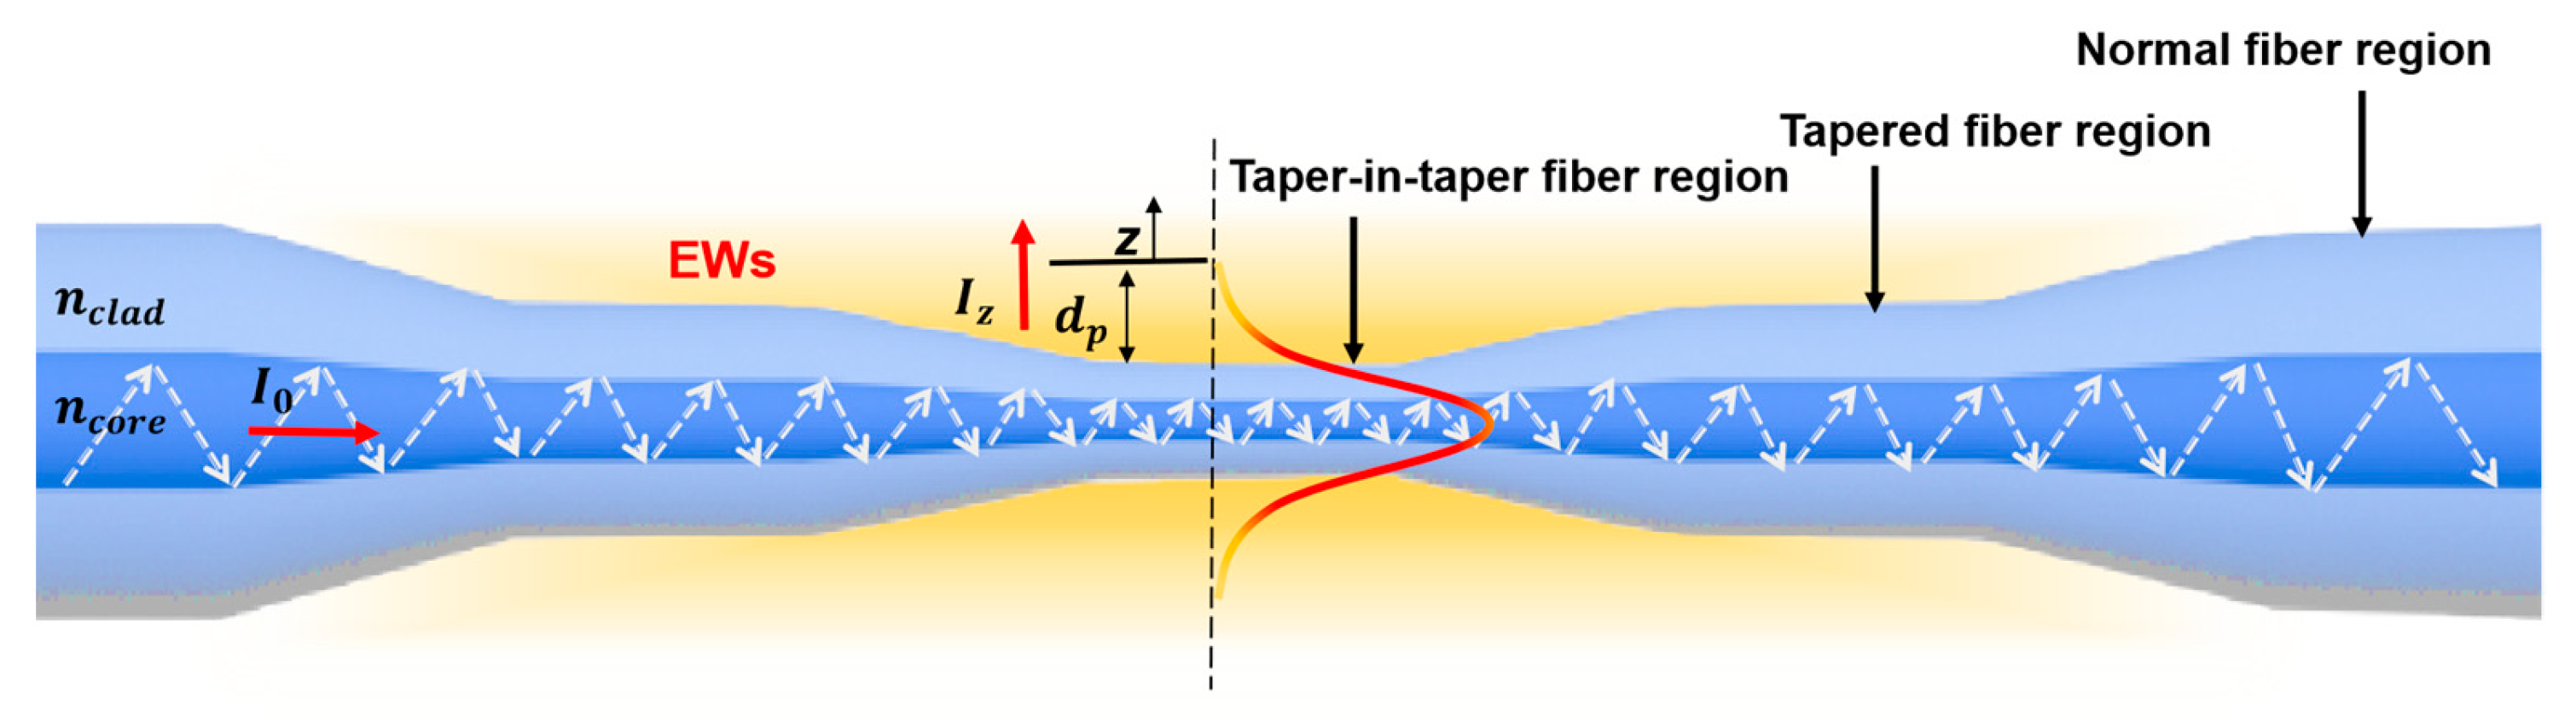
2.1. Working Principle

Light waves propagate inside the optical fiber structure through the total internal reflection. As shown in Figure 1, evanescent waves (EWs) is a decaying electromagnetic wave formed by a fiber core shooting into the cladding through the reflective surface [38]. The strength of the EWs decreases exponentially along the z-axis of the optical fiber in a mathematical relationship [39]:
I Z = I 0 e d z
where I Z is the penetrating light intensity, I 0 is the incident light intensity, and 𝑧 is the penetrating direction.
EWs decay to 1/e of the original value at the core-cladding interface, i.e., penetration depth ( d p ) [40]. The d p of EWs can be represented by the formula is:
d p = λ 2 π n c o r e 2 sin 2 θ i n c l a d 2
where n c o r e is the refractive index (RI) of the fiber core and n c l a d is the RI of the fiber cladding, θ is the angle of incidence. In ordinary optical fibers, this evanescent field is too weak to interact with the external environment. Therefore, according to the formula of the d p , the EWs can be effectively enhanced by reducing its d p and the diameter of the optical fiber [41]. TOF uses this principle to sense the changes in external RI. The TITF made in this experiment is to make a taper on the basis of TOF, that further enhances the intensity of the evanescent field in the taper area, thereby improving its sensitivity to the change of external RI.

2.2. Simulation of Taper-in-Taper Fiber Structure

In this experiment, the BPTMP algorithm in Rsoft is used for the simulation. First, a simulation model is built in Rsoft CAD with the same parameters as the TITF structure produced in this experiment. The ordinary single-mode fiber has a length of 500 μm, a diameter of 125 μm, and a core diameter of 8.2 μm. The first transition region has a length of 2000 μm, the first taper region has a length of 4000 μm and a diameter of 40 μm, the second transition region has a length of 500 μm, and the second taper region has a length of 2000 μm and a diameter of 20 μm.
The refractive index of the fiber is set to 1.4504 for the core and 1.4447 for the cladding, with a background_index of 1. The three-view and 3D model of the simulation model are shown in Figure 2a. Next, the fundamental mode data obtained from mode simulation is shown in Figure 2b. Finally, the type of the light source is set to the fundamental mode data obtained from the simulation.
Figure 3 shows the simulation results of the TITF structure using the Rsoft software. 1, Launch represents the total energy distribution of the light source incident on the core. 1, Mod 0 represents the energy distribution of the propagation modes in the core, while 2, Mod 0 represents the energy distribution of the propagation modes in the cladding. From the graph, it can be seen that when the light passes through the taper region, the energy of the core mode drops sharply while the energy of the cladding mode increases sharply. This makes the main propagation mode of the fiber in the taper region become the cladding propagation mode. At the same time, the core mode and the cladding mode continuously couple, causing oscillations in the energy distribution in the taper region. This simulation result shows that the TITF structure can excite strong cladding modes, which is beneficial for the generation of evanescent waves.

2.3. Experimental Instruments

In this experiment, CMS (3 SAE Technologies, INC., Franklin, TN, USA) is used to produce TITF. The light source is a tungsten–halogen lamp (Ocean Optics, HL-2000, Orlando, FL, USA) and a spectrometer (Ocean Optics, USB2000+, USA) is used to measure the spectra and display the results on a laptop. Scanning electron microscope (SEM, ZEISS, Gemini Carl-Zeiss-Microscopy, Tokyo, Japan) is used to observe the microstructure of the optical fiber. The microscope (JH Technologies, Leica S9i, Fremont, CA, USA) is used to observe the sub-microstructure of optical fiber.

2.4. Fabrication of Taper/Taper-in-Taper Fiber Structure

TOF are fabricated by using CMS as shown in Figure 4a. It works by heating the single-mode fiber (SMF) structure as shown in Figure 4b and then stretching it to reduce the cladding and core diameter of the fiber to develop a taper area by a set program [32]. TITF is developed by TOF as shown in Figure 4c, which are fabricated by repeating a taper with different taper diameter, such as Figure 4d.
In this experiment, TITF structure was fabricated using the CMS platform. The experimental steps were as follows: First, the removal of the SMF coating layer using fiber stripper. The surface dust of the exposed part of the fiber cladding was then cleaned with dust-free paper dipped in ethanol solution. Second, perform calibration of the CMS platform. By adjusting the position, distance, and pitch angle of the platform to achieve the exact position of the platform. Third, parameters such as taper length, fiber diameter, taper diameter, start power, taper power, and pulling taper speed of CMS were set in the program. The final step was to develop the TITF structure in the SMF. This involved pretreating the optical fiber before placing it into CMS and keeping the bare part of the optical fiber in position with electrodes. The first taper-pulling process was then controlled by program 1 (40 μm diameter) followed by a second taper at a specific place with program 2 (20 μm diameter).

2.5. Experimental Setup for Spectrum Measurement

The measurement setup is shown in Figure 5. The fabricated TITF is fixed to the fiber clamps to protect the optical fiber and ensure the stability of the experiment. First, the light source is turned on twenty minutes before to warm it up. Then, the coating layer at both ends of the optical fiber is stripped and wiped clean with a dust-free paper dipped in ethanol. After that, the TITF is fused to both ends of the measuring device. Finally, the spectrogram of TITF is viewed on the laptop.

3. Structural Analysis and Optimization

In a TOF structure, waist length, waist radius, and taper length are the key parameters affecting sensitivity [32]. The diameter distribution obtained by scanning the TITF using CMS is shown in Figure 6. In this experiment, a TITF structure with the first taper length of 8 mm and a taper area diameter of 40 μm is fabricated in Figure 6a. The second taper length is 3 mm and the taper area diameter is 20 μm, as shown in Figure 6b. To ensure the repeatability test of the experiment, three TOF are developed. The results show that the diameters of the three fiber structures of the two tapers are basically coincident, which proves that the CMS fabrication of the taper fiber has good repeatability.
The transmission spectra of three fibers are normalized separately to obtain the TOF transmission spectra shown in Figure 7a and the TITF transmission spectra shown in Figure 7b. It indicates that the fiber structure made in the experiment has good reproducibility. The transmission spectra of TOF and TITF are compared as shown in Figure 8. It is found that the transmitted intensity of TITF is lower than that of TOF. The result shows that during the transmission of light, more light will leak from the taper area to the external environment in comparison to TOF with respect to TITF. Therefore, it can be inferred that the TITF can sense the RI changes in the external environment better [42].
The taper diameter of the 40-20-40 μm TITF structure is too small, it can only withstand small tensile forces and is easy to fracture from the taper area in practical applications. Therefore, 80-40-80 μm TITF structure is used as the sensor probe in the optimization experiment. Diameter scanning to TITF using the CMS scanning function is shown in Figure 9a. It can be seen from the figure that the basic diameter distributions of the five probes are consistent, which proves that the TITF prepared in this experiment has good structural repeatability. Figure 9b shows the results of normalization of the transmitted intensity of five probes. It can be seen that the transmitted intensity peaks of five probes are also at the same position. This indicates that the probes developed in this experiment have great stability.
In this experiment, the novel nanomaterial ZnO-NPs is used to immobilize the sensing region of the fiber structure, the process is shown in Figure 10. Firstly, the tapered region of TITF probe was cleaned with acetone solution, and most organic impurities on the surface were removed to complete the first cleaning. After that, the fiber was put into Piranha solution (H2SO4:H2O2 = 7:3) for 30 min for secondary cleaning of the fiber to remove residual organic impurities on the surface of the fiber. In this process, the surface of the fiber is hydroxylated to facilitate the attachment of NPs. Then, the optical fiber is cleaned thoroughly with DI water and dried with nitrogen. The cleaned TITF probe is immersed in the prepared ZnO-NPs solution for 10 min, then placed in the oven for 20 min, and heated at 70 °C. This process is repeated three times to obtain an uniform ZnO-NPs layer on the probe surface [37]. ZnO-NPs are immobilized on the fiber structure that can also enhance the adhesion of biological enzymes. Finally, the probe was first carboxylated after being placed in an 11-mercaptocapric acid (MUA) ethanol solution (5 mL, 0.5 mM) for 5 h. N-(3-Dimethylaminopropyl)-N-ethyl carbodiimide hydrochloride (EDC) (5 mL, 200 mM) and N-Hydroxysuccinimide (NHS) (5 mL, 50 mM) solutions were then soaked for 30 min to activate the hydroxyl group on the surface of the fiber for enzyme attachment. Finally, the probe cone was immersed in creatinase enzyme solution (20 mL, 0.1 mM) for 12 h to complete the functional treatment of the probe enzyme, which can increase the probe’s sensitivity to creatinine through specific recognition. This enables the probes to measure different concentrations of creatinine solution.

4. Results and Discussions

The chemical sensing of the proposed structure is confirmed by testing the transmission spectra of TITF in ethanol solutions of different concentrations in the range of 0 to 100%. The sensing result is shown in Figure 11a. The transmitted intensity of TITF decreases with the increase in ethanol concentration. A linear fit to the peak of the measurement results is shown in Figure 11b. The fitting line equation is I = −4.06C + 28238.96 and its variance is 0.98524. It can be seen that the transmitted intensity of TITF is negatively correlated with the ethanol concentration, and the correlation degree is strong [43]. The sensor can measure ethanol solutions from 0 to 100 % with a sensitivity of 4.06 a.u./%. Real images of the developed TITF structure undertaken by SEM are shown in Figure 12. Figure 12a,b show the images of TITF at different positions. Due to the limitation of SEM magnification, the complete sensing area cannot visualize thus, a microscope is used to observe the overall morphology of the probe as shown in Figure 12c,d.
Figure 12c shows the full morphology results of TITF, and Figure 12d shows the higher magnification results of the taper area of the TITF. The ZnO-NPs layer on the surface of the TITF probe is observed by SEM, and the results are shown in Figure 13a. It can be seen from Figure 13b that ZnO-NP is uniformly and tightly distributed on the optical fiber surface.
For biological sensing, creatinine solutions with concentrations of 100 μM, 500 μM, 800 μM, 1000 μM, 1200 μM, 1400 μM, 1600 μM, and 2000 μM are used for measurement. The sensing results are shown in Figure 14a. The linear fitting figure is shown in Figure 14b. The sensitivity of the sensor is 0.11 a.u./μM. The linear fitting equation is as follows:
Y = 0.11 C + 45179.89
The ‘Y’ is the transmitted intensity, the ‘C’ represents the creatinine concentration in the test solution, the slope represents the sensitivity, and the relevant parameter is R 2 = 0.98905 . It can be concluded from Figure 14b that the test results have a good linear fit.
In this experiment, ZnO-NPs are used to increase the surface area to immobilize the enzyme and overall the sensitivity of the TITF taper region. The performance comparison between this sensor and existing sensors is shown in Table 1. The colorimetric citrate-capped AgNPs sensor has a high sensitivity but the detection range is small [6]. The method of Tri-enzyme functionalized ZnO-NPs/CHIT/c-MWCNT/PANI composite film for amperometric determination of creatinine is more complicated to fabricate and less convenient to test [44]. The chemiluminescence quantification platform [45] and the paper-based analytical device with an integrated composite electrode for non-enzymatic creatinine sensing [46] also have similar problems. Compared with other sensors, optical fiber biosensor has the advantages of small size, fast response, large measuring range, convenient operation, and high sensitivity.

5. Conclusions

The main work of this article is to showcase the detailed fabrication of TITF structure for chemical and biological sensing. Firstly, the water–ethanol mixture is detected through the 40-20-40 μm TITF structure, and then the creatinine solution concentration is detected by using ZnO-NPs improved TITF sensor. Experimental analysis is performed to compare the transmitted intensity of TITF and TOF. It is found that TITF had lower transmitted intensity than TOF. The transmitted intensity of TITF in ethanol solutions with varying water contents is also measured. It is observed that the transmittance of TITF decreased with increasing ethanol content. This result showed that TITF could measure the concentration change of 0–100% ethanol aqueous solution. To optimize the TITF structure, its diameter is changed to 80-40-80 μm and ZnO-NPs are coated on the taper region. Then, the probe is functionalized with creatinase enzyme and used to detect different concentrations of creatinine solution. The relationship between transmitted intensity and concentration is plotted, and a linear fitting is obtained. The sensitivities to ethanol and creatinine solutions are 4.06 a.u./% and 0.11 a.u./μM, respectively. Our study demonstrates the potential application of TITF structure in chemical and biological sensing.

Author Contributions

Writing—original draft preparation, F.L. and W.Z.; Writing—review and editing, X.L. (Xianzheng Lang), X.L. (Xuecheng Liu), R.S., B.Z. and S.K.; Validation, F.L. and W.Z.; Formal analysis, X.L. (Xianzheng Lang), R.S. and G.L.; Project administration, Funding acquisition—G.L., Y.X., R.S., B.Z. and S.K., Supervision, B.Z. and S.K. All authors have read and agreed to the published version of the manuscript.

Funding

This work is supported by the Double-Hundred Talent Plan of Shandong Province, China; the Special Construction Project Fund for Shandong Province Taishan Mountain Scholars; and the Natural Science Foundation of Shandong Province (ZR2020QC061; ZR2022QF137).

Institutional Review Board Statement

Not applicable.

Informed Consent Statement

Not applicable.

Data Availability Statement

Not applicable.

Acknowledgments

S. Kumar acknowledge to Double-Hundred Talent Plan of Shandong Province, China.

Conflicts of Interest

The authors declare no conflict of interest.

References

  1. Yao, X.; Zhang, Y.; Jin, W.; Hu, Y.; Cui, Y. Carbon Nanotube Field-Effect Transistor-Based Chemical and Biological Sensors. Sensors 2021, 21, 995. [Google Scholar] [CrossRef] [PubMed]
  2. Perri, C.; Arcadio, F.; D’Agostino, G.; Cennamo, N.; Porto, G.; Zeni, L. Chemical and Biological Applications Based on Plasmonic Optical Fiber Sensors. IEEE Instrum. Meas. Mag. 2021, 24, 50–55. [Google Scholar] [CrossRef]
  3. Zain, H.A.; Batumalay, M.; Rahim, H.R.A.; Yasin, M.; Harun, S.W. Single-walled carbon nanotubes coated D-shaped fiber for aqueous ethanol detection. Optoelectron. Lett. 2022, 18, 430–433. [Google Scholar] [CrossRef]
  4. Sampath, U.; Kim, D.-G.; Song, M. Hydrous Ethanol Detection Using a Graphene Oxide-Coated Fresnel Reflection Sensor. IEEE Sens. J. 2019, 19, 4069–4073. [Google Scholar] [CrossRef]
  5. Aziz, A.; Lim, H.N.; Girei, S.H.; Yaacob, M.H.; Mahdi, M.A.; Huang, N.M.; Pandikumar, A. Silver/graphene nanocomposite-modified optical fiber sensor platform for ethanol detection in water medium. Sens. Actuators B 2015, 206, 119–125. [Google Scholar]
  6. Alula, M.T.; Karamchand, L.; Hendricks, N.R.; Blackburn, J.M. Citrate-capped silver nanoparticles as a probe for sensitive and selective colorimetric and spectrophotometric sensing of creatinine in human urine. Anal. Chim. Acta 2018, 1007, 40–49. [Google Scholar] [CrossRef]
  7. Krishanu, S. A Review on the Development of Spectroscopic Sensors for the Detection of Creatinine in Human Blood Serum. Int. J. Life Sci. Pharma Res. 2022, 11, 91–101. [Google Scholar] [CrossRef]
  8. Pundir, C.S.; Kumar, P.; Jaiwal, R. Biosensing methods for determination of creatinine: A review. Biosens. Bioelectron. 2019, 126, 707–724. [Google Scholar] [CrossRef]
  9. Coresh, J.; Astor, B.C.; Greene, T.; Eknoyan, G.; Levey, A.S. Prevalence of chronic kidney disease and decreased kidney function in the adult US population: Third National Health and Nutrition Examination Survey. Am. J. Kidney Dis. 2003, 41, 1–12. [Google Scholar] [CrossRef]
  10. Li, M.; Singh, R.; Soares, M.S.; Marques, C.; Zhang, B.; Kumar, S. Convex fiber-tapered seven core fiber-convex fiber (CTC) structure-based biosensor for creatinine detection in aquaculture. Opt. Express 2022, 30, 13898–13914. [Google Scholar] [CrossRef]
  11. Zhu, J.; Pan, J.; Li, Y.; Yang, J.; Ye, B. Enzyme-nanozyme cascade colorimetric sensor platform: A sensitive method for detecting human serum creatinine. Anal. Bioanal. Chem. 2022, 414, 6271–6280. [Google Scholar] [CrossRef] [PubMed]
  12. Kerr, E.; West, C.; Hartwell, S.K. Quantitative TLC-Image Analysis of Urinary Creatinine Using Iodine Staining and RGB Values. J. Chromatogr. Sci. 2016, 54, 639–646. [Google Scholar] [CrossRef] [PubMed]
  13. Sharma, S.; Shrivastav, A.M.; Gupta, B.D. Lossy Mode Resonance Based Fiber Optic Creatinine Sensor Fabricated Using Molecular Imprinting Over Nanocomposite of MoS2/SnO2. IEEE Sens. J. 2020, 20, 4251–4259. [Google Scholar] [CrossRef]
  14. Kumar, V.; Hebbar, S.; Kalam, R.; Panwar, S.; Prasad, S.; Srikanta, S.S.; Krishnaswamy, P.R.; Bhat, N. Creatinine-Iron Complex and Its Use in Electrochemical Measurement of Urine Creatinine. IEEE Sens. J. 2018, 18, 830–836. [Google Scholar] [CrossRef]
  15. Stasyuk, N.Y.; Gayda, G.Z.; Zakalskiy, A.E.; Fayura, L.R.; Zakalska, O.M.; Nisnevitch, M.; Gonchar, M.V. Amperometric biosensors for L-arginine and creatinine assay based on recombinant deiminases and ammonium-sensitive Cu/Zn(Hg) S nanoparticles. Talanta 2022, 238, 122996. [Google Scholar] [CrossRef] [PubMed]
  16. Jayasekhar Babu, P.; Tirkey, A.; Rao, T.J.M.; Chanu, N.B.; Lalchhandama, K.; Singh, Y.D. Conventional and nanotechnology based sensors for creatinine (A kidney biomarker) detection: A consolidated review. Anal. Biochem. 2022, 645, 114622. [Google Scholar] [CrossRef]
  17. Li, M.-J.; Nolan, D.A. Optical Transmission Fiber Design Evolution. J. Light. Technol. 2008, 26, 1079–1092. [Google Scholar] [CrossRef]
  18. Qiang, Z.; Junyang, L.; Yanling, Y.; Libo, G.; Chenyang, X. Micro double tapered optical fiber sensors based on the evanescent field-effect and surface modification. Optik 2014, 125, 4614–4617. [Google Scholar] [CrossRef]
  19. Zi, X.; Chen, J.; Zhang, S.; Li, X.; Wang, S.; Wei, J.; Lu, H.; Sheng, K.; Niu, Y.; Gong, S. Ultrasensitive and stable pressure sensor based on tapered optical fibres. Opt. Commun. 2022, 518, 128337. [Google Scholar] [CrossRef]
  20. Li, Y.C.; Xin, H.B.; Zhang, Y.; Li, B.J. Optical Fiber Technologies for Nanomanipulation and Biodetection: A Review. J. Light. Technol. 2021, 39, 251–262. [Google Scholar] [CrossRef]
  21. Zhang, X.; Broere, W. Design of a distributed optical fiber sensor system for measuring immersed tunnel joint deformations. Tunn. Undergr. Space Technol. 2023, 131, 104770. [Google Scholar] [CrossRef]
  22. Ge, J.; Liu, J.; Gui, K.; Ye, L. Atmospheric icing measurement and online ice type recognition for aircraft utilizing optical fiber sensor and machine learning algorithms. Measurement 2022, 205, 112215. [Google Scholar] [CrossRef]
  23. Martan, T.; Mares, D.; Prajzler, V. Local detection of gaseous carbon dioxide using optical fibers and fiber tapers of single-cell dimensions. Sens. Actuators B 2023, 375, 132887. [Google Scholar] [CrossRef]
  24. Rachana, M.; Charles, I.; Swarnakar, S.; Krishna, S.V.; Kumar, S. Recent advances in photonic crystal fiber-based sensors for biomedical applications. Opt. Fiber Technol. 2022, 74, 103085. [Google Scholar] [CrossRef]
  25. Ullah, R.; Khan, R.Y.M.; Faisal, M. Efficient diaphragm-based Fiber Bragg grating vacuum sensor. Vacuum 2023, 207, 111566. [Google Scholar] [CrossRef]
  26. Du, C.; Wang, Q.; Zhao, S.; Deng, X. Biological sensors based on long period fiber grating. Opt. Laser Technol. 2023, 158, 108936. [Google Scholar] [CrossRef]
  27. Karimi-Alavijeh, H.; Taslimi, A.; Maghsoudian, M.H.; Poorghadiri, M.H.; Kazemzadeh, M. Fabrication of low-loss adiabatic optical microfibers using an attainable arc-discharge fiber tapering setup. Opt. Commun. 2022, 522, 128669. [Google Scholar] [CrossRef]
  28. Gong, Z.; Lei, Y.; Wang, Z.; Zhang, J.; Sun, Z.; Li, Y.; Huang, J.; Chan, C.; Ouyang, X. A Taper-in-Taper Structured Interferometric Optical Fiber Sensor for Cu2+ ion Detection. Sensors 2022, 22, 2709. [Google Scholar] [CrossRef]
  29. Korposh, S.; James, S.W.; Lee, S.W.; Tatam, R.P. Tapered Optical Fibre Sensors: Current Trends and Future Perspectives. Sensors 2019, 19, 2294. [Google Scholar] [CrossRef]
  30. Bojarczuk, J.; Araszkiewicz, P.; Markowski, K. Numerical analysis of the F-P TCFBG strain sensor spectral response and its multiplexation capabilities achieved with DSP and FFT analysis. Appl. Opt. 2022, 61, 1139–1149. [Google Scholar] [CrossRef]
  31. Markowski, K.; Araszkiewicz, P.; Bojarczuk, J.; Perlicki, K. High-sensitivity chirped tapered fiber-Bragg-grating-based Fabry-Perot cavity for strain measurements. Opt. Lett. 2020, 45, 2838–2841. [Google Scholar] [CrossRef] [PubMed]
  32. Wang, Z.; Singh, R.; Marques, C.; Jha, R.; Zhang, B.; Kumar, S. Taper-in-taper fiber structure-based LSPR sensor for alanine aminotransferase detection. Opt. Express 2021, 29, 43793. [Google Scholar] [CrossRef]
  33. Idris, A.O.; Akanji, S.P.; Orimolade, B.O.; Olorundare, F.O.G.; Azizi, S.; Mamba, B.; Maaza, M. Using Nanomaterials as Excellent Immobilisation Layer for Biosensor Design. Biosensors 2023, 13, 192. [Google Scholar] [CrossRef] [PubMed]
  34. Song, M.; Lin, X.; Peng, Z.; Xu, S.; Jin, L.; Zheng, X.; Luo, H. Materials and Methods of Biosensor Interfaces with Stability. Front. Mater. 2021, 7, 583739. [Google Scholar] [CrossRef]
  35. Hou, S.; Zhang, A.; Su, M. Nanomaterials for Biosensing Applications. Nanomaterials 2016, 6, 58. [Google Scholar] [CrossRef]
  36. Chou, H.-T.; Huang, W.-H.; Wu, T.-M.; Yu, Y.-K.; Hsu, H.-C. LSPR effects of Au nanoparticles/ZnO nano-composite films. Sens. Bio-Sens. Res. 2017, 14, 17–20. [Google Scholar] [CrossRef]
  37. Thangavel, K.; Balamurugan, A.; Venkatachalam, T.; Kumar, E.R. Structural, morphological and optical properties of ZnO nano-fibers. Superlattices Microstruct. 2016, 90, 45–52. [Google Scholar] [CrossRef]
  38. Sharma, A.K.; Gupta, J.; Sharma, I. Fiber optic evanescent wave absorption-based sensors: A detailed review of advancements in the last decade (2007–18). Optik 2019, 183, 1008–1025. [Google Scholar] [CrossRef]
  39. Tian, Y.; Wang, W.H.; Wu, N.; Zou, X.T.; Wang, X.W. Tapered Optical Fiber Sensor for Label-Free Detection of Biomolecules. Sensors 2011, 11, 3780–3790. [Google Scholar] [CrossRef]
  40. Yang, Q.; Zhu, G.; Singh, L.; Wang, Y.; Singh, R.; Zhang, B.; Zhang, X.; Kumar, S. Highly sensitive and selective sensor probe using glucose oxidase/gold nanoparticles/graphene oxide functionalized tapered optical fiber structure for detection of glucose. Optik 2020, 208, 164536. [Google Scholar] [CrossRef]
  41. Kyunghwan, O.; Choi, S.; Yongmin, J.; Lee, J.W. Novel hollow optical fibers and their applications in photonic devices for optical communications. J. Light. Technol. 2005, 23, 524–532. [Google Scholar] [CrossRef]
  42. Choochalerm, P.; Martin, W.E.; Jones, H.R.A.; Errmann, R.; Yerolatsitis, S.; Wright, T.A.; Buisset, C. Transmission properties of tapered optical fibres: Simulations and experimental measurements. Opt. Fiber Technol. 2021, 66, 102632. [Google Scholar] [CrossRef]
  43. Shabaneh, A.A.; Girei, S.H.; Arasu, P.T.; Rahman, W.B.W.A.; Bakar, A.A.A.; Sadek, A.Z.; Lim, H.N.; Huang, N.M.; Yaacob, M.H. Reflectance response of tapered optical fiber coated with graphene oxide nanostructured thin film for aqueous ethanol sensing. Opt. Commun. 2014, 331, 320–324. [Google Scholar] [CrossRef]
  44. Yadav, S.; Devi, R.; Kumar, A.; Pundir, C.S. Tr-enzyme functionalized ZnO-NPs/CHIT/c-MWCNT/PANI composite film for amperometric determination of creatinine. Biosens. Bioelectron. 2011, 28, 64–70. [Google Scholar] [CrossRef]
  45. Dudala, S.; Dubey, S.K.; Javed, A.; Ganguly, A.; Kapur, S.; Goel, S. Portable Chemiluminescence Detection Platform and Its Application in Creatinine Detection. IEEE Sens. J. 2022, 22, 7177–7184. [Google Scholar] [CrossRef]
  46. Boobphahom, S.; Ruecha, N.; Rodthongkum, N.; Chailapakul, O.; Remcho, V.T. A copper oxide-ionic liquid/reduced graphene oxide composite sensor enabled by digital dispensing: Non-enzymatic paper-based microfluidic determination of creatinine in human blood serum. Anal. Chim. Acta 2019, 1083, 110–118. [Google Scholar] [CrossRef]
Figure 1. Schematic of taper-in-taper optical fiber sensor structure.
Photonics 10 00567 g001
Figure 2. (a) TITF structure simulation model, (b) TITF structure basic mode.
Photonics 10 00567 g002
Figure 3. Simulation of taper-in-taper fiber structure.
Photonics 10 00567 g003
Figure 4. Schematic of (a) combiner manufacturing system, (b) conventional single mode fiber, (c) traditional taper optical fiber, and (d) taper-in-taper optical fiber structure.
Photonics 10 00567 g004
Figure 5. Experimental setup for spectrum measurement.
Photonics 10 00567 g005
Figure 6. Diameter scan of (a) traditional taper optical fiber, (b) taper-in-taper optical fiber structure.
Photonics 10 00567 g006
Figure 7. Repeatability analysis of (a) traditional taper optical fiber, (b) taper-in-taper optical fiber structure.
Photonics 10 00567 g007
Figure 8. Comparative study of transmission spectrum of traditional taper optical fiber, and taper-in-taper optical fiber structure.
Photonics 10 00567 g008
Figure 9. (a) Diameters scan of fabricated taper-in-taper fiber structure, (b) transmitted intensity spectrum of fabricated sensor probe.
Photonics 10 00567 g009
Figure 10. Flow chart of taper-in-taper optical fiber structure coated zinc oxide nanoparticles and creatiniase enzyme for creatinine measurement.
Photonics 10 00567 g010
Figure 11. (a) Detection of water contents from ethanol solution using proposed taper-in-taper optical fiber structure, (b) the change of transmitted intensity with ethanol concentration.
Photonics 10 00567 g011
Figure 12. (a,b) SEM pictures of TITF at different positions, (c) microscope picture of TITF structure, (d) microscope picture of taper sensing area of TITF structure.
Photonics 10 00567 g012
Figure 13. (a) SEM image of TITF sensor structure covered with ZnO-NPs and (b) ZnO-NPs over sensor structure.
Photonics 10 00567 g013
Figure 14. (a) Transmitted intensity of creatinine solutions at different concentrations and (b) linear plot of sensing result.
Photonics 10 00567 g014
Table 1. Comparison of the proposed sensor’s performance to that of existing sensors.
Materials
Used
Linear
Range
SensitivityRef.
Ag-NPs0–4.2 μM4.2 μM[6]
ZnO-NPs/CHIT/c-MWCNT/PANI10–650 μM0.03
μAμM−1cm−2
[44]
Cobalt (II) ions40–160 μMn.r. a[45]
CuO/IL/ERGO/SPCE0.01–2.0 mMn.r. a[46]
ZnO-NPs0–2000 μM0.11 a.u./μMThis work
a not reported.
Disclaimer/Publisher’s Note: The statements, opinions and data contained in all publications are solely those of the individual author(s) and contributor(s) and not of MDPI and/or the editor(s). MDPI and/or the editor(s) disclaim responsibility for any injury to people or property resulting from any ideas, methods, instructions or products referred to in the content.

