Review of Bioplastics Characterisation by Terahertz Techniques in the View of Ensuring a Circular Economy


Abstract
:1. Introduction
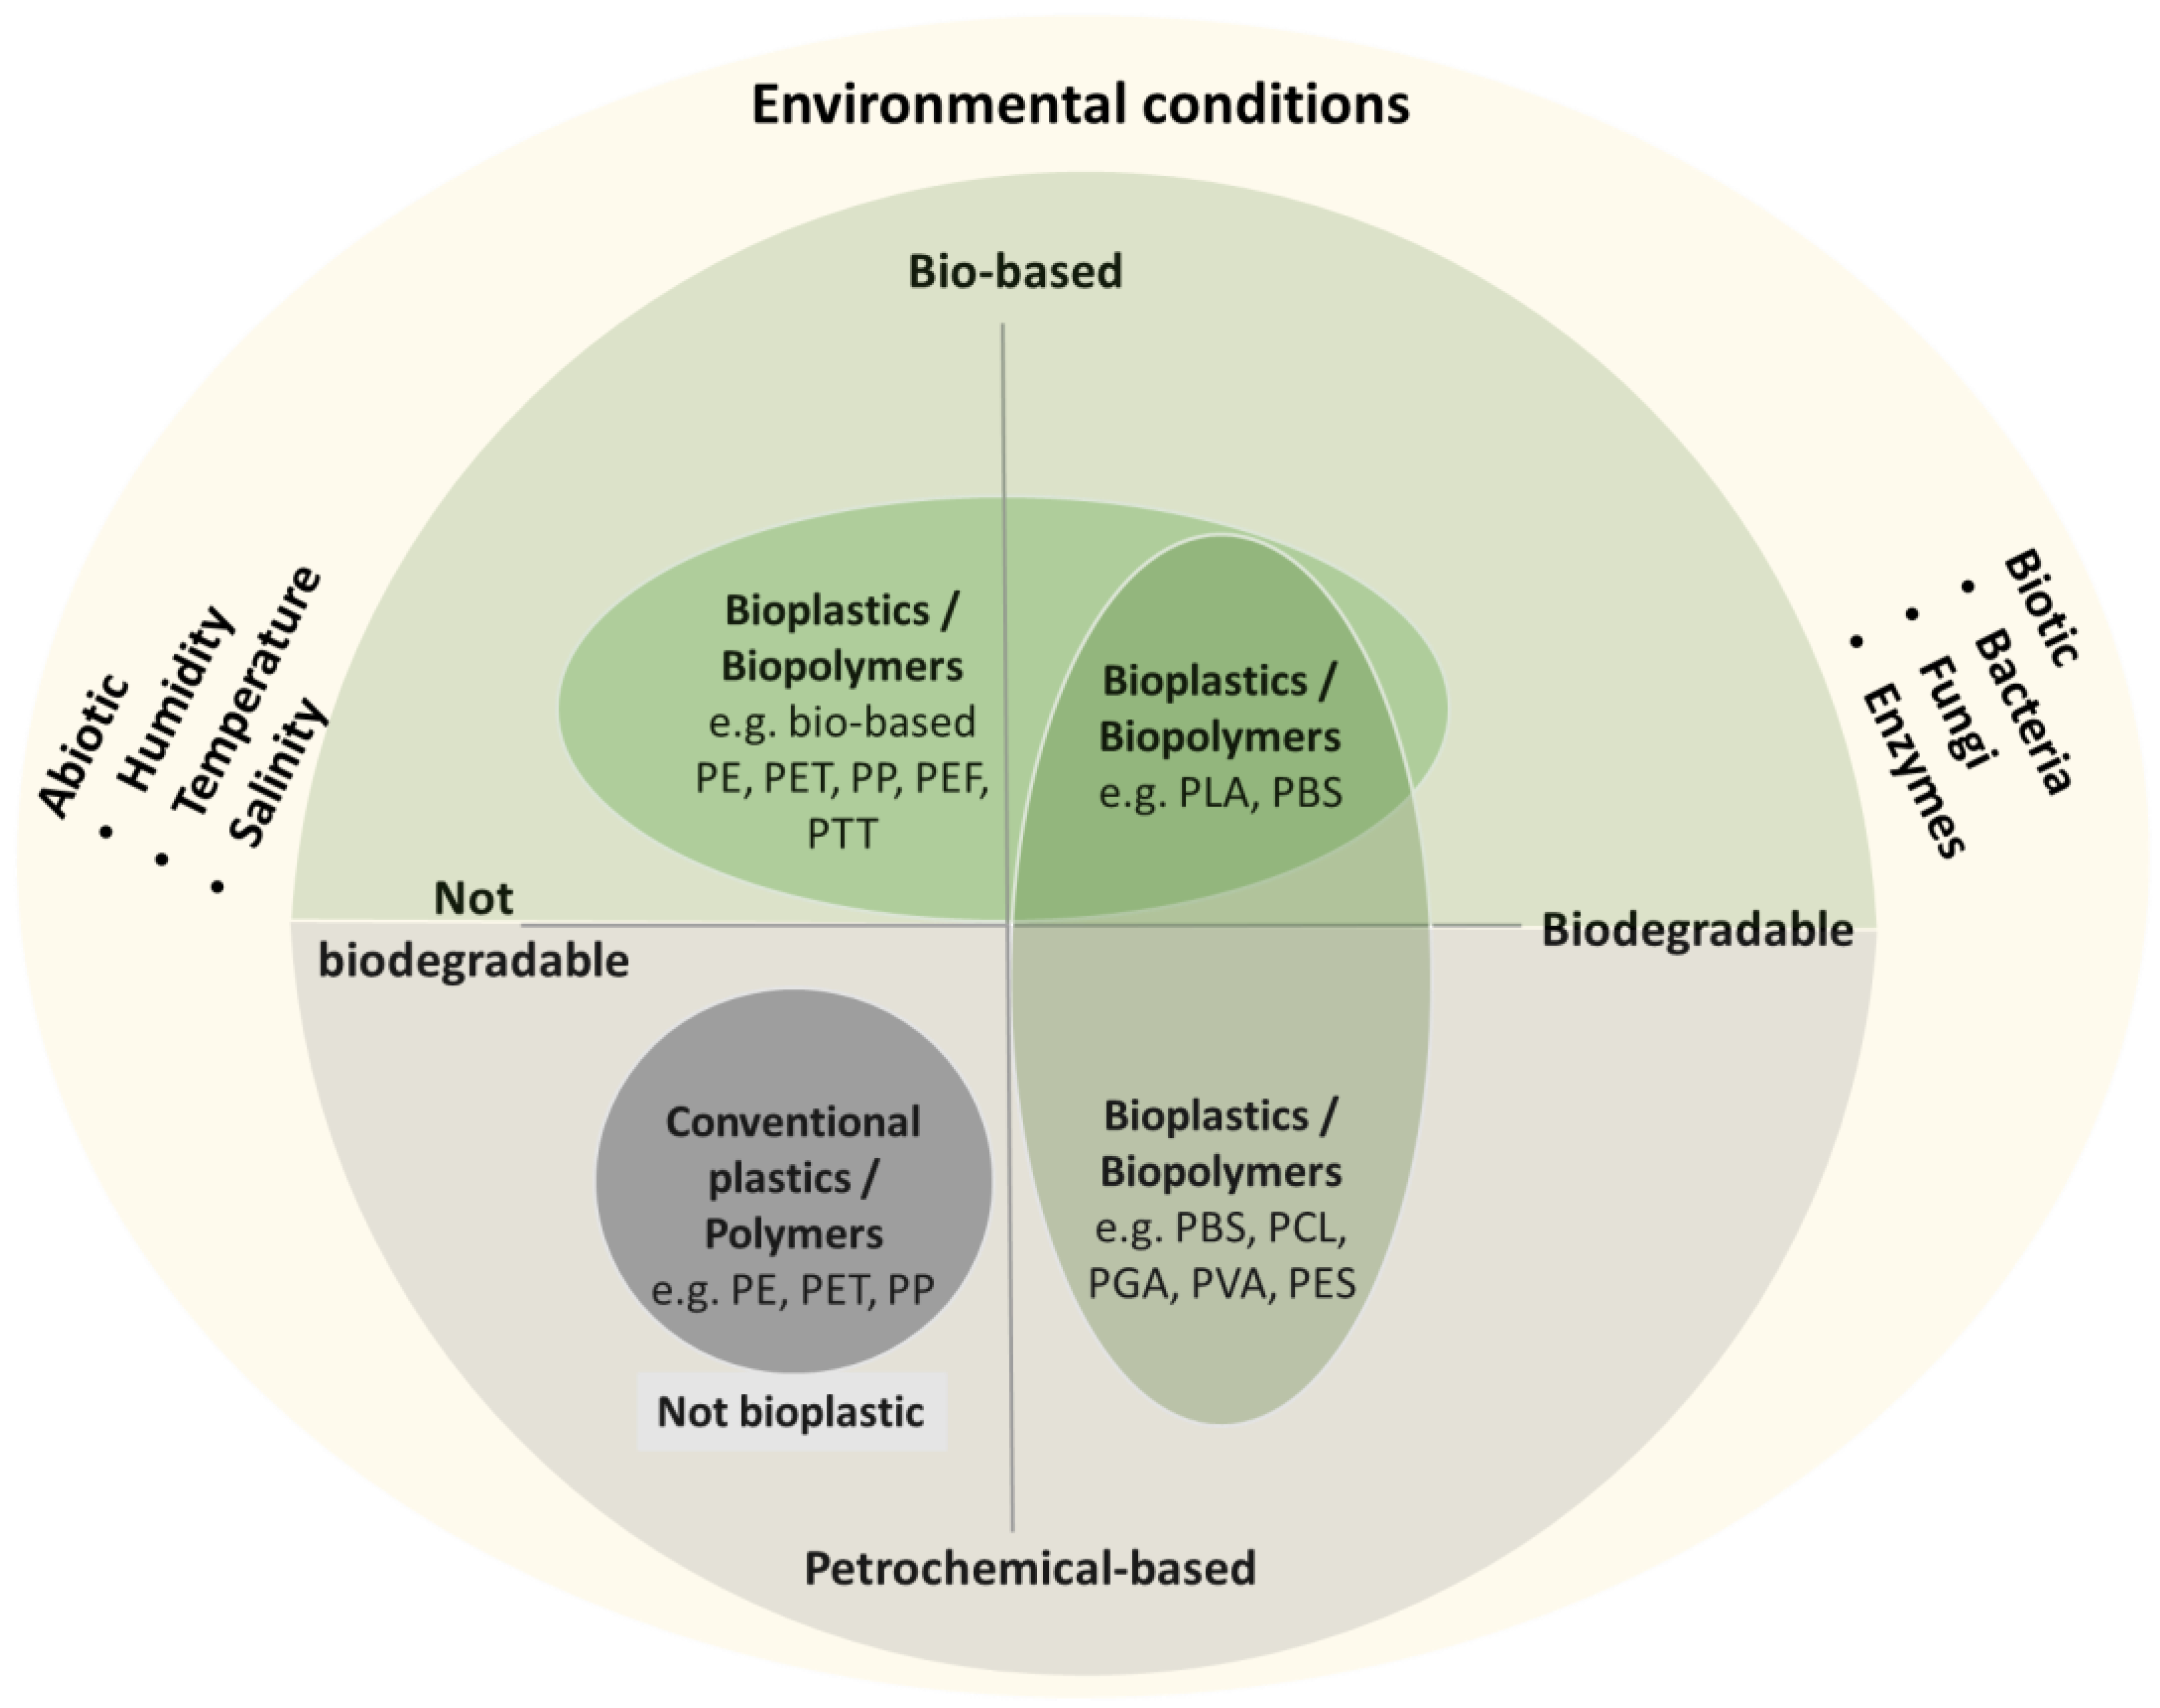
2. Biopolymers as a Solution to Environmental Plastic Pollution
3. THz Spectroscopic and Imaging Techniques for (Bio) Polymer and Plastics Characterisation
- Fourier transform infrared (FTIR) spectroscopy: This technique was the most applied for materials characterisation in the far infrared band before the introduction of THz-TDS. It is used quite simply to obtain a high-quality spectrum between the near-infrared to the visible frequency band. In comparison to THz-TDS, its use is limited, especially due to the cooling system, which is usually needed for spectroscopic measurement. After the measurement, an interferogram is obtained, where it is difficult to distinguish any physical features of the sample directly from the interferogram; a Fourier transformation is necessary for analysis. FTIR typically has a better signal-to-noise ratio than THz-TDS systems above 5 THz. Below 3 THz, their signal-to-noise ratio is lower by a few orders of magnitude. In comparison to THz-TDS, one major drawback is that the FTIR system measures only the intensity of the THz waves and does not capture the phase information. Therefore, Kramers-Kronig analysis is needed for extracting the complex-valued refractive index of the sample [86,87,88]. FTIR spectroscopy can provide information on the chemical composition of the molecular structure and functional groups in biopolymers and bioplastics. By analysing the absorption spectra of a sample, FTIR can determine the types of chemical bonds present, such as C-H, O-H, C=O, C-O and N-H [89]. This information can be used to identify the biopolymer or bioplastic and its purity and degree of crystallinity [90]. FTIR can also be used to monitor the composting and degradation of biopolymers and bioplastics over time, as changes in the spectra can indicate the formation of new functional groups or the loss of existing ones [91]. In addition, FTIR can provide information on the thermal properties and conformational changes of macromolecules, e.g., biopolymers in bioplastics, from which glass transition temperature and melting point can be determined [92,93].
- Terahertz Time-Domain Spectroscopy (THz-TDS): This technique involves the generation/detection of short THz pulses and the measurement of the electric field of the transmitted or reflected signal as a function of time after they pass through the sample. The same short optical pulse is used both to produce (pump) and detect (probe) the THz radiation. Thus, THz-TDS allows simultaneous measurement of the THz field amplitude and phase or, in other words, real and imaginary optical constants, i.e., absorption coefficient and the refractive index [94]. The basic principle of operation with electrooptic crystals is shown in Figure 2a. The transmitted or reflected signal is analysed to obtain information about the sample’s properties, such as refractive index, absorption coefficient, and dielectric constant. Using the THz-TDS, the time delay between the THz pulse sent through the material sample and the reflected pulse can be measured. In general, each THz-TDS measurement starts with a measurement of the reference spectrum. The reference can be an empty spectrometer sample compartment in a particular atmosphere (ambient air, nitrogen, dry air) or a sample before the treatment under study has been performed. This is followed by the measurement of the sample under study. The ratio of these two spectra gives the expression from which the refractive index and the absorption coefficient can be determined, as well as the thickness of the sample [95]. By Fourier transform of the recorded signal to the frequency domain, the technique can provide information about the molecular structure of the polymer, including the presence of functional groups, the degree of crystallinity, and the orientation of the biopolymer chains [96]. In addition, THz-TDS can be used to study the dynamics of polymers, such as their relaxation times and diffusion coefficients. This information can be used to understand the behaviour of polymers under different conditions, such as temperature and humidity, and to optimise their properties for specific applications. Biological polymers show low spectral features in the THz region corresponding to functionally relevant, global and subglobal collective modes with periods on the picosecond timescale. THz spectroscopy can also be used to analyse the dynamics of biopolymers in water [97]. Compared to FTIR spectroscopy, THz spectroscopy can provide information on the low-frequency vibrational modes of biopolymers, such as the collective vibrational modes of amino acids, proteins and carbohydrates, which are not accessible with FTIR spectroscopy [60].
- Terahertz Pulsed Imaging (TPI): This is an imaging technique that uses THz radiation to create images of objects. It is based on the principle that THz radiation can penetrate many materials, including polymers, and is sensitive to the differences in the refractive index and absorption properties of different materials. The transmitted or reflected pulse is then detected at a detector and analysed to obtain information about the sample’s structure and composition. The time delay between the transmitted and reflected signals is used to determine the position of the object, while the amplitude of the signal provides information about the object’s properties, including the presence of defects or inhomogeneities. This technique has been used to perform 2D and 3D imaging of materials. The amplitude image is recorded by sitting at the peak of the THz pulse and then doing the raster scan of the object. Thus, only the detection is possible without the identification and classification needed. Recording the pulse profile at each selected point on a sample can lead to enormous information on the image in the frequency domain, allowing also identification and classification of materials and compounds since various substances exhibit unique spectral responses in the THz frequency range, some with distinct spectral peaks. By analysing the frequency-dependent amplitudes and phases of the transmitted or reflected THz pulse, we can obtain information on the dielectric and optical properties of the bioplastic samples, which can be related to their molecular structure as well as intermolecular interactions [98]. Using multispectral THz imaging, where the entire frequency spectrum is recorded at each point on the sample, it is also possible to identify foreign bodies inside or below the surface of the material in addition to detecting them [41]. The principle of generation and detection of THz radiation using photoconductive antennas are described in [73] and organic electro-optic crystals in [99].
- THz Time-Domain Ellipsometry: Compared to THz transmission measurements, this method is applicable to highly absorbing substrates and thin layers on opaque substrates. In contrast to reflectometry measurements, ellipsometry does not require reference measurements and avoids phase detection problems due to layout errors. Ellipsometry is self-referential and allows simultaneous estimation of the complex refractive index and the layer thickness. THz TDS ellipsometry is used to characterise the anisotropic properties of materials, especially optical properties of thin films, multilayer systems and complex substrates in the THz frequency range [85,100,101,102]. An example of such a system setup is shown in Figure 2b.
- THz tomography: This is an imaging technique that uses THz radiation to create cross-sectional images of a target and allow the internal detail to be observed in three-dimensional (3D) images of objects. It is based on the principle that THz radiation can penetrate many materials, including polymers, and is sensitive to the differences in the refractive index and absorption properties of different materials. THz tomography involves various approaches, which were well described by Guillet et al., who emphasised the advantages, drawbacks and limitations of 3D imaging of the internal structure of an object by THz radiation [103]. Here the most interesting is THz computed tomography (CT) in Figure 2c since this technique is comparative to well-known X-ray CT, which has already been transferred from medical applications to various industrial applications. Usually, a THz beam is used to illuminate the object from multiple angles, and a detector measures the transmitted or reflected THz signal. The data obtained from these measurements are then used to reconstruct a 3D image of the object. The technique can provide information about the internal structure and composition of the polymer. THz CT can be used for spectral analysis of samples, providing identification or comparison of different substances and their localisation in a non-destructive way. The main limitation is the absorption in the material under investigation, which limits the thickness of the sample to be imaged, and the high absorption in an industrial environment due to dust particles and atmospheric moisture.
- compactness,
- low power consumption,
- powerful and tunable THz emitters,
- fast response,
- high sensitivity detectors,
- operating over a broad frequency range,
- system integration,
- incorporation of artificial intelligence in THz image processing.
4. Biopolymers Analysis by THz Spectroscopy
4.1. Polylactic Acid (PLA)
4.2. Polyhydroxyalkanoate (PHA) and Poly-3-Hydroxybutyrate (PHB)
4.3. Polyamide 11 or Nylon 11
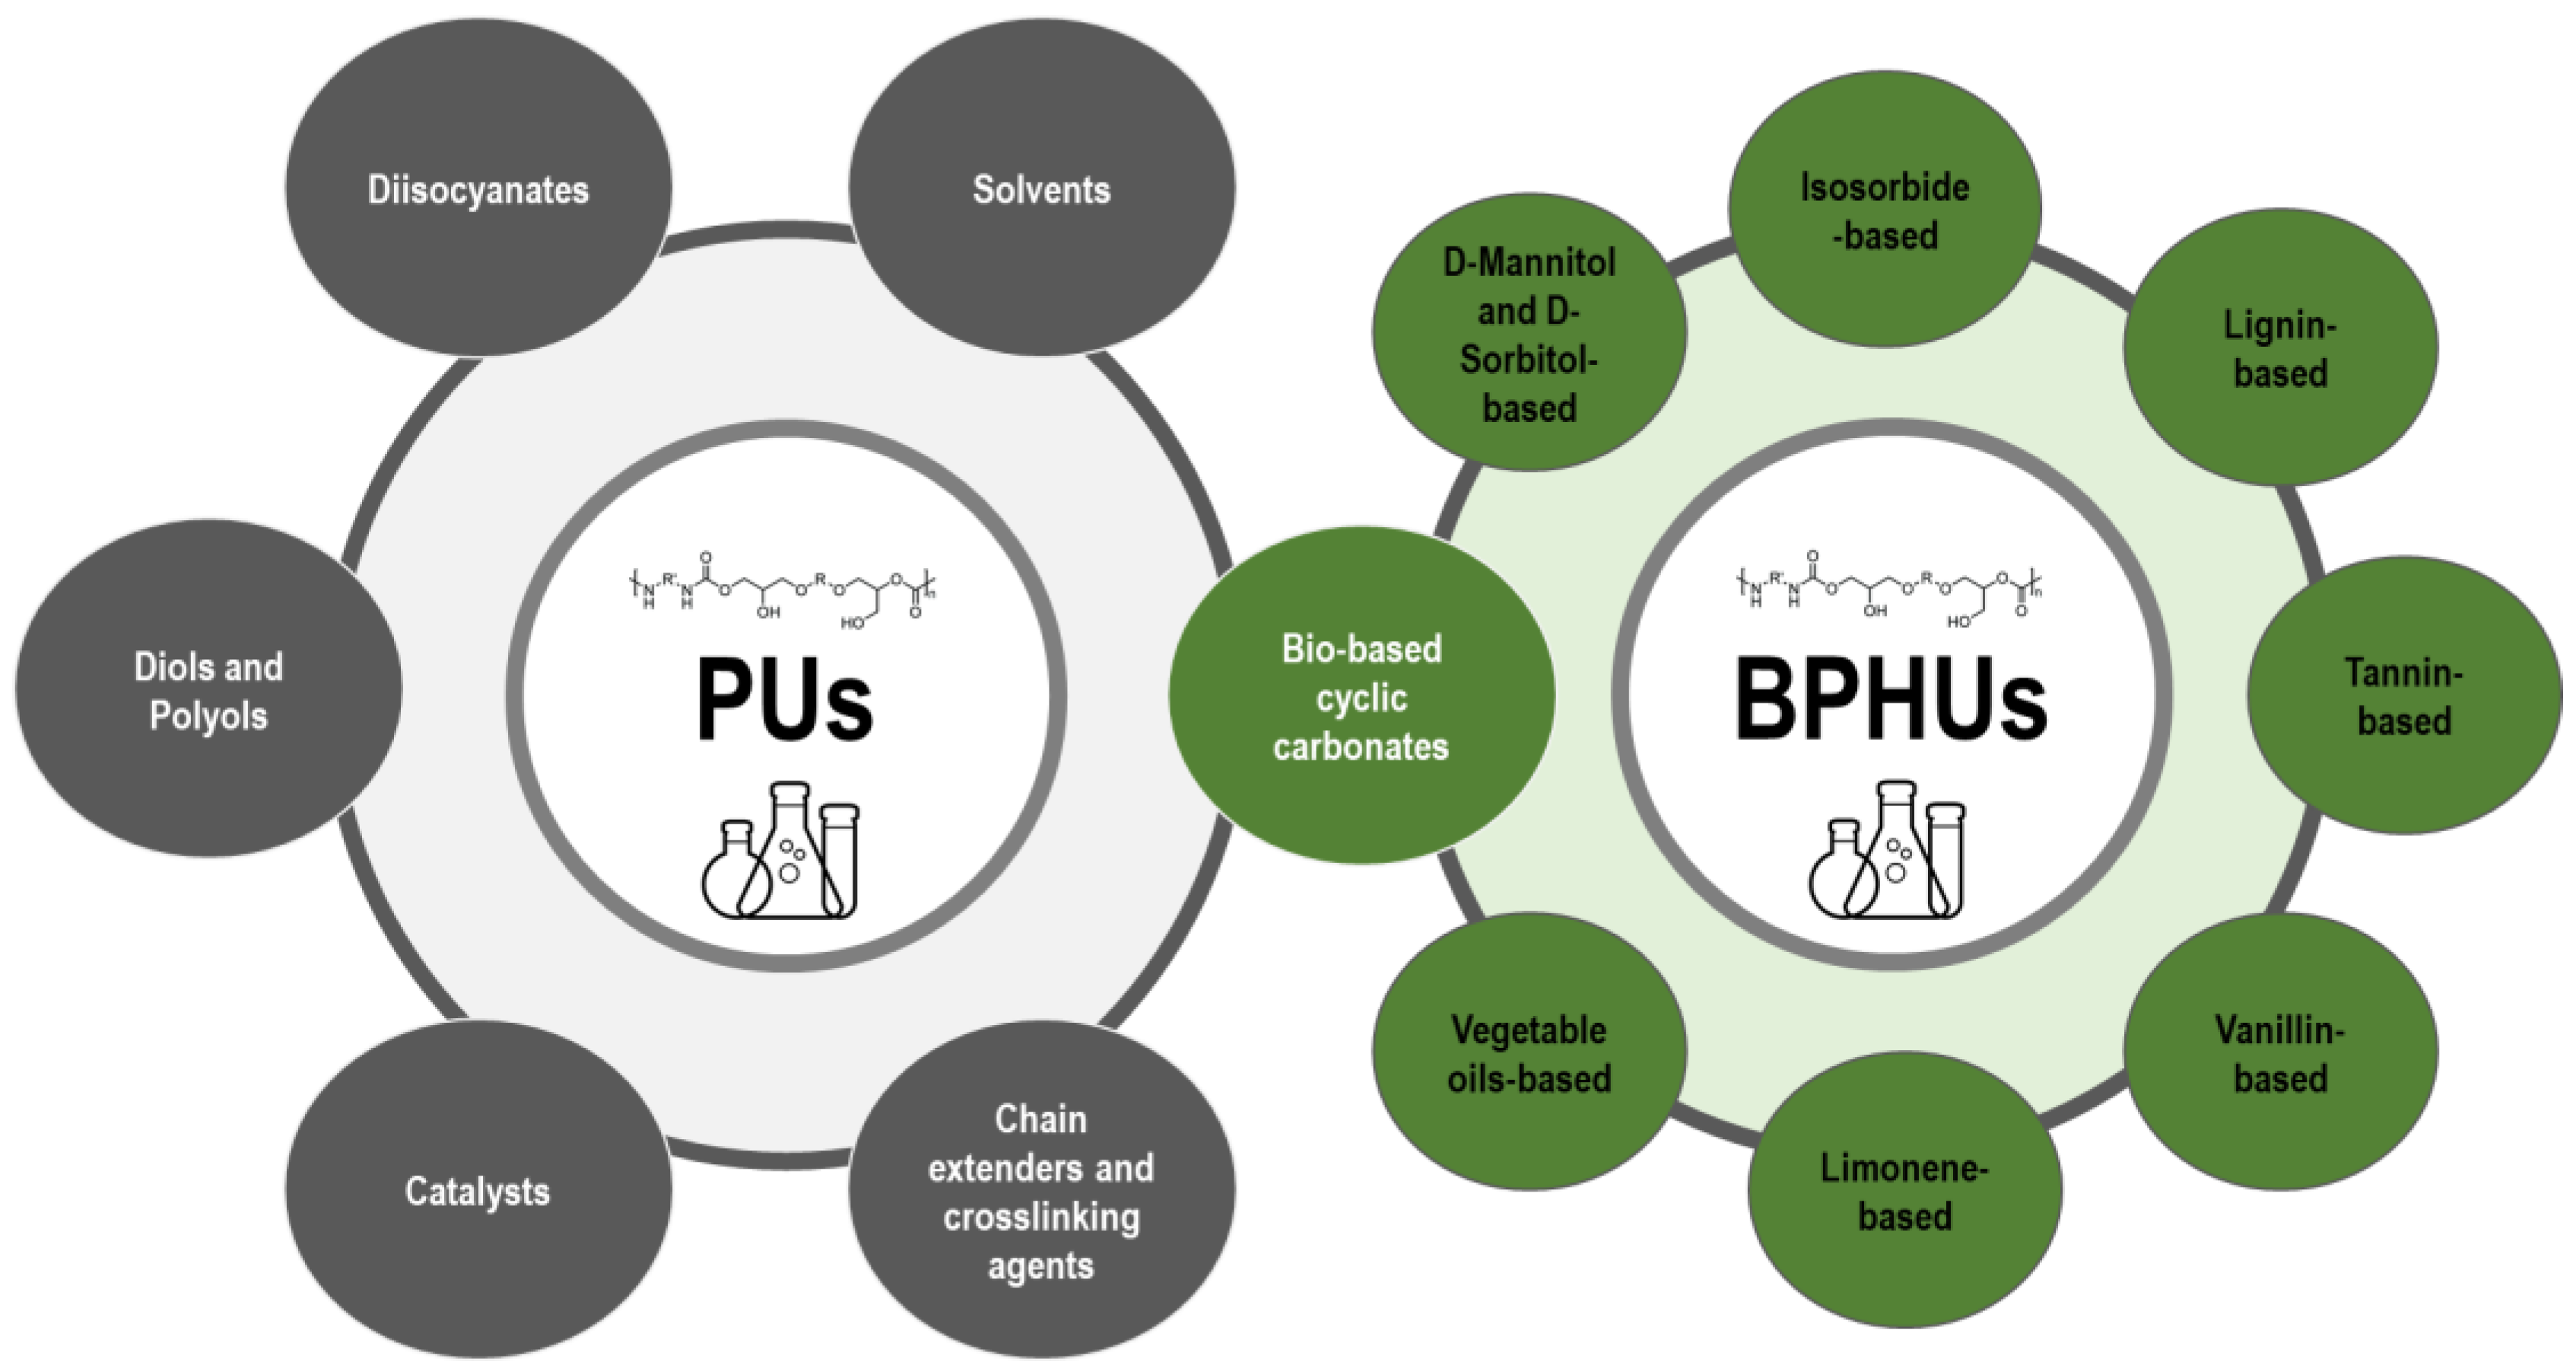
4.4. Bio-Based Polyhydroxyurethane (BPHU)

4.5. Cellulose-Based Biopolymers
4.6. Starch-Based Biopolymers
4.7. Protein-Based Biopolymers
4.8. Lipid-Based Biopolymers

| Biopolymer | Investigated Absorption Band | THz Technique | Study | Spectral Peak (THz) | Reference |
|---|---|---|---|---|---|
| PLA | 1.0–8.5 THz | FTIR | crystallinity | 1.8, 4.0, 4.7, and 7.1 THz for the 80 °C sample | [122] |
| 1–2.5 THz | THz-TDS, FTIR | crystallinity, conformational transition | 2.01 | [124] | |
| 1–15 THz | FTIR | chirality | 2.0, 4.1, 4.8, 7.2, 9.0, 10.4, 11.9, 12.3 | [125] | |
| 1–2.5 THz | THz-TDS | relative content, crystallisation behaviour | 2.01 (shifted to 1.82 due to different crystallisation procedure) | [123] | |
| 0.2–2 THz | THz-TDS | the absorption coefficient, refractive index | NA | [126] | |
| PHB | 0.3–3.5 THz | THz-TDS | higher order conformation | 2.49, 2.92 | [135] |
| 0.3–4.0 THz (THz-TDS) 1–20 THz (FTIR) | THz-TDS, FTIR | crystalline and amorphous compound | 1.5 (weak), 2.49, 2.92 | [134] | |
| 1.5–9 THz | THz-free electron laser (FEL) | polymer morphological change | 2.5, 2.9, 5.4, 6.6 (weak), 8.0 | [136] | |
| PPH | NA | THz-TDS | glass transition temperature | Temperature-dependent refractive index at 1 THz | [137] |
| Nylon-11 | 0.2–20 THz | FTIR | crystal conformations | 3, 6.5 (weak), 12, 13, 15, 16.5, 17.5 | [139] |
| BPHU | 15–120 THz | FTIR | H-bonded interactions | 53.9, 51.0 | [141] |
| Precursor for BPHU | 03–2 THz | THz-TDS | refractive indices and absorption coefficients of various lignins | NA | [144] |
| 0.3–3.6 THz | THz-ATR | D-mannitol and D-sorbitol | NA | [145] | |
| 0.2–1.5 THz | THz-TDS | absorption spectra and refractive indices of vegetable oils (sunflower seed oil, peanut oil, soybean oil, and rapeseed oil) | 1.1, 1.5 (hydrogen-bond bending) | [146] | |
| 0.05–2 THz | THz-TDS | chemical and physical changes of edible oils when heated above the smoke point | lots of uncertainty | [147] | |
| 0.4–2 THz | THz-TDS | biomolecular structure of isomer vanillin | 0.61, 1.10, 1.48, and 1.89 | [149] | |
| Cellulose | 01–4.0 THz | THz-TDS | crystallographic analysis | 2.11, 2.38, around 3.0 | [153] |
| 0.2–3.0 THz 19.5–120 THz (FTIR) | THz-TDS FTIR | crystallinity of wood cellulose, microcrystalline cellulose, cotton cellulose nanofiber and wood cellulose nanofiber | 2.25 (wood cellulose) 2.39, 2.63 (microcrystalline cellulose) | [96] | |
| 1–10 THz | THz-FTIR | nanofibre cellulose-polymer composites (CNF) | 7 THz (for CNF-PP composite, when CNF was added) 3.1, 5.1, 7.5, 9.6 for polypropylene (PP) | [154] | |
| Starch | 3–15 THz | FTIR | crystallinity of native, amorphous, and dried starch | Corn starch: main peaks (9.0, 10.5, 12.2, 13.2) and shoulder peaks (4.9, 7.9, 8.6) Potato starch: 5.1, 7.8, 8.5, 9.0, 10.5, 12.2, 13.1 | [155] |
| 0.25–4.5 THz | THz-TDS | starch ageing process | lots of uncertainty | [158] | |
| Soybeans | 0.1–1.5 THz | THz-TDS | soybean varieties discrimination by PLS analysis | optical parameters are very similar | [163] |
| Wheat | 0.2–2.5 THz | THz-TDS | wheat varietal discrimination by PLS analysis | optical parameters are very similar | [165] |
| Rhodopsin and bacteriorhodopsin | 0–1.5 THz | THz-TDS | conformational activation pathways of biomolecules | NA | [168] |
| Polyethylene oxide (PEO) | 0.1–4 THz | THz-TDS | cross-linking states | NA | [169] |
| Fatty acids and their analogues | 0.3–12 THz | FTIR | THz absorbance | Oleic, linoleic, linolenic acids: 2.3, 5.0, 7.4, 9.8, 11.3 Triolein: 2.3, 9.8 Diolein: 2.0, 9.8 Monoolein: 9.26, 9.8, 11.3 | [174] |
| Natural wax | 0.2–2.5 THz | THz-TDS | thermal analysis and optical properties of paraffin wax, beeswax, and liquid paraffin wax | Paraffin: 2.2 (intermolecular interaction between parallel molecules) Beeswax: 1.6 and 2.25 (C=C double bond stretching) | [175] |
| Microalgae Scenedesmus obliquus | 2–20 THz | THz-FTIR | lipid content and composition | 7.4 and 9.8 (oleic acid, linoleic acid, and linolenic acid) 9.3 (C=O and –COO– vibration for lipids) | [173] |
5. THz Spectroscopy and Imaging in Combination with Machine Learning and Other Artificial Intelligence Tools for Bioplastics Analysis and Production
5.1. Conventional Chemometric Methods in THz Spectra and Imaging Analysis
- Principal Component Analysis (PCA): This is a feature extraction method that allows the linear combination of several independent variables according to the principle of maximum variance and replaces the original variable with a small number of synthetic variables [184]. This method is used to reduce the dimensionality of the spectral data by identifying the most significant features or components. It helps to identify the key differences between samples and to classify them based on their THz response.
- Partial Least Squares Regression (PLS): This method is used to establish a correlation between the spectral data and a set of reference values, such as the concentration of a particular compound in a sample. It helps to quantify the amount of a specific compound in a sample based on its THz response. It is used for quantitative analysis. It uses the absorbance values within a given frequency range, extracts the spectrum features, and then establishes the correlation between the instrumental measurements and the values of the interest property [185]. A detailed description of PLS as a basic tool of chemometrics is presented in [186].
- Multi-Linear Regression (MLR): This method is efficient where there is no correlation between variables and is convenient to calibrate THz data [177]. It can be used in THz spectroscopy to establish a correlation between the spectral data and a set of reference values, such as the concentration of a particular compound in a sample. MLR involves fitting a linear equation to the spectral data and the reference values, where the coefficients of the equation represent the contribution of each spectral feature to the reference value. It is particularly useful when the spectral data contains a limited number of features and the relationship between the spectral data and the reference values is linear. For example, MLR can be used to determine the concentration of a particular chemical in a polymer sample based on its THz response.
5.2. Machine Learning and Deep Learning Techniques for THz Signal Processing, Spectral Data and Image Analysis
- Support Vector Machine (SVM): SVM algorithm is based on a statistical learning method and is a supervised learning algorithm that can be used for classification or regression analysis [194]. SVM is used in many areas where there is a need for fewer learning samples, shorter learning times and faster identification. In the THz data analysis, SVM can be used to classify different samples and to identify the main content’s proportion of mixtures based on their THz spectra [194,195].
- K-Nearest Neighbour (KNN): KNN is a simple and effective supervised learning algorithm that can be used for classification. The algorithm stores all possible instances of a class and works by classifying new instances based on distance functions (a similarity measure). A class is classified according to the most votes of its neighbours, with an instance being assigned the most popular class among its K nearest neighbours, as measured by a distance function [196]. In other words, it works by finding the k-nearest neighbours of a given sample in the training set and assigning the sample to the class that is most common among its neighbours. In THz data analysis, KNN can be used to classify different samples based on their THz spectra. The method is especially valuable in medicine and pharmacy. The proposed ML algorithm has been applied to detect and classify abnormalities in human breast tissue using a THz imaging system that classifies breast cancer as benign or malignant based on pattern recognition [197]. Together with the SVM algorithm, it was used for rapid recognition of pharmaceutical bi-heterocyclic compounds [198].
- Partial Least Square-Discriminant Analysis (PLS-DA): PLS-DA is a supervised learning algorithm that can be used as a multivariate classification technique based upon the classical partial least squares regression method. It works by finding the relationship between the measured spectral features and the target variables containing the class label, i.e., linear combination of variables that explains the maximum amount of variance between the classes [195]. In THz data analysis, PLS-DA can be used to classify different samples based on their THz spectra. This method was used to establish a multivariate model to estimate the authentication and identification of biological samples, e.g., identification of edible oils or the quality estimation of bio-products, e.g., honey [199,200].
5.3. AI-Based THz Analysis of Bioplastics
6. Conclusions
Author Contributions
Funding
Institutional Review Board Statement
Informed Consent Statement
Data Availability Statement
Conflicts of Interest
References
- Geyer, R.; Jambeck, J.R.; Law, K.L. Production, Use, and Fate of All Plastics Ever Made. Sci. Adv. 2017, 3, e1700782. [Google Scholar] [CrossRef] [PubMed] [Green Version]
- Law, K.L.; Narayan, R. Reducing Environmental Plastic Pollution by Designing Polymer Materials for Managed End-of-Life. Nat. Rev. Mater. 2022, 7, 104–116. [Google Scholar] [CrossRef]
- Fredricks, J.L.; Jimenez, A.M.; Grandgeorge, P.; Meidl, R.; Law, E.; Fan, J.; Roumeli, E. Hierarchical Biopolymer-Based Materials and Composites. J. Polym. Sci. 2023. [Google Scholar] [CrossRef]
- Yaradoddi, J.S.; Banapurmath, N.R.; Ganachari, S.V.; Soudagar, M.E.M.; Mubarak, N.M.; Hallad, S.; Hugar, S.; Fayaz, H. Biodegradable Carboxymethyl Cellulose Based Material for Sustainable Packaging Application. Sci. Rep. 2020, 10, 21960. [Google Scholar] [CrossRef]
- Han, J.; Shin, S.-H.; Park, K.-M.; Kim, K.M. Characterization of Physical, Mechanical, and Antioxidant Properties of Soy Protein-Based Bioplastic Films Containing Carboxymethylcellulose and Catechin. Food Sci. Biotechnol. 2015, 24, 939–945. [Google Scholar] [CrossRef]
- Censi, V.; Saiano, F.; Bongiorno, D.; Indelicato, S.; Napoli, A.; Piazzese, D. Bioplastics: A New Analytical Challenge. Front. Chem. 2022, 10, 971792. [Google Scholar] [CrossRef] [PubMed]
- Kim, H.; Shin, G.; Jang, M.; Nilsson, F.; Hakkarainen, M.; Kim, H.J.; Hwang, S.Y.; Lee, J.; Park, S.B.; Park, J.; et al. Toward Sustaining Bioplastics: Add a Pinch of Seasoning. ACS Sustain. Chem. Eng. 2023, 11, 1846–1856. [Google Scholar] [CrossRef]
- Wietzke, S.; Jansen, C.; Reuter, M.; Jung, T.; Kraft, D.; Chatterjee, S.; Fischer, B.M.; Koch, M. Terahertz Spectroscopy on Polymers: A Review of Morphological Studies. J. Mol. Struct. 2011, 1006, 41–51. [Google Scholar] [CrossRef]
- Fischer, B.M.; Wietzke, S.; Reuter, M.; Peters, O.; Gente, R.; Jansen, C.; Vieweg, N.; Koch, M. Investigating Material Characteristics and Morphology of Polymers Using Terahertz Technologies. IEEE Trans. Terahertz Sci. Technol. 2013, 3, 259–268. [Google Scholar] [CrossRef]
- Sommer, S.; Raidt, T.; Fischer, B.M.; Katzenberg, F.; Tiller, J.C.; Koch, M. THz-Spectroscopy on High Density Polyethylene with Different Crystallinity. J. Infrared Millim. Terahertz Waves 2016, 37, 189–197. [Google Scholar] [CrossRef]
- Mori, K.; Seki, T.; Hirai, N.; Ohki, Y. Terahertz Absorption Spectra of Several Polymer Nanocomposites Indicating Polymer-Filler Interactions. AIP Adv. 2019, 9, 105109. [Google Scholar] [CrossRef] [Green Version]
- Singh, K.; Bandyopadhyay, A.; Sengupta, A. Physics of Effective Media in Plastic Polymer-Composites Using THz Time-Domain Spectroscopy. J. Phys. Appl. Phys. 2021, 55, 095303. [Google Scholar] [CrossRef]
- Bawuah, P.; Zeitler, J.A. Advances in Terahertz Time-Domain Spectroscopy of Pharmaceutical Solids: A Review. TrAC Trends Anal. Chem. 2021, 139, 116272. [Google Scholar] [CrossRef]
- Shen, Y.-C. Terahertz Pulsed Spectroscopy and Imaging for Pharmaceutical Applications: A Review. Int. J. Pharm. 2011, 417, 48–60. [Google Scholar] [CrossRef]
- Zeitler, J.A. Pharmaceutical Terahertz Spectroscopy and Imaging. In Analytical Techniques in the Pharmaceutical Sciences; Müllertz, A., Perrie, Y., Rades, T., Eds.; Advances in Delivery Science and Technology; Springer: New York, NY, USA, 2016; pp. 171–222. ISBN 978-1-4939-4029-5. [Google Scholar]
- Mancini, T.; Mosetti, R.; Marcelli, A.; Petrarca, M.; Lupi, S.; D’Arco, A. Terahertz Spectroscopic Analysis in Protein Dynamics: Current Status. Radiation 2022, 2, 100–123. [Google Scholar] [CrossRef]
- Markelz, A.G.; Chen, J.Y.; Knab, J.R.; Maeder, M. Measuring Protein Flexibility with Terahertz Spectroscopy: Basic Research and Applications. In Proceedings of the Digest of the LEOS Summer Topical Meetings Biophotonics/Optical Interconnects and VLSI Photonics/WBM Microcavities, San Diego, CA, USA, 28–30 June 2004. [Google Scholar]
- Knab, J.R.; Chen, J.-Y.; He, Y.; Markelz, A.G. Terahertz Measurements of Protein Relaxational Dynamics. Proc. IEEE 2007, 95, 1605–1610. [Google Scholar] [CrossRef]
- Sun, L.; Zhao, L.; Peng, R.-Y. Research Progress in the Effects of Terahertz Waves on Biomacromolecules. Mil. Med. Res. 2021, 8, 28. [Google Scholar] [CrossRef]
- Fischer, B.M.; Walther, M.; Uhd Jepsen, P. Far-Infrared Vibrational Modes of DNA Components Studied by Terahertz Time-Domain Spectroscopy. Phys. Med. Biol. 2002, 47, 3807–3814. [Google Scholar] [CrossRef]
- Hoffmann, M.; Fischer, B.M.; Jepsen, P.U. Terahertz Spectroscopy of RNA and DNA and Spot Array Imaging. In Proceedings of the Optical Terahertz Science and Technology, Orlando, FL, USA, 14 March 2005; Paper WB2. Optica Publishing Group: Washington, DC, USA, 2005; p. WB2. [Google Scholar]
- Zhang, G.; Wang, Y.; Qian, J.; Wang, Y.; Li, X.; Lü, J. Terahertz Refractive Phenotype of Living Cells. Front. Bioeng. Biotechnol. 2023, 10, 1105249. [Google Scholar] [CrossRef] [PubMed]
- Cherkasova, O.P.; Serdyukov, D.S.; Ratushnyak, A.S.; Nemova, E.F.; Kozlov, E.N.; Shidlovskii, Y.V.; Zaytsev, K.I.; Tuchin, V.V. Effects of Terahertz Radiation on Living Cells: A Review. Opt. Spectrosc. 2020, 128, 855–866. [Google Scholar] [CrossRef]
- Berry, E.; Fitzgerald, A.J.; Zinov’ev, N.N.; Walker, G.C.; Homer-Vanniasinkam, S.; Sudworth, C.D.; Miles, R.E.; Chamberlain, J.M.; Smith, M.A. Optical Properties of Tissue Measured Using Terahertz-Pulsed Imaging. In Proceedings of the Medical Imaging 2003: Physics of Medical Imaging, San Diego, CA, USA, 5 June 2003; SPIE: Bellingham, WA, USA, 2003; Volume 5030, pp. 459–470. [Google Scholar]
- Vafapour, Z.; Keshavarz, A.; Ghahraloud, H. The Potential of Terahertz Sensing for Cancer Diagnosis. Heliyon 2020, 6, e05623. [Google Scholar] [CrossRef] [PubMed]
- Son, J.-H.; Oh, S.J.; Cheon, H. Potential Clinical Applications of Terahertz Radiation. J. Appl. Phys. 2019, 125, 190901. [Google Scholar] [CrossRef] [Green Version]
- Zaytsev, K.I.; Kudrin, K.G.; Koroleva, S.A.; Fokina, I.N.; Volodarskaya, S.I.; Novitskaya, E.V.; Perov, A.N.; Karasik, V.E.; Yurchenko, S.O. Medical Diagnostics Using Terahertz Pulsed Spectroscopy. J. Phys. Conf. Ser. 2014, 486, 012014. [Google Scholar] [CrossRef]
- Peng, Y.; Shi, C.; Wu, X.; Zhu, Y.; Zhuang, S. Terahertz Imaging and Spectroscopy in Cancer Diagnostics: A Technical Review. BME Front. 2020, 2020, 2547609. [Google Scholar] [CrossRef]
- Afsah-Hejri, L.; Akbari, E.; Toudeshki, A.; Homayouni, T.; Alizadeh, A.; Ehsani, R. Terahertz Spectroscopy and Imaging: A Review on Agricultural Applications. Comput. Electron. Agric. 2020, 177, 105628. [Google Scholar] [CrossRef]
- Qin, J.; Ying, Y.; Xie, L. The Detection of Agricultural Products and Food Using Terahertz Spectroscopy: A Review. Appl. Spectrosc. Rev. 2013, 48, 439–457. [Google Scholar] [CrossRef]
- Ge, H.; Lv, M.; Lu, X.; Jiang, Y.; Wu, G.; Li, G.; Li, L.; Li, Z.; Zhang, Y. Applications of THz Spectral Imaging in the Detection of Agricultural Products. Photonics 2021, 8, 518. [Google Scholar] [CrossRef]
- Abina, A.; Puc, U.; Jeglič, A.; Zidanšek, A. Applications of Terahertz Spectroscopy in the Field of Construction and Building Materials. Appl. Spectrosc. Rev. 2015, 50, 279–303. [Google Scholar] [CrossRef]
- Abina, A.; Puc, U.; Zidanšek, A. Challenges and Opportunities of Terahertz Technology in Construction and Demolition Waste Management. J. Environ. Manag. 2022, 315, 115118. [Google Scholar] [CrossRef]
- Ok, G.; Park, K.; Kim, H.J.; Chun, H.S.; Choi, S.-W. High-Speed Terahertz Imaging toward Food Quality Inspection. Appl. Opt. 2014, 53, 1406–1412. [Google Scholar] [CrossRef]
- Lee, Y.-K.; Choi, S.-W.; Han, S.-T.; Woo, D.H.; Chun, H.S. Detection of Foreign Bodies in Foods Using Continuous Wave Terahertz Imaging. J. Food Prot. 2012, 75, 179–183. [Google Scholar] [CrossRef] [PubMed]
- Karaliūnas, M.; Nasser, K.E.; Urbanowicz, A.; Kašalynas, I.; Bražinskienė, D.; Asadauskas, S.; Valušis, G. Non-Destructive Inspection of Food and Technical Oils by Terahertz Spectroscopy. Sci. Rep. 2018, 8, 18025. [Google Scholar] [CrossRef] [Green Version]
- Ren, A.; Zahid, A.; Fan, D.; Yang, X.; Imran, M.A.; Alomainy, A.; Abbasi, Q.H. State-of-the-Art in Terahertz Sensing for Food and Water Security—A Comprehensive Review. Trends Food Sci. Technol. 2019, 85, 241–251. [Google Scholar] [CrossRef] [Green Version]
- Markelz, A.G.; Mittleman, D.M. Perspective on Terahertz Applications in Bioscience and Biotechnology. ACS Photonics 2022, 9, 1117–1126. [Google Scholar] [CrossRef]
- Chen, X.; Lindley-Hatcher, H.; Stantchev, R.I.; Wang, J.; Li, K.; Hernandez Serrano, A.; Taylor, Z.D.; Castro-Camus, E.; Pickwell-MacPherson, E. Terahertz (THz) Biophotonics Technology: Instrumentation, Techniques, and Biomedical Applications. Chem. Phys. Rev. 2022, 3, 011311. [Google Scholar] [CrossRef]
- Cao, B.; Li, H.; Cai, E.; Fan, M. Determination of Pesticides in Flour by Terahertz Time-Domain Spectroscopy (THz-TDS) with Voigt Function Fitting and Partial Least Squares (PLS) Analysis. Anal. Lett. 2021, 54, 830–841. [Google Scholar] [CrossRef]
- Zang, Z.; Wang, J.; Cui, H.-L.; Yan, S. Terahertz Spectral Imaging Based Quantitative Determination of Spatial Distribution of Plant Leaf Constituents. Plant Methods 2019, 15, 106. [Google Scholar] [CrossRef] [Green Version]
- Li, B.; Zhang, D.; Shen, Y. Study on Terahertz Spectrum Analysis and Recognition Modeling of Common Agricultural Diseases. Spectrochim. Acta Part A Mol. Biomol. Spectrosc. 2020, 243, 118820. [Google Scholar] [CrossRef]
- Abina, A.; Puc, U.; Jeglič, A.; Zidanšek, A. Structural Analysis of Insulating Polymer Foams with Terahertz Spectroscopy and Imaging. Polym. Test. 2013, 32, 739–747. [Google Scholar] [CrossRef]
- Mumtaz, M.; Mahmood, A.; Khan, S.D.; Zia, M.A.; Ahmed, M.; Ahmad, I. Investigation of Dielectric Properties of Polymers and Their Discrimination Using Terahertz Time-Domain Spectroscopy with Principal Component Analysis. Appl. Spectrosc. 2017, 71, 456–462. [Google Scholar] [CrossRef]
- Blauth, I. E-Journal of Nondestructive Testing (NDT). 2019. Available online: https://www.ndt.net/search/docs.php3?id=24404 (accessed on 26 July 2023).
- Yu, J.; Liu, X.; Manago, G.; Tanabe, T.; Osanai, S.; Okubo, K. New Terahertz Wave Sorting Technology to Improve Plastic Containers and Packaging Waste Recycling in Japan. Recycling 2022, 7, 66. [Google Scholar] [CrossRef]
- Ajito, K. Terahertz Spectroscopy for Pharmaceutical and Biomedical Applications. IEEE Trans. Terahertz Sci. Technol. 2015, 5, 1140–1145. [Google Scholar]
- Sun, Q.; He, Y.; Liu, K.; Fan, S.; Parrott, E.P.J.; Pickwell-MacPherson, E. Recent Advances in Terahertz Technology for Biomedical Applications. Quant. Imaging Med. Surg. 2017, 7, 345–355. [Google Scholar] [CrossRef] [Green Version]
- D’Arco, A.; Di Fabrizio, M.; Dolci, V.; Petrarca, M.; Lupi, S. THz Pulsed Imaging in Biomedical Applications. Condens. Matter 2020, 5, 25. [Google Scholar] [CrossRef] [Green Version]
- Humphreys, K.; Loughran, J.P.; Gradziel, M.; Lanigan, W.; Ward, T.; Murphy, J.A.; O’Sullivan, C. Medical Applications of Terahertz Imaging: A Review of Current Technology and Potential Applications in Biomedical Engineering. In Proceedings of the 26th Annual International Conference of the IEEE Engineering in Medicine and Biology Society, San Francisco, CA, USA, 1–5 September 2004; Volume 1, pp. 1302–1305. [Google Scholar]
- Peng, Y.; Shi, C.; Zhu, Y.; Gu, M.; Zhuang, S. Terahertz Spectroscopy in Biomedical Field: A Review on Signal-to-Noise Ratio Improvement. PhotoniX 2020, 1, 12. [Google Scholar] [CrossRef] [Green Version]
- Nanda, S.; Patra, B.R.; Patel, R.; Bakos, J.; Dalai, A.K. Innovations in Applications and Prospects of Bioplastics and Biopolymers: A Review. Environ. Chem. Lett. 2022, 20, 379–395. [Google Scholar] [CrossRef] [PubMed]
- Oberti, I.; Paciello, A. Bioplastic as a Substitute for Plastic in Construction Industry. Encyclopedia 2022, 2, 1408–1420. [Google Scholar] [CrossRef]
- Zoungranan, Y.; Lynda, E.; Dobi-Brice, K.K.; Tchirioua, E.; Bakary, C.; Yannick, D.D. Influence of Natural Factors on the Biodegradation of Simple and Composite Bioplastics Based on Cassava Starch and Corn Starch. J. Environ. Chem. Eng. 2020, 8, 104396. [Google Scholar] [CrossRef]
- Karamanlioglu, M.; Preziosi, R.; Robson, G.D. Abiotic and Biotic Environmental Degradation of the Bioplastic Polymer Poly(Lactic Acid): A Review. Polym. Degrad. Stab. 2017, 137, 122–130. [Google Scholar] [CrossRef] [Green Version]
- Yaradoddi, J.S.; Hugar, S.; Banapurmath, N.R.; Hunashyal, A.M.; Sulochana, M.B.; Shettar, A.S.; Ganachari, S.V. Alternative and Renewable Bio-Based and Biodegradable Plastics. In Handbook of Ecomaterials; Martínez, L.M.T., Kharissova, O.V., Kharisov, B.I., Eds.; Springer International Publishing: Cham, Switzerland, 2019; pp. 2935–2954. ISBN 978-3-319-68255-6. [Google Scholar]
- Chan, J.X.; Wong, J.F.; Hassan, A.; Zakaria, Z. 8—Bioplastics from Agricultural Waste. In Biopolymers and Biocomposites from Agro-Waste for Packaging Applications; Saba, N., Jawaid, M., Thariq, M., Eds.; Woodhead Publishing Series in Composites Science and Engineering; Woodhead Publishing: Cambridge, UK, 2021; pp. 141–169. ISBN 978-0-12-819953-4. [Google Scholar]
- Zumstein, M.T.; Narayan, R.; Kohler, H.-P.E.; McNeill, K.; Sander, M. Dos and Do Nots When Assessing the Biodegradation of Plastics. Environ. Sci. Technol. 2019, 53, 9967–9969. [Google Scholar] [CrossRef] [Green Version]
- Ozaki, Y.; Sato, H. Polymer Spectroscopy—Spectroscopy from the Far-Ultraviolet to Far-Infrared/Terahertz and R Aman Spectroscopy. In Spectroscopic Techniques for Polymer Characterization; John Wiley & Sons, Ltd.: Hoboken, NJ, USA, 2021; pp. 1–44. ISBN 978-3-527-83031-2. [Google Scholar]
- Morais, C.L.M.; Lima, K.M.G.; Singh, M.; Martin, F.L. Tutorial: Multivariate Classification for Vibrational Spectroscopy in Biological Samples. Nat. Protoc. 2020, 15, 2143–2162. [Google Scholar] [CrossRef] [PubMed]
- Walther, M.; Plochocka, P.; Fischer, B.; Helm, H.; Uhd Jepsen, P. Collective Vibrational Modes in Biological Molecules Investigated by Terahertz Time-Domain Spectroscopy. Biopolymers 2002, 67, 310–313. [Google Scholar] [CrossRef] [PubMed]
- Nakanishi, A.; Satozono, H. Terahertz Optical Properties of Wood–Plastic Composites. Appl. Opt. 2020, 59, 904–909. [Google Scholar] [CrossRef] [PubMed]
- Yakovlev, E.V.; Zaytsev, K.I.; Chernomyrdin, N.V.; Gavdush, A.A.; Zotov, A.K.; Nikonovich, M.Y.; Yurchenko, S.O. Non-Destructive Testing of Composite Materials Using Terahertz Time-Domain Spectroscopy. In Proceedings of the SPIE Photonics Europe, Brussels, Belgium, 29 April 2016; Berghmans, F., Mignani, A.G., Eds.; SPIE: Brussels, Belgium, 2016; p. 98990W. Available online: https://www.spiedigitallibrary.org/conference-proceedings-of-spie/9899/98990W/Non-destructive-testing-of-composite-materials-using-terahertz-time-domain/10.1117/12.2227321.short?SSO=1 (accessed on 26 July 2023).
- Hargreaves, S.; Lewis, R.A. Terahertz Imaging: Materials and Methods. J. Mater. Sci. Mater. Electron. 2007, 18, 299–303. [Google Scholar] [CrossRef]
- Smith, P.R.; Auston, D.H.; Nuss, M.C. Subpicosecond Photoconducting Dipole Antennas. IEEE J. Quantum Electron. 1988, 24, 255–260. [Google Scholar] [CrossRef]
- Fattinger, C.; Grischkowsky, D.R. A Cherenkov Source for Freely-Propagating Terahertz Beams. IEEE J. Quantum Electron. 1989, 25, 2608–2610. [Google Scholar] [CrossRef]
- Grischkowsky, D.; Keiding, S.; van Exter, M.; Fattinger, C. Far-Infrared Time-Domain Spectroscopy with Terahertz Beams of Dielectrics and Semiconductors. JOSA B 1990, 7, 2006–2015. [Google Scholar] [CrossRef]
- Puc, U.; Bach, T.; Günter, P.; Zgonik, M.; Jazbinsek, M. Ultra-Broadband and High-Dynamic-Range THz Time-Domain Spectroscopy System Based on Organic Crystal Emitter and Detector in Transmission and Reflection Geometry. Adv. Photonics Res. 2021, 2, 2000098. [Google Scholar] [CrossRef]
- Hu, B.B.; Nuss, M.C. Imaging with Terahertz Waves. Opt. Lett. 1995, 20, 1716–1718. [Google Scholar] [CrossRef] [Green Version]
- Jazbinsek, M.; Puc, U.; Abina, A.; Zidansek, A. Organic Crystals for THz Photonics. Appl. Sci. 2019, 9, 882. [Google Scholar] [CrossRef] [Green Version]
- Puc, U.; Bach, T.; Michel, V.; Zgonik, M.; Medrano, C.; Jazbinsek, M. DSTMS-Based Ultrabroadband Terahertz Time-Domain Spectroscopy. In Proceedings of the 2019 Conference on Lasers and Electro-Optics Europe & European Quantum Electronics Conference (CLEO/Europe-EQEC), Munich, Germany, 23–27 June 2019. [Google Scholar]
- Vicario, C.; Jazbinsek, M.; Ovchinnikov, A.V.; Chefonov, O.V.; Ashitkov, S.I.; Agranat, M.B.; Hauri, C.P. High Efficiency THz Generation in DSTMS, DAST and OH1 Pumped by Cr:Forsterite Laser. Opt. Express 2015, 23, 4573–4580. [Google Scholar] [CrossRef] [Green Version]
- Shen, Y.C.; Upadhya, P.C.; Beere, H.E.; Linfield, E.H.; Davies, A.G.; Gregory, I.S.; Baker, C.; Tribe, W.R.; Evans, M.J. Generation and Detection of Ultrabroadband Terahertz Radiation Using Photoconductive Emitters and Receivers. Appl. Phys. Lett. 2004, 85, 164–166. [Google Scholar] [CrossRef]
- Bacon, D.R.; Madéo, J.; Dani, K.M. Photoconductive Emitters for Pulsed Terahertz Generation. J. Opt. 2021, 23, 064001. [Google Scholar] [CrossRef]
- Burford, N.M.; El-Shenawee, M.O. Review of Terahertz Photoconductive Antenna Technology. Opt. Eng. 2017, 56, 010901. [Google Scholar] [CrossRef]
- Matsuura, S.; Tani, M.; Sakai, K. Generation of Coherent Terahertz Radiation by Photomixing in Dipole Photoconductive Antennas. Appl. Phys. Lett. 1997, 70, 559–561. [Google Scholar] [CrossRef]
- Chang, Q.; Yang, D. Broadband THz Generation from Photoconductive Antenna. PIERS Online 2005, 1, 331–335. [Google Scholar] [CrossRef]
- Valušis, G.; Lisauskas, A.; Yuan, H.; Knap, W.; Roskos, H.G. Roadmap of Terahertz Imaging 2021. Sensors 2021, 21, 4092. [Google Scholar] [CrossRef]
- Jansen, C.; Wietzke, S.; Peters, O.; Scheller, M.; Vieweg, N.; Salhi, M.; Krumbholz, N.; Jördens, C.; Hochrein, T.; Koch, M. Terahertz Imaging: Applications and Perspectives. Appl. Opt. 2010, 49, E48–E57. [Google Scholar] [CrossRef] [PubMed] [Green Version]
- Chan, W.L.; Deibel, J.; Mittleman, D.M. Imaging with Terahertz Radiation. Rep. Prog. Phys. 2007, 70, 1325. [Google Scholar] [CrossRef]
- Mittleman, D.M. Twenty Years of Terahertz Imaging [Invited]. Opt. Express 2018, 26, 9417–9431. [Google Scholar] [CrossRef]
- Huang, Y.; Shen, Y.; Wang, J. From Terahertz Imaging to Terahertz Wireless Communications. Engineering 2023, 22, 106–124. [Google Scholar] [CrossRef]
- Ospald, F.; Zouaghi, W.; Beigang, R.; Matheis, C.; Jonuscheit, J.; Recur, B.; Guillet, J.-P.; Mounaix, P.; Vleugels, W.; Bosom, P.V.; et al. Aeronautics Composite Material Inspection with a Terahertz Time-Domain Spectroscopy System. Opt. Eng. 2013, 53, 031208. [Google Scholar] [CrossRef]
- Balzer, J.C.; Saraceno, C.J.; Koch, M.; Kaurav, P.; Pfeiffer, U.R.; Withayachumnankul, W.; Kürner, T.; Stöhr, A.; El-Absi, M.; Abbas, A.A.-H.; et al. THz Systems Exploiting Photonics and Communications Technologies. IEEE J. Microw. 2023, 3, 268–288. [Google Scholar] [CrossRef]
- Leitenstorfer, A.; Moskalenko, A.S.; Kampfrath, T.; Kono, J.; Castro-Camus, E.; Peng, K.; Qureshi, N.; Turchinovich, D.; Tanaka, K.; Markelz, A.G.; et al. The 2023 Terahertz Science and Technology Roadmap. J. Phys. Appl. Phys. 2023, 56, 223001. [Google Scholar] [CrossRef]
- Lampin, J.F.; Mouret, G.; Dhillon, S.; Mangeney, J. THz Spectroscopy for Fundamental Science and Applications. Photoniques 2020, 101, 33–38. [Google Scholar] [CrossRef]
- Miyamoto, K.; Yamasaki, T.; Tsuji, S.; Inoue, K.; Park, G.; Uchida, H.; Matsuura, A.; Krüger, P.; Omatsu, T. Ultrawideband and High-Resolution Terahertz Spectroscopy: Structural Identification of Glucose. Photonics 2022, 9, 602. [Google Scholar] [CrossRef]
- Lepodise, L. THz Spectroscopic Studies of Materials Using the FTIR Technique: Experiment and Simulation. In University Wollongong Thesis Collection 1954–2016; University of Wollongong: Wollongong, Australia, 2014. [Google Scholar]
- Markowicz, F.; Szymańska-Pulikowska, A. Assessment of the Decomposition of Oxo- and Biodegradable Packaging Using FTIR Spectroscopy. Materials 2021, 14, 6449. [Google Scholar] [CrossRef] [PubMed]
- Pagacz, J.; Raftopoulos, K.N.; Leszczyńska, A.; Pielichowski, K. Bio-Polyamides Based on Renewable Raw Materials. J. Therm. Anal. Calorim. 2016, 123, 1225–1237. [Google Scholar] [CrossRef] [Green Version]
- Ruggero, F.; Carretti, E.; Gori, R.; Lotti, T.; Lubello, C. Monitoring of Degradation of Starch-Based Biopolymer Film under Different Composting Conditions, Using TGA, FTIR and SEM Analysis. Chemosphere 2020, 246, 125770. [Google Scholar] [CrossRef]
- Zhang, Y.; Zhang, J.; Lu, Y.; Duan, Y.; Yan, S.; Shen, D. Glass Transition Temperature Determination of Poly(Ethylene Terephthalate) Thin Films Using Reflection−Absorption FTIR. Macromolecules 2004, 37, 2532–2537. [Google Scholar] [CrossRef]
- Bayarı, S.; Severcan, F. FTIR Study of Biodegradable Biopolymers: P(3HB), P(3HB-Co-4HB) and P(3HB-Co-3HV). J. Mol. Struct. 2005, 744–747, 529–534. [Google Scholar] [CrossRef]
- Lewis, R.A. Terahertz Imaging and Spectroscopy Methods and Instrumentation. In Encyclopedia of Spectroscopy and Spectrometry, 3rd ed.; Lindon, J.C., Tranter, G.E., Koppenaal, D.W., Eds.; Academic Press: Oxford, UK, 2017; pp. 422–426. ISBN 978-0-12-803224-4. [Google Scholar]
- Neu, J.; Schmuttenmaer, C.A. Tutorial: An Introduction to Terahertz Time Domain Spectroscopy (THz-TDS). J. Appl. Phys. 2018, 124, 231101. [Google Scholar] [CrossRef] [Green Version]
- Yang, R.; Dong, X.; Chen, G.; Lin, F.; Huang, Z.; Manzo, M.; Mao, H. Novel Terahertz Spectroscopy Technology for Crystallinity and Crystal Structure Analysis of Cellulose. Polymers 2021, 13, 6. [Google Scholar] [CrossRef]
- Xu, J.; Plaxco, K.W.; Allen, S.J. Terahertz Spectroscopy of Biopolymers in Water: Absorption and Circular Dichroism. In Proceedings of the 2006 Joint 31st International Conference on Infrared Millimeter Waves and 14th International Conference on Teraherz Electronics, Shanghai, China, 18–22 September 2006; p. 576. [Google Scholar]
- Naftaly, M.; Miles, R.E. Terahertz Time-Domain Spectroscopy for Material Characterization. Proc. IEEE 2007, 95, 1658–1665. [Google Scholar] [CrossRef]
- Puc, U.; Abina, A.; Jeglič, A.; Zidanšek, A.; Kašalynas, I.; Venckevičius, R.; Valušis, G. Spectroscopic Analysis of Melatonin in the Terahertz Frequency Range. Sensors 2018, 18, 4098. [Google Scholar] [CrossRef] [PubMed] [Green Version]
- Ketelsen, H.; Mästle, R.; Liebermeister, L.; Kohlhaas, R.; Globisch, B. THz Time-Domain Ellipsometer for Material Characterization and Paint Quality Control with More Than 5 THz Bandwidth. Appl. Sci. 2022, 12, 3744. [Google Scholar] [CrossRef]
- Matsumoto, N.; Hosokura, T.; Nagashima, T.; Hangyo, M. Measurement of the Dielectric Constant of Thin Films by Terahertz Time-Domain Spectroscopic Ellipsometry. Opt. Lett. 2011, 36, 265–267. [Google Scholar] [CrossRef] [PubMed]
- Tkachenko, V.; Marino, A.; Vita, F.; D’Amore, F.; De Stefano, L.; Malinconico, M.; Rippa, M.; Abbate, G. Spectroscopic Ellipsometry Study of Liquid Crystal and Polymeric Thin Films in Visible and near Infrared. Eur. Phys. J. E 2004, 14, 185–192. [Google Scholar] [CrossRef]
- Guillet, J.P.; Recur, B.; Frederique, L.; Bousquet, B.; Canioni, L.; Manek-Hönninger, I.; Desbarats, P.; Mounaix, P. Review of Terahertz Tomography Techniques. J. Infrared Millim. Terahertz Waves 2014, 35, 382–411. [Google Scholar] [CrossRef] [Green Version]
- Agulto, V.C.; Iwamoto, T.; Kitahara, H.; Toya, K.; Mag-usara, V.K.; Imanishi, M.; Mori, Y.; Yoshimura, M.; Nakajima, M. Terahertz Time-Domain Ellipsometry with High Precision for the Evaluation of GaN Crystals with Carrier Densities up to 1020 Cm−3. Sci. Rep. 2021, 11, 18129. [Google Scholar] [CrossRef]
- Zhang, Y.; Wang, C.; Huai, B.; Wang, S.; Zhang, Y.; Wang, D.; Rong, L.; Zheng, Y. Continuous-Wave THz Imaging for Biomedical Samples. Appl. Sci. 2021, 11, 71. [Google Scholar] [CrossRef]
- Naftaly, M.; Miles, R.E.; Greenslade, P.J. THz Transmission in Polymer Materials—A Data Library. In Proceedings of the 2007 Joint 32nd International Conference on Infrared and Millimeter Waves and the 15th International Conference on Terahertz Electronics, Cardiff, UK, 2–9 September 2007; pp. 819–820. [Google Scholar]
- Podzorov, A.; Gallot, G. Low-Loss Polymers for Terahertz Applications. Appl. Opt. 2008, 47, 3254–3257. [Google Scholar] [CrossRef] [PubMed]
- D’Angelo, F.; Mics, Z.; Bonn, M.; Turchinovich, D. Ultra-Broadband THz Time-Domain Spectroscopy of Common Polymers Using THz Air Photonics. Opt. Express 2014, 22, 12475–12485. [Google Scholar] [CrossRef] [PubMed] [Green Version]
- Wietzke, S.; Rutz, F.; Jördens, C.; Krumbholz, N.; Vieweg, N.; Jansen, C.; Wilk, R.; Koch, M. Applications of Terahertz Spectroscopy in the Plastics Industry. In Proceedings of the Terahertz Photonics, Beijing, China, 8 February 2008; SPIE: Bellingham, WA, USA, 2008; Volume 6840, pp. 188–196. [Google Scholar]
- Hailu, D.M.; Saeedkia, D. Novel Applications of Terahertz Technology for the Plastic Industry. In Proceedings of the 2016 41st International Conference on Infrared, Millimeter, and Terahertz Waves (IRMMW-THz), Copenhagen, Denmark, 25–30 September 2016; pp. 1–2. [Google Scholar]
- Lopato, P.; Chady, T. Terahertz Detection and Identification of Defects in Layered Polymer Composites and Composite Coatings. Nondestruct. Test. Eval. 2013, 28, 28–43. [Google Scholar] [CrossRef]
- Abina, A.; Puc, U.; Jeglič, A.; Zidanšek, A. Structural Characterization of Thermal Building Insulation Materials Using Terahertz Spectroscopy and Terahertz Pulsed Imaging. NDT E Int. 2016, 77, 11–18. [Google Scholar] [CrossRef]
- Mozejko-Ciesielska, J.; Kumar, P.; Lemos, P.C.; Cui, Y. Editorial: Advances and Trends in Polyhydroxyalkanoate (PHA) Biopolymer Production. Front. Bioeng. Biotechnol. 2022, 10, 873250. [Google Scholar]
- Mehmood, A.; Raina, N.; Phakeenuya, V.; Wonganu, B.; Cheenkachorn, K. The Current Status and Market Trend of Polylactic Acid as Biopolymer: Awareness and Needs for Sustainable Development. Mater. Today Proc. 2023, 72, 3049–3055. [Google Scholar] [CrossRef]
- Rajan, K.P.; Thomas, S.P.; Gopanna, A.; Chavali, M. Polyhydroxybutyrate (PHB): A Standout Biopolymer for Environmental Sustainability. In Handbook of Ecomaterials; Martínez, L.M.T., Kharissova, O.V., Kharisov, B.I., Eds.; Springer International Publishing: Cham, Switzerland, 2017; pp. 1–23. ISBN 978-3-319-48281-1. [Google Scholar]
- Di Lorenzo, M.L.; Longo, A.; Androsch, R. Polyamide 11/Poly(Butylene Succinate) Bio-Based Polymer Blends. Materials 2019, 12, 2833. [Google Scholar] [CrossRef] [Green Version]
- Mhd Haniffa, M.A.C.; Munawar, K.; Ching, Y.C.; Illias, H.A.; Chuah, C.H. Bio-Based Poly(Hydroxy Urethane)s: Synthesis and Pre/Post-Functionalization. Chem. Asian J. 2021, 16, 1281–1297. [Google Scholar] [CrossRef]
- Liu, Y.; Ahmed, S.; Sameen, D.E.; Wang, Y.; Lu, R.; Dai, J.; Li, S.; Qin, W. A Review of Cellulose and Its Derivatives in Biopolymer-Based for Food Packaging Application. Trends Food Sci. Technol. 2021, 112, 532–546. [Google Scholar] [CrossRef]
- Agarwal, S.; Singhal, S.; Godiya, C.B.; Kumar, S. Prospects and Applications of Starch Based Biopolymers. Int. J. Environ. Anal. Chem. 2021, 1–20. [Google Scholar] [CrossRef]
- Numata, K. How to Define and Study Structural Proteins as Biopolymer Materials. Polym. J. 2020, 52, 1043–1056. [Google Scholar] [CrossRef]
- Qurat-ul-Ain; Zia, K.M.; Zia, F.; Ali, M.; Rehman, S.; Zuber, M. Lipid Functionalized Biopolymers: A Review. Int. J. Biol. Macromol. 2016, 93, 1057–1068. [Google Scholar] [CrossRef]
- Ariyoshi, S.; Ohnishi, S.; Mikami, H.; Tsuji, H.; Arakawa, Y.; Tanaka, S.; Hiroshiba, N. Temperature Dependent Poly(L-Lactide) Crystallization Investigated by Fourier Transform Terahertz Spectroscopy. Mater. Adv. 2021, 2, 4630–4633. [Google Scholar] [CrossRef]
- Zhu, Z.; Yu, Z.; Bian, Y.; Zhang, X.; Zeng, R.; Yang, B. Evaluation of Relative Content and Crystallization Behavior of Homogeneous Crystals in Poly (Lactic Acid) by Terahertz Spectroscopy. Polymer 2023, 270, 125779. [Google Scholar] [CrossRef]
- Zhu, Z.; Bian, Y.; Zhang, X.; Zeng, R.; Yang, B. Study of Crystallinity and Conformation of Poly(Lactic Acid) by Terahertz Spectroscopy. Anal. Chem. 2022, 94, 11104–11111. [Google Scholar] [CrossRef]
- Ohnishi, S.; Hiroshiba, N.; Ebata, A.; Ohnishi, B.; Tsuji, H.; Tanaka, S.; Ariyoshi, S. Broadband Terahertz Spectroscopy of Enantiomeric Polylactide. Jpn. J. Appl. Phys. 2023, 62, SG1003. [Google Scholar] [CrossRef]
- Brodie, C.H.; Spotts, I.; Reguigui, H.; Leclerc, C.A.; Mitchell, M.E.; Holzman, J.F.; Collier, C.M. Comprehensive Study of 3D Printing Materials over the Terahertz Regime: Absorption Coefficient and Refractive Index Characterizations. Opt. Mater. Express 2022, 12, 3379–3402. [Google Scholar] [CrossRef]
- Masood, F. Chapter 8—Polyhydroxyalkanoates in the Food Packaging Industry. In Nanotechnology Applications in Food; Oprea, A.E., Grumezescu, A.M., Eds.; Academic Press: Cambridge, MA, USA, 2017; pp. 153–177. ISBN 978-0-12-811942-6. [Google Scholar]
- Bonartsev, A.P.; Bonartseva, G.A.; Reshetov, I.V.; Kirpichnikov, M.P.; Shaitan, K.V. Application of Polyhydroxyalkanoates in Medicine and the Biological Activity of Natural Poly(3-Hydroxybutyrate). Acta Naturae 2019, 11, 4–16. [Google Scholar] [CrossRef]
- Jo, J.; Kim, H.; Jeong, S.-Y.; Park, C.; Hwang, H.S.; Koo, B. Changes in Mechanical Properties of Polyhydroxyalkanoate with Double Silanized Cellulose Nanocrystals Using Different Organosiloxanes. Nanomaterials 2021, 11, 1542. [Google Scholar] [CrossRef]
- Kai, D.; Loh, X.J. Polyhydroxyalkanoates: Chemical Modifications Toward Biomedical Applications. ACS Sustain. Chem. Eng. 2014, 2, 106–119. [Google Scholar] [CrossRef]
- Winnacker, M. Polyhydroxyalkanoates: Recent Advances in Their Synthesis and Applications. Eur. J. Lipid Sci. Technol. 2019, 121, 1900101. [Google Scholar] [CrossRef] [Green Version]
- Kumar, V.; Sehgal, R.; Gupta, R. Blends and Composites of Polyhydroxyalkanoates (PHAs) and Their Applications. Eur. Polym. J. 2021, 161, 110824. [Google Scholar] [CrossRef]
- Hoshina, H.; Morisawa, Y.; Ishii, S.; Sato, H.; Noda, I.; Ozaki, Y.; Otani, C. Terahertz Spectroscopy of Poly(3-Hydroxyalkanoate)s. In Proceedings of the 2011 Annual Report Conference on Electrical Insulation and Dielectric Phenomena, Cancun, Mexico, 16–19 October 2011; pp. 195–198. [Google Scholar]
- Hoshina, H.; Morisawa, Y.; Sato, H.; Minamide, H.; Noda, I.; Ozaki, Y.; Otani, C. Polarization and Temperature Dependent Spectra of Poly(3-Hydroxyalkanoate)s Measured at Terahertz Frequencies. Phys. Chem. Chem. Phys. 2011, 13, 9173. [Google Scholar] [CrossRef] [PubMed]
- Hoshina, H.; Morisawa, Y.; Sato, H.; Kamiya, A.; Noda, I.; Ozaki, Y.; Otani, C. Higher Order Conformation of Poly(3-Hydroxyalkanoates) Studied by Terahertz Time-Domain Spectroscopy. Appl. Phys. Lett. 2010, 96, 101904. [Google Scholar] [CrossRef] [Green Version]
- Hoshina, H.; Suzuki, H.; Otani, C.; Nagai, M.; Kawase, K.; Irizawa, A.; Isoyama, G. Polymer Morphological Change Induced by Terahertz Irradiation. Sci. Rep. 2016, 6, 27180. [Google Scholar] [CrossRef] [PubMed] [Green Version]
- Chen, F.; Nölle, J.M.; Wietzke, S.; Reuter, M.; Chatterjee, S.; Koch, M.; Agarwal, S. A Fast Degrading Odd-Odd Aliphatic Polyester-5,7 Made by Condensation Polymerization for Biomedical Applications. J. Biomater. Sci. Polym. Ed. 2012, 23, 1539–1551. [Google Scholar] [CrossRef]
- Defoirdt, T.; Boon, N.; Sorgeloos, P.; Verstraete, W.; Bossier, P. Short-Chain Fatty Acids and Poly-β-Hydroxyalkanoates: (New) Biocontrol Agents for a Sustainable Animal Production. Biotechnol. Adv. 2009, 27, 680–685. [Google Scholar] [CrossRef]
- Ishii, S.; Suzuki, H.; Morisawa, Y.; Sato, H.; Yamamoto, S.; Ozaki, Y.; Otani, C.; Uchiyama, T.; Hoshina, H. Vibrational Spectra of Nylon-6, Nylon-6/6, Nylom-11 and Nylon-12 Studied by Terahertz Spectroscopy. In Proceedings of the 2012 37th International Conference on Infrared, Millimeter, and Terahertz Waves, Wollongong, NSW, Australia, 23–28 September 2012; pp. 1–2. [Google Scholar]
- Squires, A.D.; Lewis, R.A. Feasibility and Characterization of Common and Exotic Filaments for Use in 3D Printed Terahertz Devices. J. Infrared Millim. Terahertz Waves 2018, 39, 614–635. [Google Scholar] [CrossRef] [Green Version]
- Sukumaran Nair, A.; Cherian, S.; Balachandran, N.; Panicker, U.G.; Kalamblayil Sankaranarayanan, S.K. Hybrid Poly(Hydroxy Urethane)s: Folded-Sheet Morphology and Thermoreversible Adhesion. ACS Omega 2019, 4, 13042–13051. [Google Scholar] [CrossRef] [PubMed] [Green Version]
- Hoshina, H.; Saito, Y.; Furuhashi, T.; Shimazaki, T.; Sawada, M.; Hioki, Y.; Otani, C. Terahertz Spectroscopy for Characterization of Hydrogen Bonding and Cross-Linked Structure Dynamics in Polyurethane. J. Infrared Millim. Terahertz Waves 2020, 41, 265–275. [Google Scholar] [CrossRef] [Green Version]
- Zavodov, I.A.; Kuznetsova, L.M.; Grigorieva, S.V.; Maklakov, L.I. Far-Infrared Spectra of Some Segmented Polyurethanes. J. Mol. Struct. 1996, 375, 193–196. [Google Scholar] [CrossRef]
- Su, T.; Yu, B.; Han, P.; Zhao, G.; Gong, C. Characterization of Spectra of Lignin from Midribs of Tobacco at THz Frequencies. Front. Optoelectron. China 2009, 2, 244–247. [Google Scholar] [CrossRef]
- Newnham, D.A.; Taday, P.F. Pulsed Terahertz Attenuated Total Reflection Spectroscopy. Appl. Spectrosc. 2008, 62, 394–398. [Google Scholar] [CrossRef] [PubMed]
- Jiusheng, L. Optical Parameters of Vegetable Oil Studied by Terahertz Time-Domain Spectroscopy. Appl. Spectrosc. 2010, 64, 231–234. [Google Scholar] [CrossRef] [PubMed]
- Dinovitser, A.; Valchev, D.G.; Abbott, D. Terahertz Time-Domain Spectroscopy of Edible Oils. R. Soc. Open Sci. 2017, 4, 170275. [Google Scholar] [CrossRef] [Green Version]
- Yang, H.; Irudayaraj, J.; Paradkar, M.M. Discriminant Analysis of Edible Oils and Fats by FTIR, FT-NIR and FT-Raman Spectroscopy. Food Chem. 2005, 93, 25–32. [Google Scholar] [CrossRef]
- Chen, T.; Zhong, X.; Li, Z.; Hu, F. Analysis of Intermolecular Weak Interactions and Vibrational Characteristics for Vanillin and Ortho-Vanillin by Terahertz Spectroscopy and Density Functional Theory. IEEE Trans. Terahertz Sci. Technol. 2021, 11, 318–329. [Google Scholar] [CrossRef]
- Nanda, S.; Mohanty, P.; Pant, K.K.; Naik, S.; Kozinski, J.A.; Dalai, A.K. Characterization of North American Lignocellulosic Biomass and Biochars in Terms of Their Candidacy for Alternate Renewable Fuels. BioEnergy Res. 2013, 6, 663–677. [Google Scholar] [CrossRef]
- Yu, T.-Y.; Tseng, Y.-K.; Lin, T.-H.; Wang, T.-C.; Tseng, Y.-H.; Chang, Y.-H.; Wu, M.-C.; Su, W.-F. Effect of Cellulose Compositions and Fabrication Methods on Mechanical Properties of Polyurethane-Cellulose Composites. Carbohydr. Polym. 2022, 291, 119549. [Google Scholar] [CrossRef]
- Amenorfe, L.P.; Agorku, E.S.; Sarpong, F.; Voegborlo, R.B. Innovative Exploration of Additive Incorporated Biopolymer-Based Composites. Sci. Afr. 2022, 17, e01359. [Google Scholar] [CrossRef]
- Wang, H.; Horikawa, Y.; Tsuchikawa, S.; Inagaki, T. Terahertz Time-Domain Spectroscopy as a Novel Tool for Crystallographic Analysis in Cellulose. Cellulose 2020, 27, 9767–9777. [Google Scholar] [CrossRef]
- Ariyoshi, S.; Hashimoto, S.; Ohnishi, S.; Negishi, S.; Mikami, H.; Hayashi, K.; Tanaka, S.; Hiroshiba, N. Broadband Terahertz Spectroscopy of Cellulose Nanofiber-Reinforced Polypropylenes. Mater. Sci. Eng. B 2021, 265, 115000. [Google Scholar] [CrossRef]
- Nakajima, S.; Horiuchi, S.; Ikehata, A.; Ogawa, Y. Determination of Starch Crystallinity with the Fourier-Transform Terahertz Spectrometer. Carbohydr. Polym. 2021, 262, 117928. [Google Scholar] [CrossRef]
- Diyana, Z.N.; Jumaidin, R.; Selamat, M.Z.; Ghazali, I.; Julmohammad, N.; Huda, N.; Ilyas, R.A. Physical Properties of Thermoplastic Starch Derived from Natural Resources and Its Blends: A Review. Polymers 2021, 13, 1396. [Google Scholar] [CrossRef]
- Nanda, S.; Azargohar, R.; Dalai, A.K.; Kozinski, J.A. An Assessment on the Sustainability of Lignocellulosic Biomass for Biorefining. Renew. Sustain. Energy Rev. 2015, 50, 925–941. [Google Scholar] [CrossRef]
- Wang, T.; Wang, S.; Zhai, C.; Wang, L.; Xie, Y.; Li, Q.; Zheng, X. Study of Starch Aging Characteristics Based on Terahertz Technology. Food Sci. Nutr. 2021, 9, 4431–4439. [Google Scholar] [CrossRef]
- Krystyjan, M.; Khachatryan, G.; Grabacka, M.; Krzan, M.; Witczak, M.; Grzyb, J.; Woszczak, L. Physicochemical, Bacteriostatic, and Biological Properties of Starch/Chitosan Polymer Composites Modified by Graphene Oxide, Designed as New Bionanomaterials. Polymers 2021, 13, 2327. [Google Scholar] [CrossRef]
- Zhang, T.; Zakharova, M.; Vozianova, A.; Podshivalov, A.; Fokina, M.; Nazarov, R.; Kuzikova, A.; Demchenko, P.; Uspenskaya, M.; Khodzitsky, M. Terahertz Optical and Mechanical Properties of the Gelatin-Starch-Glycerol-Bentonite Biopolymers. J. Biomed. Photonics Eng. 2020, 6, 020304. [Google Scholar] [CrossRef]
- Xie, L.; Yao, Y.; Ying, Y. The Application of Terahertz Spectroscopy to Protein Detection: A Review. Appl. Spectrosc. Rev. 2014, 49, 448–461. [Google Scholar] [CrossRef]
- Falconer, R.J.; Markelz, A.G. Terahertz Spectroscopic Analysis of Peptides and Proteins. J. Infrared Millim. Terahertz Waves 2012, 33, 973–988. [Google Scholar] [CrossRef]
- Wei, L.; Yu, L.; Jiaoqi, H.; Guorong, H.; Yang, Z.; Weiling, F. Application of Terahertz Spectroscopy in Biomolecule Detection. Front. Lab. Med. 2018, 2, 127–133. [Google Scholar] [CrossRef]
- Wei, X.; Kong, D.; Zhu, S.; Li, S.; Zhou, S.; Wu, W. Rapid Identification of Soybean Varieties by Terahertz Frequency-Domain Spectroscopy and Grey Wolf Optimizer-Support Vector Machine. Front. Plant Sci. 2022, 13, 823865. [Google Scholar]
- Ge, H.; Jiang, Y.; Lian, F.; Zhang, Y.; Xia, S. Characterization of Wheat Varieties Using Terahertz Time-Domain Spectroscopy. Sensors 2015, 15, 12560–12572. [Google Scholar] [CrossRef] [Green Version]
- Ruggiero, M.T.; Korter, T.M. Measuring Protein Elasticity with Terahertz Spectroscopy. In Proceedings of the 2016 41st International Conference on Infrared, Millimeter, and Terahertz Waves (IRMMW-THz), Copenhagen, Denmark, 25–30 September 2016; pp. 1–2. [Google Scholar]
- Hoshina, H.; Yamazaki, S.; Tsubouchi, M.; Harata, M. Terahertz Irradiation Effects on the Morphology and Dynamics of Actin Biopolymer. J. Phys. Photonics 2021, 3, 034015. [Google Scholar] [CrossRef]
- Balu, R.; Zhang, H.; Zukowski, E.; Chen, J.-Y.; Markelz, A.G.; Gregurick, S.K. Terahertz Spectroscopy of Bacteriorhodopsin and Rhodopsin: Similarities and Differences. Biophys. J. 2008, 94, 3217–3226. [Google Scholar] [CrossRef] [Green Version]
- Bark, H.S.; Maeng, I.; Kim, J.U.; Kim, K.D.; Na, J.H.; Min, J.; Byun, J.; Song, Y.; Cha, B.; Oh, S.J.; et al. Terahertz Spectral Properties of PEO-Based Anti-Adhesion Films Cross-Linked by Electron Beam Irradiation. Polymers 2022, 14, 2008. [Google Scholar] [CrossRef]
- Liu, T. ki Permittivity and Loss Characterization of Polymer Films for Terahertz Applications. Highlights Sci. Eng. Technol. 2022, 15, 159–168. [Google Scholar] [CrossRef]
- Rodrigues, D.C.; Cunha, A.P.; Brito, E.S.; Azeredo, H.M.C.; Gallão, M.I. Mesquite Seed Gum and Palm Fruit Oil Emulsion Edible Films: Influence of Oil Content and Sonication. Food Hydrocoll. 2016, 56, 227–235. [Google Scholar] [CrossRef]
- Chiumarelli, M.; Hubinger, M.D. Evaluation of Edible Films and Coatings Formulated with Cassava Starch, Glycerol, Carnauba Wax and Stearic Acid. Food Hydrocoll. 2014, 38, 20–27. [Google Scholar] [CrossRef]
- Shao, Y.; Gu, W.; Qiu, Y.; Wang, S.; Peng, Y.; Zhu, Y.; Zhuang, S. Lipids Monitoring in Scenedesmus Obliquus Based on Terahertz Technology. Biotechnol. Biofuels 2020, 13, 161. [Google Scholar] [CrossRef]
- Jiang, F.L.; Ikeda, I.; Ogawa, Y.; Endo, Y. Terahertz Absorption Spectra of Fatty Acids and Their Analogues. J. Oleo Sci. 2011, 60, 339–343. [Google Scholar] [CrossRef] [Green Version]
- Tian, L.; Xu, X. Optical Properties and Crystallization of Natural Waxes at Several Annealing Temperatures: A Terahertz Time-Domain Spectroscopy Study. J. Infrared Millim. Terahertz Waves 2018, 39, 302–312. [Google Scholar] [CrossRef]
- El Haddad, J.; De Miollis, F.; Bousquet, B.; Canioni, L.; Mounaix, P. Chemometrics Applied to Analysis of Terahertz Spectra. In Proceedings of the 2013 38th International Conference on Infrared, Millimeter, and Terahertz Waves (IRMMW-THz), Mainz, Germany, 1–6 September 2013. [Google Scholar]
- El Haddad, J.; Bousquet, B.; Canioni, L.; Mounaix, P. Review in Terahertz Spectral Analysis. TrAC Trends Anal. Chem. 2013, 44, 98–105. [Google Scholar] [CrossRef] [Green Version]
- Scheller, M. Data Extraction from Terahertz Time Domain Spectroscopy Measurements. J. Infrared Millim. Terahertz Waves 2014, 35, 638–648. [Google Scholar] [CrossRef]
- Lee, J.; Song, Y.; Lee, H.; Zeitler, J.A. Extraction of Spectral Information From Terahertz Reflectometry Data. In Proceedings of the 2022 47th International Conference on Infrared, Millimeter and Terahertz Waves (IRMMW-THz), Delft, The Netherlands, 28 August–2 September 2022; pp. 1–2. [Google Scholar]
- Duvillaret, L.; Garet, F.; Coutaz, J.-L. Highly Precise Determination of Optical Constants and Sample Thickness in Terahertz Time-Domain Spectroscopy. Appl. Opt. 1999, 38, 409–415. [Google Scholar] [CrossRef]
- Jepsen, P.U.; Cooke, D.G.; Koch, M. Terahertz Spectroscopy and Imaging—Modern Techniques and Applications. Laser Photonics Rev. 2010, 5, 124–166. [Google Scholar] [CrossRef]
- Ruggiero, M.T. Editorial Introduction to the Special Issue: Interpretation of Solid-State Terahertz Spectra. J. Infrared Millim. Terahertz Waves 2020, 41, 1281–1283. [Google Scholar] [CrossRef]
- Chen, J.; Chen, Y.; Zhao, H.; Bastiaans, G.J.; Zhang, X.-C. Absorption Coefficients of Selected Explosives and Related Compounds in the Range of 0.1–2.8 THz. Opt. Express 2007, 15, 12060–12067. [Google Scholar] [CrossRef]
- Liu, J.; Fan, L.; Liu, Y.; Mao, L.; Kan, J. Application of Terahertz Spectroscopy and Chemometrics for Discrimination of Transgenic Camellia Oil. Spectrochim. Acta. A Mol. Biomol. Spectrosc. 2019, 206, 165–169. [Google Scholar] [CrossRef]
- Zhang, H.; Li, Z. Terahertz Spectroscopy Applied to Quantitative Determination of Harmful Additives in Medicinal Herbs. Optik 2018, 156, 834–840. [Google Scholar] [CrossRef]
- Wold, S.; Sjöström, M.; Eriksson, L. PLS-Regression: A Basic Tool of Chemometrics. Chemom. Intell. Lab. Syst. 2001, 58, 109–130. [Google Scholar] [CrossRef]
- Klokkou, N.; Gorecki, J.; Wilkinson, J.S.; Apostolopoulos, V. Artificial Neural Networks for Material Parameter Extraction in Terahertz Time-Domain Spectroscopy. Opt. Express 2022, 30, 15583–15595. [Google Scholar] [CrossRef]
- Farhad, A.; Pyun, J.-Y. Terahertz Meets AI: The State of the Art. Sensors 2023, 23, 5034. [Google Scholar] [CrossRef]
- Shi, J.; Guo, Z.; Chen, H.; Xiao, Z.; Bai, H.; Li, X.; Niu, P.; Yao, J. Artificial Intelligence-Assisted Terahertz Imaging for Rapid and Label-Free Identification of Efficient Light Formula in Laser Therapy. Biosensors 2022, 12, 826. [Google Scholar] [CrossRef]
- Park, H.; Son, J.-H. Machine Learning Techniques for THz Imaging and Time-Domain Spectroscopy. Sensors 2021, 21, 1186. [Google Scholar] [CrossRef]
- Bulgarevich, D.S.; Talara, M.; Tani, M.; Watanabe, M. Machine Learning for Pattern and Waveform Recognitions in Terahertz Image Data. Sci. Rep. 2021, 11, 1251. [Google Scholar] [CrossRef]
- Jiang, Y.; Li, G.; Ge, H.; Wang, F.; Li, L.; Chen, X.; Lu, M.; Zhang, Y. Machine Learning and Application in Terahertz Technology: A Review on Achievements and Future Challenges. IEEE Access 2022, 10, 53761–53776. [Google Scholar] [CrossRef]
- Helal, S.; Sarieddeen, H.; Dahrouj, H.; Al-Naffouri, T.Y.; Alouini, M.-S. Signal Processing and Machine Learning Techniques for Terahertz Sensing: An Overview. IEEE Signal Process. Mag. 2022, 39, 42–62. [Google Scholar] [CrossRef]
- Pan, R.; Zhao, S.; Shen, J. Terahertz Spectra Applications in Identification of Illicit Drugs Using Support Vector Machines. Procedia Eng. 2010, 7, 15–21. [Google Scholar] [CrossRef] [Green Version]
- Qi, N.; Zhang, Z.; Xiang, Y.; Yang, Y.; Liang, X.; Harrington, P.D.B. Terahertz Time-Domain Spectroscopy Combined with Support Vector Machines and Partial Least Squares-Discriminant Analysis Applied for the Diagnosis of Cervical Carcinoma. Anal. Methods 2015, 7, 2333–2338. [Google Scholar] [CrossRef]
- Motlak, H.; Hakeem, S.I. Detection and Classification of Breast Cancer Based-on Terahertz Imaging Technique Using Artificial Neural Network & K-Nearest Neighbor Algorithm. Int. J. Appl. Eng. Res. 2017, 12, 10661–10668. [Google Scholar]
- Liu, W.; Zhang, R.; Ling, Y.; Tang, H.; She, R.; Wei, G.; Gong, X.; Lu, Y. Automatic Recognition of Breast Invasive Ductal Carcinoma Based on Terahertz Spectroscopy with Wavelet Packet Transform and Machine Learning. Biomed. Opt. Express 2020, 11, 971–981. [Google Scholar] [CrossRef] [PubMed]
- Nowak, M.R.; Zdunek, R.; Nowak, K.; Jaroszewski, M.; Plinski, E.F.; Swiatek, P.; Strzelecka, M.; Malinka, W.; Plinska, S. Rapid Classification of Bi-Heterocyclic Compounds by Using THz-TDS with Combined Double-Loop Learning SVM and KNN. In Proceedings of the 2019 44th International Conference on Infrared, Millimeter, and Terahertz Waves (IRMMW-THz), Paris, France, 1–6 September 2019; pp. 1–2. [Google Scholar]
- Liu, W.; Zhang, Y.; Yang, S.; Han, D. Terahertz Time-Domain Attenuated Total Reflection Spectroscopy Applied to the Rapid Discrimination of the Botanical Origin of Honeys. Spectrochim. Acta A Mol. Biomol. Spectrosc. 2018, 196, 123–130. [Google Scholar] [CrossRef] [PubMed]
- Yin, M.; Tang, S.; Tong, M. Identification of Edible Oils Using Terahertz Spectroscopy Combined with Genetic Algorithm and Partial Least Squares Discriminant Analysis. Anal. Methods 2016, 8, 2794–2798. [Google Scholar] [CrossRef]
- Kristensen, M.H.; Cielecki, P.P.; Skovsen, E. Classification of Terahertz Reflection Spectra Using Machine Learning Algorithms. In Proceedings of the 2022 47th International Conference on Infrared, Millimeter and Terahertz Waves (IRMMW-THz), Delft, The Netherlands, 28 August–2 September 2022; pp. 1–2. [Google Scholar]
- Zheng, C.; Cai, S.; Li, Q.; Li, C.; Li, X. A Collaborative Classification Algorithm with Multi-View Terahertz Spectra. Results Phys. 2022, 42, 106023. [Google Scholar] [CrossRef]
- Wei, X.; Li, S.; Zhu, S.; Zheng, W.; Xie, Y.; Zhou, S.; Hu, M.; Miao, Y.; Ma, L.; Wu, W.; et al. Terahertz Spectroscopy Combined with Data Dimensionality Reduction Algorithms for Quantitative Analysis of Protein Content in Soybeans. Spectrochim. Acta A Mol. Biomol. Spectrosc. 2021, 253, 119571. [Google Scholar] [CrossRef]
- Khani, M.E.; Harris, Z.B.; Osman, O.B.; Zhou, J.W.; Chen, A.; Singer, A.J.; Arbab, M.H. Supervised Machine Learning for Automatic Classification of in Vivo Scald and Contact Burn Injuries Using the Terahertz Portable Handheld Spectral Reflection (PHASR) Scanner. Sci. Rep. 2022, 12, 5096. [Google Scholar] [CrossRef]
- Yang, S.; Li, C.; Mei, Y.; Liu, W.; Liu, R.; Chen, W.; Han, D.; Xu, K. Determination of the Geographical Origin of Coffee Beans Using Terahertz Spectroscopy Combined With Machine Learning Methods. Front. Nutr. 2021, 8, 680627. [Google Scholar] [CrossRef]
- Chowdhury, M.A.Z.; Rice, T.E.; Oehlschlaeger, M.A. TSMC-Net: Deep-Learning Multigas Classification Using THz Absorption Spectra. ACS Sens. 2023, 8, 1230–1240. [Google Scholar] [CrossRef]
- Wang, C.; Shi, F.; Zhao, M.; Ao, J.; Jia, C.; Chen, S. Convolutional Neural Network-Based Terahertz Spectral Classification of Liquid Contraband for Security Inspection. IEEE Sens. J. 2021, 21, 18955–18963. [Google Scholar] [CrossRef]
- Dutta, B.; Root, K.; Ullmann, I.; Wagner, F.; Mayr, M.; Seuret, M.; Thies, M.; Stromer, D.; Christlein, V.; Schür, J.; et al. Deep Learning for Terahertz Image Denoising in Nondestructive Historical Document Analysis. Sci. Rep. 2022, 12, 22554. [Google Scholar] [CrossRef] [PubMed]
- Jiang, Y.; Wang, F.; Ge, H.; Li, G.; Chen, X.; Li, L.; Lv, M.; Zhang, Y. Identification of Unsound Grains in Wheat Using Deep Learning and Terahertz Spectral Imaging Technology. Agronomy 2022, 12, 1093. [Google Scholar] [CrossRef]
- Liu, H.; Vohra, N.; Bailey, K.; El-Shenawee, M.; Nelson, A.H. Deep Learning Classification of Breast Cancer Tissue from Terahertz Imaging Through Wavelet Synchro-Squeezed Transformation and Transfer Learning. J. Infrared Millim. Terahertz Waves 2022, 43, 48–70. [Google Scholar] [CrossRef] [PubMed]
- Hou, Z.; Cha, X.; An, H.; Zhang, A.; Lai, D. Super-Resolution Reconstruction of Terahertz Images Based on Residual Generative Adversarial Network with Enhanced Attention. Entropy 2023, 25, 440. [Google Scholar] [CrossRef]
- Long, Z.; Wang, T.; You, C.; Yang, Z.; Wang, K.; Liu, J. Terahertz Image Super-Resolution Based on a Deep Convolutional Neural Network. Appl. Opt. 2019, 58, 2731–2735. [Google Scholar] [CrossRef]
- Limbacher, B.; Schoenhuber, S.; Wenclawiak, M.; Kainz, M.A.; Andrews, A.M.; Strasser, G.; Darmo, J.; Unterrainer, K. Terahertz Optical Machine Learning for Object Recognition. APL Photonics 2020, 5, 126103. [Google Scholar] [CrossRef]
- Meiser, C.; Wald, A.; Schuster, T. Learned Anomaly Detection with Terahertz Radiation in Inline Process Monitoring. Sens. Imaging 2022, 23, 30. [Google Scholar] [CrossRef]
- Nüßler, D.; Gruna, R.; Brandt, C.; Kuter, A.; Langle, T.; Kieninger, M.; Pohl, N. Innovative Technologies as Enabler for Sorting of Black Plastics. In Proceedings of the 19th World Conference on Non-Destructive Testing 2016, Munich, Germany, 13–17 June 2016; pp. 1–8. [Google Scholar]
- Kim, H.-S.; Park, D.-W.; Kim, S.-I.; Oh, G.-H.; Kim, H.-S. Non-Destructive Detection of Thin Micro-Defects in Glass Reinforced Polymer Composites Using a Terahertz Electro–Magnetic Wave Based on a Convolution Neural Network. Compos. Part B Eng. 2023, 257, 110694. [Google Scholar] [CrossRef]
- Sarjaš, A.; Pongrac, B.; Gleich, D. Automated Inorganic Pigment Classification in Plastic Material Using Terahertz Spectroscopy. Sensors 2021, 21, 4709. [Google Scholar] [CrossRef]
- Rosenboom, J.-G.; Langer, R.; Traverso, G. Bioplastics for a Circular Economy. Nat. Rev. Mater. 2022, 7, 117–137. [Google Scholar] [CrossRef] [PubMed]
- Kawakami, D.; Tabata, H. THz-TDS Measurements of Hydration State of Bio Related Materials and Data Analysis by Machine Learning. In Proceedings of the 2018 43rd International Conference on Infrared, Millimeter, and Terahertz Waves (IRMMW-THz), Nagoya, Japan, 9–14 September 2018. [Google Scholar]
- Li, Y.; Liu, L.; Wang, Z.; Chang, T.; Li, K.; Xu, W.; Wu, Y.; Yang, H.; Jiang, D. To Estimate Performance of Artificial Neural Network Model Based on Terahertz Spectrum: Gelatin Identification as an Example. Front. Nutr. 2022, 9, 925717. [Google Scholar] [PubMed]


Disclaimer/Publisher’s Note: The statements, opinions and data contained in all publications are solely those of the individual author(s) and contributor(s) and not of MDPI and/or the editor(s). MDPI and/or the editor(s) disclaim responsibility for any injury to people or property resulting from any ideas, methods, instructions or products referred to in the content. |
© 2023 by the authors. Licensee MDPI, Basel, Switzerland. This article is an open access article distributed under the terms and conditions of the Creative Commons Attribution (CC BY) license (https://creativecommons.org/licenses/by/4.0/).
Share and Cite
Abina, A.; Korošec, T.; Puc, U.; Zidanšek, A. Review of Bioplastics Characterisation by Terahertz Techniques in the View of Ensuring a Circular Economy. Photonics 2023, 10, 883. https://doi.org/10.3390/photonics10080883
Abina A, Korošec T, Puc U, Zidanšek A. Review of Bioplastics Characterisation by Terahertz Techniques in the View of Ensuring a Circular Economy. Photonics. 2023; 10(8):883. https://doi.org/10.3390/photonics10080883
Chicago/Turabian StyleAbina, Andreja, Tjaša Korošec, Uroš Puc, and Aleksander Zidanšek. 2023. "Review of Bioplastics Characterisation by Terahertz Techniques in the View of Ensuring a Circular Economy" Photonics 10, no. 8: 883. https://doi.org/10.3390/photonics10080883