Article

Tailoring the Thermal Diffusivity of Polyvinylidene Fluoride via Carbon Source Integration: A Photothermal Beam Deflection Study

by
Mohanachandran Nair Sindhu Swapna
1,
Dorota Korte
1,* and
Sankaranarayana Iyer Sankararaman
2,*
1
Laboratory for Environmental and Life Sciences, University of Nova Gorica, Vipavska 13, SI-5000 Nova Gorica, Slovenia
2
Department of Optoelectronics, University of Kerala, Trivandrum 695581, Kerala, India
*
Authors to whom correspondence should be addressed.
Photonics 2023, 10(8), 942; https://doi.org/10.3390/photonics10080942
Submission received: 2 July 2023 / Revised: 4 August 2023 / Accepted: 15 August 2023 / Published: 17 August 2023
(This article belongs to the Section Lasers, Light Sources and Sensors)

Abstract

:
The work reported in the paper addresses the thermal diffusivity (TD) tuning of the electronic sensor material polyvinylidene fluoride (PVDF). The thermal properties of electronic material were found to influence the device characteristics significantly, demanding novel techniques for TD tuning. The TD value of the carbon sources—hydroxyethyl cellulose (HC), lignin (LG), and camphor soot (CS) and their composites—were measured by the sensitive nondestructive evaluation technique—photothermal beam deflection. When the HC and LG enhanced the TD of PVDF by 237.5% and 27.5%, respectively, CS was found to lower it by 11.25%. The spectroscopic analysis revealed the variation of hydroxyl groups in the samples and suggested its prominence in deciding the TD value. The Fourier transform infrared analysis and beam deflection measurements exhibited a positive correlation between hydroxyl groups and TD, except for the composite PVDF combined with soot. In this case, the amorphous carbon in soot reduced PVDF’s TD due to the heat trap mechanism of carbon allotropes. The induced variation of TD of PVDF via carbon source integration is attributed to the closure of pores in PVDF, revealed through the optical microscopic images, thereby suggesting a methodology for enhancing or reducing TD of PVDF.

1. Introduction

Polyvinylidene fluoride (PVDF) has numerous applications across various industries. PVDF is a semi-crystalline polymer with a chemical structure composed of repeating vinylidene fluoride monomers. It exhibits a predominantly crystalline beta (β)-phase structure, imparting dipolar characteristics and enabling piezoelectric and pyroelectric properties [1,2]. This makes it ideal for sensors and transducers used in pressure sensors, accelerometers, and ultrasound devices. PVDF membranes and filters are widely employed in pharmaceutical, biotechnology, and water treatment industries due to their chemical resistance and high porosity [3]. The durability and weather resistance of PVDF coatings make them suitable for architectural and automotive coatings, and corrosion protection in chemical processing equipment [1]. PVDF also serves as a binder material in lithium-ion batteries, an encapsulation material in photovoltaic devices, an insulation material in wire and cable applications, and a biocompatible material in medical devices. It has excellent mechanical properties, such as high tensile strength, stiffness, and impact resistance, and maintaining its integrity across a wide temperature range. It is thermally stable with a high melting point (177 °C) and exhibits exceptional chemical resistance, making it impervious to acids, bases, solvents, and UV radiation. The high dielectric strength (~500 MV·m−1) [4] and low dielectric loss (~0.01) [5] exhibited by PVDF make it a preferred material for wire and cable insulation in harsh environments. It provides insulation with high resistance to temperature, chemicals, and mechanical stress. The transparency of PVDF to infrared radiation and its capability to generate an electrical charge when subjected to mechanical stress or pressure makes it suitable for electronic and sensor applications. These applications demand knowledge of its heat-conducting property [1,2,6].
The thermal diffusivity (TD) of PVDF (0.03 × 10⁻⁶ to 0.09 × 10⁻⁶ m2·s−1) [7,8], which measures how quickly heat can be conducted through the material, holds significance in various applications in which thermal management is crucial, such as electronic devices and heat sinks. PVDF’s low thermal diffusivity can contribute to its insulating properties by limiting the rate at which heat is conducted through the material. This property can be advantageous in applications where thermal insulation is desired, such as thermal barriers or protective coatings that minimise heat transfer. Hence, tuning the TD of PVDF is highly appreciated considering its diversified applications [2,9,10]. A higher thermal diffusivity enables faster heat dissipation, preventing overheating and ensuring the proper functioning and longevity of the devices. Efficient heat dissipation is crucial to maintain optimal operating temperatures and prevent temperature gradients that can impact the performance and lifespan of the devices. PVDF is used in various manufacturing processes, including injection moulding and extrusion. Understanding the value of TD helps in optimising processing parameters and controlling the cooling rate, ensuring proper material flow, and achieving desired part properties. Besides the tailoring of TD, its precise measurement is also highly significant.
Laser-assisted photothermal techniques offer versatile, sensitive, and nondestructive methods for thermal diffusivity measurements [11,12,13]. These techniques utilise light to induce local heating in samples, enabling high-resolution imaging, spectroscopy, and therapeutic applications [12,14]. Among these methods, the present study used photothermal beam deflection (BDS) to investigate thermal diffusivity. BDS’s non-contact and nondestructive nature makes it a versatile tool for material characterisation, surface analysis, thin film studies, and evaluating thermal properties in various applications [15,16,17]. The present work elucidates the tailoring of the thermal diffusivity of PVDF by incorporating various carbon sources and measures the TD variations by the BDS technique.

2. Materials and Methods

For the preparation of the polyvinylidene fluoride (PVDF—purchased from Fluka (AB211736, CAS 24937-79-9); molecular weight—64.03 g/mol and density—1.780 g/mL) polymer sample, 1.5 g of PVDF was thoroughly mixed with 25 mL of N,N-Dimethylformamide (DMF—purchased from GRAMMOL (P120501, CAS 68-12-2); molecular weight—73.10 g/mol and density—0.944 g/mL) and stirred using a hot plate magnetic stirrer (IDL GmbH & Co KG, Nidderau, Germany) for 30 min at a temperature of 50 degrees Celsius. Subsequently, the mixture was refrigerated for 20 h. After refrigeration, the sample was dried in an oven (BINDER GmbH 78532, Tuttlingen, Germany) at 80 degrees Celsius. Finally, the sample was subjected to a solar simulator (Suntest XLS+ Atlas, ATLAS Material Testing Technology GmbH, Linsengericht, Germany) for 2 h to ensure complete drying and to optimise its properties. In order to tailor the thermal properties of the PVDF, various carbon sources, such as hydroxy ethyl cellulose (HC), lignin (LG), and camphor soot (CS), were incorporated to prepare PVDF-carbon composite samples. To prepare the PVDF-carbon polymer composite sample, 1.5 g of PVDF was mixed with 25 mL of DMF and stirred for 30 min at a temperature of 50 degrees Celsius. Following this, 2.5 g of a carbon source was added to the solution and mixed for an additional hour at 60 degrees Celsius. The resulting mixture was then refrigerated for a period of 20 h to facilitate proper blending. Subsequently, the composite was dried in an oven at 80 degrees Celsius to remove residual solvent. Finally, to ensure thorough drying and optimise the composite properties, it was subjected to a 2 h drying process using a solar simulator. This multi-step procedure enables the successful preparation of the PVDF-carbon polymer composite sample, incorporating the desired carbon source into the PVDF matrix for subsequent analysis or application. The process was repeated for the carbon sources—hydroxy ethyl cellulose (Fluka BioChemika 54290, CAS 9004-62-0, 99.9% purity) and lignin alkali (Sigma-Aldrich Chemie GmbH, Taufkirchen, Germany, CAS 8068-05-1, 99% purity). The third carbon source, camphor soot, was obtained by the incomplete combustion of camphor tablets, as described in the literature [18]. The base sample, PVDF, the carbon sources, HC, LG, and CS, and the polymer composites of HC, LG, and CS in PVDF, PHC, PLG, and PCS, respectively, were subjected to BDS studies to understand how the TD of PVDF is modified by the incorporation of various carbon sources. The morphology of the samples is understood from the images recorded using the fluorescent light microscope with a digital q-color 5 camera and Olympus IX81 software. The optical characterisation of the sample in the ultraviolet-visible (UV-Vis) and infrared region (IR) was carried out using the instruments Perkin Elmer Lambda 650S UV/VIS spectrometer with a resolution of 0.17 nm and Perkin Elmer Spectrum 100 equipped with PIKE Gladi ATR in the 500–4000 cm−1 range with a wavelength resolution of 0.5 cm−1 and recorded in a scan time of 5 min.
Laser-assisted photothermal techniques are employed for various TD measurement methods because of their versatility, sensitivity, and nondestructive nature [11,12,13]. Photothermal techniques encompass a range of methods that utilise light to induce localised heating in a sample for analysis and characterisation. These techniques include photothermal microscopy for high-resolution imaging of temperature variations, photothermal spectroscopy for assessing optical absorption and thermal properties, photothermal radiometry for measuring infrared emission and thermal parameters, photothermal deflection spectroscopy for monitoring deflections induced by thermal expansion, photothermal optical coherence tomography for subsurface thermal imaging, and photothermal therapy for targeted medical treatments [12,14,19]. These techniques play a vital role in materials science, biology, medicine, and environmental monitoring, providing valuable insights into thermal properties, imaging, spectroscopy, and therapeutic applications [13,17,20,21]. Among these PT techniques, the present work employed the photothermal beam deflection technique (BDS) to investigate the TD of the samples.
The BDS technique is a powerful method to study materials’ thermal and optical properties [11,12,17]. It involves the deflection of a probe beam due to localised heating induced by the absorption of modulated pump laser/excitation beam (EB) in a sample. The periodic optical absorption results in periodic heat deposition and propagation within the sample. When this thermal energy is coupled to the coupling medium, its refractive index varies with the same periodicity. This leads to the deflection of the probe beam (PB), which is directly proportional to the thermal oscillations (TOs—thermal expansion or contraction) caused by the absorbed light. Since only the absorbed light alone contributes to the signal, the technique is highly sensitive with a high signal-to-noise ratio, allowing for precise measurement of thermal parameters. By analysing the deflection signal, valuable information about the sample’s optical absorption coefficient, thermal diffusivity, thermal conductivity, and other related properties can be obtained. Its non-contact and nondestructive nature makes it a versatile tool for investigating various materials and systems.
The schematic of the BDS experimental setup [19] employed in the present study is shown in Figure 1. A solid-state laser with an output wavelength of 375 nm and an output power of 80 mW (Oxxius S A, LBX-375-200-CSB-PPA, Lannion, France) was selected as the EB source. The laser beam was internally modulated in the 3–210 Hz frequency range using a lock-in-amplifier (Stanford Research Instruments, Model SR830 DSP, Sunnyvale, CA, USA). As the modulation frequency varied, the thermal diffusion length for collecting the information from the entire sample, the EB, was modulated at different frequencies. A green He-Ne laser (Melles Griot, Model 25-LGR-393–230, Carlsbad, CA, USA) with an output wavelength of 543 nm and power of 2 mW was used for the probe beam source. Both the beams were focused using a set of lenses (L1 and L2) (Bi-Convex, AR Coated: 350–700 nm, Edmund Optics, Barrington, IL, USA) and adjustable mirrors (M1 and M2-Thorlabs, GmbH, Bergkirchen, Germany) onto the sample in the holder attached to an XYZ translation stage (Newport Motorized Linear Stage Model: MFA CC, Irvine, CA, USA). The amplitude and phase of the deflected PB were detected using a visible quadrant cell photoreceiver (Silicon, 190–1050 nm, Newport 0901, Newfocus Model 2901) equipped with an interference filter (CWL 534 nm, Edmund Optics, Barrington, IL, USA). The output of the quadrant detector was fed to the lock-in-amplifier, modulating the EB, where phase-locked detection of the signal occurs. The lock-in-amplifier was connected to a computer for recording the data. The BDS signal ( S B D S ) can be mathematically described as follows [21]:
S B D S = 2 K d 0 + z 0 0   d x + d y R e a k I m Φ I 0 = A B D S c o s 2 π f t + a t a n Θ m I / Θ m R + φ B D S
where a and Φ represent the changes in the electric field amplitude and phase of the PB due to its interaction with the induced TOs; K d , the detector constant; k, the wave number of the PB; f, the modulation frequency of the EB; A B D S and φ B D S ,   the amplitude and the phase of the BDS signal. Here, the parameters Θ m I   and Θ m R are the real and imaginary parts of temperature oscillations induced in the fluid over the sample [11]. The derivation of these equations can be found in the literature [21]. The excitation beam modulation frequency-dependent amplitude and phase of the photodeflection signal were used to extract the examined samples’ thermal properties from the experimental data using a least-squares procedure [21]. The fitting procedure was performed on both the amplitude and phase of the BDS signal. The fitted parameters are the thermal diffusivity and conductivity of the examined sample, while the fixed parameters are the height of PB over the sample (50 μm), the PB radius (40 μm), and its waist position (12 cm), as well as the sample (12 cm) and detector position (20 cm).

3. Results and Discussion

The goal of the present work was the tuning of the thermal diffusivity of PVDF using CS, LG, and HC, and developing a precise understanding of its thermal and optical properties that are essential for its applications in electronics, sensors, and barrier coatings.The UV-visible and Fourier transform infrared (FTIR) spectroscopic studies reveal the interaction of materials with electromagnetic radiation in the UV-visible and IR regions. The UV-visible absorption spectrum of the PVDF, CS, LG, and HC is shown in Figure 2. The absorption spectrum of the base PVDF showed a sharp peak at 222 nm, indicating the semi-crystalline nature of PVDF. The absorption peak is attributed to the π–π* electronic transitions that are sensitive to the molecular arrangement and crystallinity of PVDF [22]. The crystalline regions in PVDF, having a more ordered molecular structure with extended conjugation, lead to a more pronounced absorption peak, and amorphous regions or defects disrupt the conjugation and can diminish or broaden the absorption peak. The spectrum of HC exhibited humps at 267 nm and 367 nm, which may be attributed to n–π* electronic transitions. The absorbance peaks of LG obtained at 308 nm and 371 nm are due to the presence of aromatic rings/non-conjugated phenolic groups present in the different chromophores in the lignin structure [23]. The camphor soot shows the absorbance at 253 nm due to π → π* transitions of C–C and C=C bonds in sp2 hybrid regions of the carbon core [18]. Thus, from the UV-visible absorption spectrum of these carbon sources, it can be seen that they exhibit significant absorption in the UV region, according to which the excitation wavelength for the BDS measurement is selected.
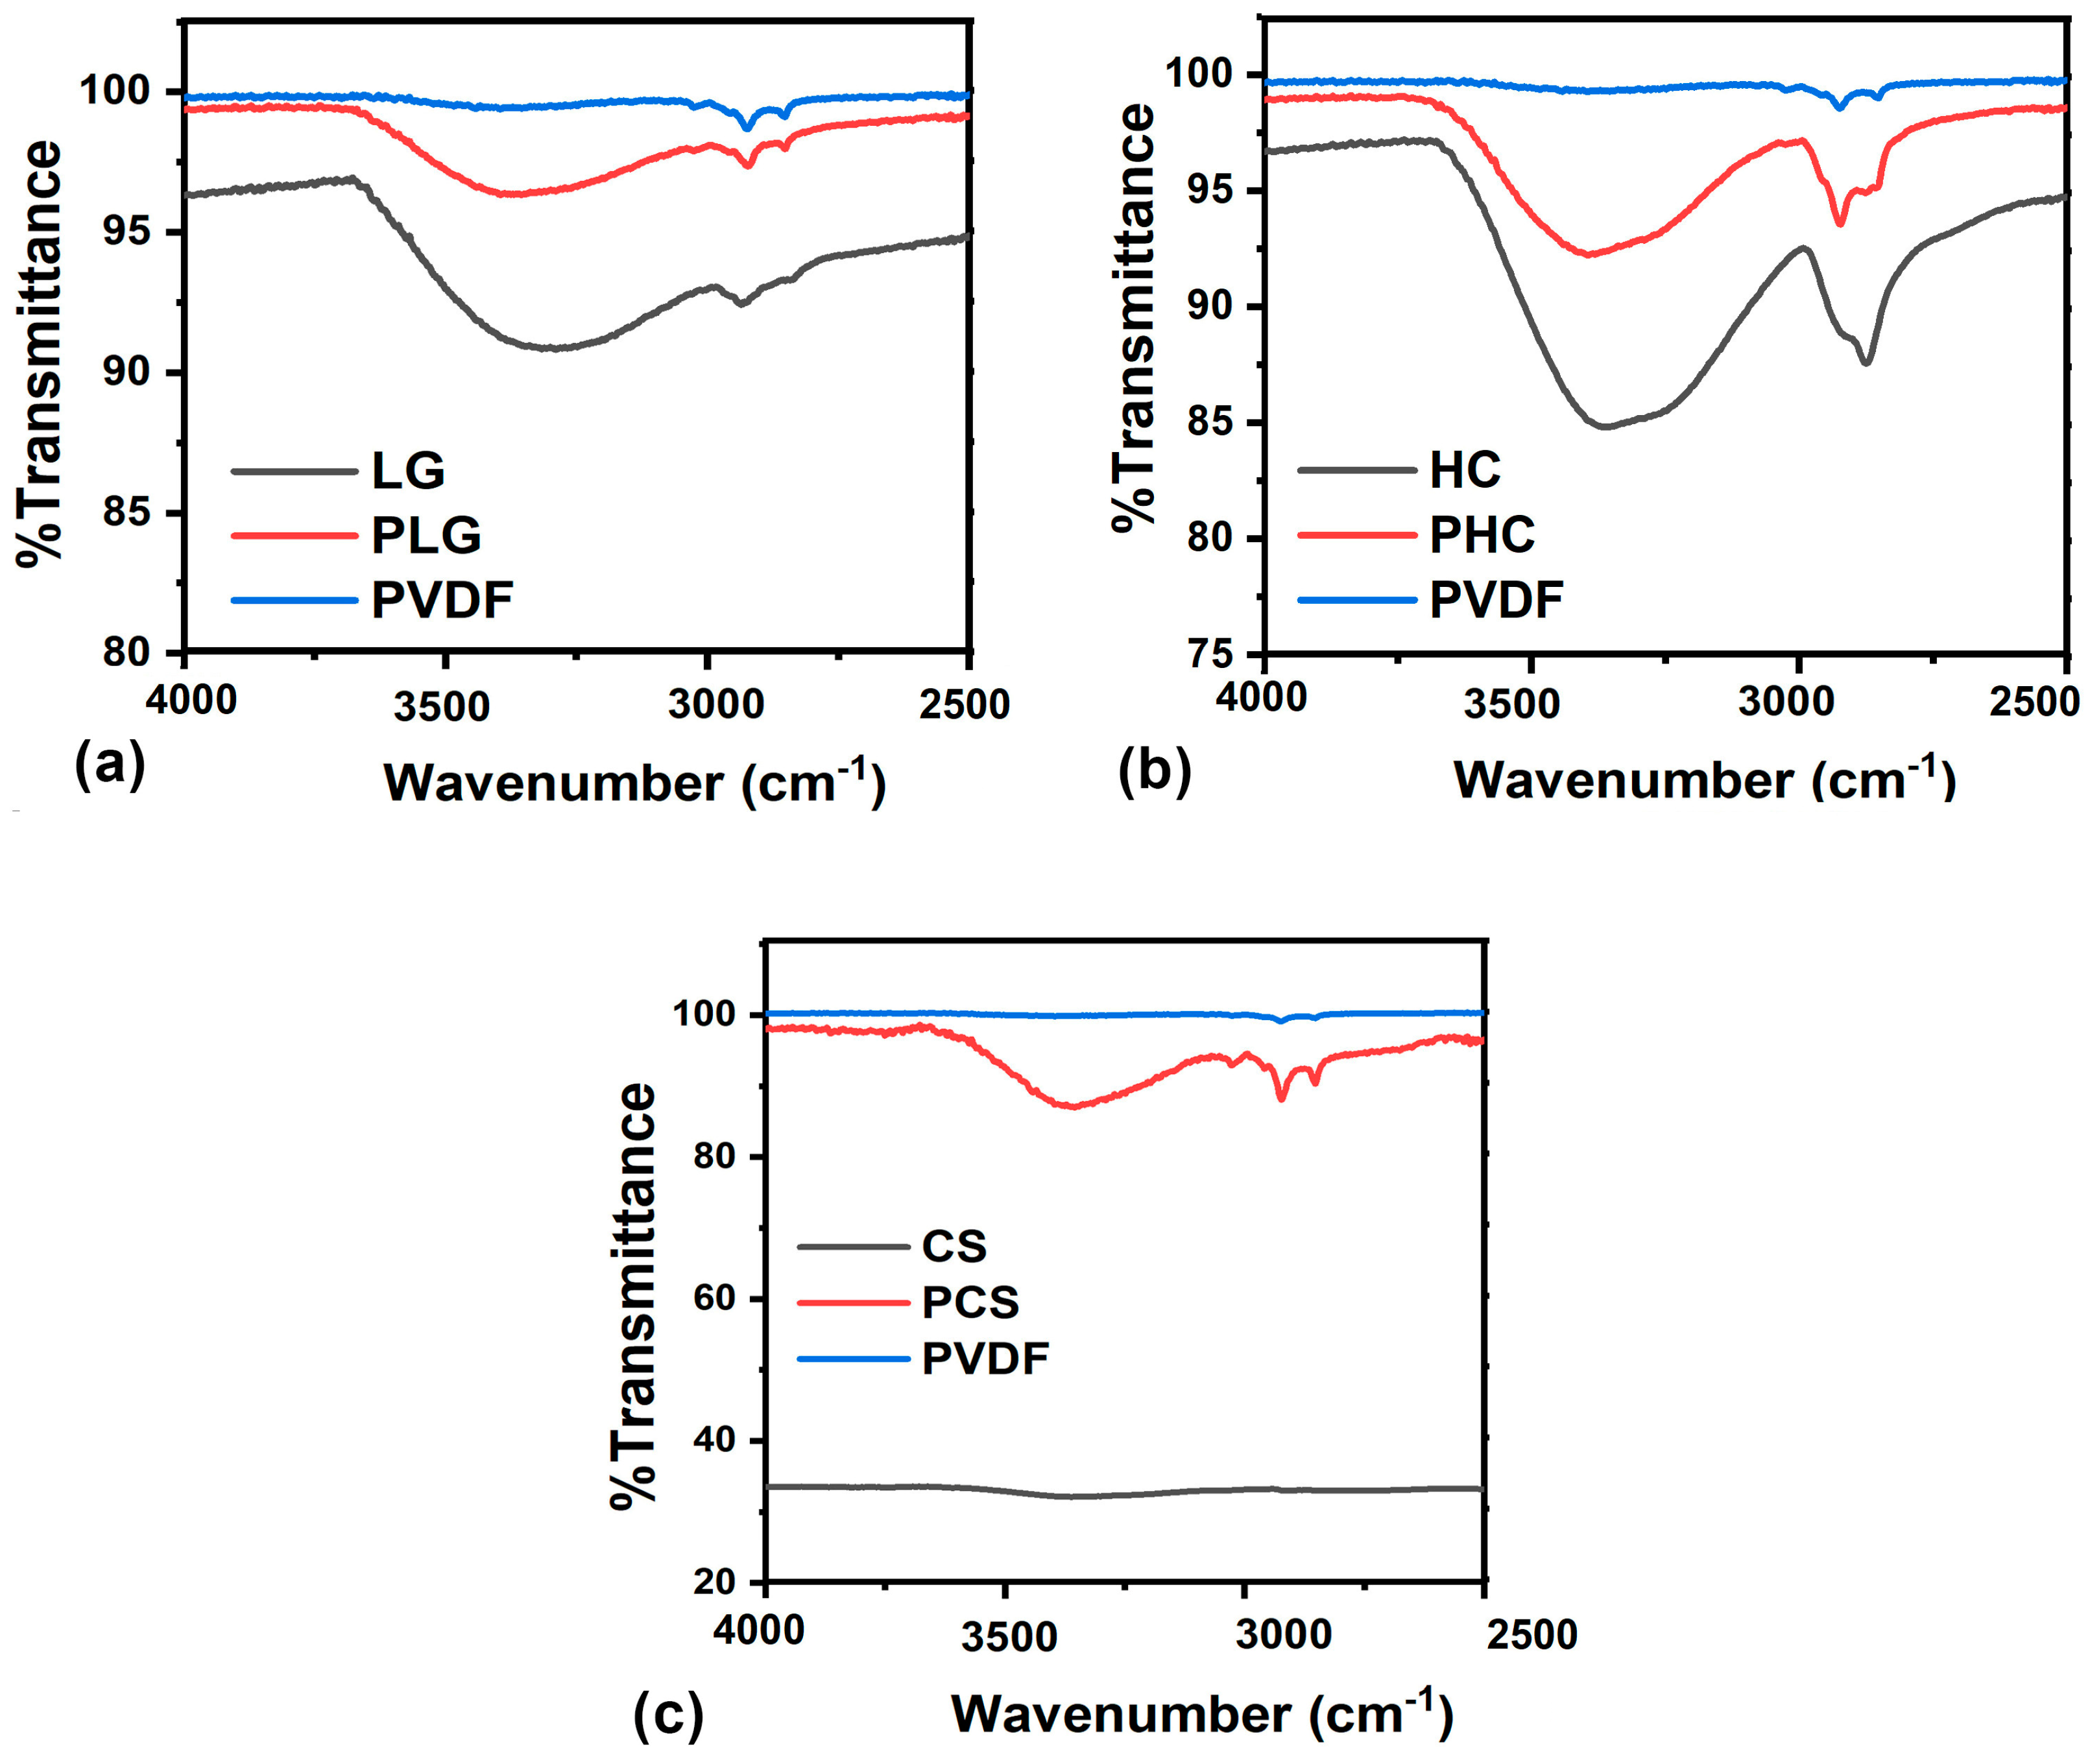
The interaction of the IR region of the electromagnetic spectrum with the samples’ base material, PVDF, carbon sources, CS, LG, and HC, and the polymer composites, PCS, PLG, and PHC, can be learned from the FTIR spectrum shown in Figure 3. FTIR spectroscopy is a valuable tool for investigating intermolecular interactions, compatibility between different components, and the presence of additives or fillers in the composite material. It is beneficial for identifying functional groups in organic compounds. Functional groups are specific arrangements of atoms that determine the chemical properties and reactivity of a molecule. By examining the characteristic absorption bands associated with various functional groups (e.g., carbonyl, hydroxyl, amino), the presence and concentration of these groups in a sample can be identified [24]. The structures of HC, LG, and camphor, shown in Figure 4, display how the functional groups are bonded in the molecule. It is worth noting that the amount of OH groups in the carbon sources HC and LG was greater when compared to the camphor, from which camphor soot is produced, as shown in Figure 4. The structure of camphor is shown in Figure 4a,b, as it is not possible to draw a structure as with the soot.
Table S1 in Supplementary File S1 gives the FTIR peaks and their assignments. A closer observation of the spectra reveals that (i) the transmittance fell upon soot incorporation compared to HC and LG, (ii) the composites exhibited the presence of OH groups that were absent in PVDF, (iii) the transmittance of the composite in the region 2500–4000 cm−1 was between that of PVDF and the respective carbon source as observed in Figure 5, and (iv) the composites exhibited the signature peaks of the base and the respective carbon source. The peaks of the samples were found to be in good agreement with the literature reports of PVDF, cellulose, lignin, and camphor soot [24,25,26,27,28,29,30,31,32,33,34,35,36,37].
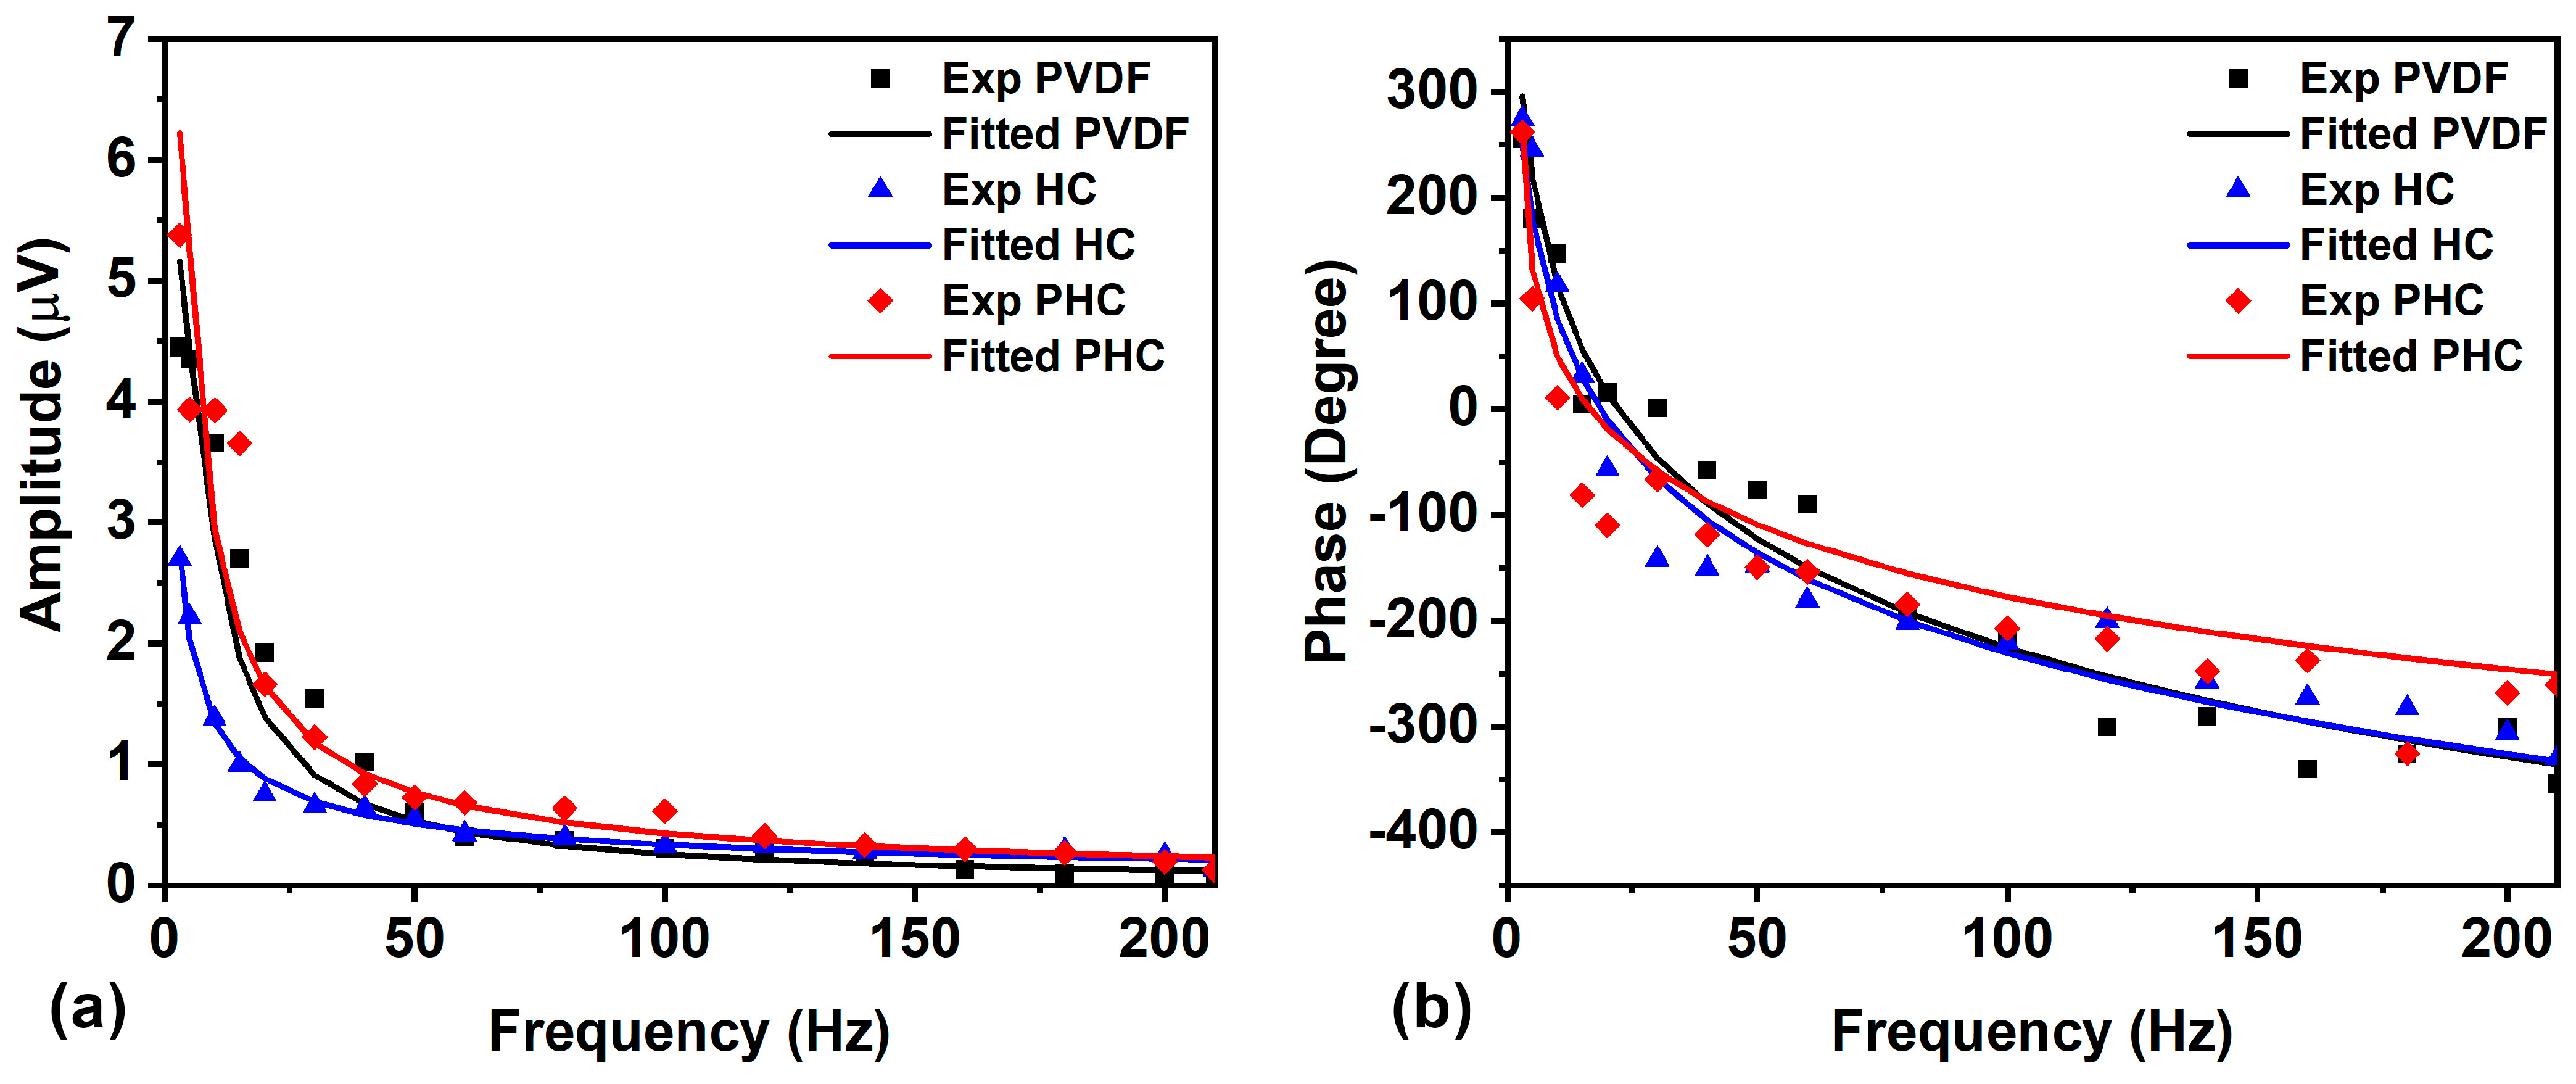
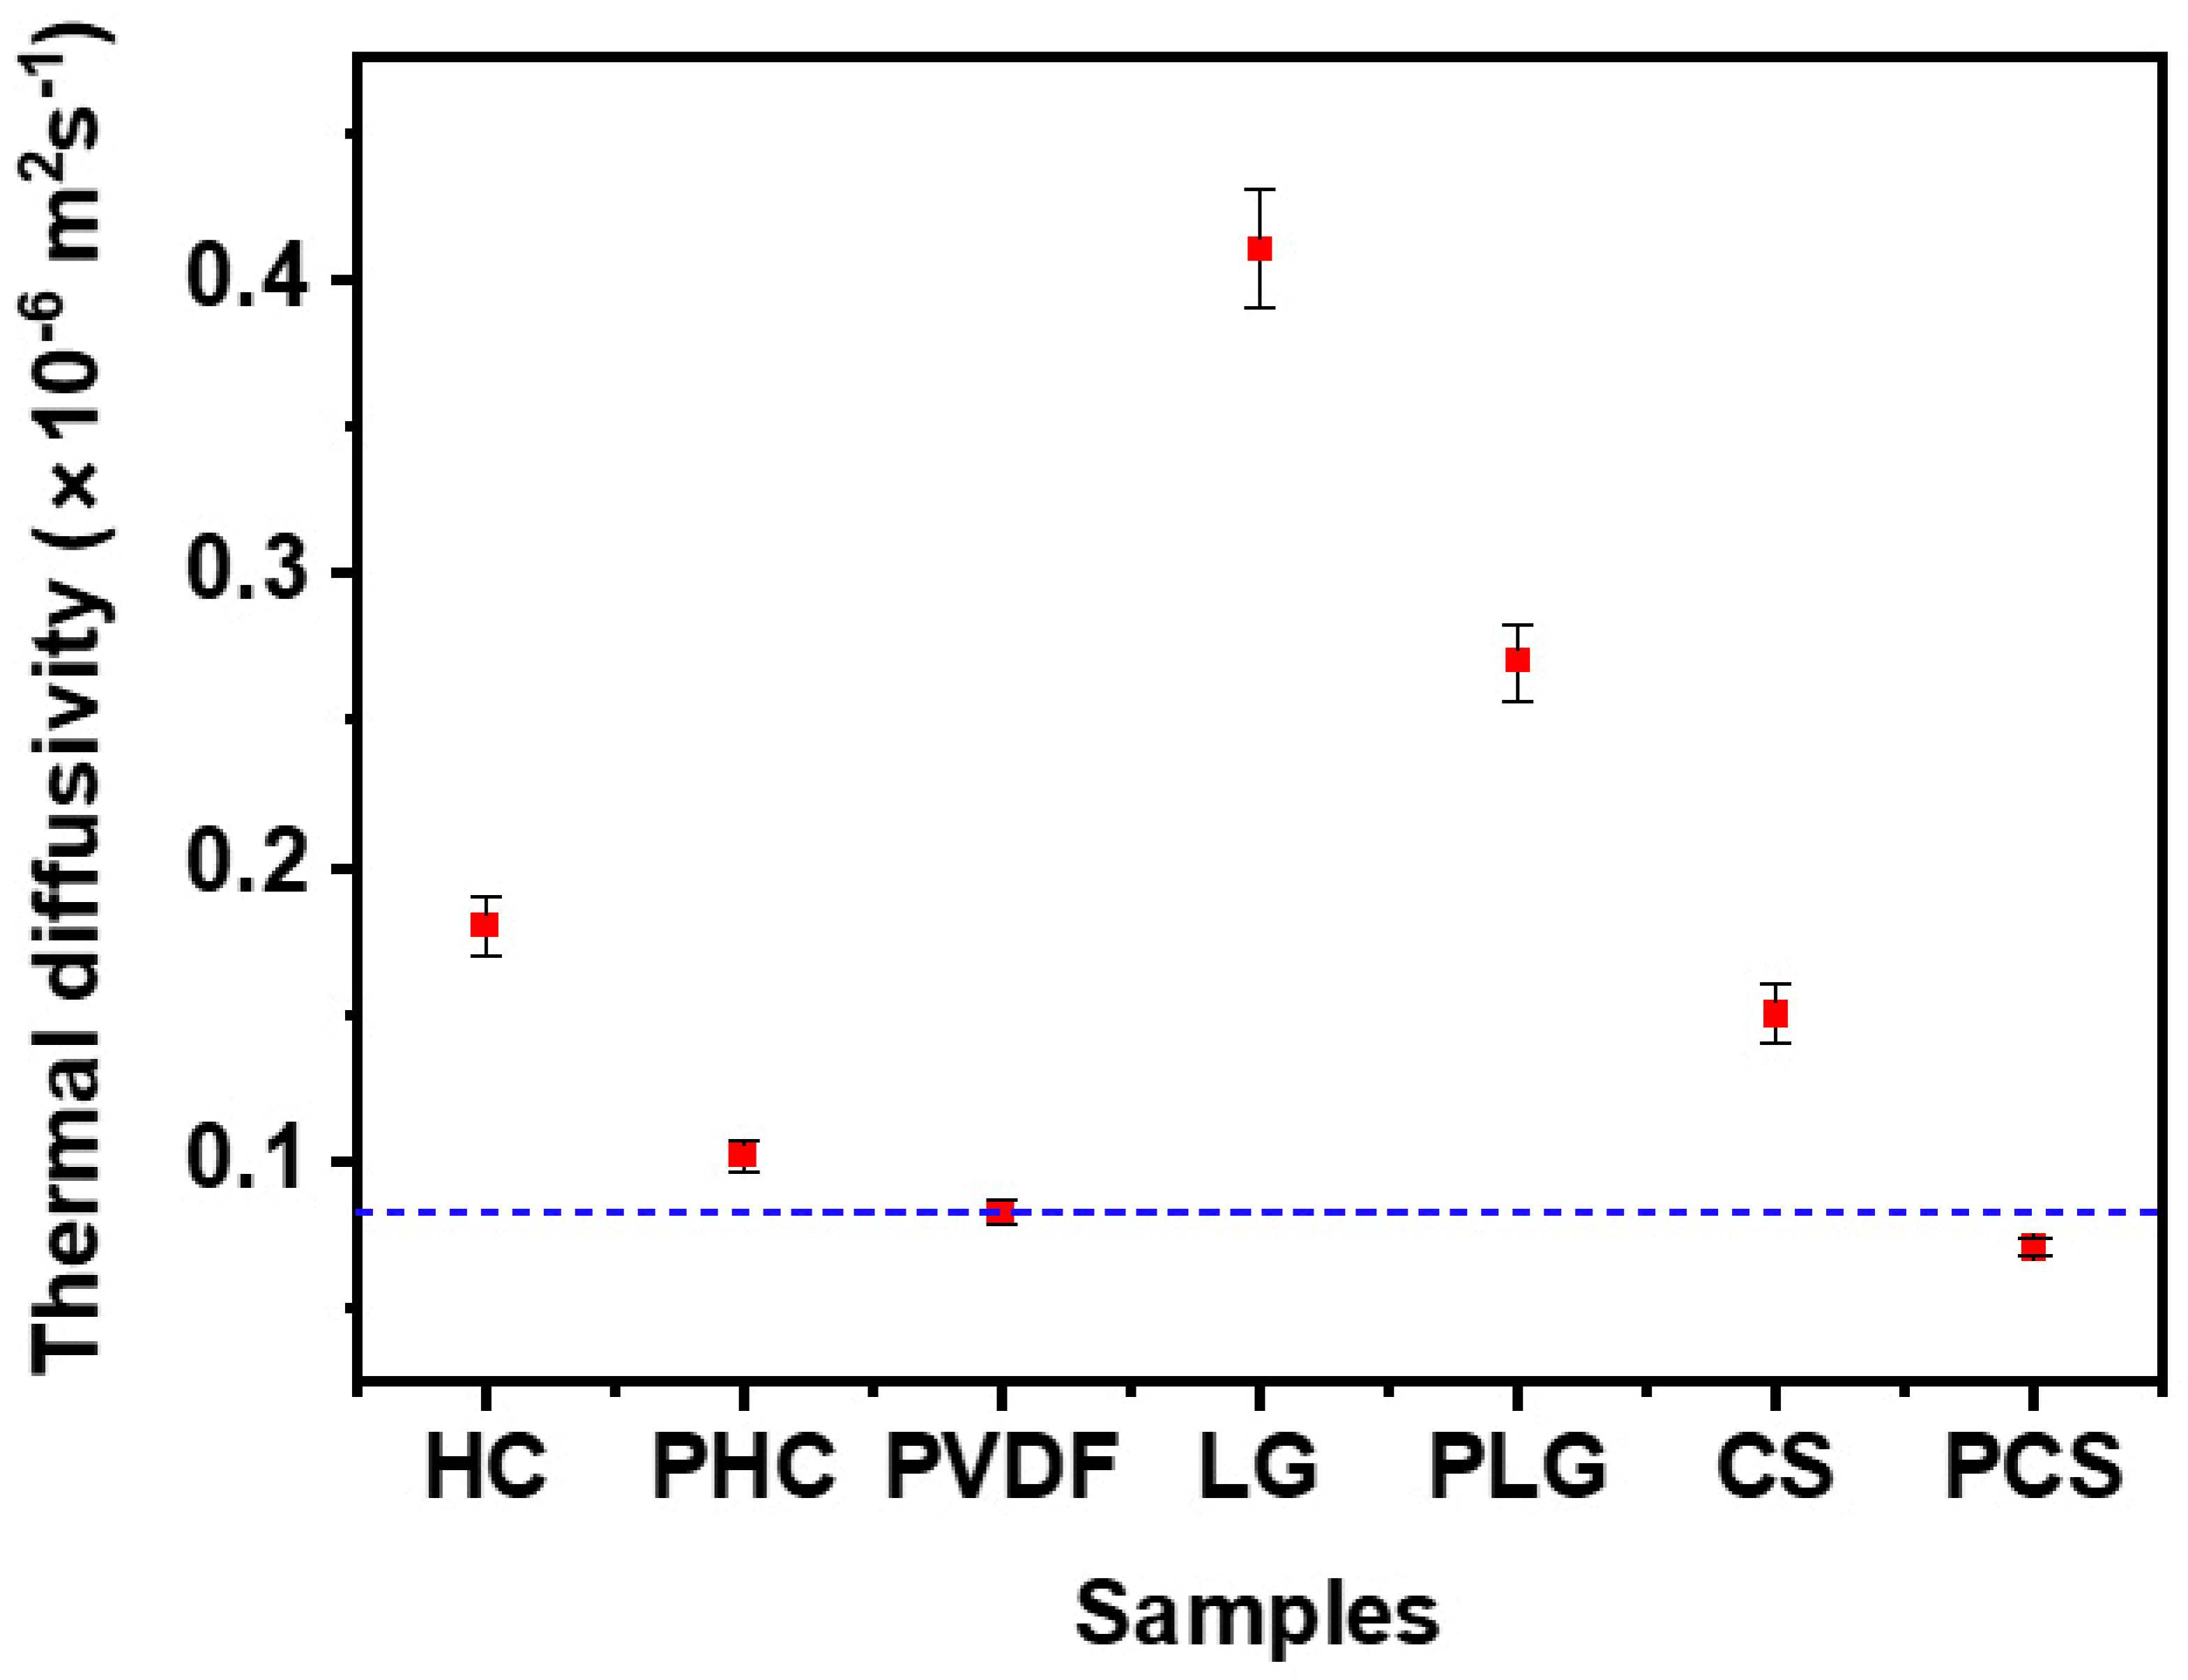
The thermal diffusivity of the samples was determined by the sensitive nondestructive BDS technique. As the samples exhibited good absorption at 375 nm, the pump beam can generate good photothermal BDS signals. The experimental setup was standardised by determining the known thermal diffusivity (α) of the sample aluminium, which was obtained in agreement with the literature as 9.8 × 10⁻⁵ m2·s−1 [19,38]. The variation of the amplitude and phase with the frequency (Figure 6) was used to perform a multi-parameter fitting of the theoretical BDS signal dependences, using Eq. 1, to obtain information about the TD of the samples. The experimental and fitted signal of the PVDF, HC, and PHC is shown as a representative in Figure 6. The TD values of PVDF, the carbon sources, CS, LG, and HC, along with those of their composites PCS, PLG, and PHC are shown in Figure 7. The BDS measurements revealed that forming a polymer composite of LG and HC helped enhance the TD of PVDF by 237.5% and 27.5%, respectively, whereas with CS lowered the TD of PVDF by 11.25%. This suggests the possible tuning of the TD of the base PVDF by making composites with suitable carbon sources, depending on the application.
The variation of TD, as shown in Figure 7, can be attributed to the variation of hydroxyl groups, as revealed through the peaks between 4000 and 2500 cm−1 in the FTIR spectrum shown in Figure 3. Hydroxyl groups (OH) are reported to significantly impact the TD of a material, indicating how quickly heat flows through a material. The mechanism of the increase in TD due to the OH groups can be explained as follows. The OH bond is polar, which means that it has a positive end and a negative end. This polarity allows the OH bond to interact with other polar molecules, such as water. These interactions create a network of pathways that heat can travel through. The second possible thermal energy propagation mechanism can be attributed to the increase in the molecular vibrations of the molecules in a material. These vibrations can transfer heat energy from one molecule to another, which can help to increase the rate of heat conduction. The formation of a thin layer of water on the surface of the material increases the surface area of the material and thereby helps to increase the rate of heat conduction. When analysed, the FTIR spectrum and the TD measured by the BDS technique suggest that the more hydroxyl groups a material has, the higher its TD will be. However, the sample soot with PVDF exhibited juxtaposed behaviour compared to the other two carbon sources (HC and LG). Here, the soot reduced the TD of PVDF due to the well-known heat trap mechanism exhibited by the carbon allotropes—mainly the amorphous carbon in the soot.
The variation of TD of PVDF and PHC can be due to the closure of pores in PVDF, as shown in Figure 8, as representatives. The addition of cellulose in PVDF lowers the porosity and is evident from the optical microscopic image of PVDF and PHC shown in Figure 8a,b. The image suggests that the incorporated particles of the carbon source are found to lower the porosity, which is evident from the pixel intensity variations displayed in Figure 8c,d along the yellow line shown in Figure 8a,b. The valleys in Figure 8c,d indicate the pores, while the peaks represent the occupied positions. Adding HC to PVDF is found to lower the number of pores in it, thereby enhancing the composite’s thermal diffusivity. The morphological modification displayed in Figure 8 justifies the analysis detailed above. The study suggests a method of tuning the TD of the material by way of altering the number of hydroxyl groups and porosity. This opens up the possibility of employing PVDF-based flexible electronic systems.

4. Conclusions

The paper presents a methodology to tune the thermal diffusivity (TD) of PVDF by preparing polymer composites with different carbon sources (HC, LG, CS). The TD of the samples was measured using the sensitive and nondestructive BDS technique. FTIR analysis revealed valuable information on intermolecular interactions and functional groups. It was observed that OH groups play a significant role in tuning the TD of the composites. The composites LG and HC, with higher amounts of OH groups, were found to enhance the TD, while the CS composite with a lower amount of the OH group was found to lower it. The increased molecular vibrations due to the presence of OH groups can be considered to facilitate heat conduction. Conversely, adding soot reduced TD due to the heat trap mechanism of amorphous carbon in soot. Optical microscopic images showed that incorporating carbon sources lowered porosity, influencing thermal diffusivity. The study highlights the possibility of tuning PVDF’s TD by selecting appropriate carbon sources for fabricating sensors and detectors in flexible electronics.

Supplementary Materials

The following supporting information can be downloaded at: https://www.mdpi.com/article/10.3390/photonics10080942/s1, Table S1: FTIR peaks and the assignments of the samples PVDF—polyvinylidene fluoride, HC—hydroxyethyl cellulose, LG—Lignin, and CS—camphor soot, PHC-(HC-PVDF) composite, PCS-(CS-PVDF) composite, and PLG-(LG-PVDF) composite.

Author Contributions

M.N.S.S.—methodology, experimental, formal analysis, writing original draft, review and editing; D.K.—formal analysis, writing original draft, review and editing; S.I.S.—formal analysis, validation, supervision, writing original draft, review and editing. All authors have read and agreed to the published version of the manuscript.

Funding

The authors M. N. S. Swapna, and D. Korte are grateful to Slovenian Research Agency for funding the project (No. J7-2602) and program (No. P2-0393).

Institutional Review Board Statement

Not applicable.

Informed Consent Statement

Not applicable.

Data Availability Statement

The data that support the finding of this study are available from the corresponding author upon reasonable request.

Conflicts of Interest

The authors declare no conflict of interest.

References

  1. Saxena, P.; Shukla, P. A Comprehensive Review on Fundamental Properties and Applications of Poly(Vinylidene Fluoride) (PVDF). Adv. Compos. Hybrid Mater. 2021, 4, 8–26. [Google Scholar] [CrossRef]
  2. Dallaev, R.; Pisarenko, T.; Sobola, D.; Orudzhev, F.; Ramazanov, S.; Trčka, T. Brief Review of PVDF Properties and Applications Potential. Polymers 2022, 14, 4793. [Google Scholar] [CrossRef] [PubMed]
  3. Tang, Y.; Lin, Y.; Ma, W.; Wang, X. A Review on Microporous Polyvinylidene Fluoride Membranes Fabricated via Thermally Induced Phase Separation for MF/UF Application. J. Memb. Sci. 2021, 639, 119759. [Google Scholar] [CrossRef]
  4. Xia, W.; Zhang, Z. PVDF-based Dielectric Polymers and Their Applications in Electronic Materials. IET Nanodielectrics 2018, 1, 17–31. [Google Scholar] [CrossRef]
  5. Lavanya Rathi, P.; Ponraj, B.; Deepa, S. Structural, Magnetic and Electrical Properties of Electroactive-Superparamagnetic PVDF-Sn0.2Fe2.8O4 Nanocomposite Films. Ceram. Int. 2021, 47, 9727–9735. [Google Scholar] [CrossRef]
  6. Vodišek, N.; Šuligoj, A.; Korte, D.; Štangar, U.L. Transparent Photocatalytic Thin Films on Flexible Polymer Substrates. Materials 2018, 11, 1945. [Google Scholar] [CrossRef] [PubMed]
  7. Iguchi, C.Y.; dos Santos, W.N.; Gregorio, R. Determination of Thermal Properties of Pyroelectric Polymers, Copolymers and Blends by the Laser Flash Technique. Polym. Test. 2007, 26, 788–792. [Google Scholar] [CrossRef]
  8. Tsutsumi, N.; Terao, M.; Kiyotsukuri, T. Thermal Diffusivity and Heat Capacity of Poly(Vinylidene Fluoride)/Poly(Methyl Methacrylate) Blends by Flash Radiometry. Polymer 1993, 34, 90–94. [Google Scholar] [CrossRef]
  9. Zhou, W.; Zhang, F.; Yuan, M.; Li, B.; Peng, J.; Lv, Y.; Cai, H.; Liu, X.; Chen, Q.; Dang, Z.-M. Improved Dielectric Properties and Thermal Conductivity of PVDF Composites Filled with Core–Shell Structured Cu@CuO Particles. J. Mater. Sci. Mater. Electron. 2019, 30, 18350–18361. [Google Scholar] [CrossRef]
  10. Zhang, W.; Xu, X.; Yang, J.; Huang, T.; Zhang, N.; Wang, Y.; Zhou, Z. High Thermal Conductivity of Poly(Vinylidene Fluoride)/Carbon Nanotubes Nanocomposites Achieved by Adding Polyvinylpyrrolidone. Compos. Sci. Technol. 2015, 106, 1–8. [Google Scholar] [CrossRef]
  11. Korte, D.; Franko, M. Application of Complex Geometrical Optics to Determination of Thermal, Transport, and Optical Parameters of Thin Films by the Photothermal Beam Deflection Technique. J. Opt. Soc. Am. A 2015, 32, 61. [Google Scholar] [CrossRef]
  12. Sell, J. Photothermal Investigations of Solids and Fluids, 1st ed.; Elsevier: Amsterdam, The Netherlands, 2012; ISBN 0323154220. [Google Scholar]
  13. Liu, J.; Han, M.; Wang, R.; Xu, S.; Wang, X. Photothermal Phenomenon: Extended Ideas for Thermophysical Properties Characterization. J. Appl. Phys. 2022, 131, 065107. [Google Scholar] [CrossRef]
  14. Usoltseva, L.O.; Korobov, M.V.; Proskurnin, M.A. Photothermal Spectroscopy: A Promising Tool for Nanofluids. J. Appl. Phys. 2020, 128, 190901. [Google Scholar] [CrossRef]
  15. Soumya, S.; Raj, V.; Swapna, M.S.; Sankararaman, S. Thermal Diffusivity Downscaling of Molybdenum Oxide Thin Film through Annealing Temperature-Induced Nano-Lamelle Formation: A Photothermal Beam Deflection Study. Eur. Phys. J. Plus 2021, 136, 187. [Google Scholar] [CrossRef]
  16. Warrier, A.R.; Vijayakumar, K.P.; Sudha Kartha, C.; Manoharan, N.; Venkatraman, B. Photothermal Beam Deflection Technique for Nondestructive Evaluation of Thin Film Photovoltaic Cells. In Proceedings of the 2015 Asia International Conference on Quantitative InfraRed Thermography, Mahabalipuram, India, 6–10 July 2015; QIRT Council: Mahabalipuram, India, 2015. [Google Scholar]
  17. Leahu, G.; Petronijevic, E.; Li Voti, R.; Belardini, A.; Cesca, T.; Mattei, G.; Sibilia, C. Diffracted Beams from Metasurfaces: High Chiral Detectivity by Photothermal Deflection Technique. Adv. Opt. Mater. 2021, 9, 2100670. [Google Scholar] [CrossRef]
  18. Swapna, M.S.; Saritha Devi, H.V.; Sankararaman, S. Camphor Soot: A Tunable Light Emitter. Appl. Phys. A 2018, 124, 50. [Google Scholar] [CrossRef]
  19. Swapna, M.N.S.; Korte, D.; Sankararaman, S.I. Unveiling the Role of the Beam Shape in Photothermal Beam Deflection Measurements: A 1D and 2D Complex Geometrical Optics Model Approach. Photonics 2022, 9, 991. [Google Scholar] [CrossRef]
  20. Soumya, S.; Arun Kumar, R.; Raj, V.; Swapna, M.S.; Sankararaman, S. Thermal Diffusivity of Molybdenum Oxide Nanowire Film: A Photothermal Beam Deflection Study. Opt. Laser Technol. 2021, 139, 106993. [Google Scholar] [CrossRef]
  21. Cabrera, H.; Korte, D.; Budasheva, H.; Abbasgholi, N.; Asbaghi, B.; Bellucci, S. Through-Plane and In-Plane Thermal Diffusivity Determination of Graphene Nanoplatelets by Photothermal Beam Deflection Spectrometry. Materials 2021, 14, 7273. [Google Scholar] [CrossRef]
  22. Devi, P.I.; Ramachandran, K. Dielectric Studies on Hybridised PVDF–ZnO Nanocomposites. J. Exp. Nanosci. 2011, 6, 281–293. [Google Scholar] [CrossRef]
  23. Sadeghifar, H.; Ragauskas, A. Lignin as a UV Light Blocker—A Review. Polymers 2020, 12, 1134. [Google Scholar] [CrossRef] [PubMed]
  24. Siesler, H.W. Fourier Transform Infrared (Ftir) Spectroscopy in Polymer Research. J. Mol. Struct. 1980, 59, 15–37. [Google Scholar] [CrossRef]
  25. Cai, X.; Lei, T.; Sun, D.; Lin, L. A Critical Analysis of the α, β and γ Phases in Poly(Vinylidene Fluoride) Using FTIR. RSC Adv. 2017, 7, 15382–15389. [Google Scholar] [CrossRef]
  26. Demina, T.S.; Birdibekova, A.V.; Svidchenko, E.A.; Ivanov, P.L.; Kuryanova, A.S.; Kurkin, T.S.; Khaibullin, Z.I.; Goncharuk, G.P.; Zharikova, T.M.; Bhuniya, S.; et al. Solid-State Synthesis of Water-Soluble Chitosan-g-Hydroxyethyl Cellulose Copolymers. Polymers 2020, 12, 611. [Google Scholar] [CrossRef] [PubMed]
  27. Lanceros-Méndez, S.; Mano, J.F.; Costa, A.M.; Schmidt, V.H. FTIR and DSC Studies of Mechanically Deformed β-PVDF Films. J. Macromol. Sci. Part B 2001, 40, 517–527. [Google Scholar] [CrossRef]
  28. Alharbi, N.D.; Guirguis, O.W. Macrostructure and Optical Studies of Hydroxypropyl Cellulose in Pure and Nano-Composites Forms. Results Phys. 2019, 15, 102637. [Google Scholar] [CrossRef]
  29. Jacob, M.M.; Arof, A. FTIR Studies of DMF Plasticized Polyvinyledene Fluoride Based Polymer Electrolytes. Electrochim. Acta 2000, 45, 1701–1706. [Google Scholar] [CrossRef]
  30. Ţucureanu, V.; Matei, A.; Avram, A.M. FTIR Spectroscopy for Carbon Family Study. Crit. Rev. Anal. Chem. 2016, 46, 502–520. [Google Scholar] [CrossRef] [PubMed]
  31. Medeiros, K.A.R.; Rangel, E.Q.; Sant’Anna, A.R.; Louzada, D.R.; Barbosa, C.R.H.; D’Almeida, J.R.M. Evaluation of the Electromechanical Behavior of Polyvinylidene Fluoride Used as a Component of Risers in the Offshore Oil Industry. Oil Gas Sci. Technol.—Rev. d’IFP Energies Nouv. 2018, 73, 48. [Google Scholar] [CrossRef]
  32. Kaspar, P.; Sobola, D.; Částková, K.; Knápek, A.; Burda, D.; Orudzhev, F.; Dallaev, R.; Tofel, P.; Trčka, T.; Grmela, L.; et al. Characterisation of Polyvinylidene Fluoride (PVDF) Electrospun Fibers Doped by Carbon Flakes. Polymers 2020, 12, 2766. [Google Scholar] [CrossRef]
  33. Swapna, M.S.; Sankararaman, S. Thermal Induced Order Fluctuations in Carbon Nanosystem with Carbon Nanotubes. Nano-Struct. Nano-Objects 2019, 19, 100375. [Google Scholar] [CrossRef]
  34. Bai, H.; Wang, X.; Zhou, Y.; Zhang, L. Preparation and Characterization of Poly(Vinylidene Fluoride) Composite Membranes Blended with Nano-Crystalline Cellulose. Prog. Nat. Sci. Mater. Int. 2012, 22, 250–257. [Google Scholar] [CrossRef]
  35. Chai, M.N.; Isa, M.I.N. The Oleic Acid Composition Effect on the Carboxymethyl Cellulose Based Biopolymer Electrolyte. J. Cryst. Process Technol. 2013, 3, 27263. [Google Scholar] [CrossRef]
  36. Abdelaziz, O.Y.; Hulteberg, C.P. Physicochemical Characterisation of Technical Lignins for Their Potential Valorisation. Waste Biomass Valorization 2017, 8, 859–869. [Google Scholar] [CrossRef]
  37. Alsubaie, A.S.A. Characterization and Optical Studies of Hydroxyethyl Cellulose-Copper Oxide Nanocomposites. J. Spectrosc. 2022, 2022, 8422803. [Google Scholar] [CrossRef]
  38. Touloukian, Y.S.; Powell, R.W.; Ho, C.Y.; Klemens, P.G. Thermophysical Properties of Matter-the TPRC Data Series. Volume 1. Thermal Conductivity-Metallic Elements and Alloys. (Reannouncement). Data Book; Thermophysical Properties Research Center, Purdue University: Lafayette, IN, USA, 1970. [Google Scholar]
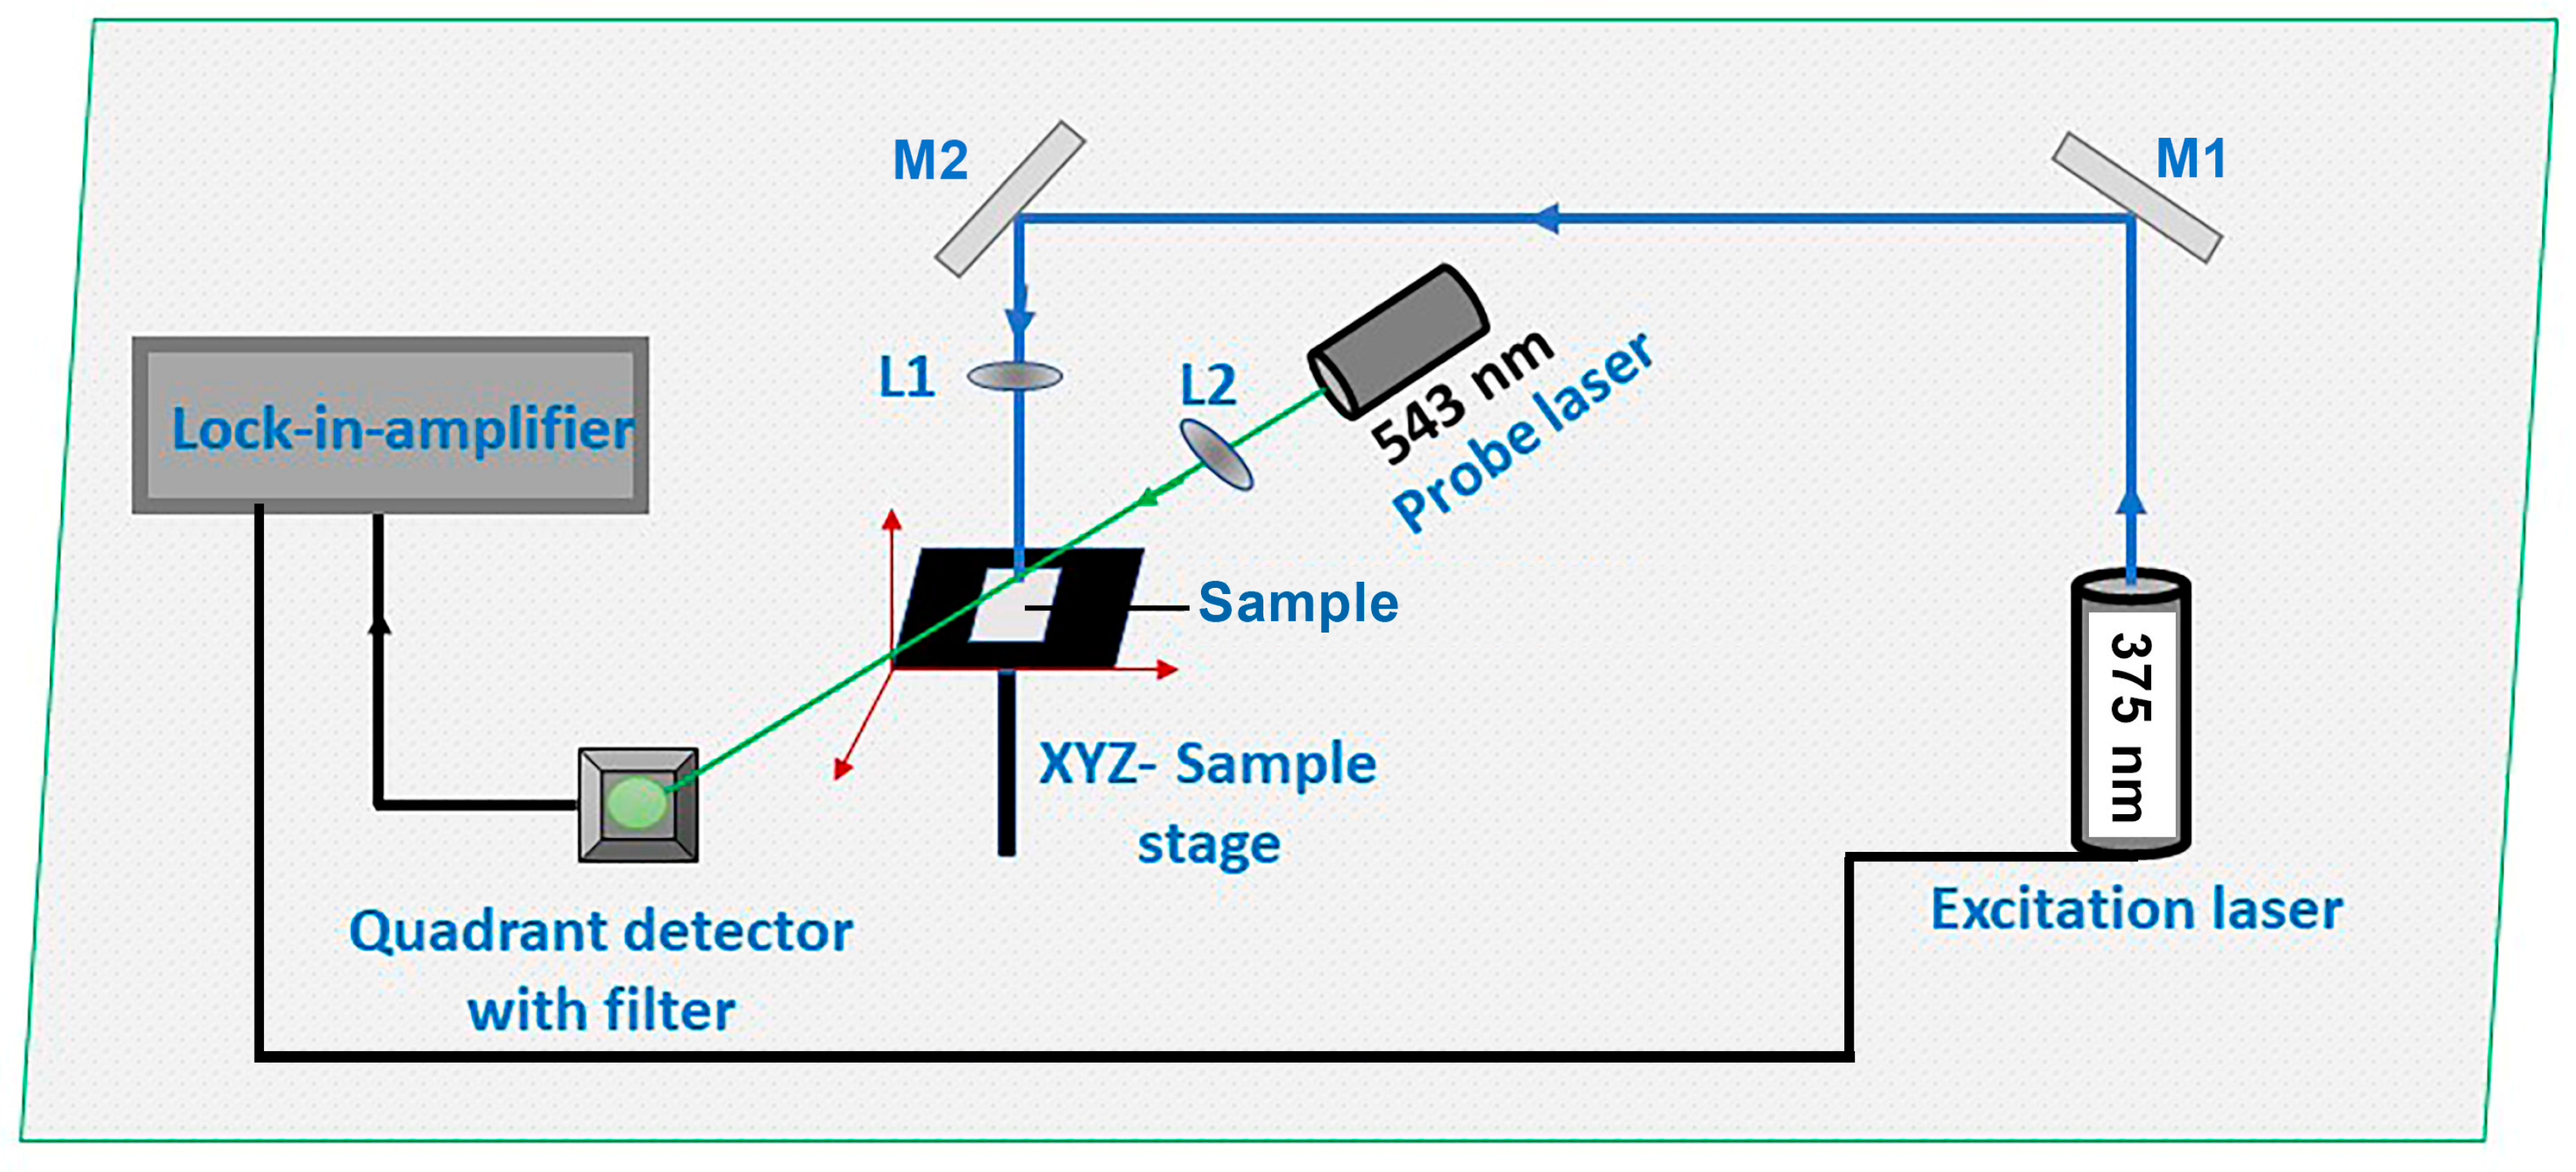
Figure 1. The BDS experimental setup [19].
Photonics 10 00942 g001
Figure 2. UV-visible absorption spectrum of PVDF—polyvinylidene fluoride, HC—hydroxyethyl cellulose, LG—Lignin, and CS—camphor soot (*—absorbance at 375 nm corresponding to excitation beam wavelength).
Photonics 10 00942 g002
Figure 3. FTIR spectrum of the samples: (a) HC—hydroxyethyl cellulose, PHC-(HC-PVDF) composite; (b) CS—camphor soot, PCS-(CS-PVDF) composite; (c) LG—Lignin, PLG-(LG-PVDF) composite; (d) PVDF—polyvinylidene fluoride.
Photonics 10 00942 g003
Figure 4. Structure of (a) HC—hydroxyethyl cellulose, (b) LG—Lignin, and (c) CS—camphor soot (adapted from Sigma Aldrich, St. Louis, MI, USA).
Photonics 10 00942 g004
Figure 5. FTIR spectrum of the samples in the region 4000–2500 cm−1 (PVDF—polyvinylidene fluoride, HC—hydroxyethyl cellulose, LG—Lignin, and CS—camphor soot, PHC-(HC-PVDF) composite, PCS-(CS-PVDF) composite, and PLG-(LG-PVDF) composite).
Photonics 10 00942 g005
Figure 6. Experimental (Exp) and fitted (a) BDS amplitude and (b) phase for PVDF—polyvinylidene fluoride, HC—hydroxyethyl cellulose, and PHC-(HC-PVDF) composite.
Photonics 10 00942 g006
Figure 7. Thermal diffusivity values of samples—PVDF—polyvinylidene fluoride (dotted blue line), HC-hydroxyethyl cellulose, LG—Lignin, and CS—camphor soot, PHC-(HC-PVDF) composite, PCS-(CS-PVDF) composite, and PLG-(LG-PVDF) composite.
Photonics 10 00942 g007
Figure 8. Optical microscopic image of (a) PVDF—polyvinylidene fluoride and (b) PHC-(Hydroxy cellulose-PVDF) composite and pixel intensity variations of (c) PVDF and (d) PHC along the yellow line.
Photonics 10 00942 g008
Disclaimer/Publisher’s Note: The statements, opinions and data contained in all publications are solely those of the individual author(s) and contributor(s) and not of MDPI and/or the editor(s). MDPI and/or the editor(s) disclaim responsibility for any injury to people or property resulting from any ideas, methods, instructions or products referred to in the content.