Communication

Prediction of Shock Wave Velocity Induced by a Combined Millisecond and Nanosecond Laser Based on Convolution Neural Network

1
Jilin Key Laboratory of Solid-State Laser Technology and Application, School of Physics, Changchun University of Science and Technology, Changchun 130022, China
2
School of Physics, Changchun University of Science and Technology, Changchun 130022, China
*
Author to whom correspondence should be addressed.
Photonics 2023, 10(9), 1034; https://doi.org/10.3390/photonics10091034
Submission received: 9 August 2023 / Revised: 3 September 2023 / Accepted: 7 September 2023 / Published: 9 September 2023
(This article belongs to the Special Issue Emerging Topics in High-Power Laser and Light–Matter Interactions)

Abstract

:
The variation of shock-wave velocity with time induced by a millisecond-nanosecond combined pulse laser (CPL) on silicon is investigated. The convolution neural network (CNN) is used to predict the shock-wave velocity induced by a single ns laser and CPL with a ns laser energy density of 6, 12 and 24 J/cm2, ms laser energy density of 0 and 226.13 J/cm2, and pulse delay of 0, 0.4 and 0.8 ms. The four-layer CNN model was applied, ns laser energy density, ms laser energy density, pulse delay and time were set as the input parameter, while the shock-wave velocity was set as the output parameter. The correlation coefficient (R2), mean absolute error (MAE) and root mean square error (RMSE) of the CNN model on the test data set was 0.9865, 3.54 and 3.01, respectively. This indicated that the CNN model shows a high reliability in the prediction of CPL-induced shock-wave velocity with limited experimental data.

1. Introduction

The aerospace field is developing extremely fast nowadays, and space debris are gradually increasing. The traditional method of space debris removal is mechanical capture, through which it is difficult to remove small space debris [1,2,3]. The shock wave generated on the target debris that are irradiated by a high-energy pulsed laser can effectively remove small space debris. When the target is irradiated by a pulsed laser, plasma is generated on the surface. After the laser stops irradiating, a shock wave is driven by extending plasma continuing to propagate [4,5,6]. From a macro perspective, this produces a certain recoil pressure on the target. Scholars from all over the world have mainly studied the short-pulse-laser-induced shock-wave pressure field [7,8,9,10]. For example, J. Radziejewskaa et al. studied the velocity and pressure of a shock wave produced by a nanosecond pulse laser with a wavelength of 1064 nm and pulse width of 12 ns, and they found a qualitative correlation between the shock-wave velocity and pressure: they found that the greater the shock-wave velocity, the greater the pressure [11]. Daniel J. and Frster D J et al. used a picosecond pulse laser with a 532 nm wavelength and 10 ps pulse width to irradiate copper. The thrust produced by single, double and triple pulse lasers was studied. It is found that the mass specific thrust produced by a double pulse laser is almost three times that of a single pulse laser. However, the mass specific thrust of a triple pulse laser is basically the same as that of a single pulse laser. This is mainly due to the ablation effect of the third pulse laser being obviously stronger than that of the double pulse laser [12]. Kiran P. P. et al. used two-dimensional emission and shadow imaging techniques to study the interaction between two plasmas and shock waves induced by nanosecond laser pulses with a wavelength of 532 nm and pulse width of 7 ns. The effects of the distance between the two plasma sources and their energy ratio on the evolution of the plasma and shock wave were provided. It was found that the shock wave produced by the high-energy plasma source propagated through the lower energy plasma and led to the generation of a plasma jet. With the increase of the energy ratio, the diameter of the plasma jet will increase [13].
With the increasing demand for propulsion efficiency through the use of shock-wave-induced recoil pressure, the method for obtaining shock-wave acceleration is very significant. However, the laser-crystal material damage threshold makes it impossible to increase laser energy infinitely to obtain an increment of shock-wave velocity. In recent years, scholars have gradually converted from single pulse lasers to CPLs to irradiate a target and produce plasma and shock waves [14,15,16,17,18]. The ms-ns CPL can not only improve the laser drilling efficiency [19,20,21], but it also induces the phenomenon of shock-wave acceleration [22]. For example, Yuan B.S. and Wang D. et al. used a combination of a millisecond laser and nanosecond laser with a wavelength of 1064 nm and pulse width of 1 ms and 10 ns, respectively, to irradiate aluminum alloy. It was found that the ablation depth produced by the combined pulse laser was nine times that of the single pulse laser [21]. Li J. and Zhang W. et al. used a combined pulse laser with a millisecond pulse laser and nanosecond pulse laser with different energy ratios and pulse delays to irradiate monocrystalline silicon, and the variation in the shock-wave velocity was studied. It was found that under the conditions of an appropriate energy ratio and pulse delay, the shock-wave velocity produced by the CPL was 1.1 times higher than that of the single nanosecond pulse laser [22]. Due to the large amount of CPL parameters, different parameters of CPL will lead to a change in shock-wave velocity, and it has nonlinear variation characteristics [23]. The existing shock-wave-velocity measurement methods are mainly off-line measurements. This is inefficient and makes it difficult to acquire the CPL parameters of the highest shock-wave velocity.
Nowadays, artificial intelligence deep-learning is developing rapidly. Scholars are committed to solving nonlinear problems in the laser-material interaction field, mainly focusing on the prediction of target properties after laser shock peening [24,25]. For instance, Jiajun Wu et al. uses an artificial neural network to predict the mechanical properties of titanium alloy after laser shock peening. The results show that the correlation index R2 of the test data set is 0.997 and 0.987 [26]. As for the prediction of laser-induced shock-wave velocity, it mainly focuses on the prediction of shock-wave velocity induced by a single pulse laser. For example, Matsui K et al. used the least square method to predict a laser-supported detonation wave velocity. It is indicated that the greater the laser energy density, the greater the laser-supported detonation wave velocity [27]. However, there is a nonlinear relationship between the multi-dimensional parameters of CPL and the shock-wave velocity. Moreover, there are few reports on the application of CNN to predicting CPL-induced shock-wave velocity.
With the aim of acquiring the laser parameters of the highest shock-wave velocity, the variation law of CPL-induced shock-wave velocity on silicon is studied. The CNN algorithm is used to predict the ns-laser- and CPL-induced shock-wave velocity. The ns laser energy density, the ms laser energy density, pulse delay and time are set as input parameters, and the shock-wave velocity is set as the output parameter. The mean impact value algorithm (MIV) is used to analyze the ranking importance of the input parameters’ effect on the shock-wave velocity. This work provides important guidance for using appropriate methods to predict shock-wave velocity under conditions of limited data. Moreover, it can also provide theoretical support for the application of laser space debris removal technology, and it is of great significance in ensuring the safe development of space activities.

2. Material and Method

2.1. Experiment

The laser-induced shock-wave experiment was performed on a combined pulse laser system, which consisted of a nanosecond pulse laser (ns laser) and a millisecond pulse laser (ms laser). The laser parameters are listed in Table 1; the ms laser beam and ns laser beam pass through lenses L1 ( f = 500   mm ) and L2 ( f = 500   mm ), respectively, and irradiate onto the same point of the target at a space angle of 5 degrees. In this paper, the shock-wave propagation process is monitored by the optical shadow method. The principle of the optical shadow method is to transform the density gradient change in the flow field into the relative light intensity. A 532 nm continuous laser is used as the background light source in order to be vertically incident to the generation area of the shock wave in front of the target through the beam expander. After passing lens L3 and attenuator film F1, the shock-wave image is recorded by a high-speed camera. The resolution of the high-speed camera is 384 × 160, the frame rate is 200,000 fps, and the exposure time is 1/6,300,000 s. The millisecond pulse laser energy was recorded in real time by using a Spectroscope S1 and an energy meter. The pulse delay of the two lasers is controlled by DG645 and monitored by an oscilloscope and two photodetectors PD1 and PD2 in real time. We defined the time interval when a nanosecond pulse laser lags behind a ms laser. The laser-induced shock-wave experiment setup in this work is shown in Figure 1.
The investigated target is N-doped (100) monocrystalline silicon, and the dimension of the experimental sample is 4 mm × 12.7 mm (thickness × radius). The experiment was carried out at 20 °C, under normal atmospheric pressure, in air. The shock wave velocity can be calculated from Equation (1):
v t = S t + τ S t τ ,
where S t is the maximum axial propagation distance of the shock wave at time t. τ is the time interval between the above two measurements.

2.2. CNN Model

The effects of the ms-ns CPL parameters, including the ns laser energy density, ms laser energy density, and pulse delay, on the shock-wave velocity were investigated. The CNN model is used to predict the CPL-induced shock-wave velocity. The CNN model structure is shown in Figure 2. The ns laser energy density, the ms laser energy density, pulse delay and time were set as the input, while the shock-wave velocity was set as the output. The experimental data induced by ms-ns CPL with D ns = 6   J / cm 2 and 24   J / cm 2 are selected as training sets, and the experimental data induced by ms-ns CPL with D ns = 12   J / cm 2 are set as testing sets. The input conditions are shown in Table 2. As a result, according to the characteristics of the data, the convolution layer is set to one layer. In order to ensure the data integrity of the shock-wave velocity, the pool layer is set to be removed. To avoid the loss of data feature in the convolution layer, set the edge zeroing operation. In order to comprehensively consider the training effect during the training process, the number of epochs is 2500, and the learning rate is 0.01. The specific convolution operation is shown in Formula (2):
x = i = 1 c w i , c x i + b i ,
where x i is the output of the ith channel in the input layer, c is the convolution layer channel, x is the convolution layer output, w i , c is the weight matrix of the convolutional kernel in the convolution layer, b i is the bias term, and is the convolution operation.
A batch normalization operation is added after the convolution layer to improve the performance and enhance the generalization ability of the network. The specific calculation process is shown in Formula (3):
x = γ x u B σ B 2 + ε + β ,
where x is the batch normalization result of the convolutional kernel output value. u B is the average of the input value. σ B 2   is the standard deviation of the input value. ε is a constant vector. γ and β denote scale factors and shift factors, respectively. Then, the activation function is used to transform its output characteristics nonlinearly and accelerate the model convergence, and the calculation process is shown in Formula (4):
R E L U x = max 0 , x ,
the full connection layer converts the features into one-dimensional feature vectors and extracts the features again, before finally outputting a predicted value. The operation is shown in Formula (5):
y = R E L U w T x + b ,
where w is the weight, y is the output of the fully connected layer, and b is the offset term. The CNN model performance was evaluated by the R 2 , R M S E and M A E . These indices are defined as follows [28,29]:
R 2 = 1 i = 1 n y i y i ^ 2 i = 1 n y i y ¯ 2 ,
R M S E = 1 n i = 1 n y i y i ^ 2 ,
M A E = 1 n i = 1 n y i y i ^ ,
where n is the number of predicted values, y represents the original experimental value, y i ^ defines the CNN predicted value, and y ¯ stands for the experimental mean value.

3. Results and Discussion

3.1. Experimental Shock-Wave Velocity

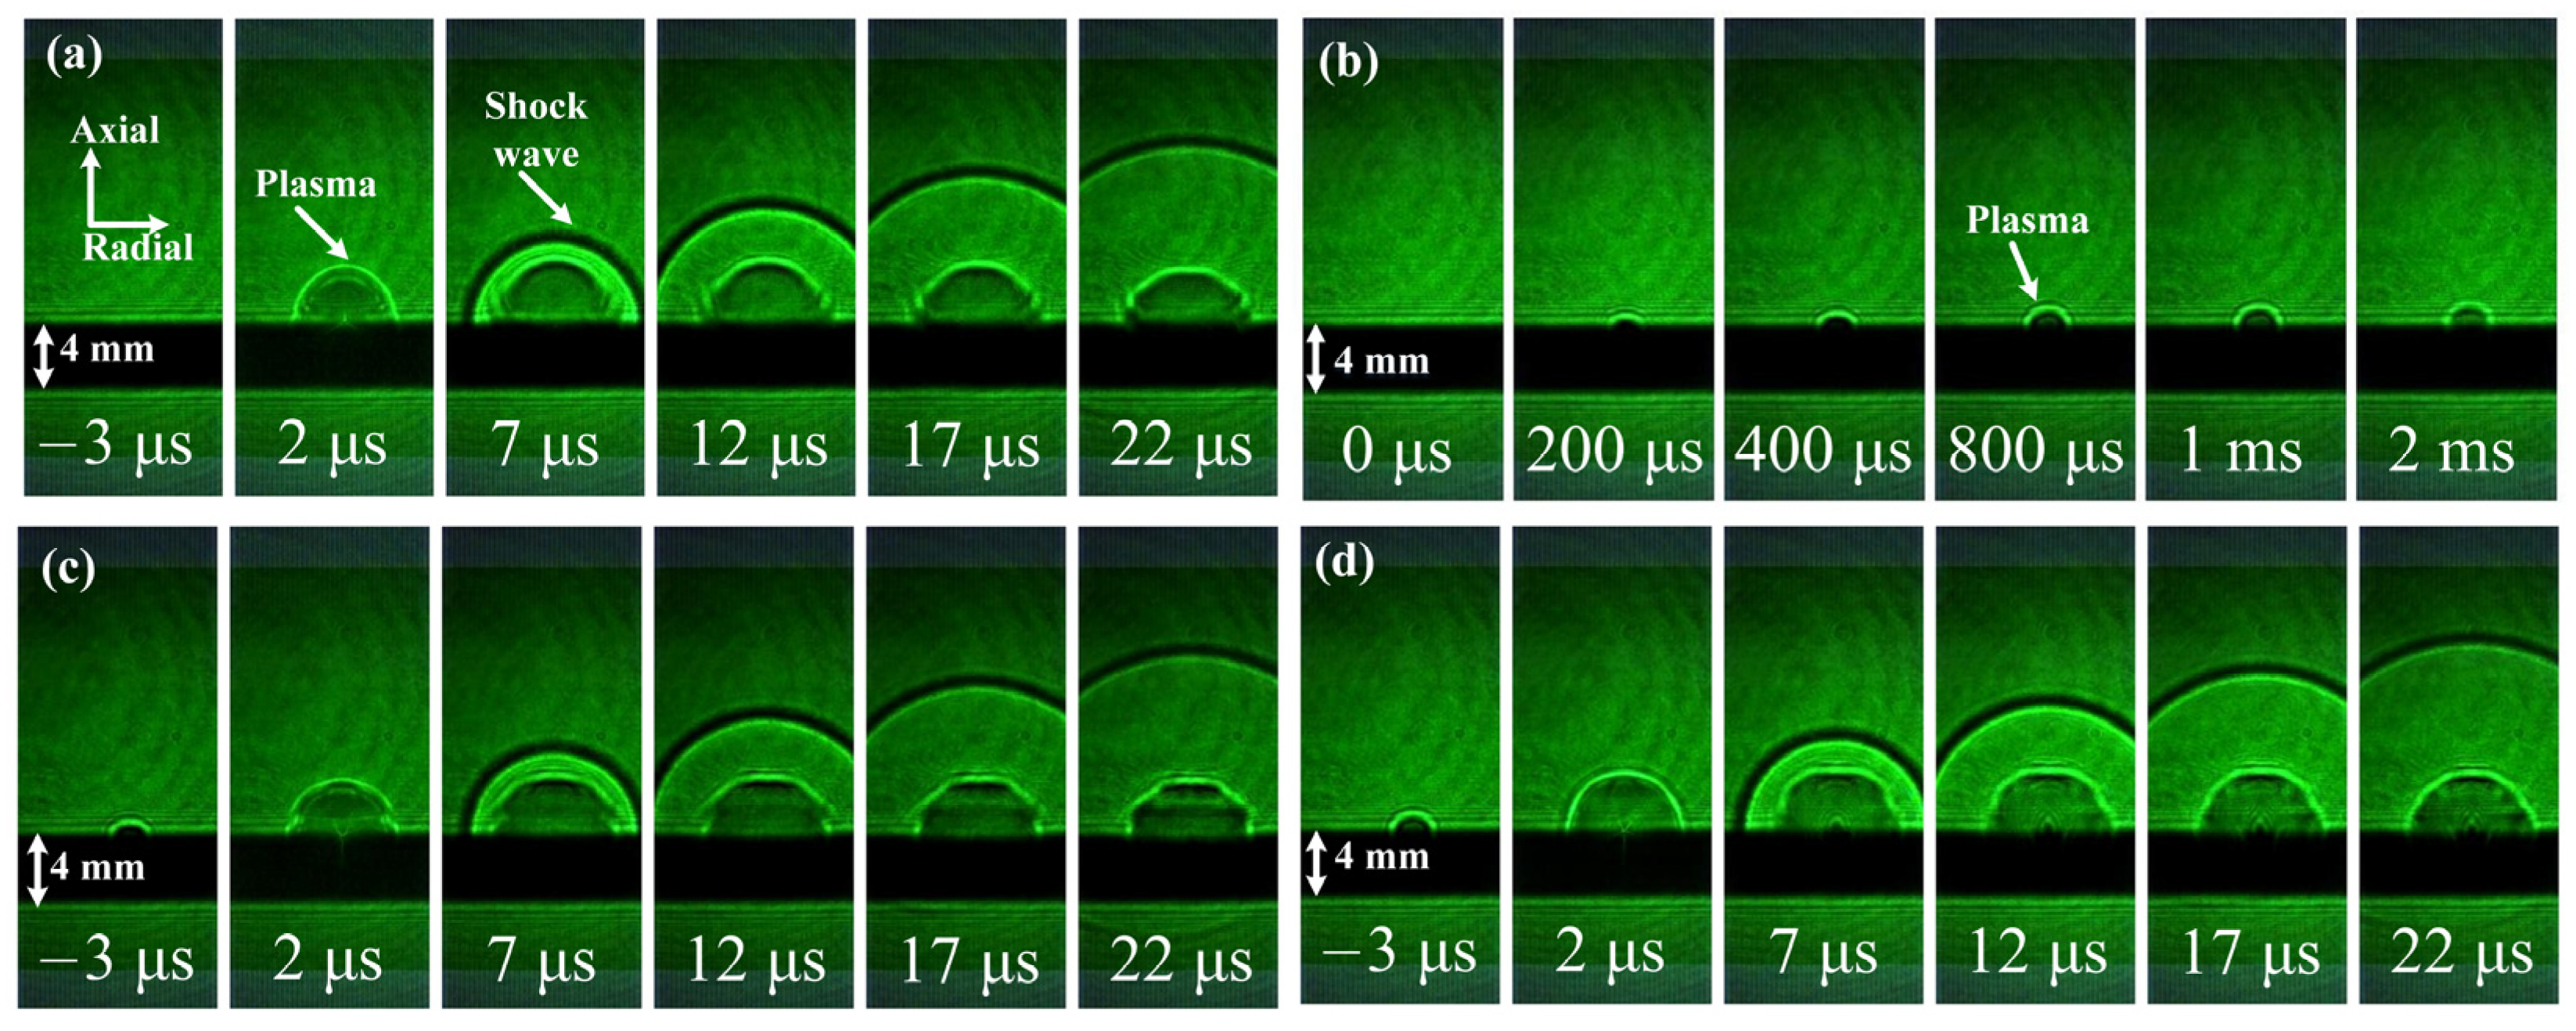
The shock-wave propagation morphology induced by the ns laser is shown in Figure 3a. The plasma plume is generated on the surface at 2 μs, the plasma stops expanding, and the shock wave propagates at 7 μs. The shock-wave propagation morphology induced by the ms laser is shown in Figure 3b. Compared with Figure 3a, the ms laser produces thin plasma on the surface, and the plasma expands very slowly. This is mainly because the ms laser belongs to the long pulse laser, and its peak power density is lower than that of the ns laser. In order to analyze the propagation morphology and velocity of the shock wave induced by CPL under different pulse delay conditions, the time when the ns laser begins to irradiate the target is defined as the time starting point. The shock-wave propagation morphology induced by the CPL with different pulse delays is shown in Figure 3c,d. It can be found that the ms laser first produces thin plasma on the target, after which a large amount of plasma overflows the surface while the ns laser irradiates the target. This is mainly due to the thermal accumulation effect of ms-laser-induced plasma, while the ns laser is mainly due to the ionization effect.
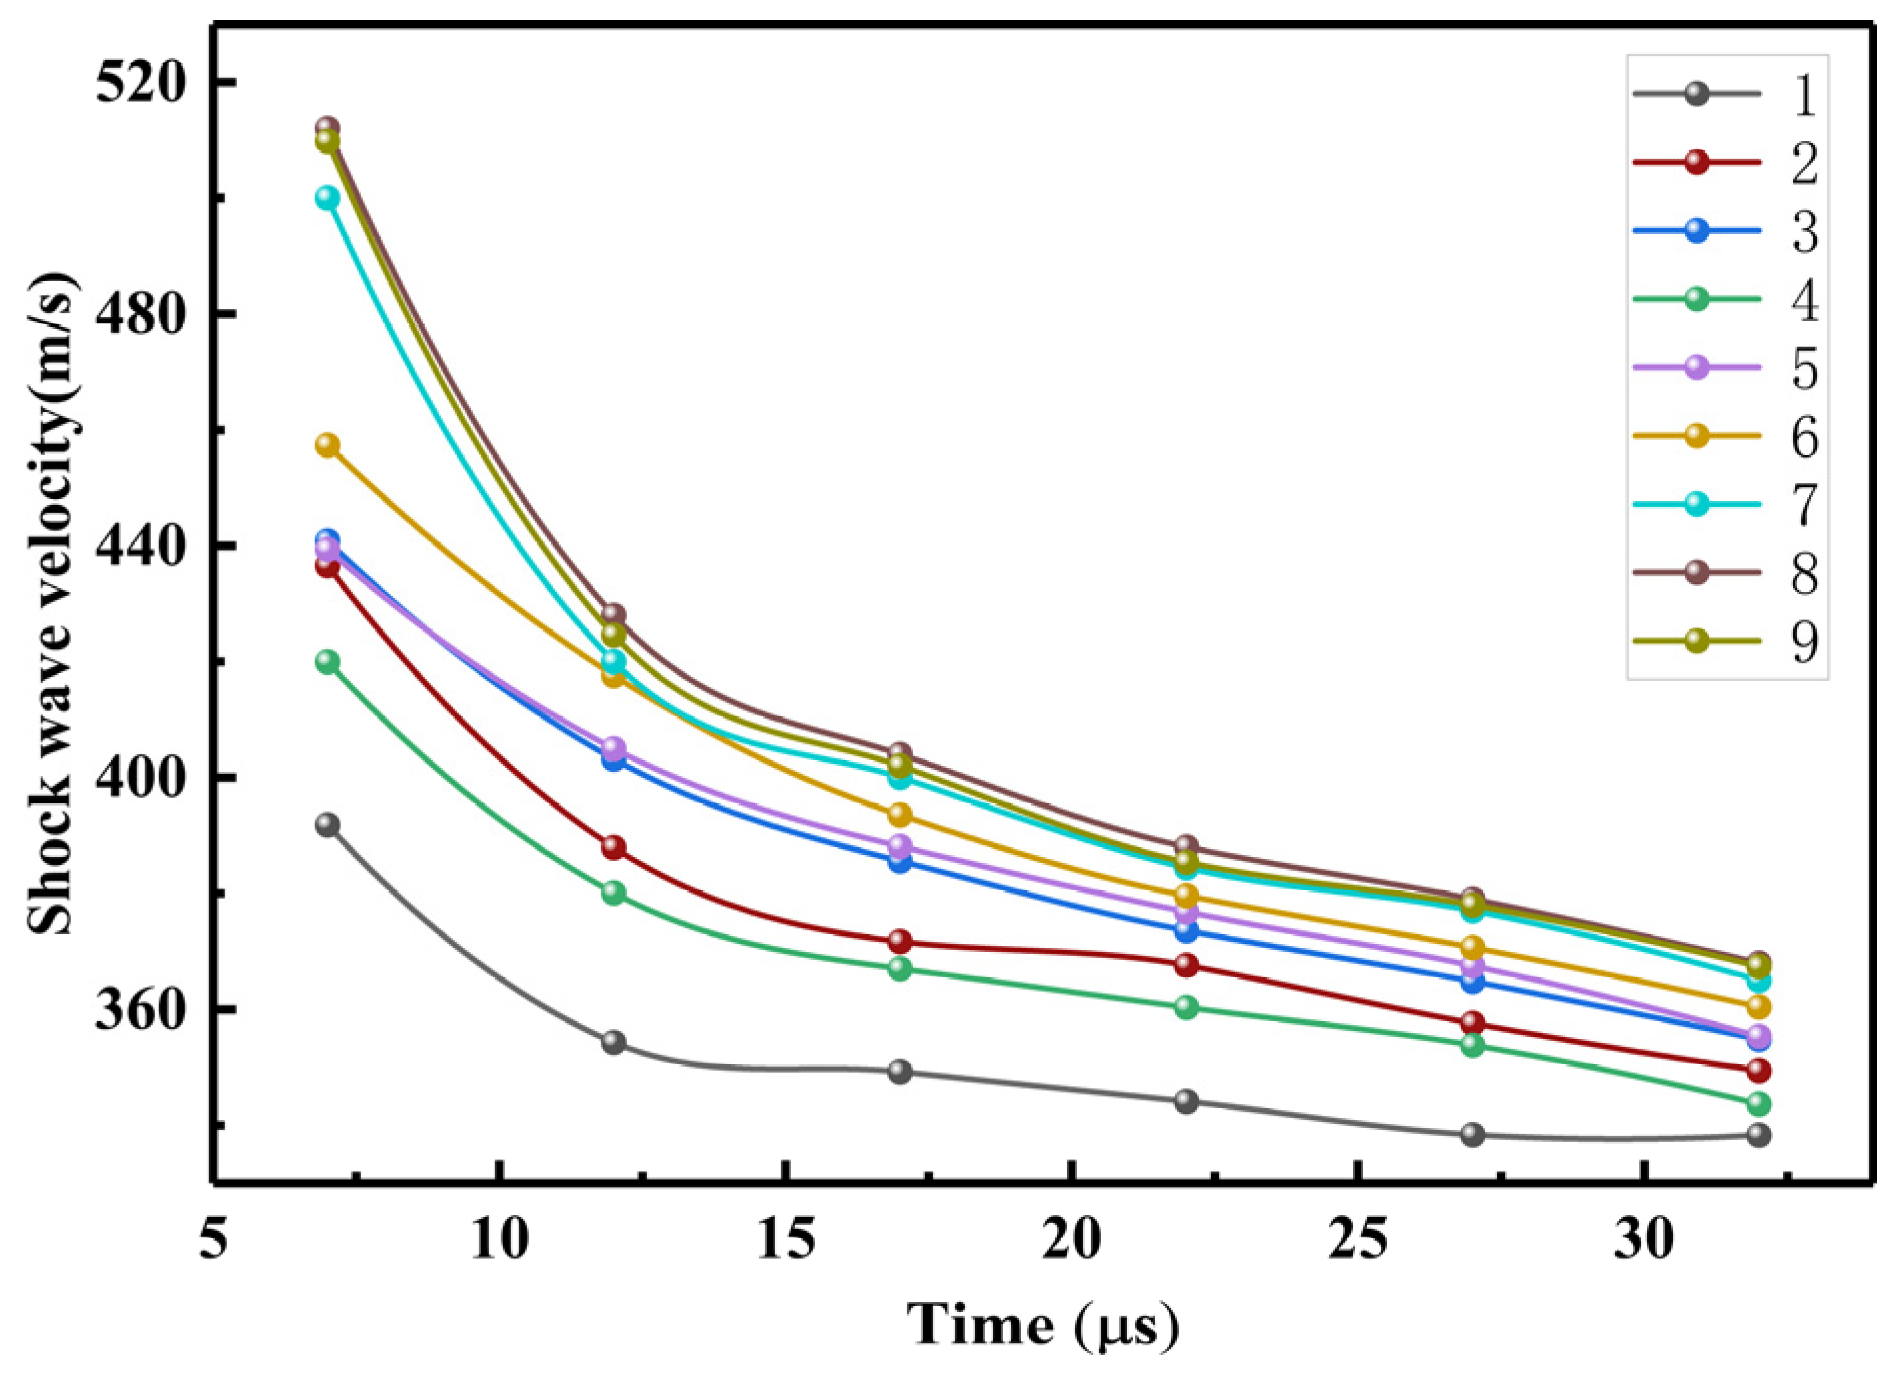
Figure 4 displays the experimental shock-wave velocity of the ns laser and CPL varying with time. The velocity of the shock wave decreases with time. The shock-wave velocity induced by ns laser with an energy density of 6 J/cm2 is the lowest among the above experimental conditions; the velocity reaches 391.8 m/s at 7 μs and decreases to 338 m/s at 32 μs. Under the condition of D ns = 6   J / cm 2 , the shock-wave velocity induced by the CPL with a pulse delay of 0.8 ms reaches the maximum. However, the shock-wave velocities induced by the CPL with pulse delays of 0.4 ms and 0.8 ms are close at 7 μs, and the difference in shock-wave velocities increases after 12 μs. Under the condition of D ns = 12   J / cm 2 , the shock-wave velocity induced by CPL with a pulse delay of 0.4 ms is the highest. The velocity reaches 457 m/s at 7 μs and decreases to 360 m/s at 32 μs. The shock-wave velocity induced by CPL with D ns = 24   J / cm 2 , D ms = 226.13   J / cm 2 , and a pulse delay of 0.4 ms is the highest; the velocity reaches 512 m/s at 7 μs and decreases to 368 m/s at 32 μs. We found that with the increase of the ns laser energy density, the pulse delay of the maximum shock-wave velocity changes from 0.8 ms to 0.4 ms. When the energy density of the ns laser is 6 J/cm2 and 12 J/cm2, the thermal ionization mechanism plays a leading role. The plasma induced by the ms laser does not absorb ns laser energy but provides initial free electrons for the plasma induced by the ns laser; the collision ionization probability of free electrons and silicon atoms is increased. Thus, the shock-wave velocity increases. Therefore, when the pulse delay is 0.8 ms, the shock-wave velocity reaches the maximum. When the energy density of the ns laser increases to 24 J/cm2, the ionization ability of the ns laser to the target becomes stronger. With the increase of the pulse delay, the plasma density induced by the ms laser increases. This will produce a combination effect of thermal ionization mechanism and reverse toughening absorption mechanism; that is, the ns laser energy is absorbed by both the plasma induced by the ms laser and the target. Moreover, the higher the plasma density induced by the ms laser, the more obvious the reverse toughening absorption mechanism. This leads to the decrease of the plasma expansion velocity induced by the thermal ionization mechanism of the ns laser. Therefore, the shock-wave velocity reaches the maximum value at 0.4 ms.
Figure 5 shows the CPL-induced shock-wave-velocity increment under the condition of different pulse delays and a ns laser energy density of 7 μs. The velocity increment is the difference between the CPL-induced shock-wave velocity and the ns-laser-induced shock-wave velocity. Compared with the shock-wave velocity induced by the ns laser, the CPL can induce shock-wave acceleration. This is mainly due to the fact that the ms-laser-induced plasma provides the initial electrons for the ns-laser-induced plasma, the density of free electrons increases, the probability of collision ionization between free electrons and silicon atoms increases, and the expansion velocity of ns-laser-induced plasma increases. Finally, this leads to the acceleration phenomenon of a shock wave. When D ns = 6   J / cm 2 , the CPL-induced shock-wave velocity increment reaches the maximum with pulse delays of 0.4 ms and 0.8 ms. However, when D ns = 24   J / cm 2 , the velocity increment of the shock wave induced by CPL is at a minimum, with pulse delays of 0.4 ms and 0.8 ms. Therefore, the larger the energy density of the ns laser, the smaller the CPL-induced shock-wave-velocity increment. This is mainly due to the fact that with the increase of ns laser energy, the plasma density and the number of steam atoms increase, while the free electrons in the plasma induced by the ms laser are limited. Therefore, the acceleration efficiency of collision ionization between free electrons and steam atoms decreases.

3.2. CNN Prediction for Shock-Wave Velocity

The experimental shock-wave velocity with Conditions 1 to 3 and Conditions 7 to 9 is set to the training set, and the experimental shock-wave velocity with Conditions 4 to 6 is set to the testing set. Figure 6a,b illustrate the comparison between the experimental and predicted shock-wave velocity, and the shock-wave velocity predicted by the CNN model corresponds well with the experimental shock-wave velocity. The CNN model can learn the shock-wave propagation velocity induced by CPL well and predict the variation of the shock-wave velocity with time under different conditions well. Therefore, the CNN model can accurately predict the shock-wave velocity induced by CPL in the case of limited data. The corrections of the training data and test data are shown in Figure 6c,d. The scattered points are all distributed near the guideline of the training and testing sets. The results show that the CNN model correctly predicts the shock-wave velocity induced by CPL.
The CNN model’s performance parameters on the training set and test set are listed in Table 3. The performance of the test set is the key factor to assess the CNN model’s performance. The R2 of the test data set is 0.9865, which is smaller than that of the training data set (0.9912), but it remains in great accordance with the experimental and predicted shock-wave velocity. The RMSE and MAE of the test data set are 3.54 and 3.01, respectively. The value of RMSE and MAE is relatively low, and the CNN model can accurately predict the shock-wave velocity. Therefore, the CNN can be used in the prediction of CPL-induced shock-wave velocity.
In addition to the prediction of the shock-wave velocity, we also use the MIV algorithm to obtain the importance of network input parameters to the predicted value, which is shown in Figure 7. The ranking importance for predicting laser shock-wave velocity is ns laser energy > time > ms laser energy > pulse delay. Due to the fact that the greater the velocity of the shock wave, the greater the pressure on the surface, in order to obtain a higher shock-wave velocity, we should give priority to ns laser energy, followed by ms laser energy, and finally pulse delay.

4. Conclusions

In this paper, the variation of shock-wave velocity with time via ms-ns CPL is studied, and the prediction model of shock-wave velocity is established based on CNN. The ns laser energy density, ms laser energy density, pulse delay and time are input parameters, while the shock-wave velocity is the output parameter. Finally, the MIV algorithm is used to analyze the importance of network input parameters to the predicted value. The following are the primary conclusions:
(1)
Compared with the single ns laser, the CPL can induce shock-wave acceleration. Furthermore, the CPL-induced shock-wave velocity increment is inversely proportional to the energy density of the ns laser.
(2)
The predicted shock-wave velocity obtained by the CNN model fits well with the experimental value. The R2, RMSE and MAE of the CNN model on the test data set are 0.9865, 3.54 and 3.01, respectively. It is indicated that the CNN model has a high reliability for predicting the shock-wave velocity.
(3)
In order to obtain a higher shock-wave velocity, the ranking importance of the input parameters’ effect on the shock-wave velocity is: ns laser energy > ms laser energy > pulse delay. This provides a theoretical basis when setting ms-ns CPL parameters with a higher shock-wave velocity.

Author Contributions

Writing—Review & Editing, J.L.; Methodology, W.Z.; Conceptualization, G.J. and Y.L. All authors have read and agreed to the published version of the manuscript.

Funding

This work was supported by the National Natural Science Foundation of China (Grant No. U19A2077), Jilin Provincial Education Department Project (No. JJKH20230796KJ) and Changchun Science and Technology Development Plan Project (No. 21ZY34).

Institutional Review Board Statement

Not applicable.

Informed Consent Statement

Not applicable.

Data Availability Statement

Not applicable.

Acknowledgments

We are grateful to the Jilin Key Laboratory of Solid-State Laser Technology and Application for providing us with a scientific research guarantee.

Conflicts of Interest

The authors declare no conflict of interest.

References

  1. Phipps, C.R.; Baker, K.L.; Libby, S.B.; Liedahl, D.A.; Olivier, S.S.; Pleasance, L.D.; Rubenchik, A.; Trebes, J.E.; George, E.V.; Marcovici, B.; et al. Removing orbital debris with lasers. Adv. Space Res. 2012, 49, 1283–1300. [Google Scholar] [CrossRef]
  2. Shen, S.; Jin, X.; Hao, C. Cleaning space debris with a space-based laser system. Chin. J. Aeronaut. 2014, 27, 805–811. [Google Scholar] [CrossRef]
  3. Nishida, S.I.; Kawamoto, S.; Okawa, Y.; Terui, F.; Kitamura, S. Space debris removal system using a small satellite. Acta Astronaut. 2009, 65, 95–102. [Google Scholar] [CrossRef]
  4. Pasley, J.; Bush, I.A.; Robinson, A.P.; Rajeev, P.P.; Mondal, S.; Lad, A.D.; Ahmed, S.; Narayanan, V.; Kumar, G.R.; Kingham, R.J. Generation of shock waves in dense plasmas by high-intensity laser pulses. Nukleonika 2015, 60, 193–198. [Google Scholar] [CrossRef]
  5. Garbaruk, A.V.; Gritskevich, M.S.; Kalmykov, S.G.; Sasin, M.E. Computational simulation of laser plasma emission with shock-wave-affected density distribution in the gas-jet target. Technol. Phys. Lett. 2016, 42, 993–996. [Google Scholar] [CrossRef]
  6. Ukai, T.; Kontis, K.; Yang, L. Flow structure generated by laser-induced blast wave propagation through the boundary layer of a flat plate. Aerosp. Sci. Technol. 2018, 78, 569–573. [Google Scholar] [CrossRef]
  7. Yoh, J.J.; Lee, H.; Choi, J.; Lee, K.; Kim, K. Ablation-induced explosion of metal using a high-power Nd: YAG laser. J. Appl. Phys. 2008, 103, 043511. [Google Scholar] [CrossRef]
  8. Gregorčič, P.; Možina, J. High-speed two-frame shadowgraphy for velocity measurements of laser-induced plasma and shockwave evolution. Opt. Lett. 2011, 36, 2782. [Google Scholar] [CrossRef]
  9. Cao, S.; Su, M.; Min, Q.; Sun, D.; Ma, P.; Wang, K.; Jiao, Z.; Dong, C. Dynamics and density distribution of laser-produced Al plasmas using optical interferometry and optical emission spectroscopy. J. Quant. Spectrosc. Radiat. Transf. 2019, 225, 69–75. [Google Scholar] [CrossRef]
  10. Kraft, S.; Schille, J.; Mauersberger, S.; Schneider, L.; Loeschner, U. Pump-probe imaging for process control and optimization in high-speed laser micro machining. In Proceedings of the Laser-based Micro- and Nanoprocessing XIV, San Francisco, CA, USA, 12 March 2020. [Google Scholar]
  11. Radziejewska, J.; Strzelec, M.; Ostrowski, R.; Sarzyński, A. Experimental investigation of shock wave pressure induced by a ns laser pulse under varying confined regimes. Opt. Laser. Eng. 2020, 126, 105913. [Google Scholar] [CrossRef]
  12. Frster, D.J.; Faas, S.; Weber, R.; Thomas, G. Thrust enhancement and propellant conservation for laser propulsion using ultra-short double pulses. Appl. Surf. Sci. 2020, 510, 145391. [Google Scholar] [CrossRef]
  13. Guthikonda, N.; Manikanta, E.; Chelikani, L.; Shiva, S.S.; Harsha, S.S.; Ikkurthi, V.R.; Kiran, P.P. Interaction of two counterpropagating laser induced plasmas and shock waves in air. Phy. Plasma. 2020, 27, 023107. [Google Scholar] [CrossRef]
  14. Cao, S.; Su, M.; Ma, P.; Wang, K.; Dong, C. Expansion dynamics and emission characteristics of nanosecond–picosecond collinear double pulse laser-induced Al plasma in air. J. Quant. Spectrosc. Radiat. Transf. 2019, 242, 106773. [Google Scholar] [CrossRef]
  15. Cao, S.; Su, M.; Liu, J.; Min, Q.; Dong, C. Expansion dynamics and compression layer in collinear double-pulse laser produced plasmas in a vacuum. Phys. Plasmas 2020, 27, 052101. [Google Scholar] [CrossRef]
  16. Smijesh, N.; Rao, K.H.; Chetty, D.; Litvinyuk, I.V.; Sang, R.T. Plasma plumes produced by laser ablation of Al with single and double pulse schemes. Opt. Lett. 2017, 43, 6081–6084. [Google Scholar] [CrossRef] [PubMed]
  17. Wang, Q.; Qi, H.; Zeng, X.; Chen, A.; Gao, X.; Jin, M. Time-resolved spectroscopy of collinear femtosecond and nanosecond dual-pulse laser-induced Cu plasmas. Plasma Sci. Technol. 2021, 23, 121–127. [Google Scholar] [CrossRef]
  18. Jia, X.; Chen, Y.; Zhu, G.; Wang, H.; Zhu, X. Experimental study on the optimum matching of CW-nanosecond combined pulse laser drilling. Appl. Opt. 2019, 58, 9105. [Google Scholar] [CrossRef]
  19. Pan, Y.; Lv, X.; Zhang, H.; Chen, J.; Han, B.; Shen, Z.; Lu, J.; Ni, X. Millisecond laser machining of transparent materials assisted by a nanosecond laser with different delays. Opt. Lett. 2016, 41, 2807–2810. [Google Scholar] [CrossRef]
  20. Yuan, B.; Zhang, Y.; Zhang, W.; Dong, Y.; Jin, G. The Effect of Spot Size Combination Mode on Ablation Morphology of Aluminum Alloy by Millisecond-Nanosecond Combined-Pulse Laser. Materials 2018, 11, 1419. [Google Scholar] [CrossRef]
  21. Yuan, B.S.; Wang, D.; Dong, Y.; Zhang, W.; Jin, G.Y. Experimental study of the morphological evolution of the millisecond–nanosecond combined-pulse laser ablation of aluminum alloy. Appl. Opt. 2018, 57, 5743–5748. [Google Scholar] [CrossRef]
  22. Li, J.; Zhang, W.; Zhou, Y.; Yuan, B.; Cai, J.; Jin, G. The acceleration mechanism of shock wave induced by millisecond-nanosecond combined-pulse laser on silicon. Plasma Sci. Technol. 2021, 23, 055507. [Google Scholar] [CrossRef]
  23. Li, J.; Zhang, W.; Li, Y.; Jin, G. The Acceleration Phenomenon of Shock Wave Induced by Nanosecond Laser Irradiating Silicon Assisted by Millisecond Laser. Photonics 2023, 10, 260. [Google Scholar] [CrossRef]
  24. Wu, J.; Li, Y.; Jibin, Z.; Qiao, H.; Yang, Y. Prediction of residual stress induced by laser shock processing based on artificial neural networks for FGH4095 superalloy. Mater. Lett. 2021, 286, 129269. [Google Scholar] [CrossRef]
  25. Wu, J.; Xu, Z.; Qiao, H.; Zhao, J.; Huang, Z. Mechanical properties prediction of superalloy FGH4095 treated by laser shock processing based on machine learning. Mater. Lett. 2021, 297, 129970. [Google Scholar] [CrossRef]
  26. Wu, J.; Huang, Z.; Qiao, H.; Zhao, Y.; Li, J.; Zhao, J. Artificial neural network approach for mechanical properties prediction of TC4 titanium alloy treated by laser shock processing. Opt. Laser Technol. 2021, 143, 107385. [Google Scholar] [CrossRef]
  27. Matsui, K.; Shimano, T.; Ofosu, J.A.; Komurasaki, K.; Schoenherr, T.; Koizumi, H. Accurate propagation velocity measurement of laser supported detonation waves. Vacuum 2016, 136, 171–176. [Google Scholar] [CrossRef]
  28. András, F.; György, C.; András, H. A Convolutional Neural Network with a Wave-Based Convolver. Electronics 2023, 12, 1126. [Google Scholar]
  29. Xing, J.; Xu, J. An Improved Convolutional Neural Network for Recognition of Incipient Faults. IEEE Sens. J. 2022, 22, 16314–16322. [Google Scholar] [CrossRef]
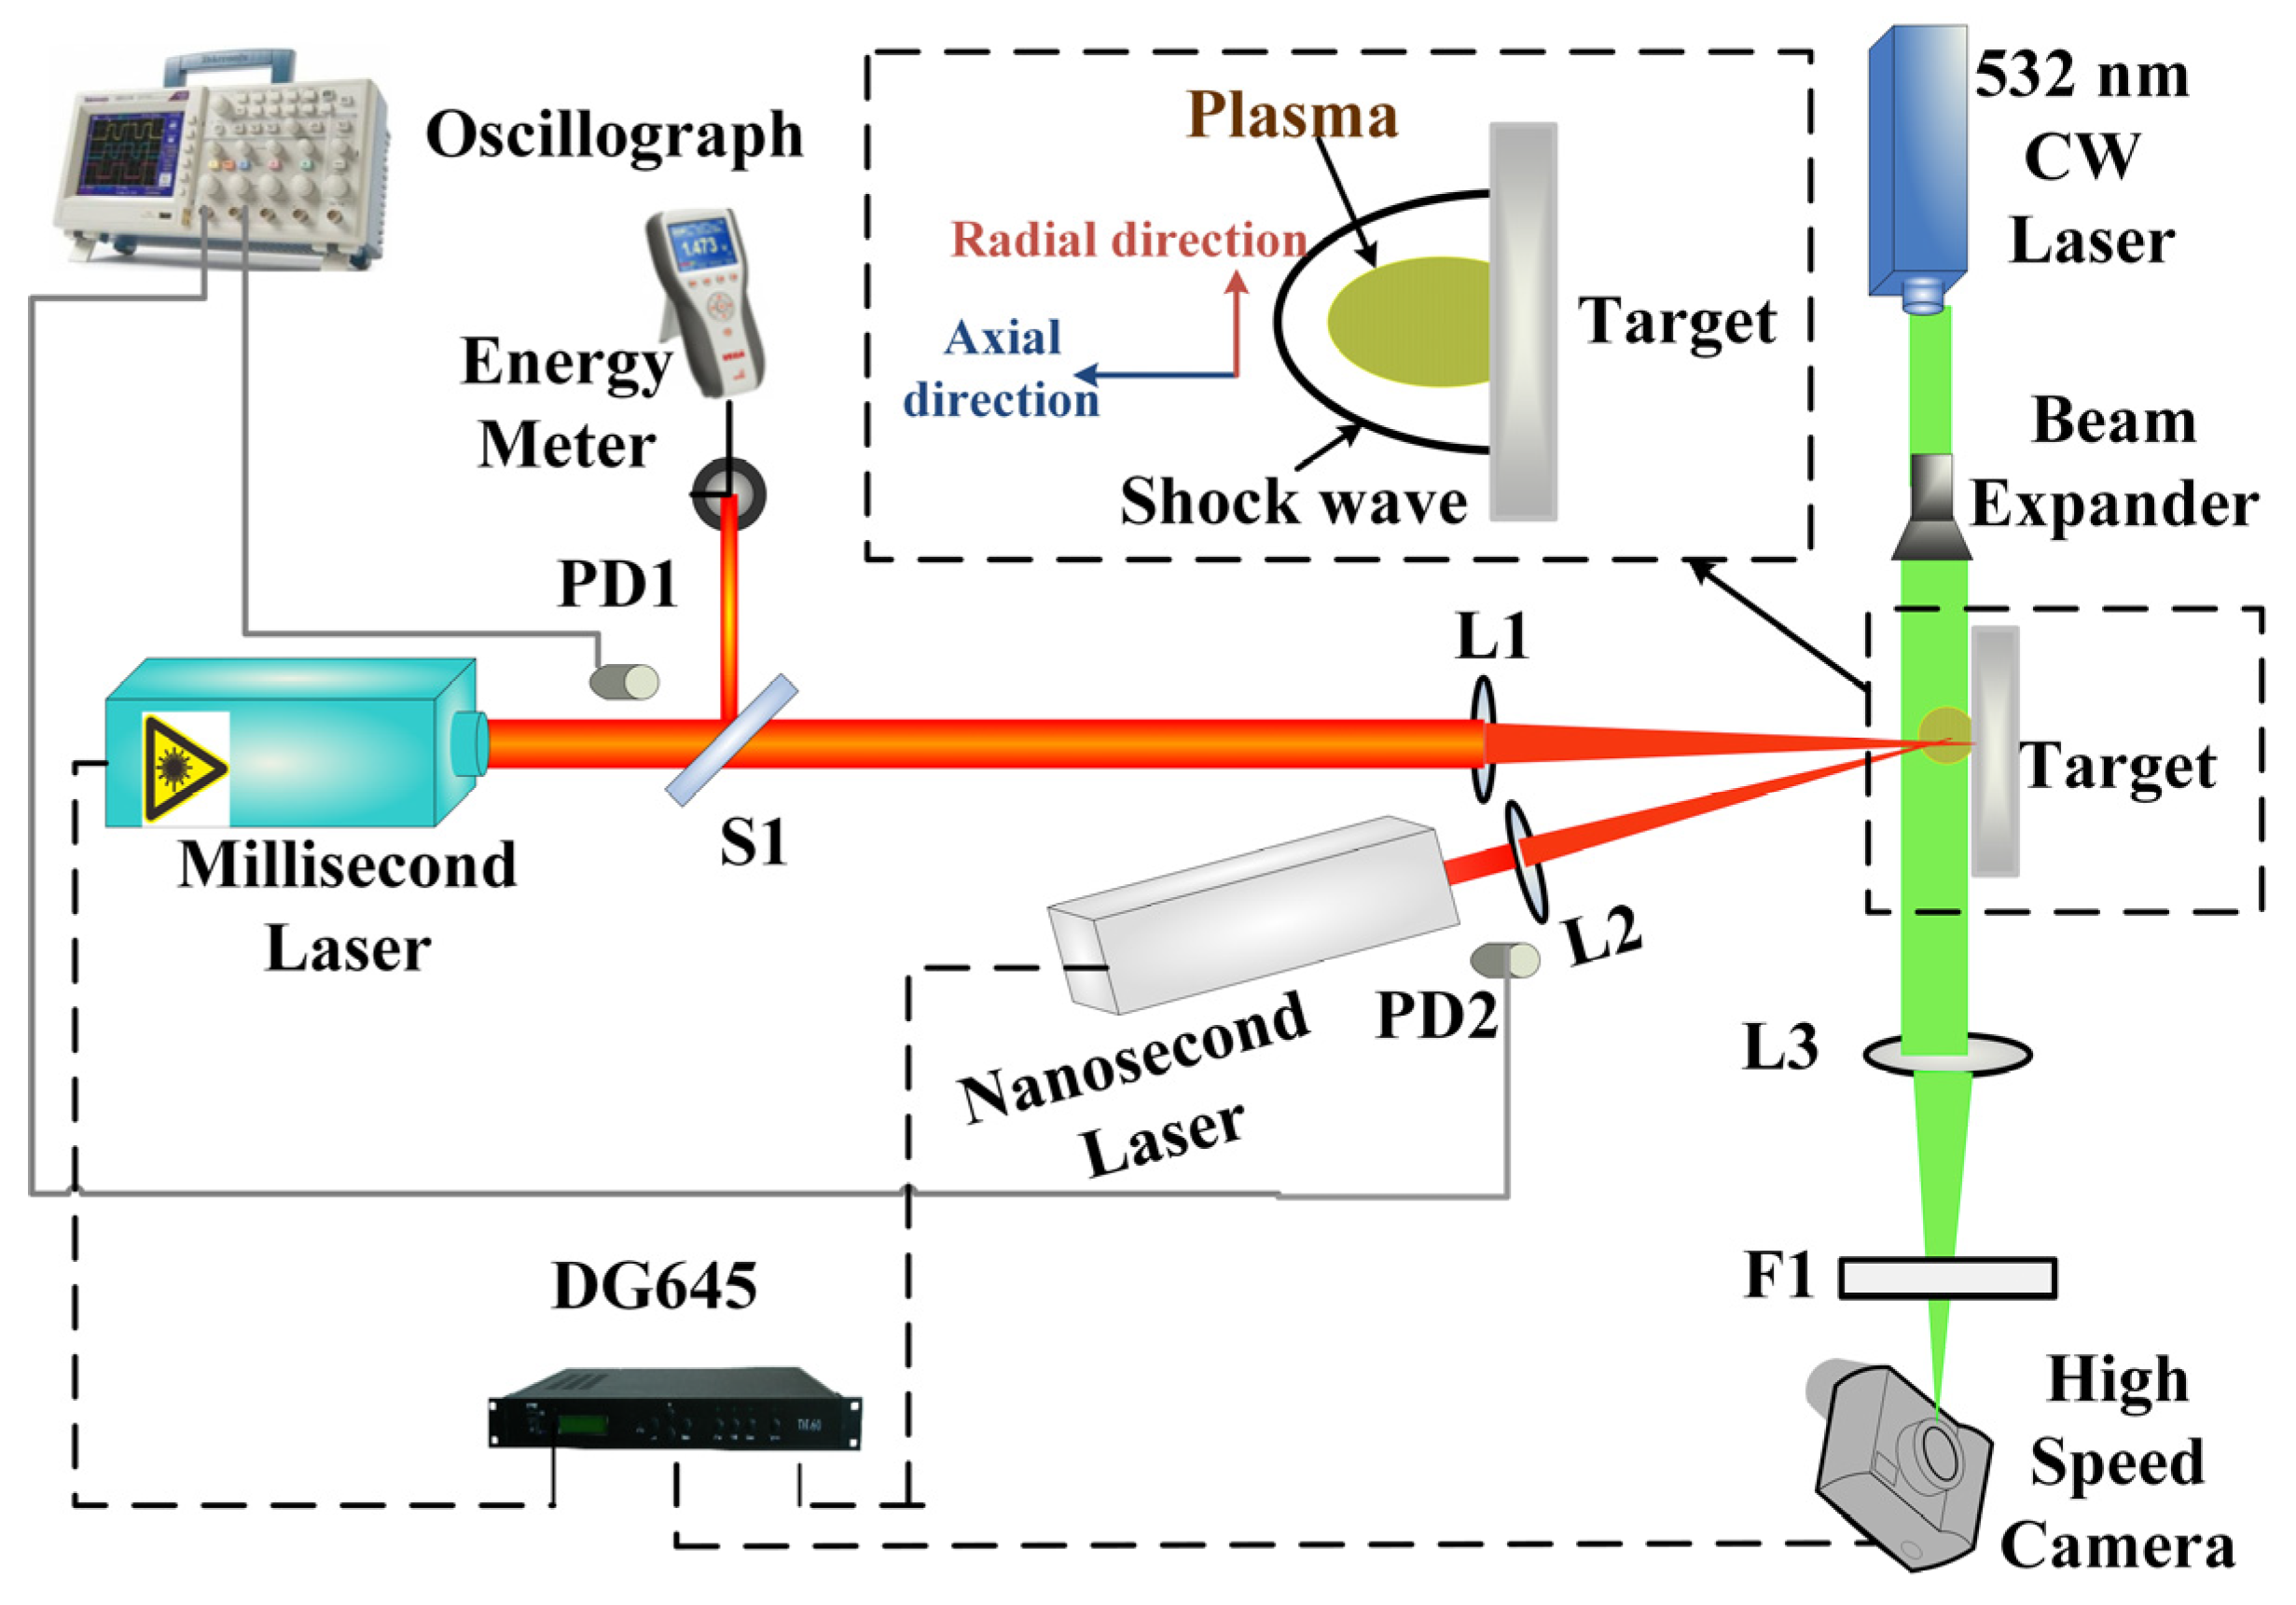
Figure 1. The CPL-induced shock-wave experimental setup.
Photonics 10 01034 g001
Figure 2. Schematic of CNN structure.
Photonics 10 01034 g002
Figure 3. The shock-wave propagation morphology induced by (a) ns laser, (b) ms laser and ms-ns CPL with pulse delays of (c) 0.4 ms and (d) 0.8 ms, with D ns = 12   J / cm 2 , D ms = 226.13   J / cm 2 .
Photonics 10 01034 g003
Figure 4. The variation trend of shock-wave velocity with time.
Photonics 10 01034 g004
Figure 5. The shock-wave-velocity increment of the CPL relative to the ns laser.
Photonics 10 01034 g005
Figure 6. The CNN model results: (a) Comparison between experiment and prediction of shock-wave velocity on training data set, (b) comparison between experiment and prediction of shock-wave velocity on test data set, (c) correlation of the training data set, and (d) correlation of the test data set.
Photonics 10 01034 g006
Figure 7. Ranking importance of input parameters.
Photonics 10 01034 g007
Table 1. The laser parameters.
Laser ParametersValue
Laser wavelength1064 nm
Pulse width for ms laser1 ms
Pulse width for ns laser10 ns
Spot diameter for ms laser1.3 mm
Spot diameter for ns laser1 mm
Energy density of ms laser226.13 J/cm2
Energy density of ns laser6, 12 and 24 J/cm2
Repetition rate1 Hz
Table 2. The input conditions for CNN.
Condition
Number
ns Laser Energy Density Dns (J/cm2)ms Laser Energy Density Dms (J/cm2)Pulse Delay Δt
(ms)
1600
26226.130.4
36226.130.8
41200
512226.130.4
612226.130.8
72400
824226.130.4
924226.130.8
Table 3. The CNN model’s performance parameters.
Training DataTest Data
R2RMSEMAER2RMSEMAE
0.99124.183.270.98653.543.01
Disclaimer/Publisher’s Note: The statements, opinions and data contained in all publications are solely those of the individual author(s) and contributor(s) and not of MDPI and/or the editor(s). MDPI and/or the editor(s) disclaim responsibility for any injury to people or property resulting from any ideas, methods, instructions or products referred to in the content.