Article

Designing a Long Optical Path Direct-Injection-Integrated Cavity for Laser Absorption Spectroscopy

1
Changchun Institute of Optics, Fine Mechanics and Physics, Chinese Academy of Sciences, Changchun 130033, China
2
University of Chinese Academy of Sciences, Beijing 100049, China
*
Author to whom correspondence should be addressed.
Photonics 2024, 11(1), 36; https://doi.org/10.3390/photonics11010036
Submission received: 8 November 2023 / Revised: 14 December 2023 / Accepted: 21 December 2023 / Published: 30 December 2023
(This article belongs to the Section Lasers, Light Sources and Sensors)

Abstract

:
Trace gas measurement has a wide range of applications needed in industrial, medical, and environmental protection. With the evolution of time, the demand for real-time, sensitivity, and accuracy of gas detection has been increasingly heightened. Off-axis integrated cavity output spectroscopy (OA-ICOS) is an effective method for the high-sensitivity detection of trace gases. It uses an integrated cavity with two highly reflective mirrors to provide a long optical path, which guarantees its high sensitivity. However, as the reflectivity of the mirrors increases, the intensity of the output light decreases, and the signal-to-noise ratio decreases. This contradiction makes it difficult to achieve a long optical path and a high signal-to-noise ratio together. To combat this issue, this paper proposes a type of integrated cavity using a direct-injection method. This structure, under equivalent mirror conditions, can maintain an effective absorption optical path very close to the original off-axis integrated cavity while increasing the output light intensity hundreds of times. This enhancement increases the sensitivity of OA-ICOS.

1. Introduction

Off-axis integrated cavity output spectroscopy (OA-ICOS) [1,2] is a commonly used method for the high-precision detection of trace gases. The detection of trace gases has become significantly more efficient with this advanced technology, which has found applications in a variety of fields, including environmental science [3,4,5,6], industrial production [7,8,9,10,11,12], and medical diagnosis [13,14,15]. Its ability to resist electromagnetic interference, as well as its exceptional selectivity, sensitivity, and in situ measurement capabilities, have made it a highly sought-after technology in recent times.
OA-ICOS breaks the mode matching via off-axis incidence so that the laser of each band can pass through the optical cavity evenly [16]. The noise caused by cavity mode fluctuation is effectively suppressed [2,17]. However, the energy in the high-energy fundamental modes is amortized over the dense higher-order modes. This results in a significant reduction in output signal strength, which puts a high requirement on laser power and detection sensitivity. In cases where the laser power is insufficient or the reflectivity of the cavity mirror is too high, the signal-to-noise ratio of the OA-ICOS device is reduced, and the output signal may not be obtained. This creates a contradiction in the high-precision integrating cavity output spectroscopy technique, where achieving both high sensitivity and high SNR is difficult.
OA-ICOS was invented for a longer effective absorption optical path and improved for a higher signal-to-noise ratio. In 1998, O’Keefe A. came up with the integrated cavity output spectroscopy technology [1]. The integrated cavity uses two high reflectivity mirrors to allow the light rays to continuously reflect until it is exhausted, achieving the purpose of extending the absorption optical path. In 2001, Paul J.B. et al. first proposed an off-axis incident design and successfully used it to detect O2 [18]. Compared with coaxial incidence, off-axis incidence is less affected by resonance effects, has stronger anti-interference, and is easier to adjust. The off-axis-integrated cavity has an extremely long effective absorption optical path, but the overly weak output signal brings difficulty to detection. To resolve the contradiction between the long optical path and signal strength, practitioners have conducted in-depth research on improving the system’s signal-to-noise ratio. An improvement in the optical structure was completed. In 2014, Leen et al. first proposed the concept of re-entrance, using an additional mirror to build a multi-pass cell-like structure in front of the integrated cavity, enhancing the output signal by 22 times and improving the signal-to-noise ratio by 10 times [19]. The wavelength modulation also greatly improves OA-ICOS. In 2017, Tao Wu et al. combined wavelength modulation technology with off-axis-integrated cavity output spectroscopy technology [20]. This method improved the signal-to-noise ratio by suppressing system noise and successfully detected CH4, improving the system’s sensitivity by 21 times compared to OA-ICOS.
In an integrated cavity consisting of two highly reflective mirrors, it can be seen that the greatest loss of laser energy occurs when the laser enters the integrated cavity, which greatly reduces the output energy. The off-axis incidence characteristic of OA-ICOS makes it possible to introduce a laser without passing through a highly reflective surface.
This paper designs a series of direct-injection long optical path gas absorption cells based on the off-axis integrated cavity. It overcame the problem of the low output light intensity caused by coupling into the cavity from a high-reflectivity surface, effectively improving the system’s sensitivity. The measurement principles and design methods of this type of absorption cell are discussed, and the output signal strength and sensitivity of the integrated cavity are evaluated and compared with the original off-axis integrated cavity.

2. Materials and Methods

2.1. Principle of Direct-Injection Integrated Cavity Output Spectroscopy

Off-axis integrated cavity output spectroscopy determines the concentration of gas by detecting the absorption of laser energy by the gas. The concentration of the gas is positively correlated with the absorption signal strength, and the decay rate of the output laser energy increases with the increase in the interaction distance between the laser and the sample being measured. The system’s detection ability for the rate of change in laser energy directly determines the system’s sensitivity.

2.1.1. Lambert–Beer Law

For a laser absorption spectral detection system, let the output light intensity be I 0 when the laser is transmitted without absorption and I when it is transmitted with absorption. The effective absorption optical path is L a b s , the absorption coefficient related to the current pressure is p , temperature is t , wavelength λ is α p , t , λ , and gas concentration is c . The schematic diagram of laser absorption spectroscopy is shown in Figure 1.
According to the Beer–Lambert law, their relationship can be described as follows:
I = I 0 · e α p , t , λ c L a b s
Under trace gas conditions, when c→0,
I = I 0 · 1 α p , t , λ c L a b s
At this time, the gas concentration can be expressed as
c = I 0 I I 0 · 1 α p , t , λ L a b s
The sensitivity of gas detection k is
k = α p , t , λ L a b s · I 0
The lower limit of detection of the gas concentration c m i n can be expressed as
c m i n = I min I 0 · 1 α p , t , λ L a b s
It can be seen that, when the minimum light intensity changes Δ I m i n , detection by the detector is certain, improving the output light intensity I0 and the effective absorption optical path L a b s can effectively improve the system’s sensitivity k and the lower limit of detection c m i n . Therefore, to achieve better performance, the sensitivity coefficient k p of the gas absorption cell should be improved comprehensively.

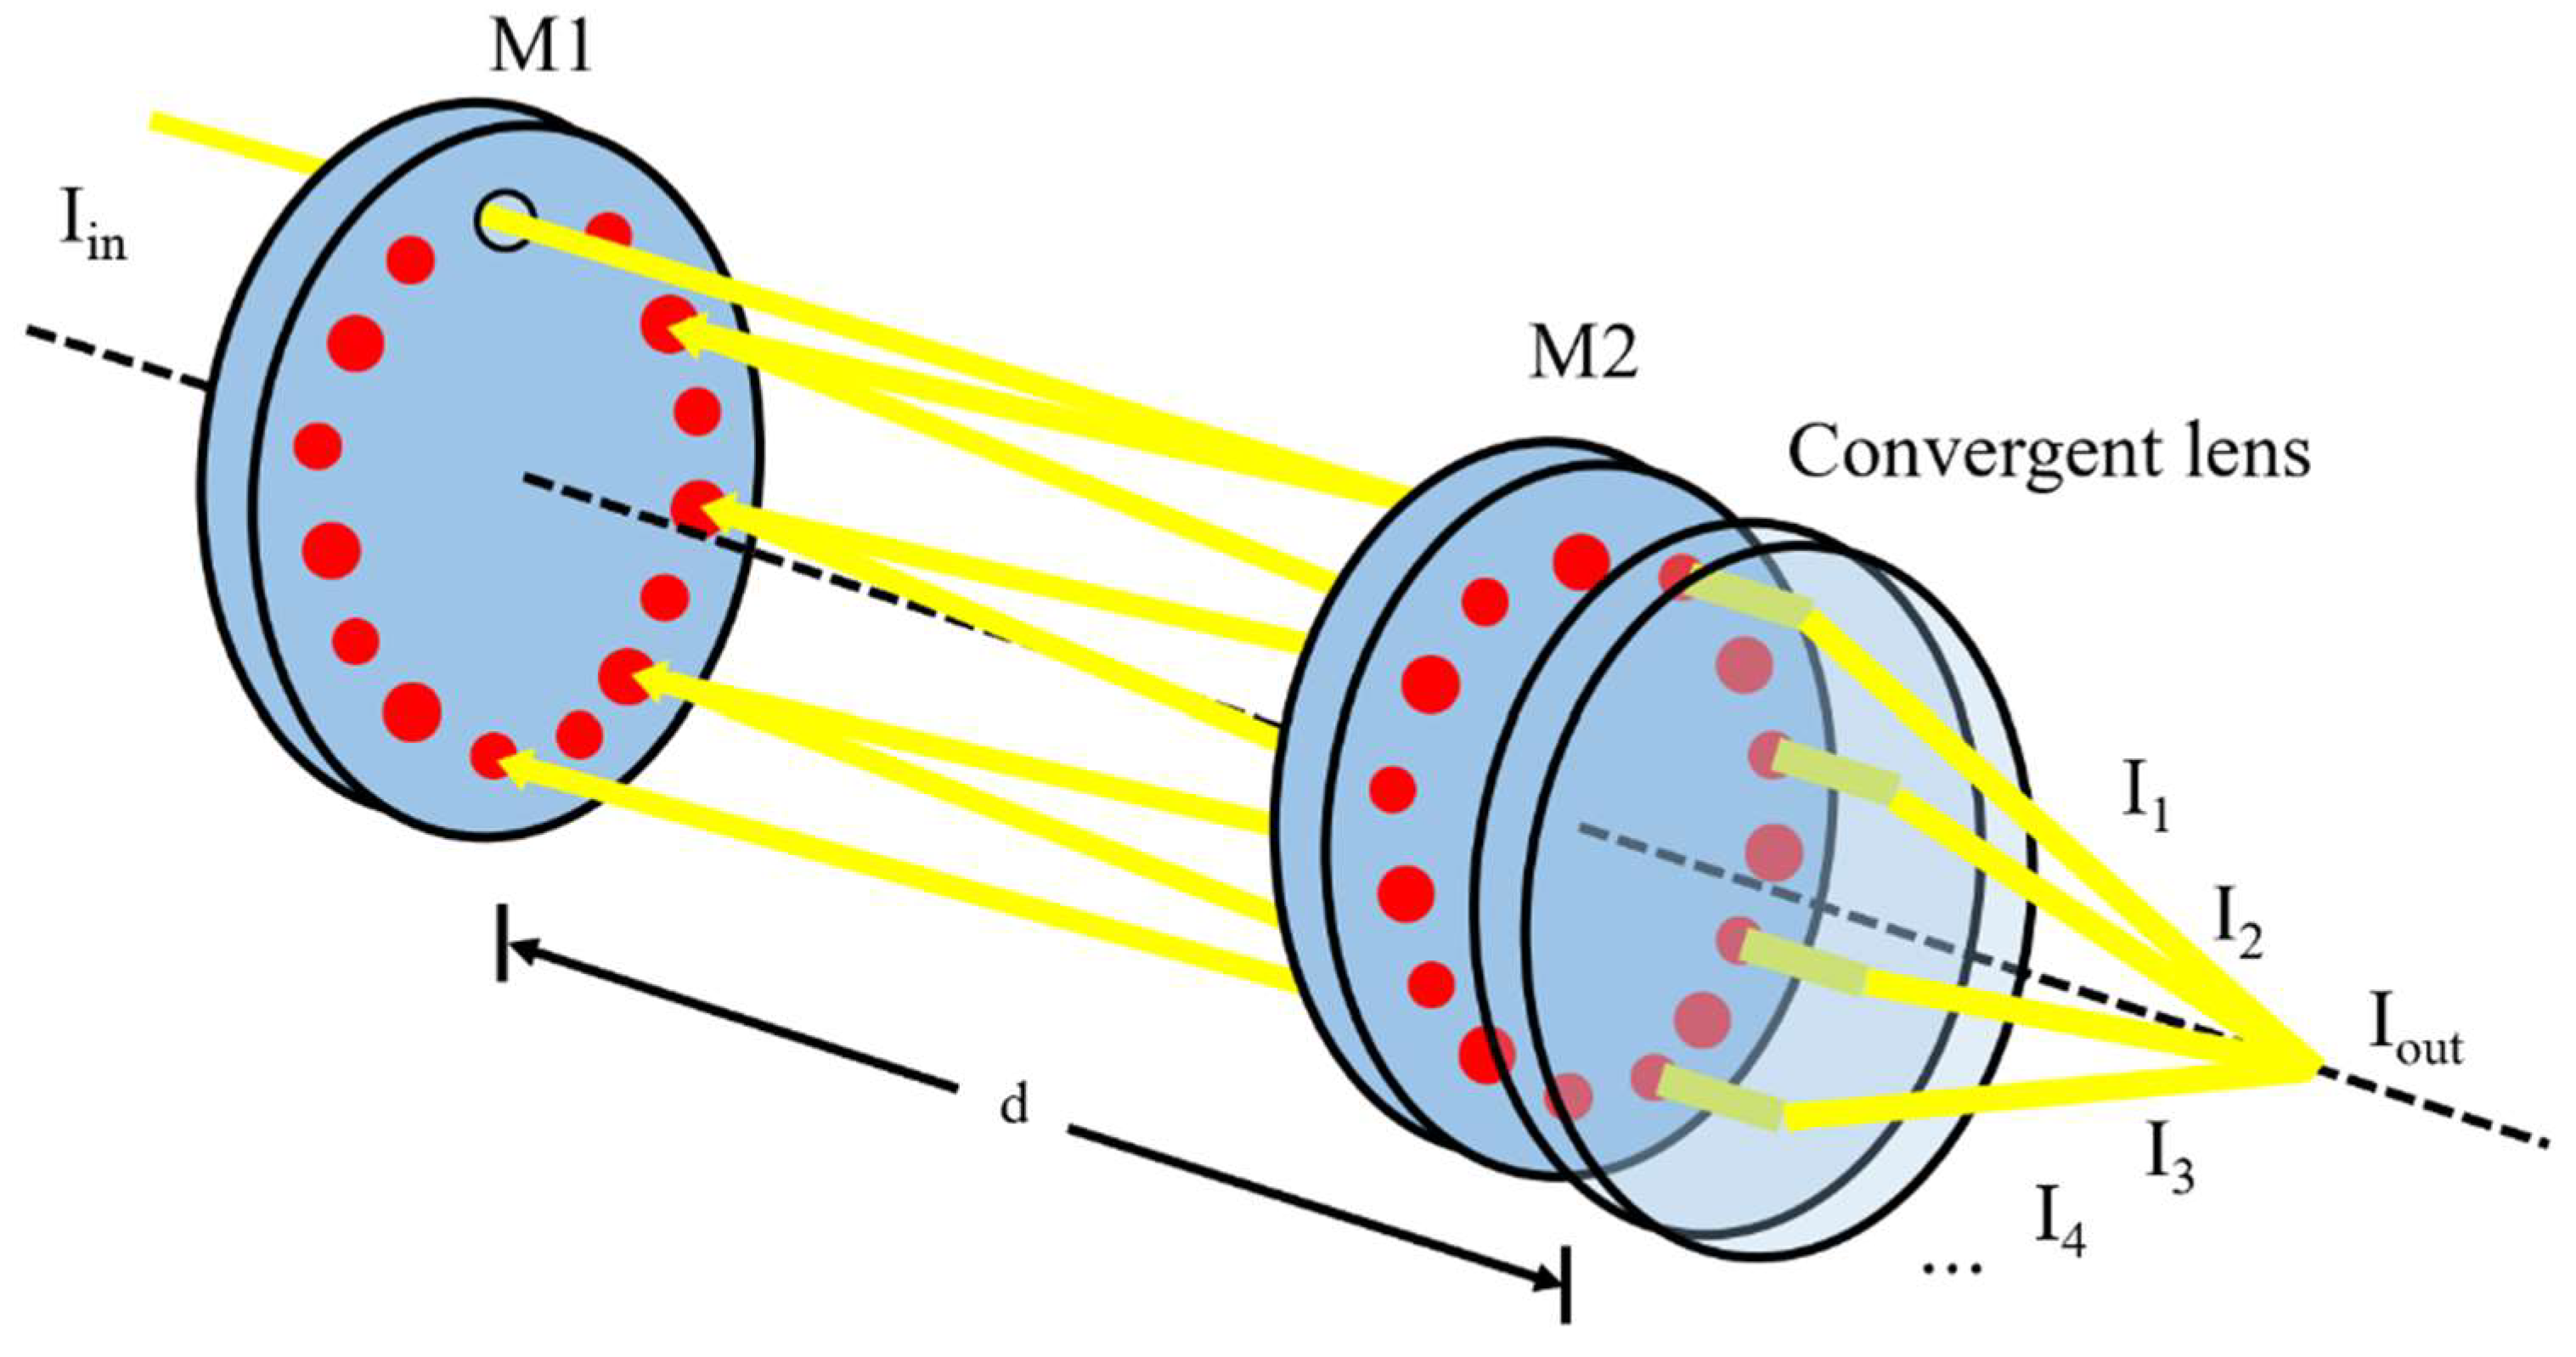
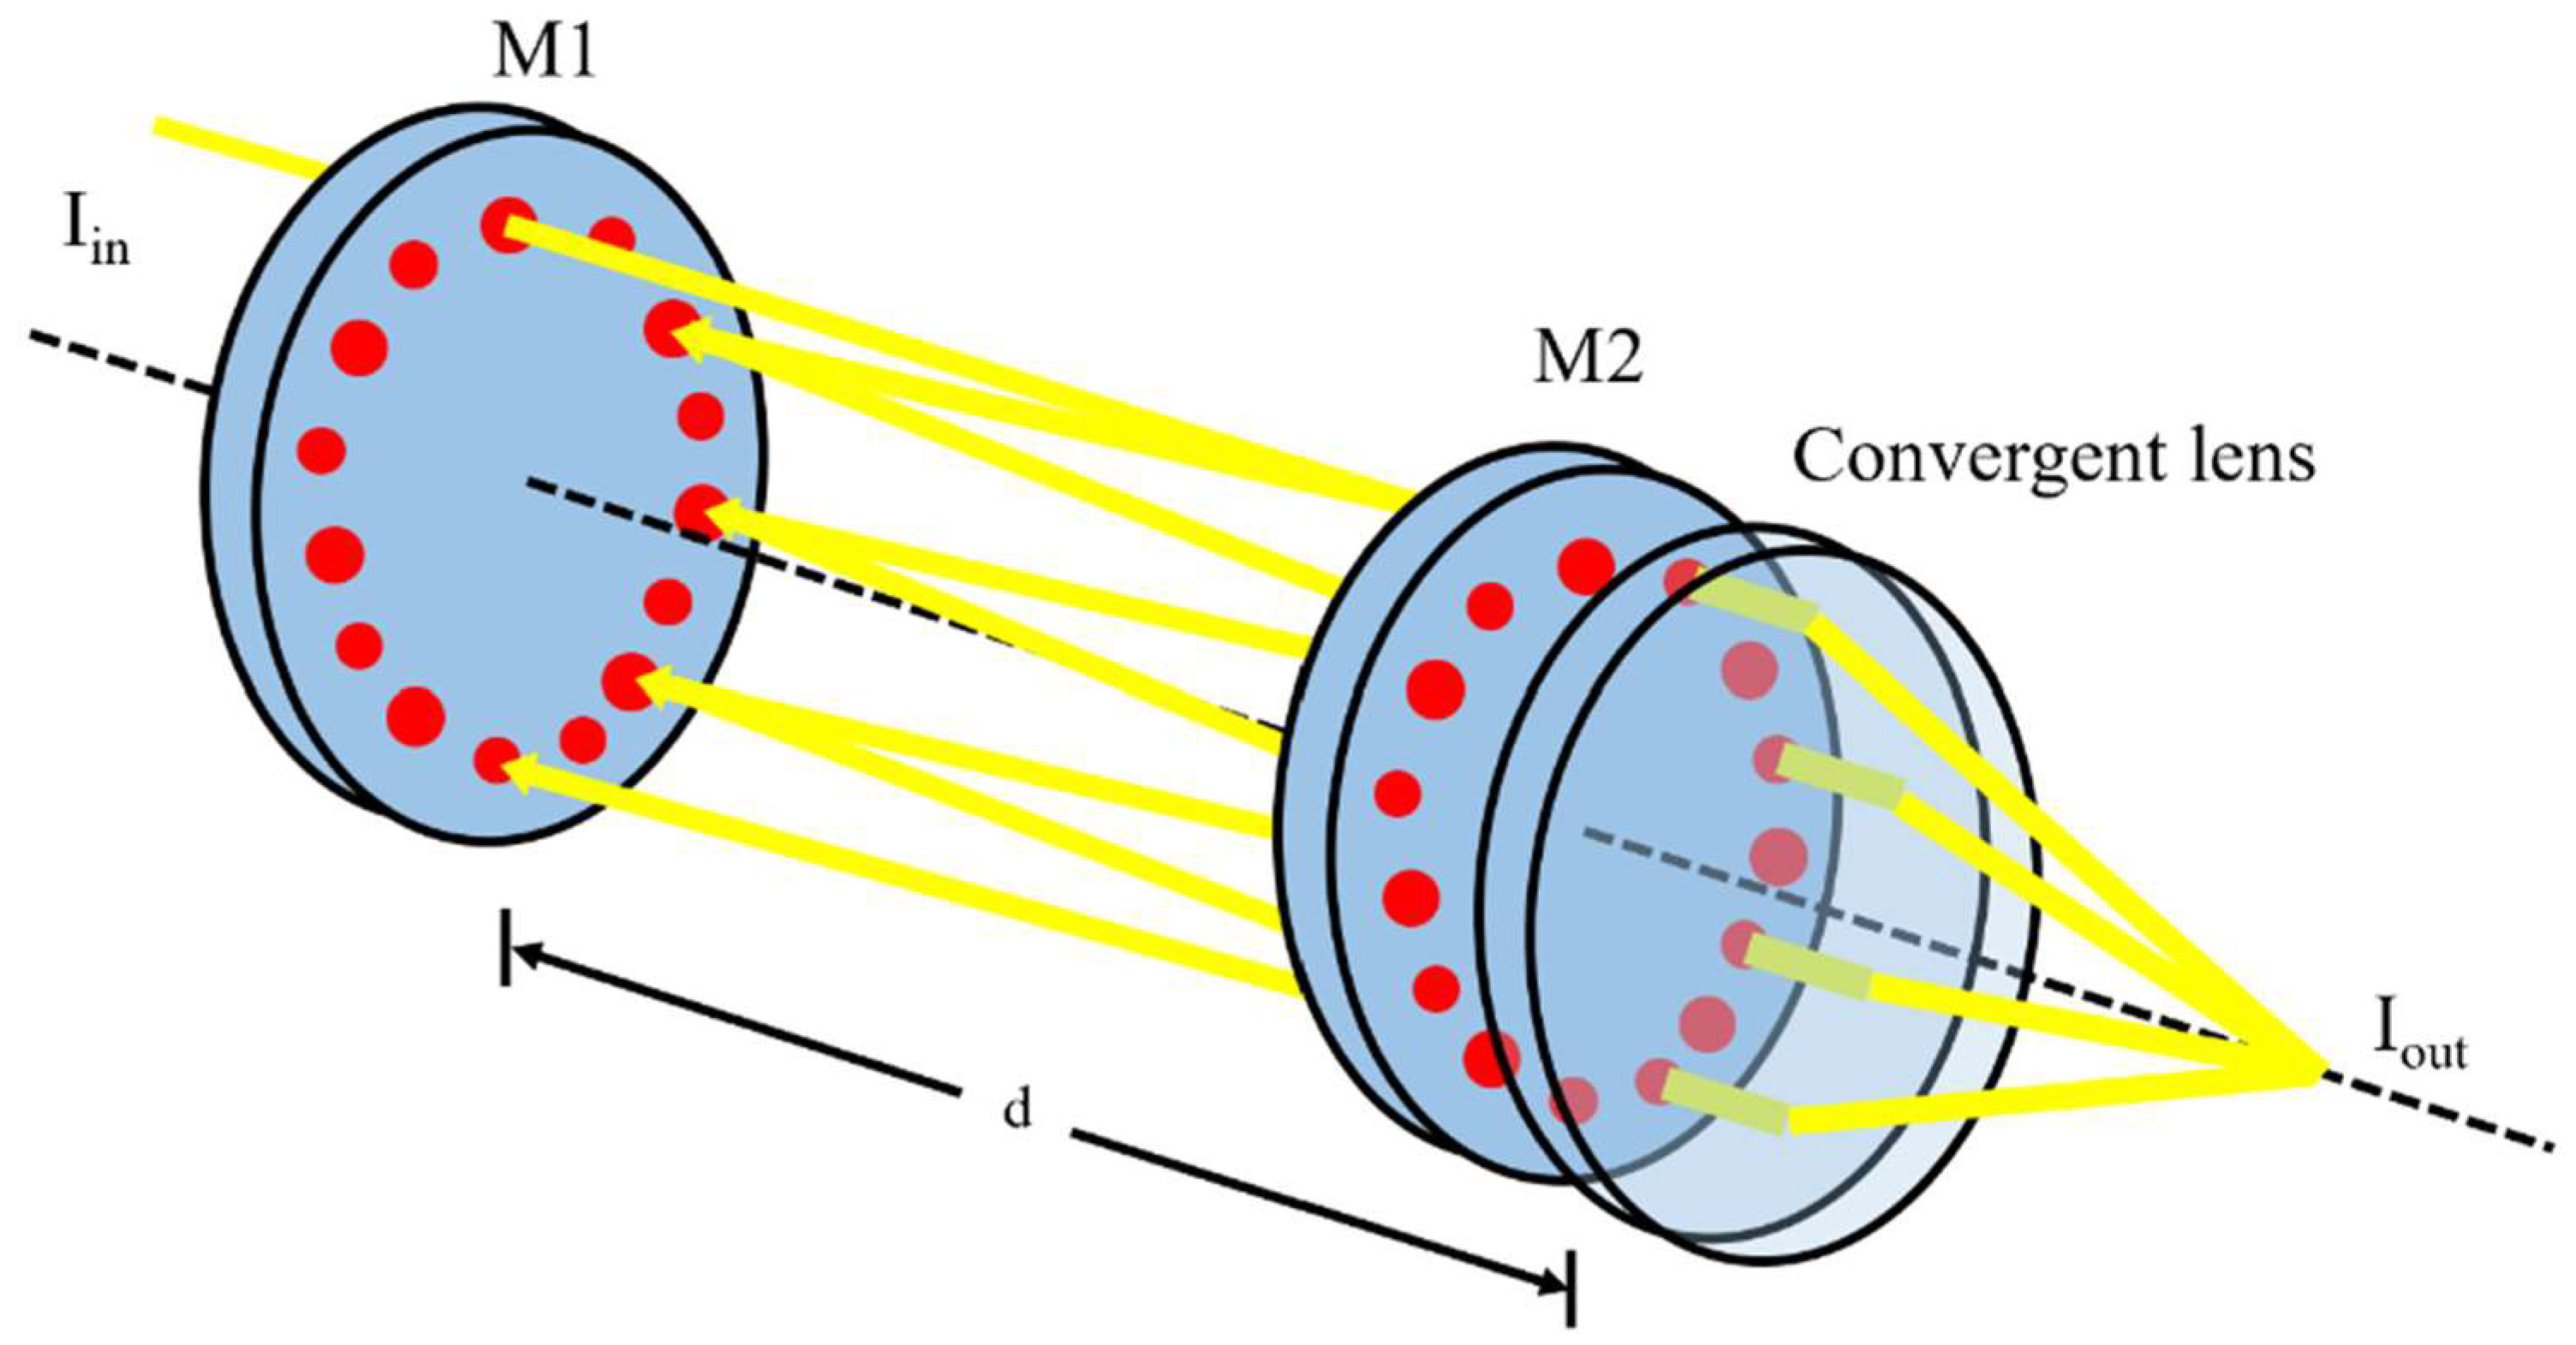
2.1.2. Modeling of an Integrated Cavity with Two Spherical Mirrors

As shown in Figure 2, in the integrated cavity composed of two spherical mirrors, two concave spherical mirrors M 1 , M 2 with a radius of curvature R are placed coaxially at a distance d . Incident light enters the integrated cavity at the incident point P o i n t 1 x 1 , y 1 , z 1 in the direction of the incident angle θ, φ. The incident laser beam is coupled into the cavity through the mirror in front of the cavity and reflects back and forth in the cavity until the laser energy is exhausted. Each reflection is taken as a separation, and Pn, Ln, and tn are the vectors from the origin to the n-th light point, the n-th direction vector, and the optical path of the n-th segment of light, respectively.
Taking the midpoint of the line connecting the centers of the two spherical mirrors as the origin of coordinates, set
A = 0 0 R d 2
The central light tracing equation in the entire light propagation process can be obtained as follows:
t n = P n + 1 n + 1 · A · L n + R 2 P n + 1 n + 1 · A × L n 2
L n = L n 1 2 R 2 R 2 P n 1 + 1 n + 1 · A × L n 1 2
P n = P 1 + m = 1 n 1 t m · L m
On this basis, if the incident laser’s radius is r l a s e r and the divergence half-angle is α l a s e r , through the following transformations, the incident laser can be expanded into a collection of main light and M layers, each with N marginal light rays:
P 1 j k = P 1 + r l a s e r _ j · cos 2 k π N         r l a s e r _ j · sin 2 k π N         0
θ 1 k φ 1 k = θ φ + α l a s e r · cos 2 k π N α l a s e r · sin 2 k π N
where:
r l a s e r j = j M · r l a s e r
k = 1 , 2 , 3 , , N
Based on this theory, after determining the initial conditions R , d , P 1 , L 1 , each light ray in the light ray set can be traced using a computer to obtain the shape and spot form of the incident laser on the mirror surface at any number of reflections.

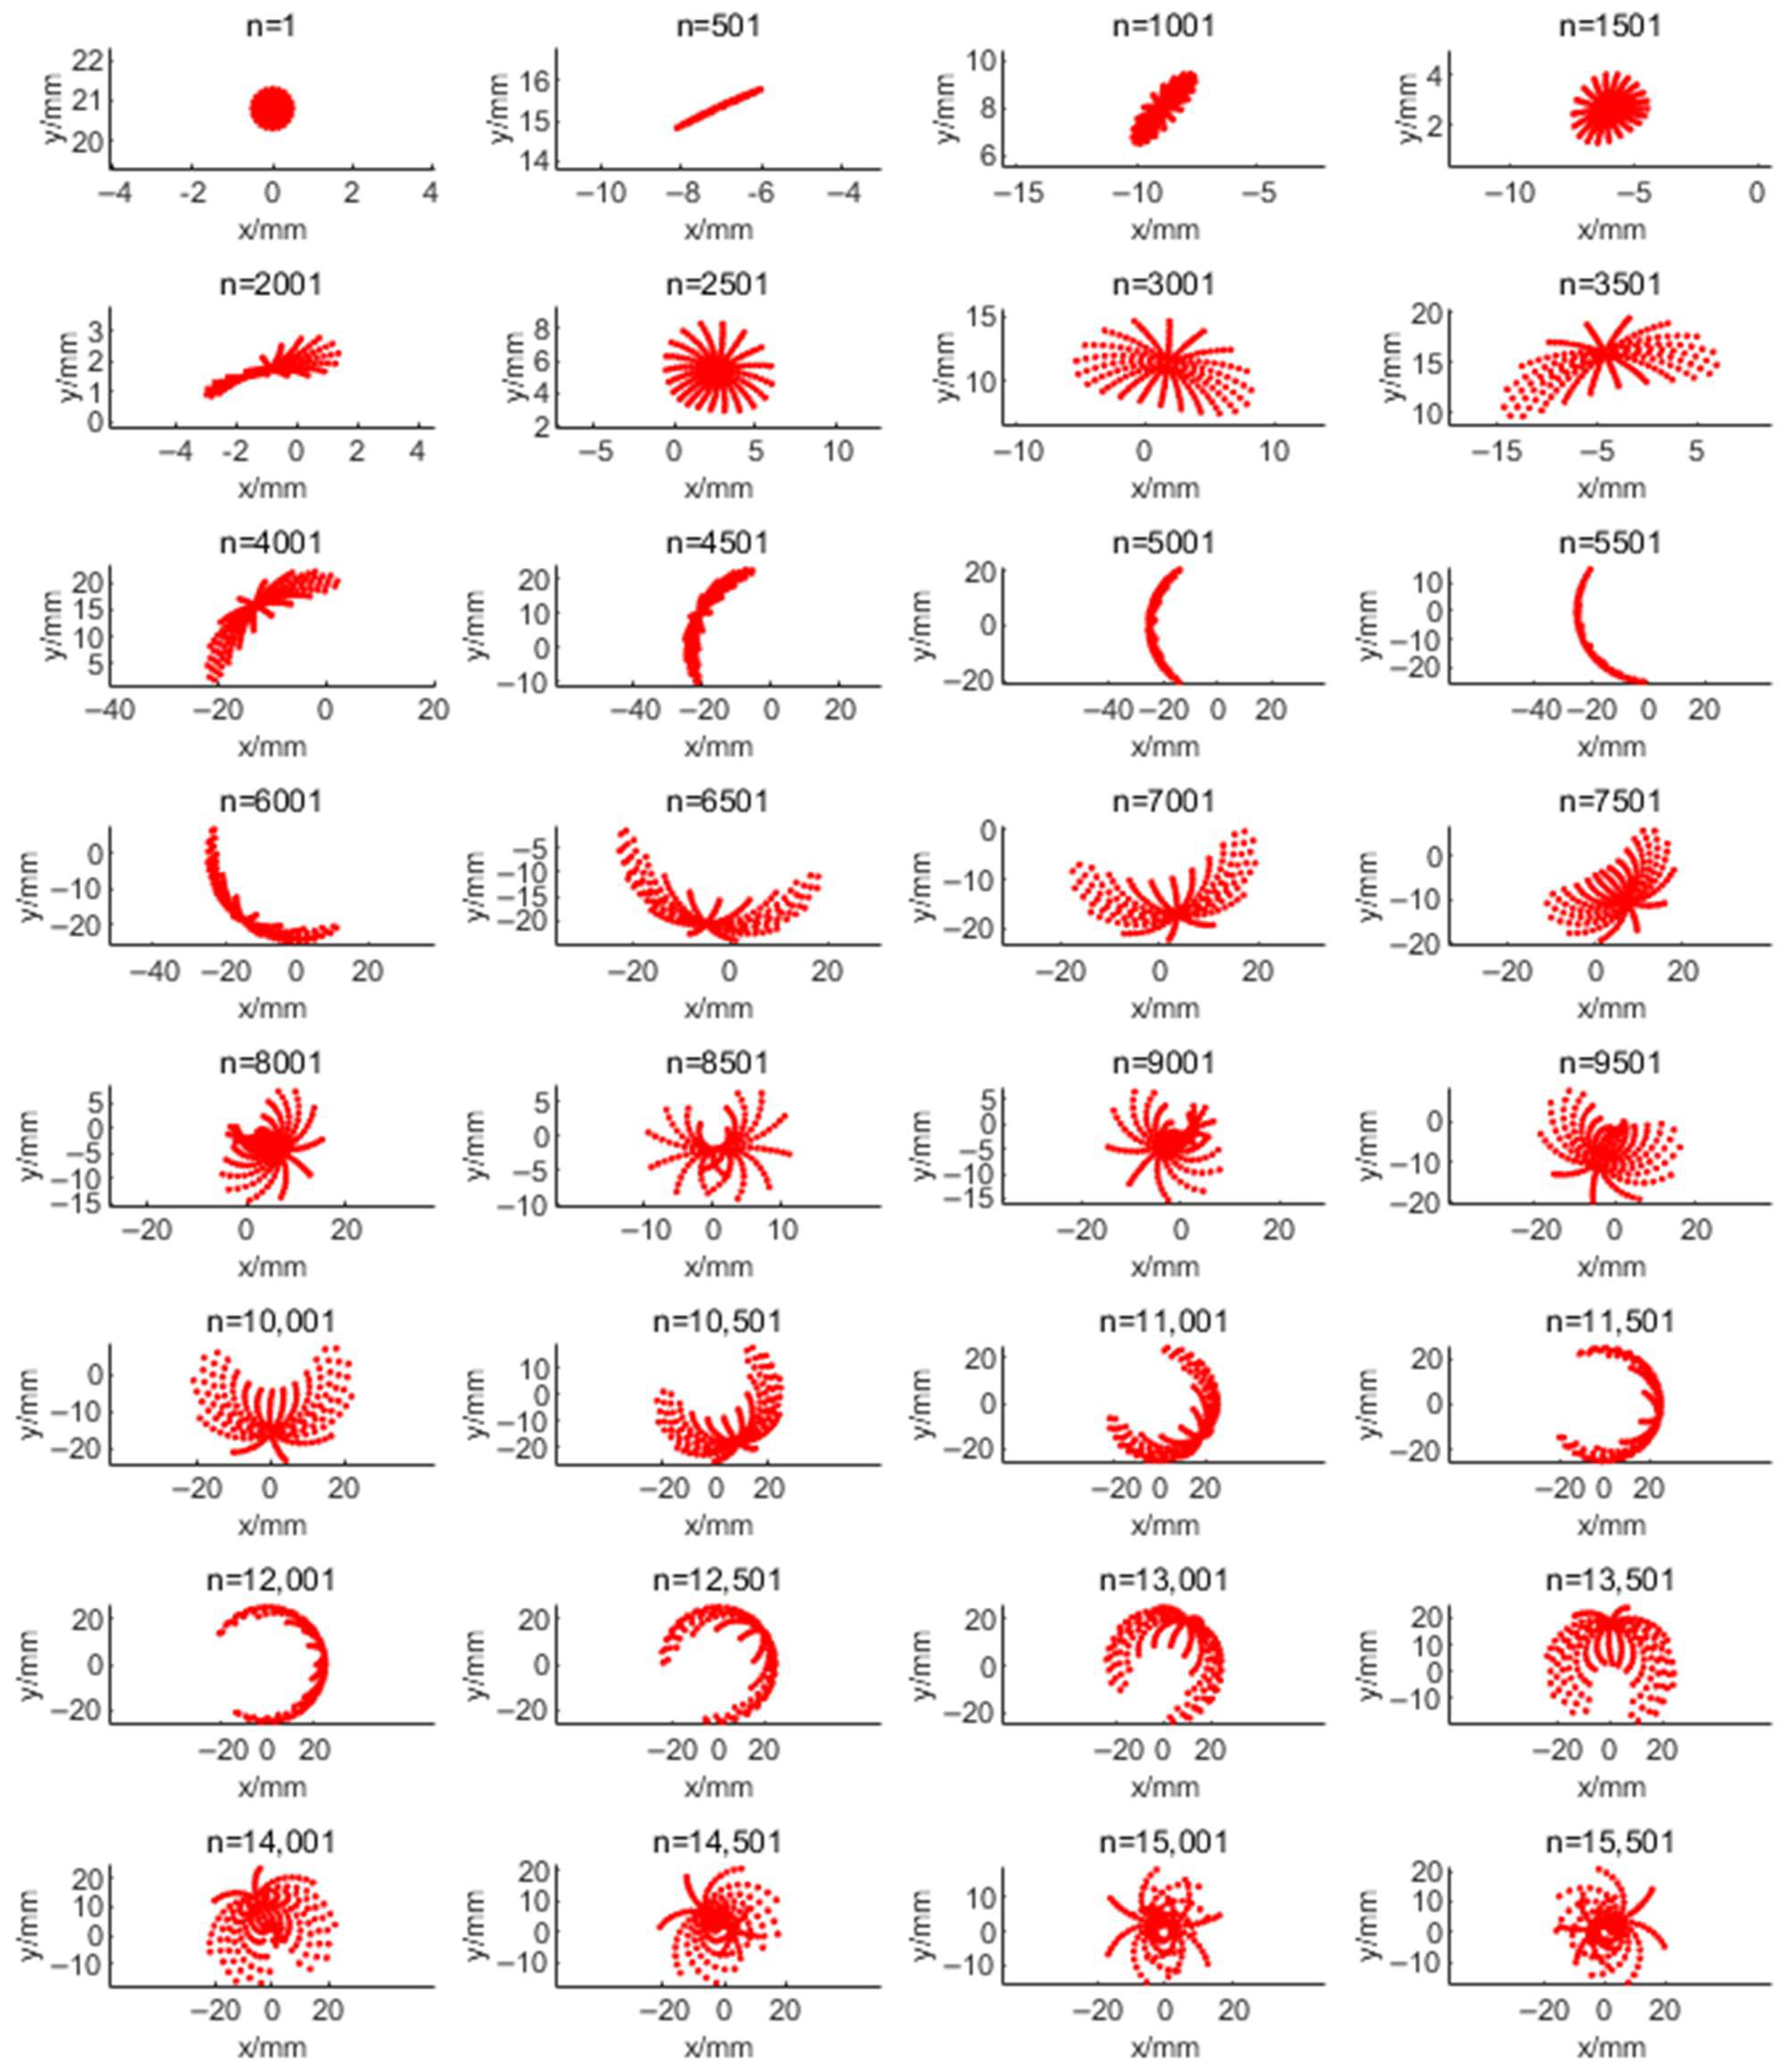
2.2. Characteristics of Spot Deformation after Multiple Reflections

The laser beam entering the cavity has a certain diameter. This is affected by the spherical aberration of the reflected mirror, as the number of reflections increases, we observe larger and larger light spots on both mirrors.
For example, a laser beam with a diameter of 1 mm enters an integrated cavity with both a radius of curvature of 500 mm and a spacing of 89.8 mm at coordinates x 0 = 0 ,   y 0 = 20.8 along θ = 7.55 ° and φ = 0.85 ° . The shape of the n-th spots on M1 is shown below.
The integrated cavity consisting of two spherical mirrors has stability conditions. If the stability condition is satisfied, the light can propagate any number of times in the integrated cavity without escaping from the side of the cavity. This characteristic of stability is similar to that of a resonator but not the same. Because the optical path at this time no longer satisfies the paraxial condition, the stability condition of the resonator is no longer applicable. A ray tracing method is used to ensure the stability of the cavity. We performed a light trace based on the vector method to locate all points of the whole ray set to verify that all the incident light came back to the mirror’s surface.
As shown in Figure 3, for the computed shape of the n-th light spot on M1, after a very large number of reflections, the light spot can finally be enlarged to the size of the whole pattern. However, the pattern can still be stable, and the diameter of the pattern has a maximum. The propagation of all light does not exceed the scope of the mirrors. As the stability condition of the cavity is met, all light rays in this cavity do not escape from the side of the cavity. Most of the light rays continuously interact with the measured gas during constant reflections.

2.3. Design of Direct-Injection Integrated Cavity

In the direct-injection integrated cavity, the incident light enters the integrated cavity directly through an incident hole on M1 and reflects back and forth on the two cavity mirrors, forming a pattern composed of thousands of light spots on the mirror’s surface. Each time the light beam returns to the hole on the M1 mirror, because the light spot gradually deforms to an area far larger than the incident hole after multiple reflections, only a small part of the rays can escape from the cavity, and the remaining rays continue to participate in the reflection. In this process, the light continuously leaks out at a small amount from the incident hole and also transmits from behind the cavity. This design aims to introduce the laser into the cavity without energy loss, thereby increasing the output energy and improving the detection limit of the integrated cavity. The schematic diagram of the output light intensity of the direct-injection integrated cavity is shown in Figure 4.
In this case, where off-axis incidence destroys the resonance effect of the cavity, the light intensity converged behind the cavity is approximately the sum of all transmitted light intensities. When ref represents the reflectivity, T represents the absorption rate of light through one pass, L o s t k represents the energy leakage rate of the k-th light spot from the incident hole, and its output light intensity I can be expressed as follows:
I = j = 1 i I j = I i n · 1 r e f · j = 1 i R 2 j 1 · T 2 j 1 · k = 1 j 1 L o s t k
Let I 0 be the non-absorption output light intensity. Its effective absorption optical path and energy loss rate can be calculated as shown below:
L a b s = ln I 0 I · 1 α p , t , λ c
I l o s t = 1 I 0 · 1 + r e f 1 r e f
The energy leakage rate changes as the number of spots on M1 when the central ray back to incident hole N increases. When the number of reflections is too low, the system’s pattern is similar to a Herriott multi-pass cell with a circular pattern. The light beam has total output from the incident hole because the size of the light spot does not grow larger than it. As N increases, the size of the light spot becomes larger. Fewer rays can escape from the incident hole, and the energy leakage rate decreases. When the pattern becomes too dense, some rays can escape before the central ray returns to the incident hole. The loss of these high-energy rays with few reflections causes a high energy leakage rate, which leads to a short, effective absorption optical path.
To achieve a long effective absorption optical path, it is necessary to control the escape of the laser inside the cavity from the incident hole. Therefore, the design of the integrated cavity needs to be considered for the following three aspects:
The number of reflections required for the light to return to the incident hole should be appropriate.
When the light returns to the incident hole each time, the overlap area of the light spot with the incident hole should be as small as possible.
The size of the incident hole should be as small as possible to prevent light rays from escaping the incident hole untimely during the entire reflection process.
This paper uses a combination of an exhaustive selection of initial structures and random walk algorithms for the design of integrated cavities. Under the conditions of no absorption and ignoring the incident hole, the light intensity of the i-th outgoing light ray behind the cavity is
I i = I i n · 1 r e f · r e f 2 i 1
The total light intensity of all light rays emitted after the num-th light rays is
I i g n o r e = I i n · 1 r e f · i = n u m r e f i = I i n · r e f 2 n u m 1 1 + r e f
It is easy to see that when n u m > 16915.6 , I i g n o r e is less than 1 × 10⁻¹⁵ I i n , which is difficult to measure for the detector and can be ignored. Therefore, in the design, only the first 17,000 emissions of each light ray are considered; that is, each light ray is reflected 34,000 times.
In the design, it is preset that the mirror reflectivity r e f = 99.9 % , the curvature of the lens reflection surface is fixed at 500   mm , the x-coordinate of the incident point x 1 = 0 , the incident light intensity I i n = 1 , and the maximum radius of the light spot pattern is limited to 25   mm . The design starts with the multi-pass cell mirror distance d , incident point coordinate y 1 , incident direction angle θ, and φ as the variables. In the first step, we searched in the range of d = 40 160   mm ,   y 1 = 15 25   mm ,   θ = 0 15 ° ,   φ = 0 15 ° with intervals of δ d , δ y 1 , δ θ , δ φ = 0.1 , 0.2 , 0.2 , 0.2 . We stored the cases where more than 500 patterns could be formed on the mirror when returning near the incident hole within 0.2 mm, and there were no other central light rays within the incident center point at 2 mm as options. Secondly, the incident laser expanded into 10 layers, each with 20 light rays; the diameter of the incident hole was set to 2 mm, and the diameter of the incident laser was 1mm. Afterward, the selected structure was input into the random walk algorithm with a step length of δ d , δ y 1 , δ θ , δ φ = 0.02 , 0.05 , 0.05 , 0.05 to further optimize the system and minimize the energy leakage rate to maximize the effective absorption optical path. For the optical path of the direct-injection integrated cavity to reach more than 95% of the off-axis integrated cavity, I l o s t needs to be less than 4‰.

3. Results

Using exhaustive selection and random walk algorithms, a series of design results were obtained. The parameters of the patterns are listed in Table 1.
The design results of six direct-injection integrated cavities are shown in Figure 5. The incident laser is modeled as a set of 201 rays to simulate the pattern of light spots on the mirror’s surfaces. The left image of each result represents the point on the mirror where each light ray falls when the center light returns into the incident hole. The left image of each result represents the light escaping from the entry perforation during this process. Among this series of design results, because the number of reflections is controlled, the light ray deforms much more than the incident hole when it returns to the incident hole. The energy escaping from the incident hole is only about four-thousandths of the incident light energy. And the output light intensity can reach nearly half of the incident light intensity. The mirror distance varies from 54.9 mm to 159.3 mm, and the effective optical path varies from 50 m to 155 m. Such a large parameter range can effectively cover the detection needs in various fields.

4. Discussion

4.1. Comparison with Off-Axis Integrated Cavity

As shown in Figure 6, in the off-axis integrated cavity, the incident light is coupled into the light cavity through the transmission in front of the cavity, reflects back and forth in the cavity until the energy is exhausted, and each time it reaches the back of the light cavity, a series of light rays are transmitted from the back of the cavity according to the transmission rate, and then converged via a lens. Under non-absorbing conditions, the output light intensity of the off-axis integrated cavity is
I 0 I C O S = I i n · 1 r e f 1 + r e f
The effective absorption optical path is
L a b s I C O S = d 1 r e f
Similar to one of the designs, an off-axis integrated cavity consists of two lenses with a radius of curvature of 500 mm and a distance of 89.8 mm, which produces a much lower output energy. The non-absorbing output light intensity of this off-axis integrated cavity is 5.0025 × 10⁻⁴ I i n , and the effective absorption optical path is 89.8 m. The off-axis integrated cavity has a long, effective absorption optical path, while its output light intensity is very weak. It has to rely on the integral detection method to obtain the signal, which weakens its real-time sensitivity.
The direct-injection integrated cavity allows for the laser input without a high-reflective surface. This change increases the output energy by 987 times. And an optical path of 88.74 m is obtained, which is equivalent to 98.82% of the absorption for the optical path of the off-axis integrated cavity under the same mirror conditions.

4.2. Stability of Direct-Injection Integrated Cavity

Because the optical path of a direct-injection integrated cavity is limited by the energy loss rate, the error has a unique effect on the performance of the cavity. As long as the light ray with high energy does not escape from the incident hole untimely, a slight change in the light spots’ pattern is of little effect. The following figure shows the relationship between Δd, the error of parameter d in design (c), the light energy loss rate Ilost and the effective absorption optical path Labs.
As shown in Figure 7, The direct-injection integrated cavity is very sensitive to changes in d and the distance between two mirrors. Just like an off-axis integrated cavity, a little change in d leads to a large change in the spot pattern, which may lead to great energy loss. The error of d greatly changes the overlap between the spot and the incident hole. So, the error of d must be strictly limited. To maintain a long optical path, up to 90% of the off-axis integrated cavity, and a high output energy, an error of ±0.05 mm can be accepted. This is the most stringent error in the entire optical system. The error of other parameters, such as the translation and angle of the optical axis of two lenses, has little effect on the spot pattern. It causes the entire pattern to shift and deform but does not change the formation order between the spots. A small amount of these errors only affect a few light spots near the incident hole so that its overlap with the incident hole can change. Therefore, compared with the large spot displacement caused by the change in parameter d, the influence caused by the change in these parameters is relatively controllable. Adjusting incident angle θ and φ to fine-tune the pattern of light spots can prevent high energy rays from escaping through the incident hole so that a long optical path can be maintained. This effect depends only on the changes in energy loss rate and can be very small with the adjustment of the incident laser parameters.

4.3. Further Development of Direct-Injection Integrated Cavity

The laser absorption spectroscopy system has the advantages of small volume, high precision, and strong stability and is one of the more excellent methods for measuring trace gases. More portable, stable, and sensitive will be the development direction of such systems. The direct-injection integrated cavity has certain room for optimization in portability and stability.
In the direct-injection integrated cavity, complex spot patterns are used to achieve low energy loss. These patterns require a larger mirror area, which increases the volume of the device. This problem weakens the real-time performance of the cavity and is not conducive to the miniaturization of the system. Future studies could fruitfully explore this issue further by finding smaller patterns.
In addition, future research should consider the potential effects of the environment more carefully. The direct-injection integrated cavity is a precision system. Any error that causes high-energy light to escape can significantly degrade the system’s performance. A more robust design is needed to maintain its stability over an extended period, considering factors like temperature variations, pressure changes, or external influences.

5. Conclusions

This paper proposes a direct-injection integrated cavity design to address the problem that traditional gas absorption cells cannot achieve both in terms of the absorption optical path and signal strength. This paper presents a design method for direct-injection integrated cavities using traversal and random walk algorithms. By traversing, we can find an integrated cavity structure that can form thousands of light spots on the mirror surface with the incident main light ray and has no main light ray escaping in advance. The incident main light ray is then extended, and the structure is optimized using a random walk algorithm to minimize the energy leakage rate and improve the effective absorption optical path.
The direct-injection integrated cavity can greatly improve the output light intensity while maintaining a long optical path close to the off-axis integrated cavity, thereby reducing the integration time, increasing the signal-to-noise ratio, improving the system’s response speed and sensitivity, and improving the gas detection limit. This paper designs a series of direct-injection integrated cavities where the effective coefficient of the optical path varies from 50 m to 155 m, and the output light intensity can reach more than 49% of the incident light intensity. There is an integrated cavity structure with a light spot pattern radius of 25 mm, a mirror curvature of 500 mm, a mirror distance of d = 89.8 mm, an incident point of (0, 20.8), and incident angles of (7.55°, 0.85°). Its volume is 253.9 mL. When the laser diameter is 1 mm, this structure allows the laser to enter the integrated cavity from a diameter of a 2 mm incident hole, producing an 88.74 m effective absorption optical path and 0.4994 I i n output light intensity. This is equivalent to 98.82% of the absorption optical path of the off-axis integrated cavity under the same mirror conditions, and the output energy is increased by 987 times. The direct-injection integrated cavity, with its higher response speed, detection limit, and sensitivity, can promote the development of trace gas detection technology and has a wide range of applications in atmospheric monitoring, industrial safety, pharmaceutical analysis, and other fields.

Author Contributions

Methodology, Q.G. and L.W.; software, Q.G. and C.L.; validation, Q.G., L.W. and C.L.; formal analysis, Q.G. and J.Z.; investigation, Q.G., S.W. and H.W.; resources, L.W.; data curation, Q.G. and L.W.; writing—original draft preparation, Q.G.; writing—review and editing, Q.G. and L.W.; visualization, Q.G. and Y.H.; supervision, L.W. and Y.Z.; project administration, Y.Z.; funding acquisition, Y.Z. All authors have read and agreed to the published version of the manuscript.

Funding

This work was supported by the National Key Research and Development Program of China (No. 2021YFB3901000, 2021YFB3901004).

Data Availability Statement

Data are contained within the article.

Conflicts of Interest

The authors declare no conflict of interest.

References

  1. O’Keefe, A. Integrated cavity output analysis of ultra-weak absorption. Chem. Phys. Lett. 1998, 293, 331–336. [Google Scholar] [CrossRef]
  2. O’Keefe, A.; Scherer, J.J. Cwintegrated Cavity Output Spectroscopy; Optica Publishing Group: Washington, DC, USA, 2000. [Google Scholar]
  3. Li, Y.; Zhan, L.; Zhang, J.; Chen, L. Equilibrator-based measurements of dissolved methane in the surface ocean using an integrated cavity output laser absorption spectrometer. Acta Oceanol. Sin. 2015, 34, 34–41. [Google Scholar] [CrossRef]
  4. Mahesh, P.; Sreenivas, G.; Rao, P.V.N.; Dadhwal, V.K.; Sai Krishna, S.V.S.; Mallikarjun, K. High-precision surface-level CO2 and CH4 using off-axis integrated cavity output spectroscopy (OA-ICOS) over Shadnagar, India. Int. J. Remote Sens. 2015, 36, 5754–5765. [Google Scholar] [CrossRef]
  5. Li, L.; Duo, L.; Gong, D.; Ma, Y.; Zhang, Z.; Wang, Y.; Zhou, D.; Jin, Y. Studies of Cavity Enhanced Absorption Spectroscopy for Weak Absorption Gas Measurements. In Proceedings of the International Symposium on High Power Laser Systems and Applications, Gmunden, Austria, 5–9 September 2017. [Google Scholar]
  6. Tian, C.; Wang, L.; Novick, K.A. Water vapor δ2 H, δ18 O and δ17 O measurements using an off-axis integrated cavity output spectrometer—Sensitivity to water vapor concentration, delta value and averaging-time. Rapid Commun. Mass Spectrom. 2016, 30, 2077–2086. [Google Scholar] [CrossRef] [PubMed]
  7. Nasir, E.F.; Farooq, A. Cavity-enhanced absorption sensor for carbon monoxide in a rapid compression machine. Proc. Combust. Inst. 2019, 37, 1297–1304. [Google Scholar] [CrossRef]
  8. Lang, N.; Macherius, U.; Zimmermann, H.; Glitsch, S.; Wiese, M.; Röpcke, J.; Van Helden, J.-P.H. RES-Q-Trace: A Mobile CEAS-Based Demonstrator for Multi-Component Trace Gas Detection in the MIR. Sensors 2018, 18, 2058. [Google Scholar] [CrossRef] [PubMed]
  9. Alquaity, A.B.S.; Kc, U.; Popov, A.; Farooq, A. Detection of shock-heated hydrogen peroxide (H2O2) by off-axis cavity-enhanced absorption spectroscopy (OA-CEAS). Appl. Phys. B 2017, 123, 280. [Google Scholar] [CrossRef]
  10. Sprenger, M.; Tetzlaff, D.; Soulsby, C. No influence of CO2 on stable isotope analyses of soil waters with off-axis integrated cavity output spectroscopy (OA-ICOS). Rapid Comm. Mass Spectrom. 2017, 31, 430–436. [Google Scholar] [CrossRef] [PubMed]
  11. Mering, J.A.; Barker, S.L.L. Precise Measurement of the Hydrogen Isotope Composition of Phyllosilicates by Continuous Flow Off-Axis Integrated Cavity Output Spectroscopy. Anal. Chem. 2018, 90, 2852–2859. [Google Scholar] [CrossRef] [PubMed]
  12. Gupta, A.; Singh, P.J.; Gaikwad, D.Y.; Udupa, D.V.; Topkar, A.; Sahoo, N.K. Instrumentation and signal processing for the detection of heavy water using off axis–integrated cavity output spectroscopy technique. Rev. Sci. Instrum. 2018, 89, 023110. [Google Scholar] [CrossRef] [PubMed]
  13. Azhar, M.; Mandon, J.; Neerincx, A.H.; Liu, Z.; Mink, J.; Merkus, P.J.F.M.; Cristescu, S.M.; Harren, F.J.M. A widely tunable, near-infrared laser-based trace gas sensor for hydrogen cyanide (HCN) detection in exhaled breath. Appl. Phys. B 2017, 123, 268. [Google Scholar] [CrossRef]
  14. Miller, K.E.; Bajzer, Ž.; Hein, S.S.; Phillips, J.E.; Syed, S.; Wright, A.M.; Cipriani, G.; Gibbons, S.J.; Szurszewski, J.H.; Farrugia, G.; et al. High temporal resolution gastric emptying breath tests in mice. Neurogastroenterol. Motil. 2018, 30, e13333. [Google Scholar] [CrossRef] [PubMed]
  15. Bayrakli, I. Tunable double-mode sensor for multi-gas detection based on the external-cavity diode laser. Appl. Opt. 2018, 57, 4039. [Google Scholar] [CrossRef] [PubMed]
  16. Shen, G.; Chao, X.; Sun, K. Modeling the optical field in off-axis integrated-cavity-output spectroscopy using the decentered Gaussian beam model. Appl. Opt. 2018, 57, 2947. [Google Scholar] [CrossRef] [PubMed]
  17. Nadeem, F.; Postma, B.R.; Postma, G.; Cristescu, S.M.; Mandon, J.; Harren, F.J.M. Comprehensive three-dimensional ray tracing model for three-mirror cavity-enhanced spectroscopy. Appl. Opt. 2018, 57, 154. [Google Scholar] [CrossRef] [PubMed]
  18. Paul, J.B.; Lapson, L.; Anderson, J.G. Ultrasensitive absorption spectroscopy with a high-finesse optical cavity and off-axis alignment. Appl. Opt. 2001, 40, 4904. [Google Scholar] [CrossRef] [PubMed]
  19. Leen, J.B.; O’Keefe, A. Optical re-injection in cavity-enhanced absorption spectroscopy. Rev. Sci. Instrum. 2014, 85, 093101. [Google Scholar] [CrossRef] [PubMed]
  20. Wu, T.; Xu, D.; He, X.; Lai, R.; Cheng, T. Off-axis integrating cavity output spectroscopy based on wavelength modulation. Acta Opt. Sin. 2017, 37, 389–398. [Google Scholar]
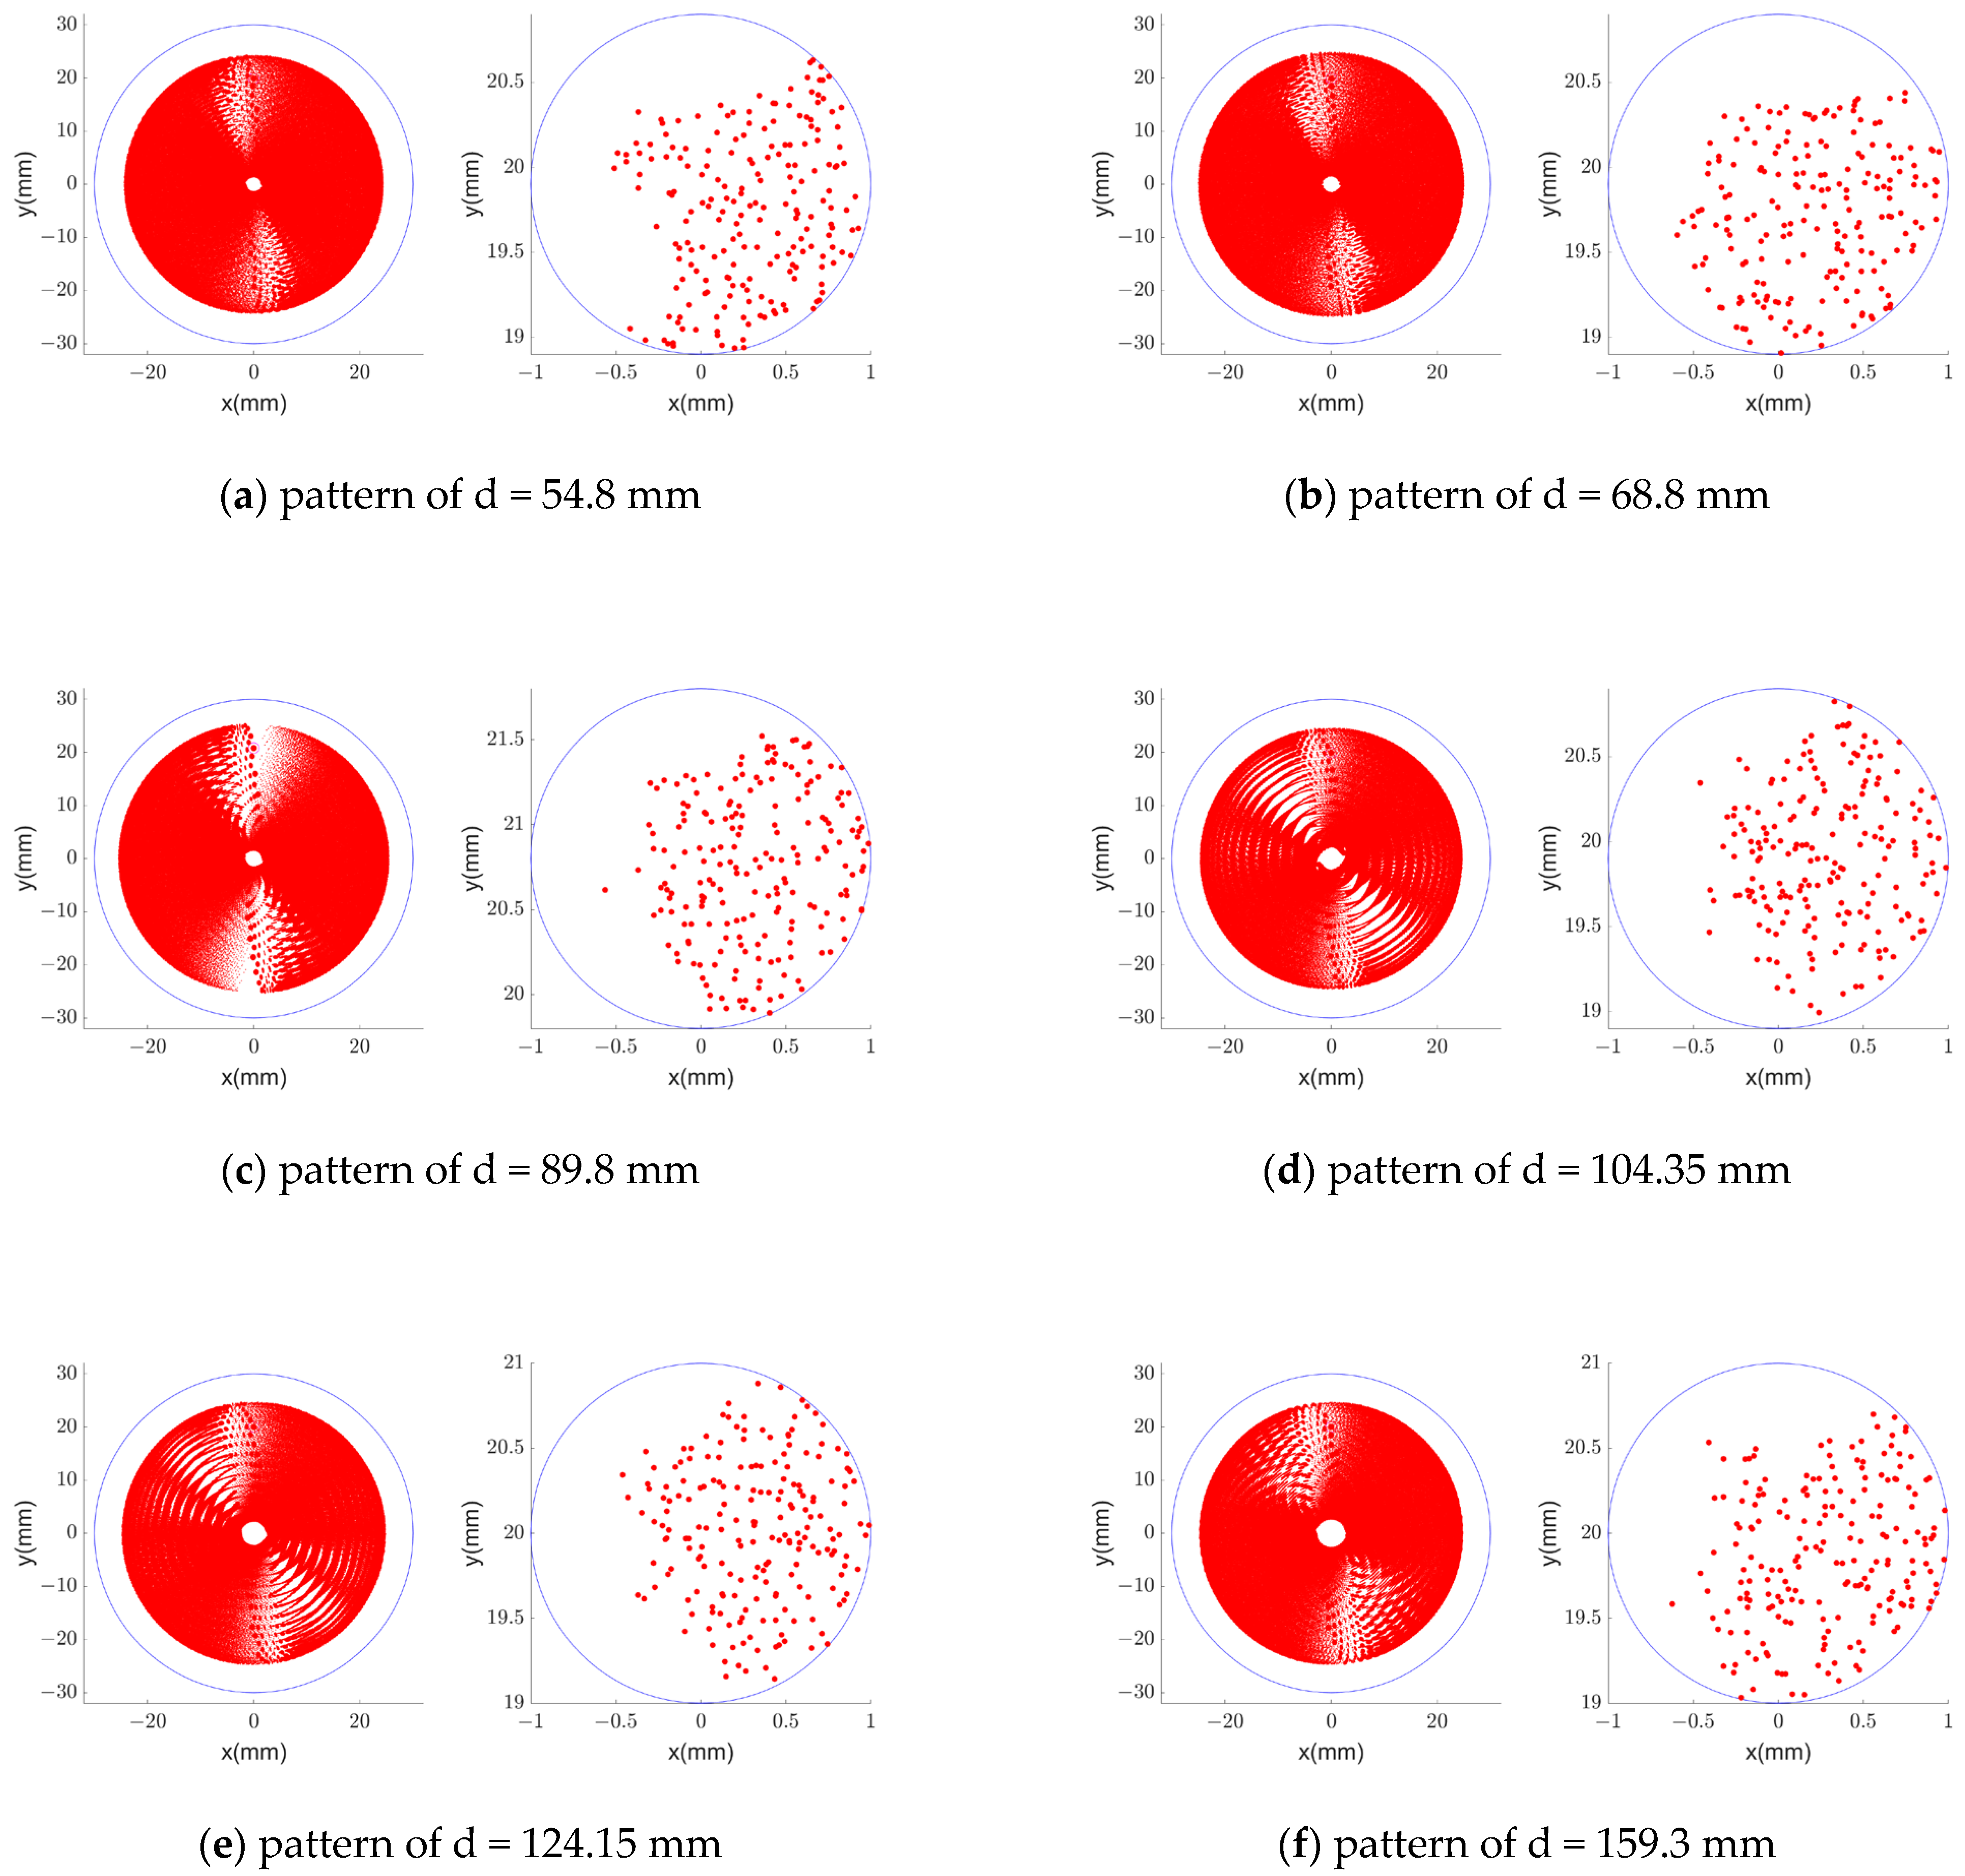
Figure 1. Schematic diagram of laser absorption spectroscopy.
Photonics 11 00036 g001
Figure 2. Schematic diagram of the direct-injection integrated cavity light path.
Photonics 11 00036 g002
Figure 3. Computed shape of the n-th light spot on M1. This figure records the coordinates of each ray on M1 in mm. Each spot consists of 201 light rays.
Photonics 11 00036 g003
Figure 4. Schematic diagram of the output light intensity of the direct-injection integrated cavity.
Photonics 11 00036 g004
Figure 5. The spot map on M1 when the central ray returns to the incident hole with the light ray map emitted from the incident hole corresponding to each design.
Photonics 11 00036 g005
Figure 6. Schematic diagram of light rays in the off-axis integrated cavity.
Photonics 11 00036 g006
Figure 7. In the condition of Figure 5c, Labs and Ilost change as Δd changes.
Photonics 11 00036 g007
Table 1. Parameters of the patterns shown in Figure 5.
R/mmd/mmNy0/mmθ/degφ/deg I l o s t L a b s / m k
Figure 5a50054.8289219.98.751.00.003453.710926.7773
Figure 5b50068.8293019.98.451.00.003467.409833.6056
Figure 5c50089.8325720.87.550.850.001788.741144.3178
Figure 5d500104.35290019.97.01.00.0035102.162450.9271
Figure 5e500124.15283720.06.61.00.0037121.426960.5202
Figure 5f500159.3280620.06.01.00.0038155.658277.5713
Disclaimer/Publisher’s Note: The statements, opinions and data contained in all publications are solely those of the individual author(s) and contributor(s) and not of MDPI and/or the editor(s). MDPI and/or the editor(s) disclaim responsibility for any injury to people or property resulting from any ideas, methods, instructions or products referred to in the content.

