Article

In Vivo Insights: Near-Infrared Photon Sampling of Reflectance Spectra from Cranial and Extracranial Sites in Healthy Individuals and Patients with Essential Tremor

1
Academic Neurology Unit, Department of Medico-Surgical Sciences and Biotechnologies, Sapienza University of Rome, 04019 Terracina, Italy
2
Research Center for Biophotonics, Sapienza University of Rome, 04100 Latina, Italy
3
Ce.R.S.I.Te.S.—Research and Service Center for Sustainable Technological Innovation, Sapienza University of Rome, 04100 Latina, Italy
4
Department of Chemical Engineering, Materials & Environment, Sapienza University of Rome, 00184 Rome, Italy
5
Neurosurgery Unit, Policlinico Umberto I, Department of Human Neurosciences, Sapienza University of Rome, 00185 Rome, Italy
6
Neurology Unit, Policlinico Umberto I, Department of Human Neurosciences, Sapienza University of Rome, 00185 Rome, Italy
7
Department of Neuroscience, Rehabilitation, Ophthalmology, Genetics, Maternal and Child Health, University of Genoa, 16132 Genova, Italy
8
Department of Neuroscience, Division of Neurorehabilitation, IRCCS Ospedale Policlinico San Martino, 16132 Genova, Italy
*
Author to whom correspondence should be addressed.
Photonics 2024, 11(11), 1025; https://doi.org/10.3390/photonics11111025
Submission received: 28 September 2024 / Revised: 24 October 2024 / Accepted: 28 October 2024 / Published: 30 October 2024

Abstract

:
Near-infrared (NIR) spectroscopy is a powerful non-invasive technique for assessing the optical properties of human tissues, capturing spectral signatures that reflect their biochemical and structural characteristics. In this study, we investigated the use of NIR reflectance spectroscopy combined with chemometric analysis to distinguish between patients with Essential Tremor (ET) and healthy individuals. ET is a common movement disorder characterized by involuntary tremors, often making it difficult to clinically differentiate from other neurological conditions. We hypothesized that NIR spectroscopy could reveal unique optical fingerprints that differentiate ET patients from healthy controls, potentially providing an additional diagnostic tool for ET. We collected NIR reflectance spectra from both extracranial (biceps and triceps) and cranial (cerebral cortex and brainstem) sites in ET patients and healthy subjects. Using Partial Least Squares Discriminant Analysis (PLS-DA) and Partial Least Squares (PLS) regression models, we analyzed the optical properties of the tissues and identified significant wavelength peaks associated with spectral differences between the two groups. The chemometric analysis successfully classified subjects based on their spectral profiles, revealing distinct differences in optical properties between cranial and extracranial sites in ET patients compared to healthy controls. Our results suggest that NIR spectroscopy, combined with machine learning algorithms, offers a promising non-invasive method for the in vivo characterization and differentiation of tissues in ET patients.

1. Introduction

Near-infrared (NIR) spectroscopy has proven useful for the non-invasive assessment of the optical properties of living tissues in humans [1]. In addition to non-invasively detecting tissue oxygenation, NIR spectroscopy provides spectral signatures (optical fingerprints) that represent specific, accurate, and reproducible measurements of the overall biological condition of the examined samples. These spectral signals, once subjected to statistical techniques (chemometric analysis), provide the chance to comprehend the sample’s optical characteristics and categorize it without the requirement for chemical knowledge [2].
Key to this “diagnostic” application is the ability of NIR light to penetrate a tissue, interrogate the tissue components, then escape the tissue for detection [3]. Due to the low absorption within the wavelength range of 600–1000 nm, NIR light can propagate for several centimeters, enabling the extraction of non-invasive information from within the depths of the organism [4]. Reflectance and scattering within organs stem from macroscopic variations in tissue refractive properties and microscopic heterogeneities in refractive indices among extracellular, cellular, and subcellular tissue components. Alterations in absorption and/or reflection and/or scattering reflect biochemical and/or structural features, which in turn can be indicative of the anatomy, physiology, or pathology of the examined samples.
Reflectance spectra obtained in vivo by NIR photon sampling allowed us to categorize living muscles according to the anatomy (biceps vs. triceps) and the anthropometric variables (age, sex, body mass index) in normal subjects [5], and to the neurological condition (normal vs. affected by upper motor neuron syndrome) and the effect of botulinum toxin treatment (before and after injection) in post-stroke patients [6]. Therefore, NIR reflectance spectroscopy and chemometric analysis provide the opportunity to see whether specific optical fingerprints collected from body districts in patients may be associated with specific neurological conditions.
Essential tremor (ET) is a chronic progressive neurological disorder characterized by rhythmic and involuntary shaking of distinct parts of the body, typically the hands, head, or voice. It is one of the most common movement disorders, affecting millions of people worldwide. It often begins in middle age or later, but it can occur at any age [7]. Clinically patients affected by ET manifest tremor, other motor features (i.e., gait ataxia), and non-motor features (cognitive, psychiatric, and sensory changes) [8]. Tremor associated with ET is often symmetrical and kinetic, i.e., it mainly occurs during voluntary movements or when maintaining a particular posture. The exact cause of ET is unknown; both genetic and environmental factors likely contribute to disease etiology. Diagnosis is typically based on clinical symptoms and a thorough medical history. There is no specific diagnostic test for essential tremor; however, neuroimaging [9] and other tests may be conducted to rule out other potential causes.
Distinguishing ET from other tremor disorders can be challenging in certain situations due to clinical similarity (tremors associated with Parkinson’s disease or dystonia may sometimes resemble those seen in ET), the overlap of symptoms (ET can coexist with other neurological conditions, complicating the diagnostic process), the variability in ET presentation among individuals, and the absence of specific diagnostic tests. In some cases, notwithstanding neurological expertise, reaching an accurate diagnosis is not guaranteed.
Several objective diagnostic tools have been developed for ET. Machine learning has been used to identify biomarkers like APOE, SENP6, and ZNF148, with significant diagnostic value [10]. Neurophysiological [11] and neuroimaging techniques [12,13,14] assist in differentiating ET from other disorders, while electrophysiological assessments provide objective data on tremor characteristics [15]. Clinical scales such as the Fahn–Tolosa– Marín scale [16] are used for severity evaluation, and genetic testing helps confirm diagnoses in familial cases. Biomarker research [17], wearable technology [18], and quantitative EEG offer further avenues for assessing ET [19], with combination approaches enhancing diagnostic accuracy.
Therefore, investigating additional tools for diagnosing ET could be beneficial for increasing accuracy and objectivity, for favoring early detection and intervention, and for monitoring disease progression. In this study, we propose NIR reflectance spectra as a further advanced diagnostic tool for identifying patients with ET. Integration of innovative non-invasive tools and artificial intelligence derived techniques has already proved valuable for more precise and efficient diagnosis of patients with ET [14]. We aimed to explore differences between normal subjects and ET patients in NIRS reflectance spectra, collected from extracranial (biceps and triceps) and cranial (cerebral, brainstem) sites, to improve the knowledge on the optical properties of distinct body areas in essential tremor. In addition, we investigated whether a powerful machine learning algorithm using chemometrics could help discriminate between normal subjects and patients based on the spectral data.

2. Materials and Methods

2.1. Participants

Participants were Caucasian southern European individuals enrolled at two Academic Neurology Units: Policlinico Umberto I in Rome and Alfredo Fiorini Hospital in Terracina (Latina), Italy. Healthy subjects (n = 16, age 21–74 years; 6 women) were chosen from among hospital staff and patients’ relatives.
All patients with a confirmed diagnosis of ET were recruited from the movement disorders outpatient clinic (n = 16, age 21–89 years; 7 women). Patients were included in the study if tremor was their primary symptom.
The diagnosis of ET was confirmed through a comprehensive clinical evaluation conducted by a senior neurologist and movement disorder specialist, in accordance with the diagnostic criteria for ET established by the Task Force on Tremor of the International Parkinson and Movement Disorder Society [20].
A two-axis approach was employed for the classification of tremors. The first axis was based on clinical features, with the objective of identifying a tremor syndrome. The second axis pertained to the etiology of tremors. Patients were categorized according to a detailed medical history, neurological examination, and the exclusion of other causes of tremor, such as Parkinson’s disease or dystonia. In cases where the clinical diagnosis was uncertain, additional neurophysiological assessments, such as electromyography (EMG) or neuroimaging, were performed to support the diagnosis of ET.
Demographic data and clinical features of patients are shown in Table 1.
The Fahn–Tolosa– Marín (FTM) scale is a clinical tool used to assess tremor severity, particularly in ET patients. It rates tremor in different body parts (e.g., head, arms, legs, and voice) on a scale from 0 to 4, with 0 indicating no tremor and 4 representing severe tremor that interferes with function. The scale also evaluates motor tasks like handwriting, drawing, and pouring, as well as daily activities such as eating, dressing, and personal hygiene. Scores are summed to provide an overall severity rating, which helps clinicians monitor tremor progression and treatment effectiveness.
The Quality of Life in Essential Tremor Questionnaire (QUEST) is a tool used to assess the impact of ET on a patient’s daily life. It includes 30 items divided into several domains, such as physical, psychosocial, and communication. Each item is rated on a scale from 0 to 4, with 0 representing no impact and 4 indicating a severe impact on quality of life. The total score reflects the extent to which tremor affects daily activities, social interactions, emotional well-being, and overall life satisfaction. The QUEST helps clinicians evaluate how ET interferes with a patient’s daily functioning and guides treatment decisions.
All participants provided written informed consent before being included in the study, which was approved by the local ethics committee (Comitato Etico Lazio 2, protocol number 0167183/2018). All procedures were carried out in accordance with the relevant guidelines and regulations.

2.2. Spectra Collection and Analysis

The detailed explanation of the portable spectroradiometer system, instrument calibration, in vivo spectra acquisition, spectral data management, and analysis have been previously outlined [5]. In summary, we utilized an ASD FieldSpec 4 Standard-Res spectroradiometer (ASD Inc., Boulder, Colorado, United States) capable of operating within the 350–2500 nm spectral range [22]. The device features distinct holographic diffraction gratings along with three individual detectors, i.e., a VIS detector (350–1000 nm), a SWIR1 detector (1001–1800 nm), and a SWIR2 detector (1801–2500 nm). The contact probe is equipped with a halogen bulb serving as the light source, featuring a 12° light source angle, a 35° measurement angle, and a 10 mm spot size.
For device calibration and data acquisition, the native software for the ASD instrument, called RS3, was adopted. The calibration procedure included dark acquisition, referencing the dark current calibration file, and measurement of white reference material (Spectralon white reference standard from LabSphere™). Acquired spectral data files (.asd) were imported into MATLAB (MATLAB R2022a, ver. 9.12.; The Mathworks, Inc., Natick, Massachusetts, United States) using an ad hoc script. Imported data files were analyzed using the PLS_toolbox (ver. 9.0; Eigenvector Research, Inc., Wenatchee, Washington, United States) and Statistics and Machine Learning Toolbox (Ver 12.3.; The Mathworks, Inc., Natick, Massachusetts, United States). Data were then stored in dataset objects, and classes were set.
After thorough cleaning of the probe and skin-contact regions using disposable skin-cleansing wipes, VIS-SWIR reflectance spectra were sampled from cranial and extracranial sites. To acquire spectra, the instrument’s contact probe was placed onto the subject’s skin, while the spectroradiometer was remotely controlled by a laptop. Patients were encouraged to immediately report any discomfort felt during the procedure.
Cranial sites were located on the scalp (cerebral site) and the temple region (brainstem site) contralateral to the most trembling limb, from which the extracranial spectra were acquired. For the cerebral site, the contact probe was positioned at the location corresponding to the electrode placement site FC3 of the International 10–20 system EEG montage. The selection of the scalp area over the primary motor cortex for NIR reflectance spectra in patients with ET is motivated by two key factors: accessibility and relevance. The scalp represents an accessible, non-invasive site for NIR light penetration, allowing for the measurement of cortical activity, particularly in the motor cortex, which plays a fundamental role in motor control. This region is responsible for the generation and regulation of voluntary movements, and it is important in modulating the rhythmic firing patterns that are frequently disrupted in ET. Abnormalities in cortical excitability and communication within motor-related areas may contribute to the generation of tremor, which manifests as the characteristic rhythmic shaking observed in patients.
For the brainstem site, the contact probe was positioned in the temporal acoustic window for transcranial doppler, a cranial area that leverages the relatively thin bone. Anatomically, the temporal window is situated above the zygomatic arch, anteriorly to the tragus. The contact probe was held parallel to the zygomatic arch. Twenty spectra were acquired from each cranial site (40 spectra/patient), and the time required for performing spectra collection was 40 s per subject. Measuring NIR spectra from a cranial site over the brainstem is especially important, as this area plays a key role in essential tremor. The brainstem, which includes important structures such as the cerebellar peduncles and the olivary nucleus, plays a key role in maintaining posture, regulating movement coordination, and transmitting signals between the cerebellum and the motor cortex. Dysfunction in brainstem–cerebellar circuits can impair smooth motor control, thereby contributing to the generation of tremor. Abnormal oscillatory activity, particularly in the inferior olive and its connections to the cerebellum, is believed to be a core mechanism in ET, disrupting the fine-tuning of motor commands and thereby leading to the manifestation of tremor symptoms.
The extracranial sites were on the dorsal and ventral aspects of the arm, standardized based on the motor point locations of biceps and triceps. The motor point of a muscle represents the position where the motor branch of a nerve enters the muscle belly. The muscle was maintained relaxed throughout the acquisition, with the segment fully supported, and the limb held in a fixed posture (elbow angle at 90°). Fifty spectra were acquired from each extracranial site (100 spectra/patient), and the time required was 100 s per subject.
Chemometric analysis was carried out on both the primary dataset and the dataset with repeated measures within the spectral range of 450–2500 nm. The process began with a specific combination of preprocessing steps aimed at eliminating physical phenomena and enhancing multivariate analysis [23]. These steps included extended multiplicative scatter correction (EMSC), generalized least square weighting (GLS-W) applied to classes (with α = 0.002 for an enhanced filtering effect), and mean center (MC) algorithms.
The reflectance spectra data underwent principal component analysis (PCA), a mathematical technique focused on decomposing datasets into orthogonal components using linear combinations that closely represent the original data to a desired level of precision [24]. Selection of principal components (PCs) involved examining the eigenvalues plot, while outliers were identified and removed by analyzing Hotelling’s T2 versus Q residual plots.
Four PCAs were performed on the main dataset according to the following pairs of classes:
  • ET biceps (n = 800) vs. Normal biceps (n = 800);
  • ET triceps (n = 800) vs. Normal triceps (n = 800);
  • ET brainstem (n = 320) vs. Normal brainstem (n = 320);
  • ET cortical (n = 320) vs. Normal cortical (n = 320).
We used the Partial Least Squares Discriminant Analysis (PLS-DA) classification method to categorize and predict ET or healthy subject by examining the spectra collected from cranial and extracranial sites. This method explores predictive relationships between input and output variables. The calibration and validation sets were established using the Kennard–Stone (K-S) algorithm [25]. The Venetian Blinds (VBs) algorithm was adopted for performing model cross-validation and choosing the right number of Latent Variables (LVs). To evaluate the classifiers’ performance, parameters derived from the confusion matrix were used, including sensitivity, specificity, error rate, precision, and accuracy [26].
Four classification models were established for recognizing:
  • ET biceps (n = 800) vs. Normal biceps (n = 800);
  • ET triceps (n = 800) vs. Normal triceps (n = 800);
  • ET brainstem (n = 320) vs. Normal brainstem (n = 320);
  • ET cortical (n = 320) vs. Normal cortical (n = 320).
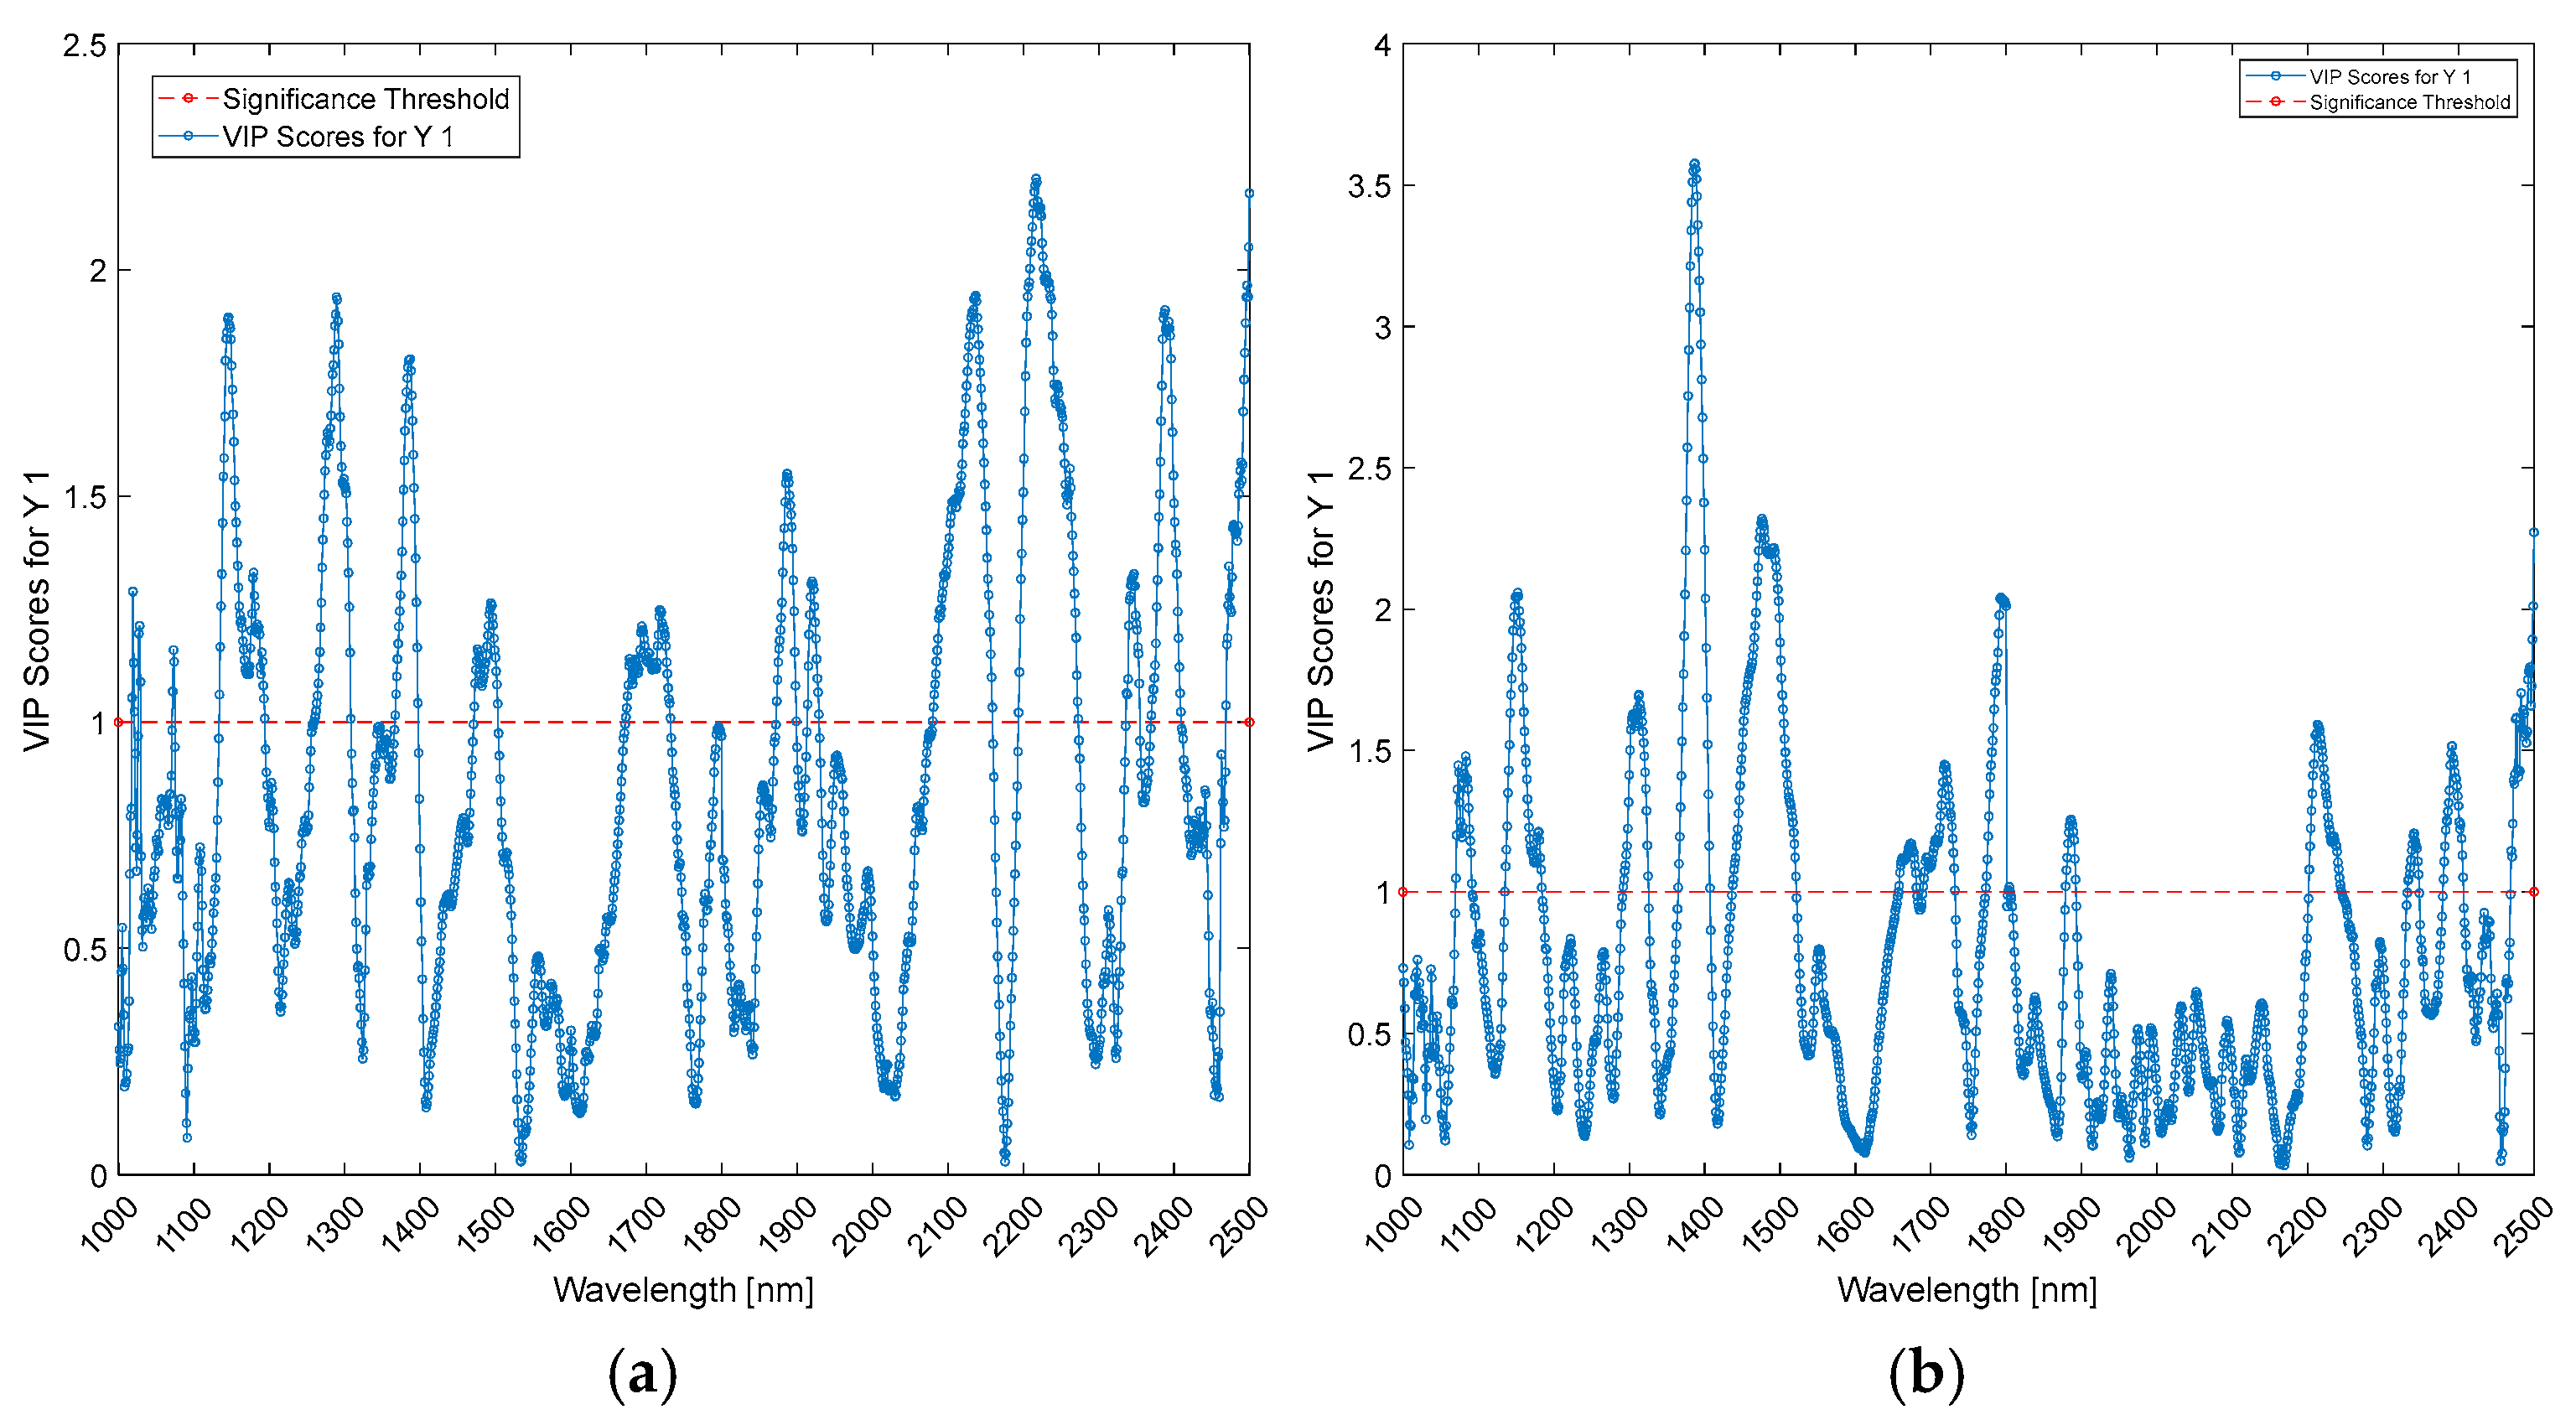
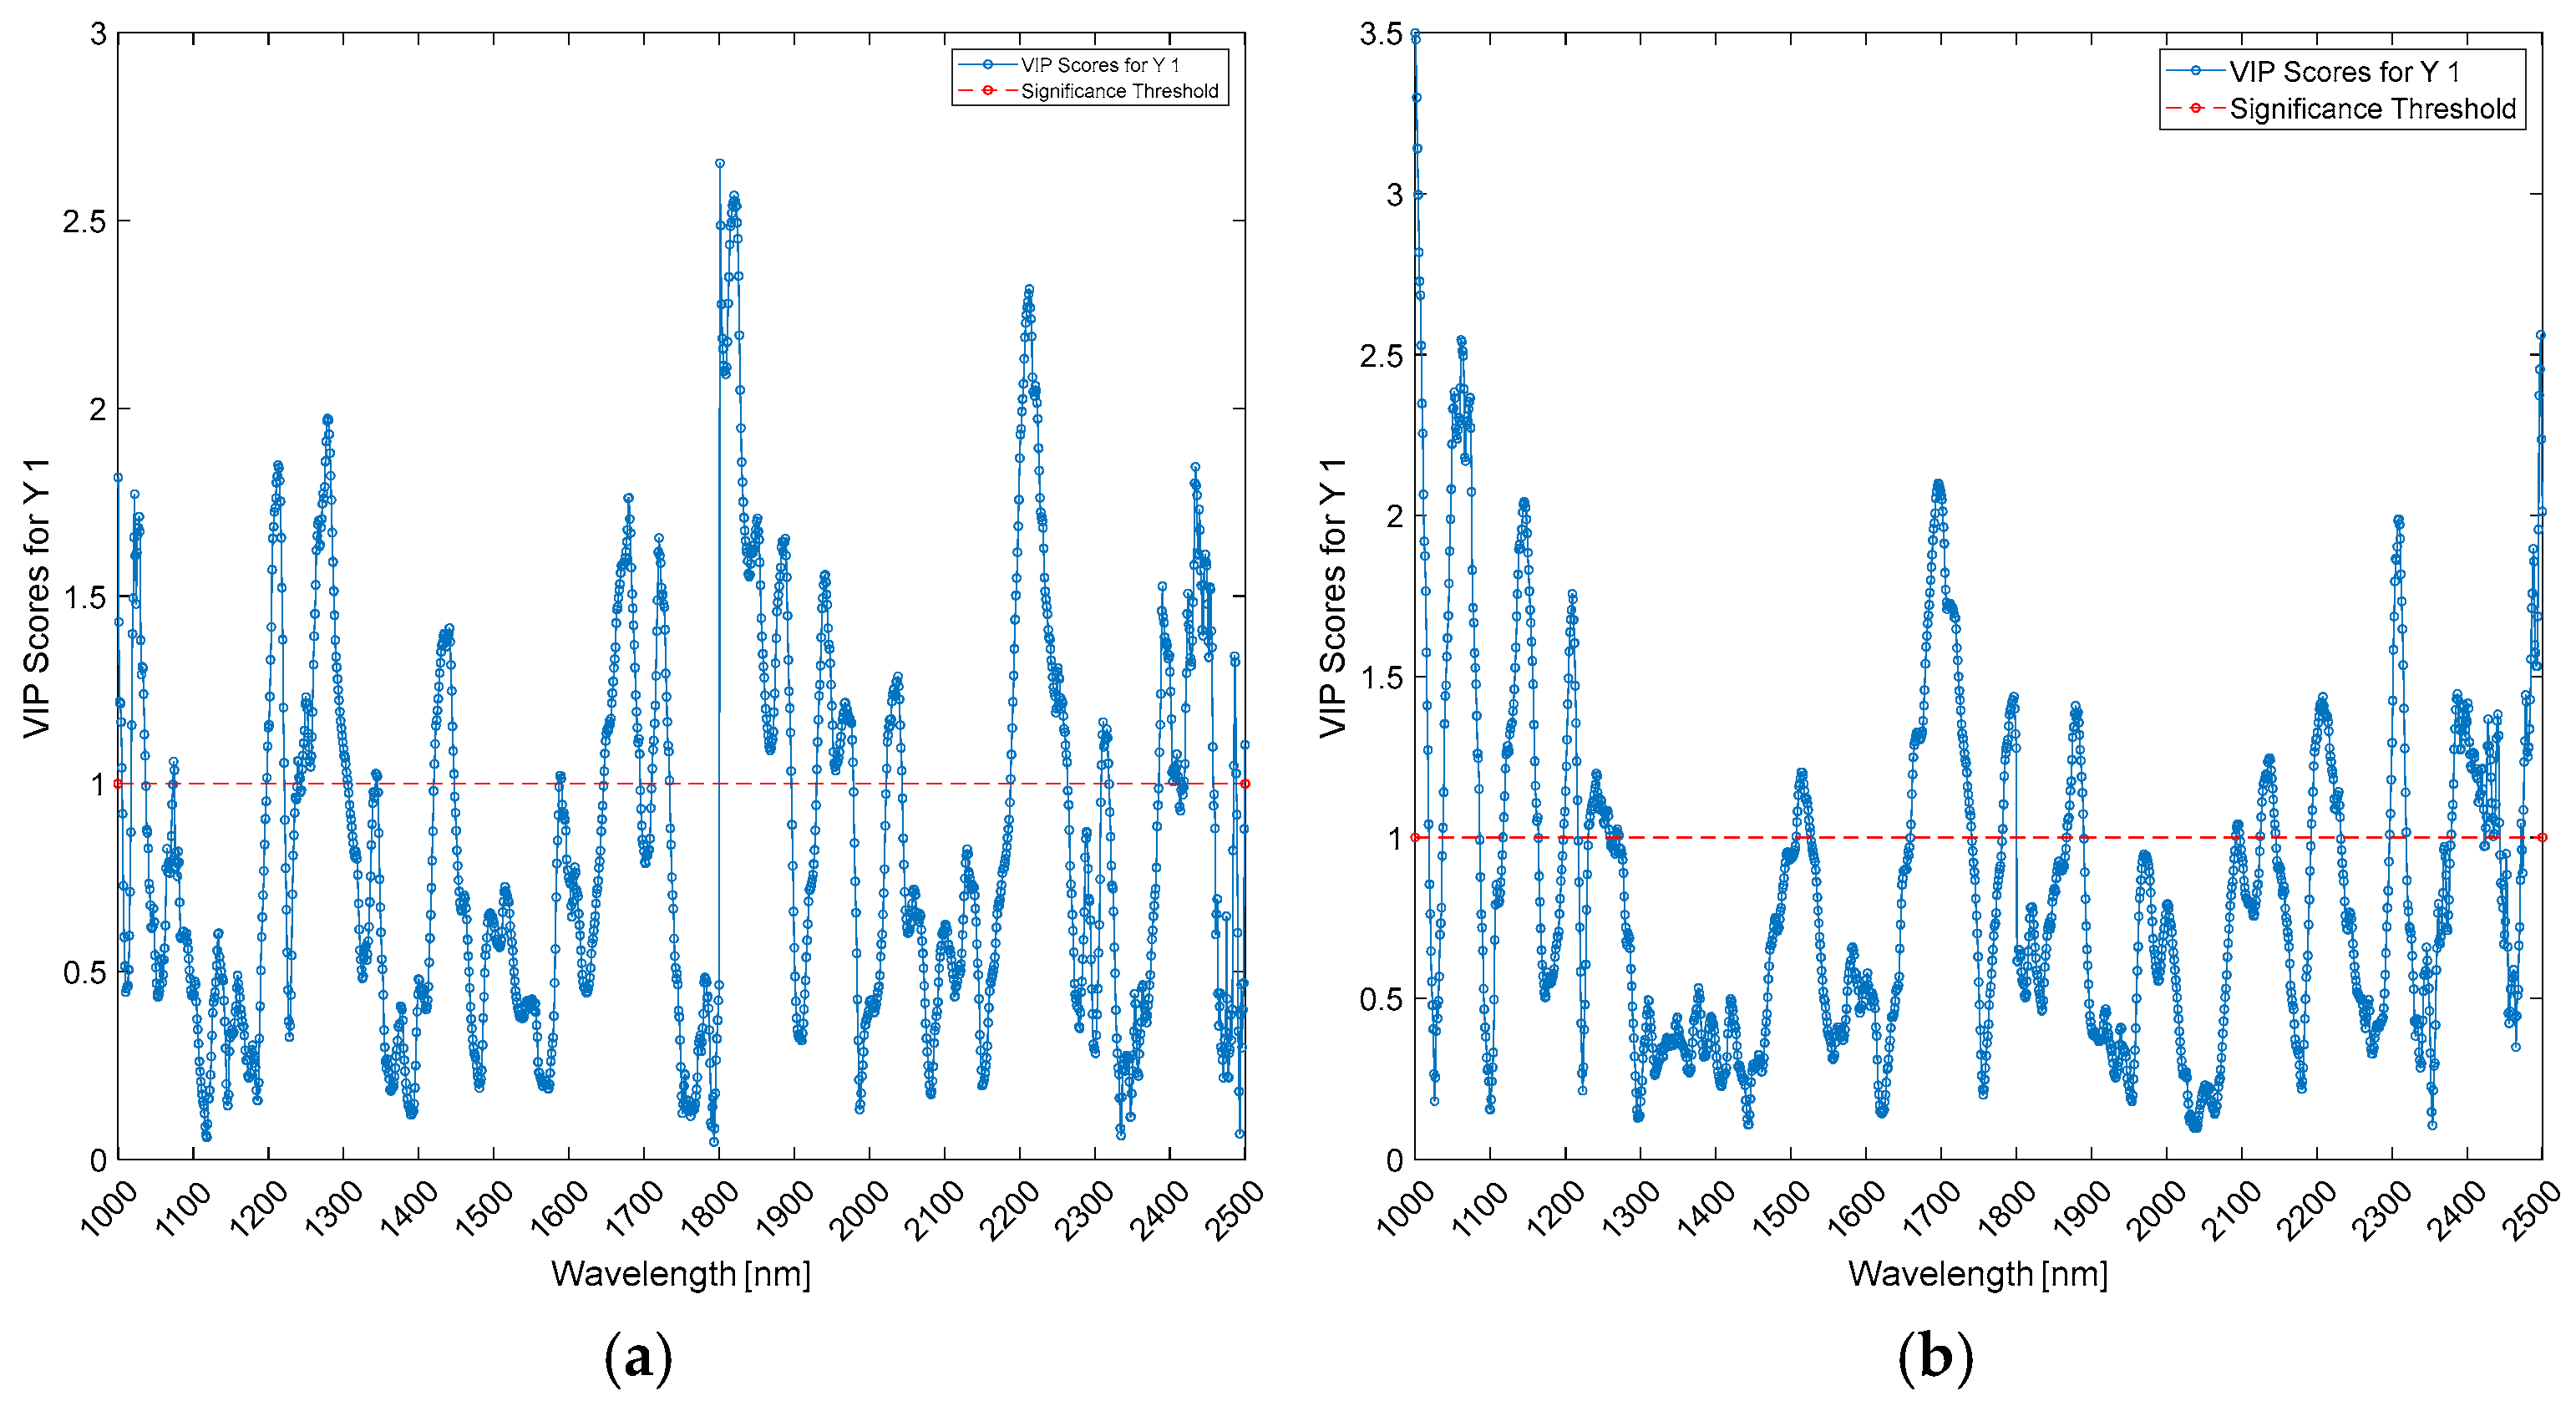
Variable Importance in Projection (VIP) scores were calculated for each classification model to assess the contributions of individual variables to the classification. VIP scores provide a means of evaluating the importance of each variable within the model’s projection [27]. Variables with VIP scores close to or greater than 1 are considered significant. VIP scores were compared across all modeled classes, with particular attention to variables scoring > 1. Peaks in VIP scores, especially those exceeding 2, were identified as critical in pinpointing significant variable ranges.
Additionally, we developed Partial Least Squares (PLS) regression models to assess the correlation between reflectance spectra and anthropometric variables such as age and Body Mass Index (BMI). PLS is a chemometric method commonly used when predicting a set of dependent variables from a large set of independent variables [28]. In more detail, the PLS regression models set up are as follows:
  • ET biceps (n = 800) vs. Normal biceps (n = 800) for age;
  • ET biceps (n = 800) vs. Normal biceps (n = 800) for BMI;
  • ET triceps (n = 800) vs. Normal triceps (n = 800) for age;
  • ET triceps (n = 800) vs. Normal triceps (n = 800) for BMI;
  • ET brainstem (n = 320) vs. Normal brainstem (n = 320) for age;
  • ET brainstem (n = 320) vs. Normal brainstem (n = 320) for BMI;
  • ET cortical (n = 320) vs. Normal cortical (n = 320) for age;
  • ET cortical (n = 320) vs. Normal cortical (n = 320) for BMI.
The PLS regression models were calibrated and cross-validated using the VBs cross-validation method to determine the optimal number of latent variables (LVs). Two key parameters were used to evaluate model performance: the Root Mean Square Error (RMSE), which measures the difference between predicted and observed values, and the coefficient of determination (R2), which assesses the model’s goodness of fit. Special attention was also given to the VIP scores from each model, indicating the contribution of each variable to the explanation of variability in the dependent variable.

3. Results

Spectra were collected at extracranial and cranial sites without discomfort. For each participant, 140 acquisitions were collected (100 from extracranial and 40 from cranial sites) for a total of 3240 spectra composing the main dataset (1600 from extracranial sites, 640 from cranial sites).
Visual inspection of the spectra grand averages revealed that they differed between groups and sites. The main differences in the spectra were observed at wavelengths around 1100 nm, 1300–1400 nm, 1700 nm, and around 2200 nm. Figure 1 shows the average reflectance spectra of the analyzed sites.
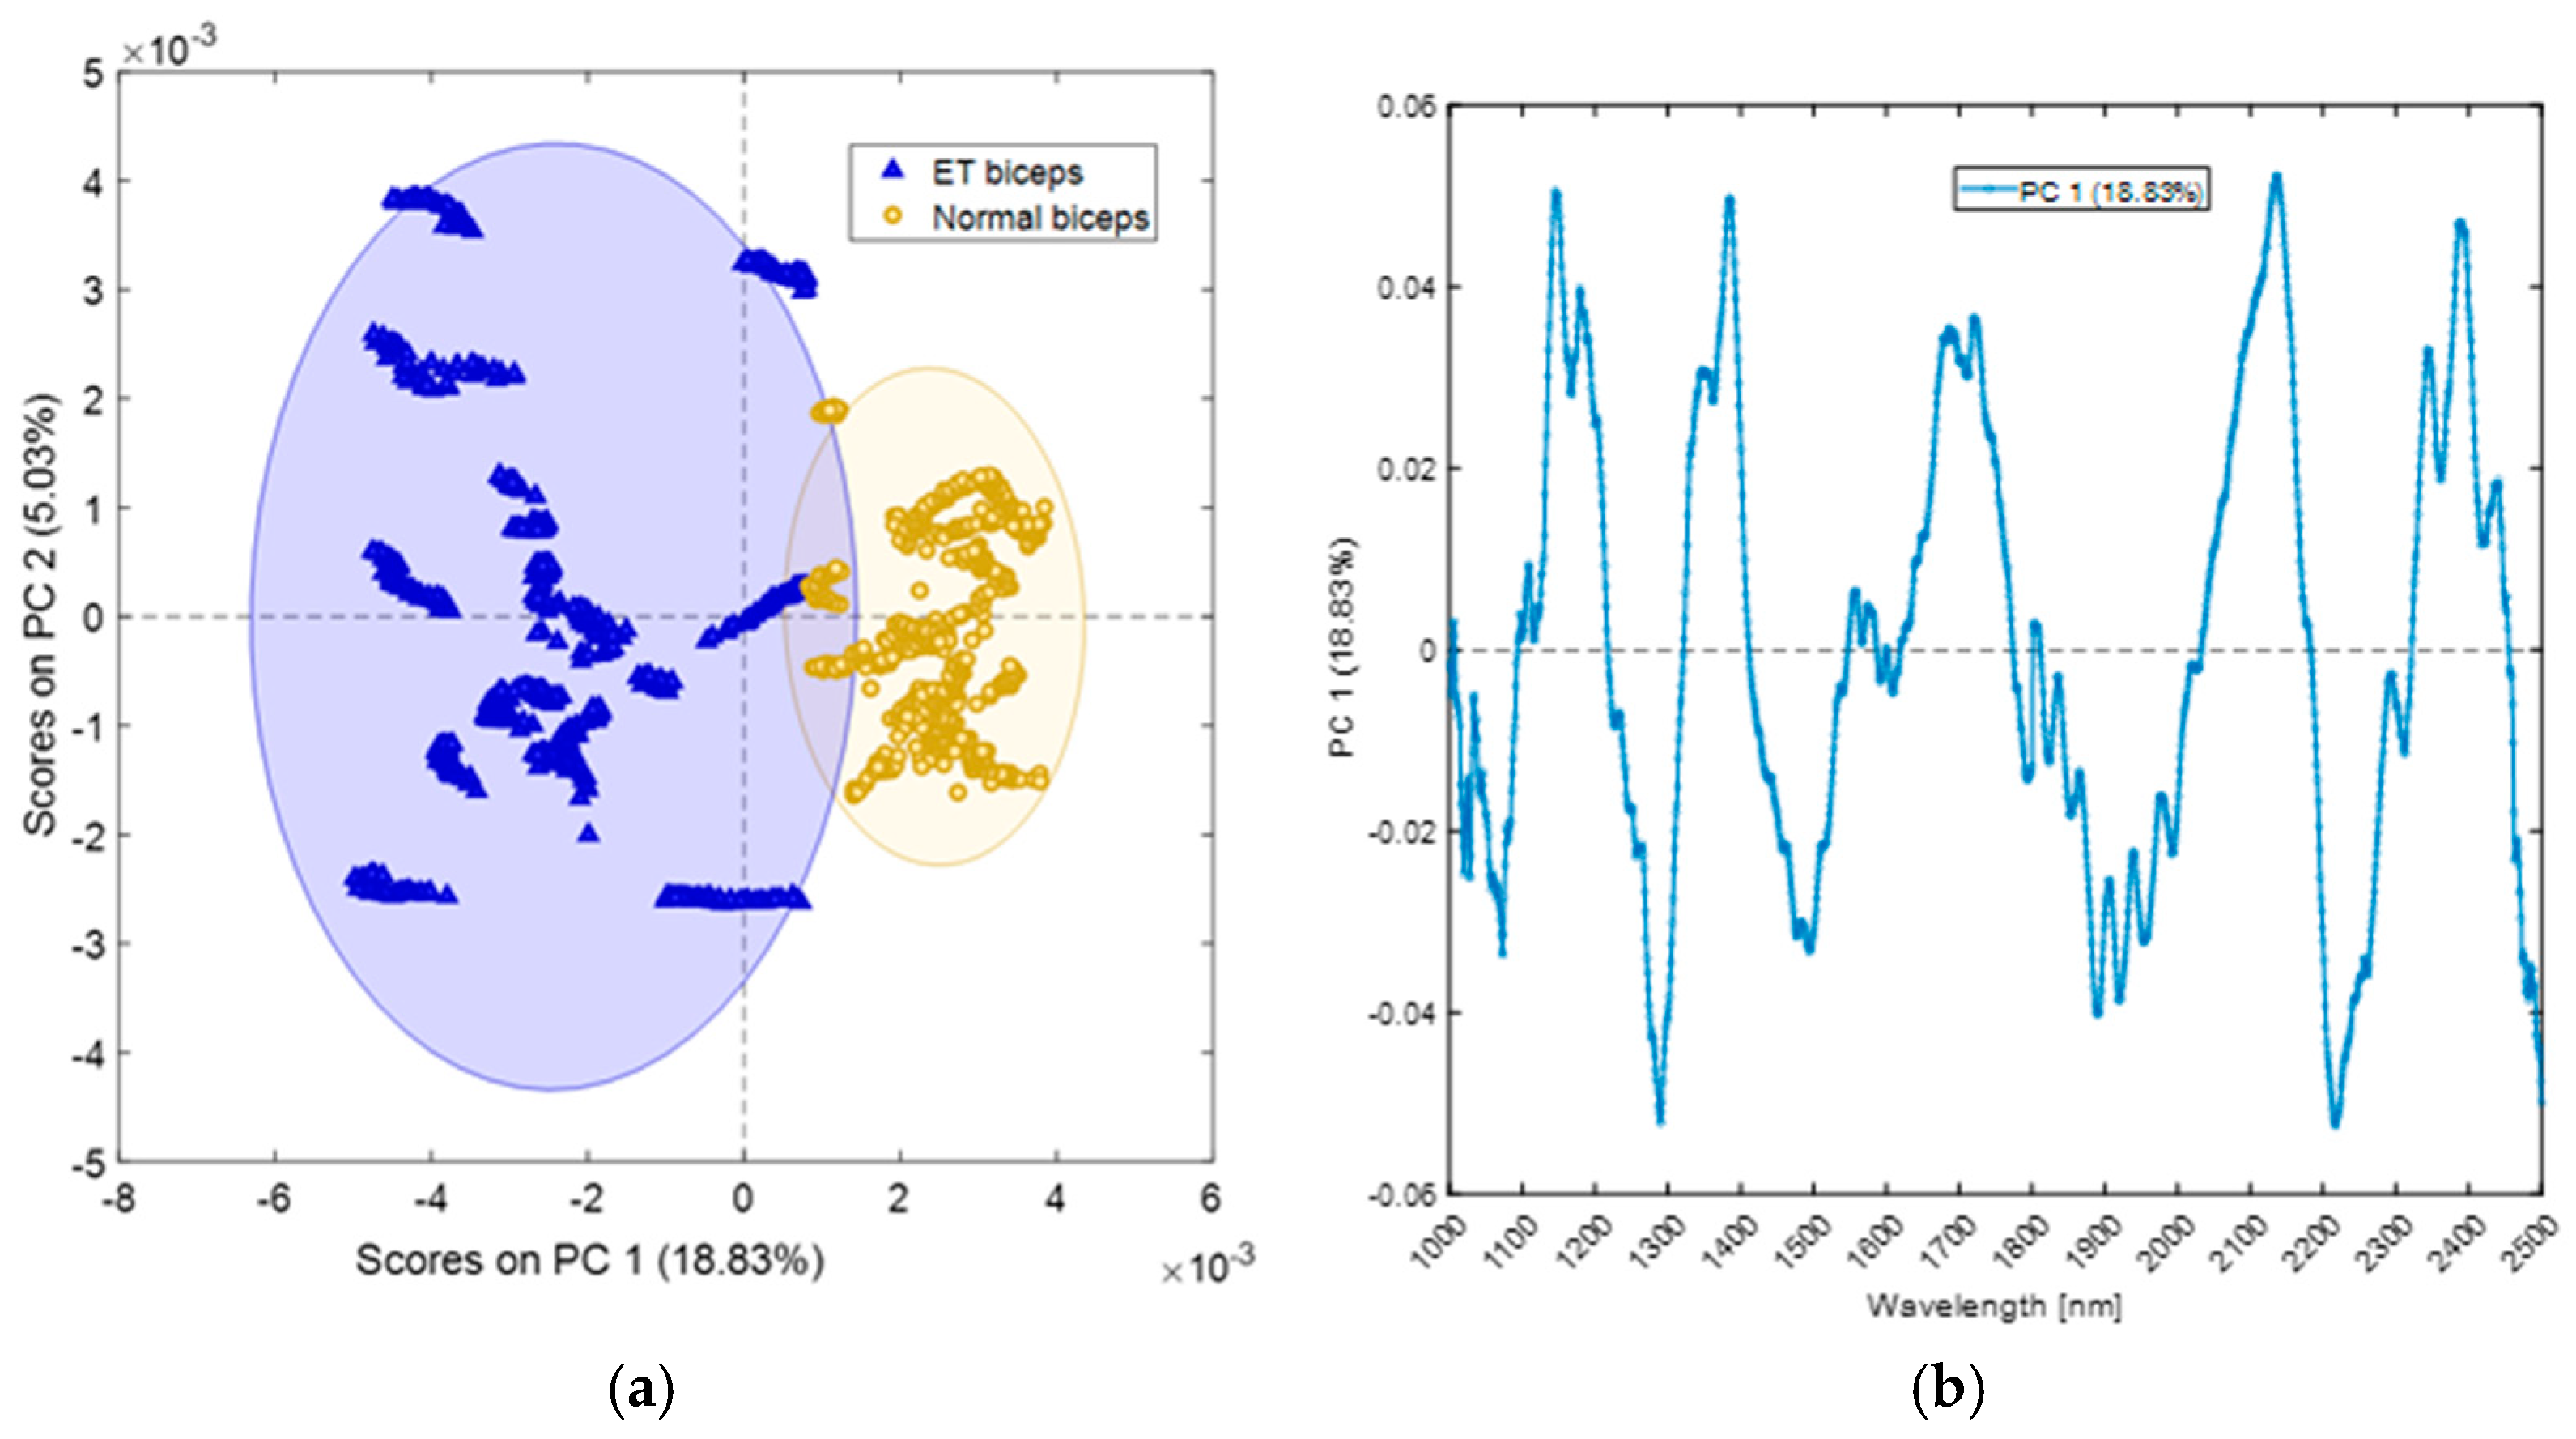
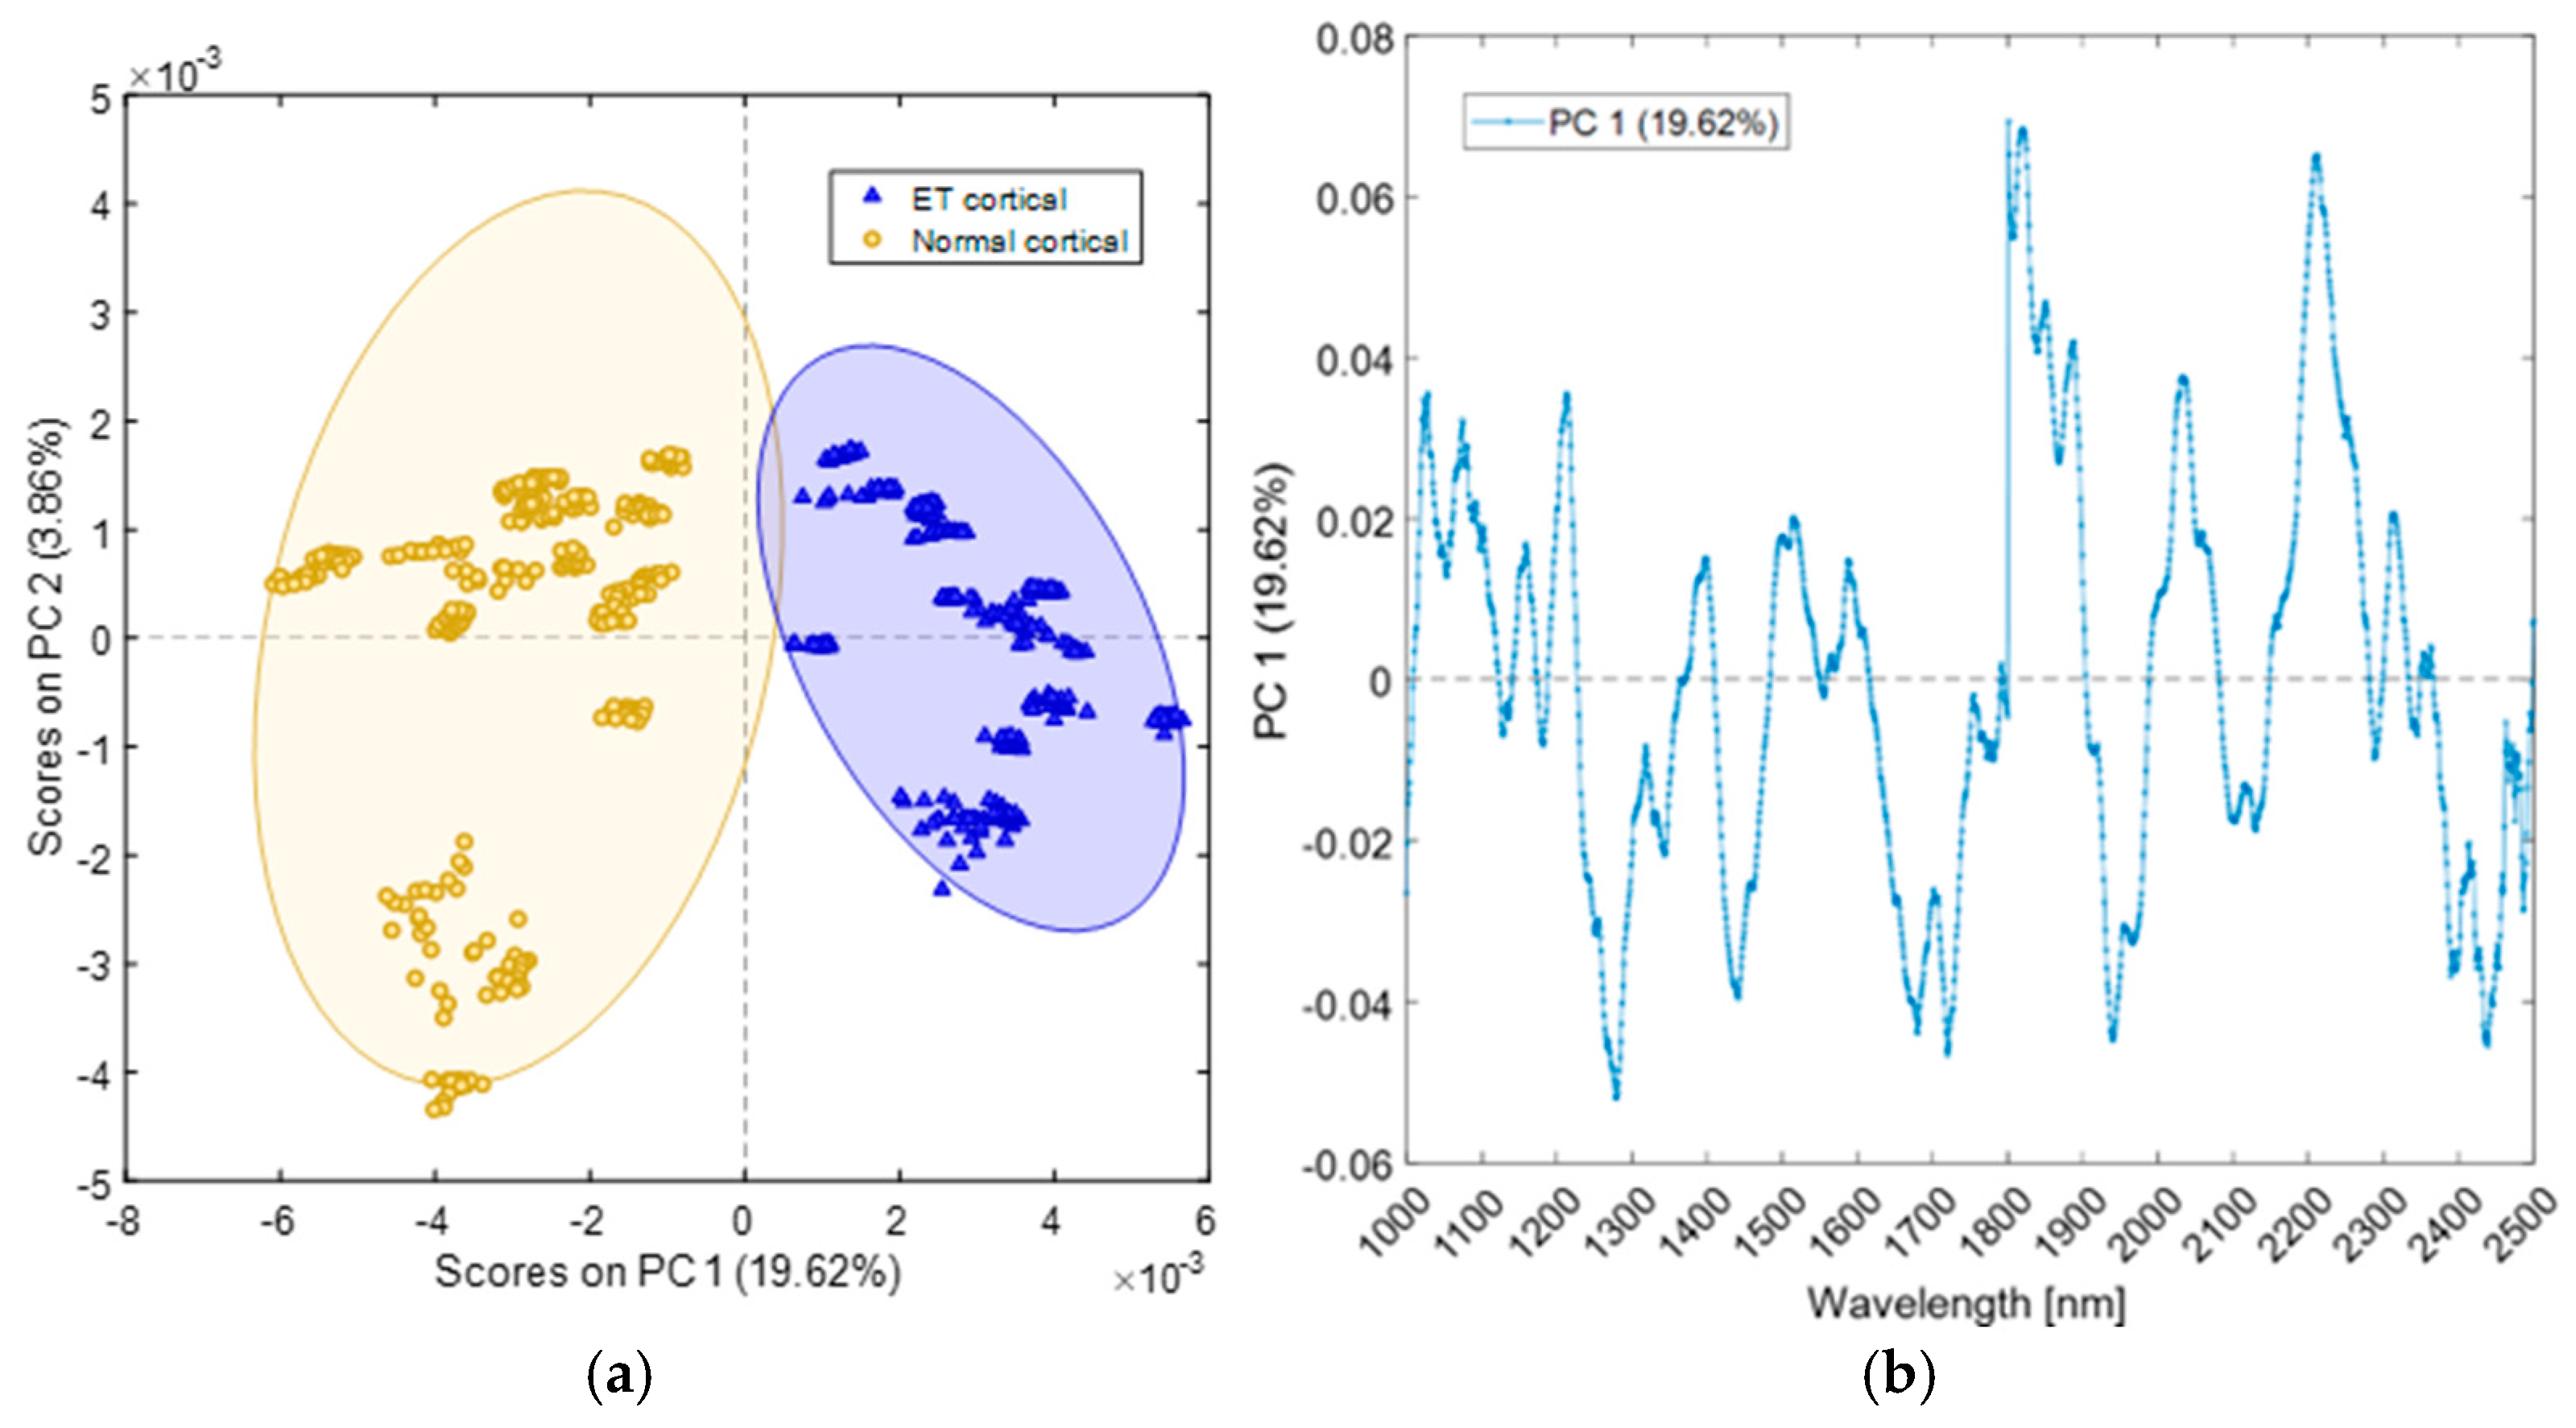
The PCA carried out on the dataset relating to the pairs of the investigated sites showed that the scores were grouped based on the class pairs “ET biceps/Normal biceps”, “ET triceps/Normal triceps”, “ET cortical/Normal cortical”, and “ET brainstem/Normal brainstem”. In all cases, PC1 resolved most of the variance among all analyzed classes. PCA score plots showed that the explained variance (EV) for PC1, in the distinct pairs of extracranial sites was 18.83% for the extracranial biceps site (Figure 2a), 17.82% for the extracranial triceps site (Figure 3a), 19.62% for the cranial cerebral site (Figure 4a), and 29.71% for the brainstem site (Figure 5a).
Partial Least Squares Discriminant Analysis (PLS-DA) was performed to explore the predictive relationships between input and output variables, enabling efficient classification of spectra from extracranial and cranial sites. The Kennard–Stone (K-S) method was used to select samples that best represent the dataset’s variability and to determine the calibration set for PLS-DA analysis. The dataset was split, with 70% allocated for training and 30% for testing the PLS-DA model.
All four models (“ET biceps/Normal biceps,” “ET triceps/Normal triceps,” “ET cortical/Normal cortical,” and “ET brainstem/Normal brainstem”) demonstrated perfect classification performance (Table 2), with sensitivity, specificity, precision, and accuracy all equal to 1, and an error rate of 0 in calibration (C), cross-validation (CV), and prediction (P). VIP scores exceeding 2 were fundamental in identifying the most important variable ranges for distinguishing between tissues. VIP score plots for “ET biceps/Normal biceps” and “ET triceps/Normal triceps” are shown in Figure 6, while those for “ET cortical/Normal cortical” and “ET brainstem/Normal brainstem” are shown in Figure 7.
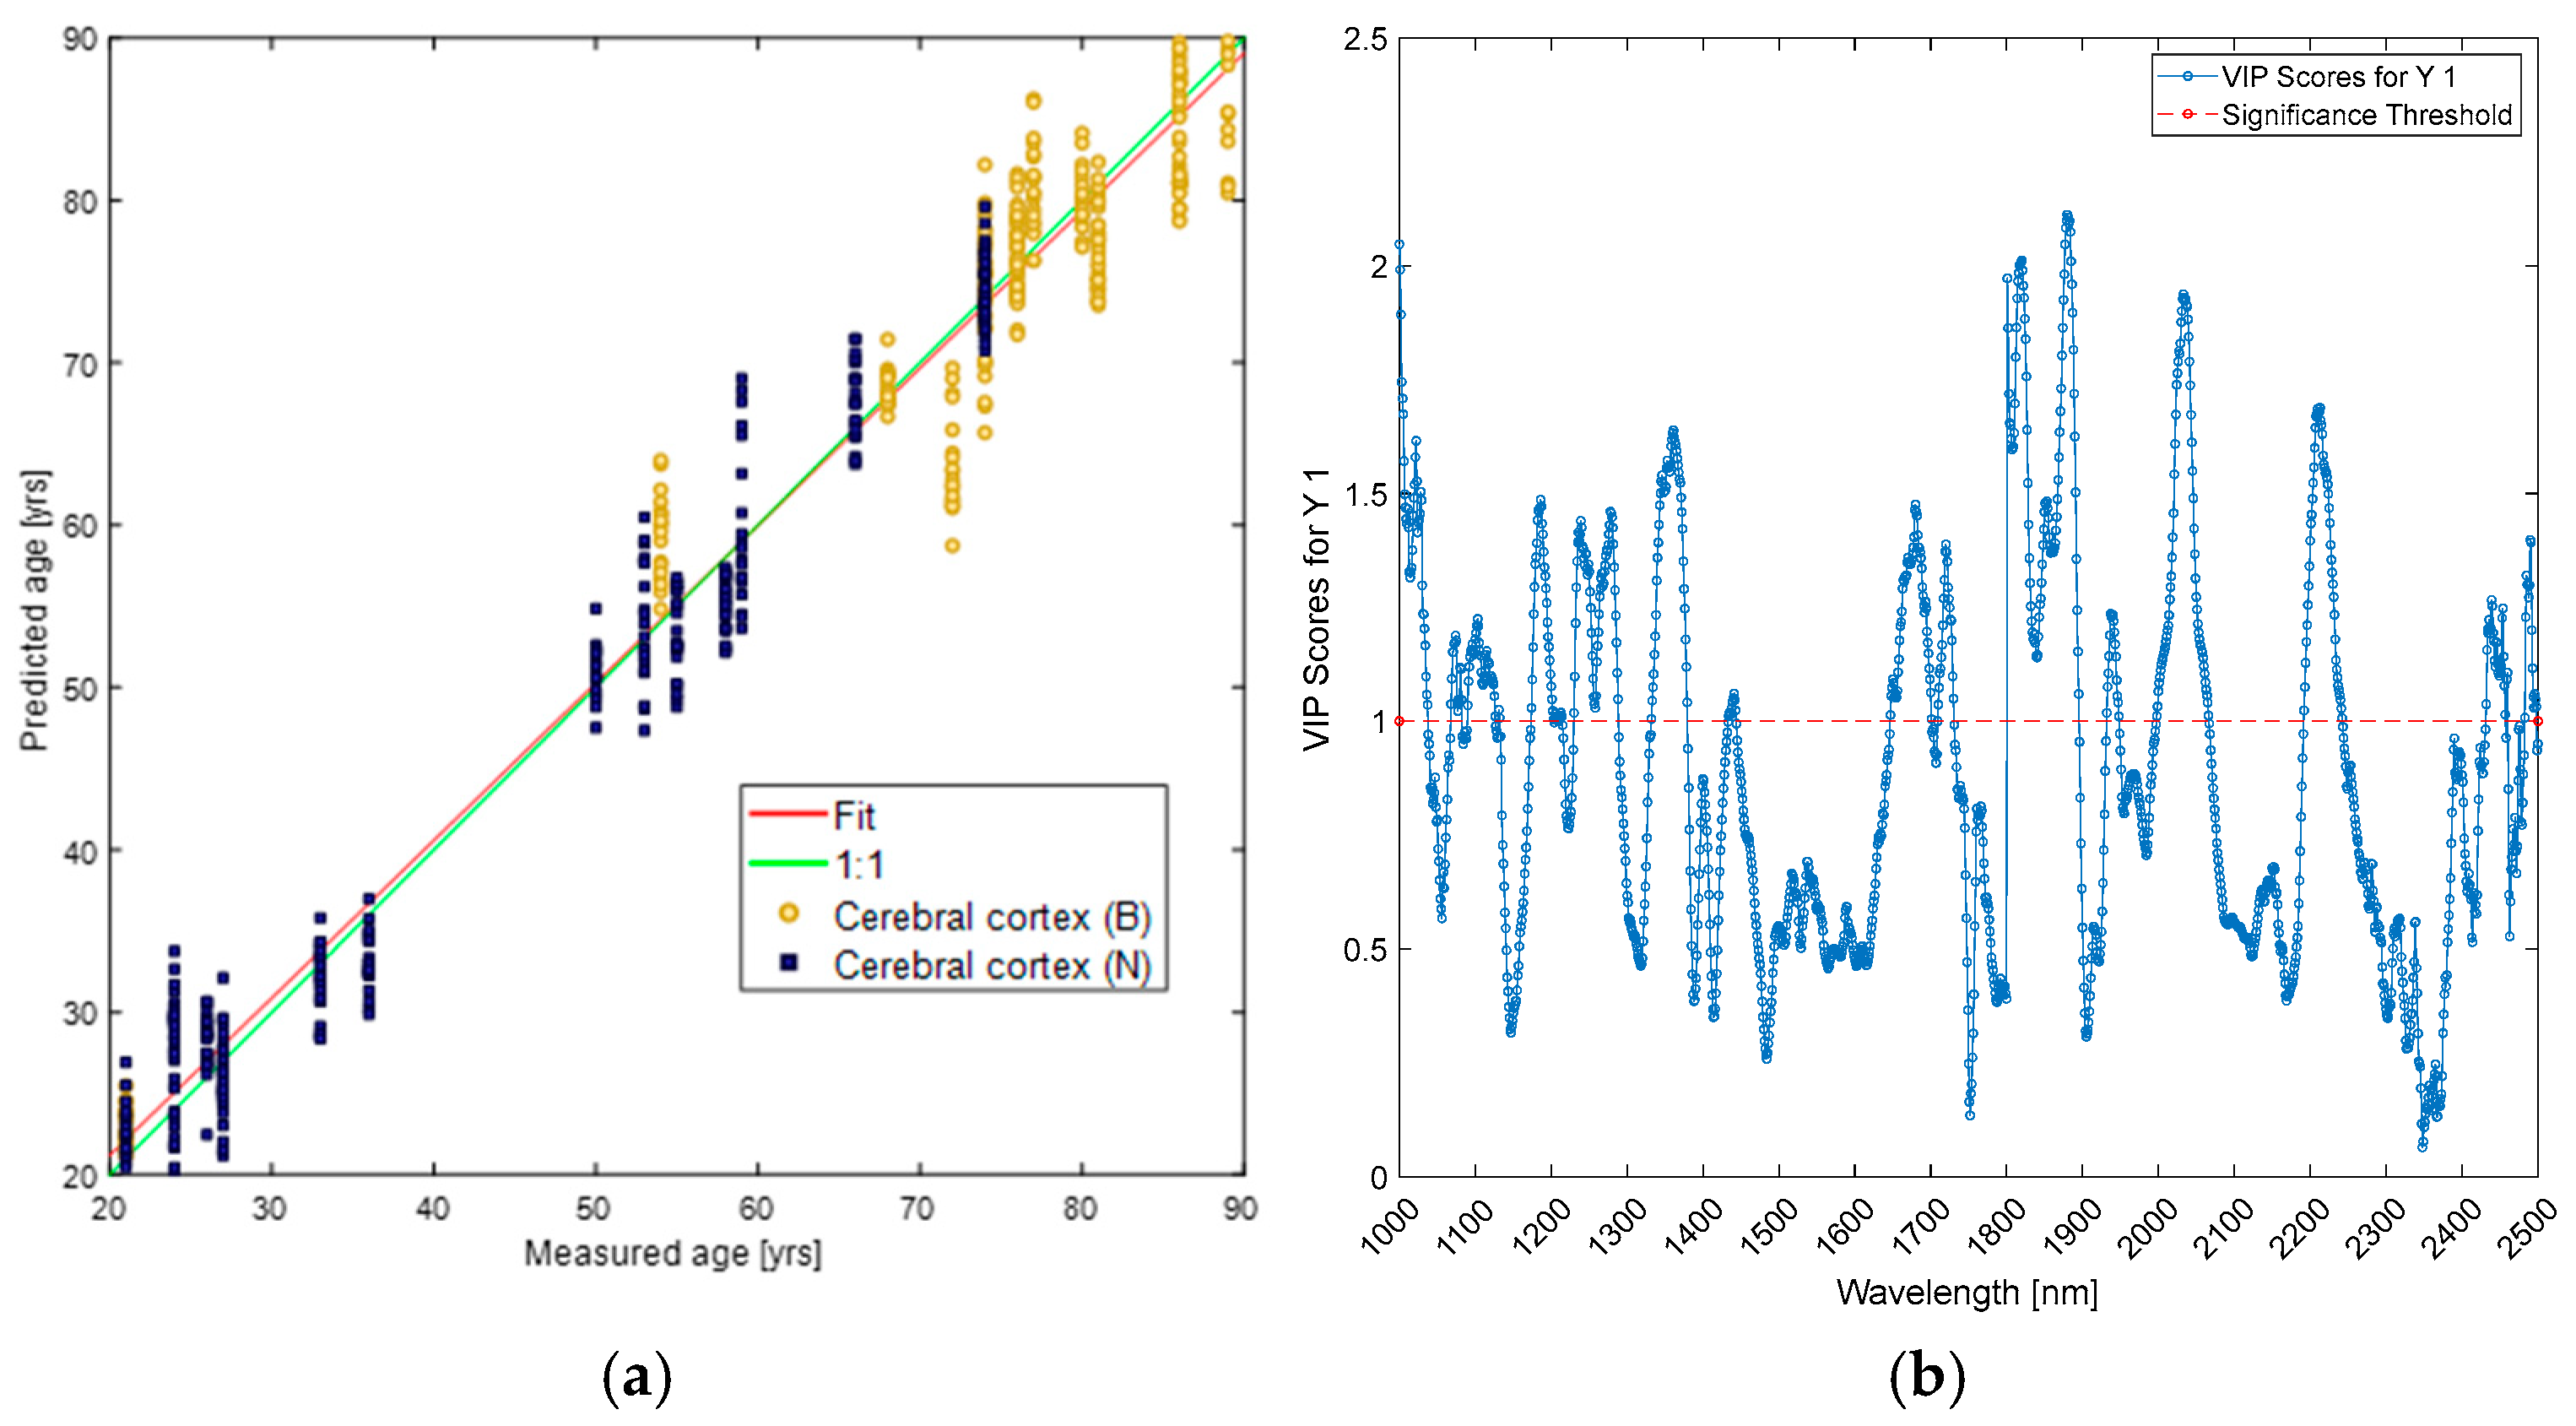
PLS regression models based on patient age demonstrate strong predictive accuracy, with high R2 values (Table 3). For the ”ET biceps/Normal biceps” model, the R2 is 0.959 for calibration (Cal) and 0.958 for cross-validation (CV), with RMSEC and RMSECV both equal to 5. The ”ET triceps/Normal triceps” model shows R2 values of 0.971 in calibration and 0.967 in cross-validation (RMSEC = 4, RMSECV = 4). Similarly, for the ”ET cortical/Normal cortical” model, the R2 is 0.970 in calibration and 0.966 in cross-validation (RMSEC = 4, RMSECV = 4). The ”ET brainstem/Normal brainstem” model yields an R2 of 0.964 in calibration and 0.955 in cross-validation (RMSEC = 4, RMSECV = 5).
PLS models based on patient BMI also show significant R2 values. For ”ET biceps/Normal biceps,“ the R2 is 0.827 in calibration and 0.821 in cross-validation (RMSEC and RMSECV both equal to 2). The ”ET triceps/Normal triceps” model reports R2 values of 0.851 for calibration and 0.833 for cross-validation (RMSEC = 2, RMSECV = 2). The ”ET cortical/Normal cortical” model achieves an R2 of 0.954 in calibration and 0.945 in cross-validation (RMSEC = 1, RMSECV = 1), while the ”ET brainstem/Normal brainstem” model shows R2 values of 0.910 in calibration and 0.875 in cross-validation (RMSEC = 1, RMSECV = 1).
Figure 8, Figure 9, Figure 10 and Figure 11 show the regression plots and corresponding VIP scores for the PLS models based on age and BMI for the following comparisons: ”ET biceps/Normal biceps” (Figure 8), ”ET triceps/Normal triceps” (Figure 9), ”ET cortical/Normal cortical” (Figure 10), and ”ET brainstem/Normal brainstem” (Figure 11).
Table 4 and Table 5 summarize the VIP score peaks for both the PLS-DA models and the PLS regression models (which incorporate BMI and age as variables). As shown in Table 4, the wavelengths identified as most relevant from the VIP score peaks in the PLS-DA models for extracranial sites (biceps/triceps) do not overlap with those in the VIP scores of the PLS regression models.
For the biceps site, the PLS-DA model identifies relevant peaks at 2200–2250 nm (linked to combinations of N-H and O-H groups) and at 2500 nm (associated with overtones and combinations of C-H, N-H, and O-H bonds). In contrast, the PLS regression models reveal significant peaks at 1150–1200 nm, 1350 nm, 1900 nm, and 2500 nm. The 1150–1200 nm region corresponds to the second overtone of C-H bonds, typically related to lipids and fatty acids. The peak at 1350 nm suggests molecular absorption due to C-H stretching vibrations, which may also indicate lipid content. The 1900 nm peak is indicative of water content, potentially influenced by amide and carbonyl groups (C=O).
For the triceps site, the PLS-DA model highlights peaks at 1350–1400 nm (C-H stretching vibrations), 1800 nm (first overtone of C-H stretching), and 2500 nm. The corresponding PLS regression models show peaks around 1150 nm, 1350–1400 nm, and 1900 nm. The main overlapping region between the VIP score peaks of the PLS-DA model and the PLS regression model (age) for the extracranial triceps site is found around 1350–1400 nm.
Table 5 summarizes the wavelengths from the VIP scores of PLS-DA and PLS regression models applied to cranial sites, specifically the cerebral cortex and mid-brain, for ET patients and healthy controls. In the cerebral cortex, significant peaks related to age predictions are observed between 1800 and 1850 nm and around 2200–2250 nm, corresponding to molecular absorptions of O-H, N-H, and C-H bonds. Similarly, in the mid-brain, important peaks for BMI predictions are noted between 1000 and 1100 nm, particularly around 1050 nm, which are associated with second-overtone vibrations of C-H bonds linked to lipids and proteins.
Peaks around 1850–1900 nm in both the cortex and mid-brain models suggest molecular absorptions related to water and amide groups. Additionally, the peak at 2500 nm, observed in the BMI-related models for both the cerebral cortex and mid-brain, may indicate broader molecular combinations and complex biochemical structures.

4. Discussion

This study shows that non-invasive in vivo NIR reflectance spectroscopy in humans discriminates the clinical condition of the subjects sampled, thereby identifying ET patients. This has been made possible by the distinct optical properties of the analyzed body volumes at extracranial and cranial sites.
In general, the spectral differences between patients with ET and healthy subjects can be attributed to several specific tissue properties that influence optical characteristics. One of the most significant factors is the density of neurons, as patients with ET have been observed to exhibit a notable reduction in the number of Purkinje cells within the cerebellum [29]. This alteration impacts the scattering and absorption characteristics of the tissue, resulting in discernible NIR reflectance patterns distinct from those observed in healthy individuals. Furthermore, cerebellar activity is a contributing factor [30], with heightened activation during tremor episodes resulting in alterations in blood flow and oxygenation, which subsequently impact NIR reflectance. Furthermore, chronic alterations in neuronal activity may also modify the extracellular matrix [31], affecting tissue hydration and NIR light reflection.
Pathological neural oscillations associated with ET [32] can influence ionic concentrations and the metabolic state of neurons [33], which in turn affects the optical properties of tissues. Additionally, alterations in myelination [34], resulting from neurodegenerative processes, contribute to the formation of distinct NIR reflectance spectra in patients with ET. Furthermore, cortical atrophy in specific brain regions, which is correlated with tremor severity, affects how NIR light interacts with the tissue. Finally, dysfunctional connectivity in the cerebello-thalamo-cortical circuit alters brain dynamics [35], which in turn affects NIR reflectance patterns.
The following sections discuss possible specific factors influencing the optical properties of tissues explored by NIR light at cranial and extracranial sites.

4.1. Extracranial Sites

The PCA score plot (Figure 2a) visually differentiates the spectra of ET biceps from normal biceps, showing distinct group separation along the first two principal components (PC1 and PC2). PC1 explains 18.83% of the total variance, while PC2 accounts for 5.03%. The loadings plot (Figure 2b) for PC1 identifies key wavelengths contributing most to the separation. Notable peaks are observed around 1150 nm and 1800 nm, related to CH, CH2, and CH3 overtone absorption, and a distinct peak at 1480–1500 nm, linked to NH overtone absorption. Peaks at 1380–1400 nm suggest influences from OH and CH overtones, with combination bands near 2150 nm (NH+OH) and 2400 nm (CH+CH, CH+CC) further highlighting relevant spectral regions.
Similarly, the PCA score plot (Figure 3a) shows clear group separation between ET triceps and normal triceps spectra. PC1 explains 17.82% of the variance, while PC2 accounts for 4.72%, helping to differentiate the ET and normal groups. The loadings plot (Figure 3b) reveals the wavelengths contributing most to this separation, with key peaks at 1150 nm and 1800 nm (corresponding to the second and first overtones of CH, CH2, CH3), 1380–1400 nm (first overtone of OH and CH), 1480–1500 nm (first overtone of NH), and combination bands around 2150 nm (NH+OH) and 2400 nm (CH+CH, CH+CC). These features suggest molecular variations involving NH, OH, and CH groups help distinguish ET from normal triceps spectra.
The wavelengths reported are associated with reflectance minima corresponding to specific absorbing groups. In the NIR region, the absorption of molecules arises from the absorption of overtones and the combination of stretching-flexing vibrations of atomic groups such as CH, OH, and NH, which include hydrogen atoms. Overtones and combination bands are types of vibrations correlated with fundamental vibrations observed in the infrared region. Combination bands are the sum of multiple fundamentals from different vibrations, typically occurring at lower energies than overtones [36]. Therefore, NIR reflectance spectra turn back to the intimate composition of the sample irradiated.
Specifically, the spectra collected from extracranial sites represent average values over the volume probed by NIR photons in the arm, that includes skin, fat, vessels, muscles, and bones, all tissues having distinct vascularization. Analysis of the spectra collected from “biceps” and “triceps” sites differ in both patients and controls, confirming our previous observations in different groups of normal subjects and patients with upper motor neuron syndrome [5,6]. As extensively discussed previously, the spectral differences emerging between the extracranial sites are mainly attributable to the underlying muscular tissue which manifests significant peculiarities in the biceps and triceps. In these muscles, architecture (parallel in biceps vs. bipennate in triceps) [37,38], fiber composition (fewer fast-twitch muscle fibers in biceps) [39,40], sarcomere length and optimal fascicle length [41], and intramuscular connective tissue [42] differ.
Even more interesting, the spectral differences which emerged from the two extracranial sites also distinguish normal subjects from ET patients. In the latter, one factor contributing to the specificity of the optical properties of muscles may be related to their rhythmic activation, that involves complex molecular and physiological processes at the neuromuscular junction, the muscle membrane (i.e., ion channels), calcium ion regulation, the energy metabolism, and gene expression and adaptation. Rhythmic release of acetylcholine at the neuromuscular junction requires an intricate molecular signaling pathway [43], and the generation of action potentials at the sarcoplasmatic membrane that initiate each tremor muscle contraction involves a coordinated interplay of ion channels [44], leading to the repetitive firing of action potentials. Calcium ions that are essential for muscle contraction need to be intermittently released from the sarcoplasmic reticulum [45], to bind other muscle proteins leading to muscle contraction [46]. All these events require energy, and the process of converting energy stored in adenosine triphosphate into mechanical work contributes to sustaining rhythmic muscle contractions [47]. Prolonged or repetitive muscle activation also leads to upregulation or downregulation of specific genes associated with muscle function, adaptation, and, in some cases, hypertrophy or atrophy [48]. In ET patients, rhythmic muscle activation depends on the supraspinal drive their motoneurons receive [49]. When surface electromyography (EMG) is used to analyze the neural impulse to muscles, ET patients reveal highly synchronized motor units due to strong synaptic input to motor neurons at the tremor frequency [50]. Increased synchronization of motor units, and thus greater tremor severity, is correlated with greater central and peripheral muscle fatigue [51]. The morphology of the EMG signal also differs in ET patients, possibly reflecting specific electro-mechanic coupling [52].
Rhythmic muscle activation therefore coexists with molecular changes in muscles, and this relationship is bidirectional, as observed in patients harboring dominant missense mutations in the MYBPC1 gene (myosin binding protein C gene on chromosome 12 encoding slow myosin) [53]. The affected individuals manifest a clinical phenotype consisting of mild myopathy and persistent kinetic, pronounced, high-frequency tremor that is invariant with weight loading, a finding typical of tremors generated by a central pacemaker. The authors inferred that in these patients the tremor-initiating event is located at the level of the sarcomere, and through a central loop, it synchronizes and oscillates muscle activity to generate tremor [53]. Therefore, the distinct optical properties collected from the extracranial sites in ET patients may relate to the molecular changes induced or sustained by the rhythmic muscular activation. Alternatively, previously unknown muscle changes intrinsic to the ET neurological condition may have come to (NIR!) light.

4.2. Cranial Sites

Cranial sites were located on the scalp (cerebral site) and the temple region (brainstem site) contralateral to the most trembling limb from which the extracranial spectra were acquired.
In a previous study [6], we investigated radiation propagation from the probe of our instrument on both the ventral and dorsal aspects of an arm. The fiber-optic probe geometry (35° angle) and direct skin contact allowed NIR photons to penetrate several centimeters, reaching tissues like skin, fat, vessels, muscles, and possibly bone. Monte Carlo simulations in MATLAB modeled light propagation in a 5 cm × 5 cm × 5 cm voxel space, using optical properties from previous studies. These simulations demonstrated that light penetrated the muscle through varying fat layer thicknesses (0.5 cm to 1.4 cm). Full details are in the supplementary information of our previous publication [6].
The distance between the midbrain and the scalp varies depending on individual anatomy, but can be roughly estimated by adding the thicknesses of the layers in between: scalp (~5.96 mm), skull (~8.26 mm), dura mater (~0.36 mm), cerebral cortex (~2–4 mm), and white matter/subcortical structures (~20–30 mm). Arachnoid and pia mater are very thin and often negligible. Overall, the distance from the scalp to the midbrain is approximately 35–45 mm, though this value can vary based on individual factors.
For brain oximetry, NIR methods have been used since the 1980s to monitor cerebral oxygenation in animals [54,55] and humans [56,57,58,59], with advancements allowing measurement across optical densities up to 8–9 cm. Based on our Monte Carlo study and the existing literature, we are confident that our method enables NIR radiation to reach the midbrain.
The scores plot (Figure 4a) shows clear separation between the ET and Normal groups, indicating that the spectra collected at the cranial/cortical site effectively distinguish between these two subject classes. The PC1 loadings plot (Figure 4b) highlights notable peaks at 1280 nm and 1800 nm, which are attributed to the second overtone of CH and the first overtone of CH, respectively. The peak at 1800 nm is also linked to the first overtone of SH, associated with various compounds containing thiol groups. Another prominent peak around 1950 nm is attributed to C=O (second overtone), H2O, and CONH2 groups. The peak near 2200 nm, where band combinations occur, is associated with CONH2 groups as well as NH+OH and CH+CH combinations. Lastly, the multiple peaks around 2400 nm are likely due to molecular vibrations or electronic transitions in certain organic compounds.
To suppress possible biases arising from skin color/texture characteristics (especially hair) at the scalp site, the information coming from the visible spectrum was removed in the post-acquisition processing. At the scalp site, under the skin, there is a modest amount of adipose, fibrous, and connective tissues, blood vessels, nerves, cranial bones, meninges, corticospinal fluid, and brain (cortex and white matter). Since—to our knowledge—no specific difference between normal subjects and ET patients has been reported on the structure of extra-cerebral cranial tissues, we reasoned that the between-group spectral differences depend on the optical properties of the underlying nervous system, i.e., the cerebral cortex, white matter, or both.
At the structural level, most postmortem neuropathological studies have sampled regions of the cerebellum [60]. One study performed on 24 subjects without dementia or other movement disorder who met clinical criteria for ET and came to autopsy reported incidental tauopathies in some patients and cortical Lewy bodies in others in addition to cerebellar pathology [61]. Another study aiming to assess quantitatively the tau burden in ET found that among cognitively normal elders and subjects with mild cognitive impairment, ET patients had more NFT-positive neurons in the neocortex than controls [62]. Therefore, the greater pre-dementia tau burden in ET may be one contributor to the specific optical properties of the cerebral cranial site in our patients.
In addition to cerebellar abnormalities, neuroimaging studies using voxel-based morphometry and voxel-wise analysis revealed scattered areas of cerebral atrophy in ET patients [63]. In predominant intention tremor, the grey matter is found to be increased in the temporo-parietal regions, in the right middle occipital cortex, and in the higher order visuospatial processing areas [64]. Neuroimaging techniques that examine axonal organization and neuronal circuitries and that provide measures of axon and myelin density abnormality [65] have detected widespread abnormalities in the white matter of motor and non-motor areas of the frontal and temporo-parietal cortices in ET patients [66]. In non-demented ET patients, diffusion tensor imaging microstructural changes have been shown in the dorsolateral and ventrolateral prefrontal cortex, posterior cingulate cortex, precuneus, and hippocampus, as well as in the white matter of major bundles, including the corpus callosum, the anterior thalamic radiation, the longitudinal fasciculus, and the fronto-occipital fasciculus [67]. Combining cortical volumetric measures and a machine learning model allowed researchers to establish that cortical atrophy in frontotemporal regions prevails in ET patients with rest tremor compared to those with classic ET [68]. These subtle structural abnormalities outside the cerebellum revealed by neuropathological and neuroimaging studies in ET patients may be another contributor to the specific optical properties of the cerebral cranial site in our patients.
The scalp position where we positioned the NIR probe for the cerebral site was overlying the sensorimotor cortices. These areas have been repeatedly reported as involved in ET pathophysiology [69,70,71]. It has long been known that the primary motor cortex belongs to the central oscillatory network that generates essential tremor [72], a notion that has made it possible to obtain a transient reduction in tremor amplitude by modulating the activity of this area with non-invasive brain stimulation techniques [73,74]. When the cortical surface and thickness were studied by 3T-MRI and tremor by high-density surface electromyography, a positive correlation was observed between tremor severity and cortical atrophy in multiple frontal and parietal areas involved in the control of movement sequences [75]. Increased synchronization of motor units is correlated with increased central fatigue [51], which in turn implies prolonged increased energy demand that facilitates neuronal damage, resulting in cortical thinning and subsequent atrophy. These structural and functional changes in sensorimotor regions may help explain the distinct optical properties revealed by NIR spectra collected in ET patients.
For the ”brainstem” sites, the PCA scores plot (Figure 5a) clearly shows separation between the ET and Normal groups. The PC1 loadings plot (Figure 5b) highlights several notable peaks. A double peak in the 1100–1200 nm range represents the second overtone of C-H bonds. Another significant peak at 1450 nm corresponds to O-H stretching, often linked to water content and hydrogen bonding in biological tissues. The peak near 1900 nm indicates water absorption and possibly C=O bonds, reflecting contributions from proteins and other water-related interactions. The broad peaks between 2100 and 2300 nm are associated with complex combinations of functional groups such as CONH2, NH+OH, and CH+CH, typically found in proteins and amides.
Due to the penetration of the NIR light and the location of the NIR probe (acoustic window in the temple region), we argue that spectra are collected from a volume including skin/cutaneous appendages, adipose tissue, fibrous, connective tissue, and vascular components, bone, and nervous tissue. As already discussed for the cerebral site, differences in non-nervous tissues are unlikely to explain the distinct spectral signatures collected in normal subjects and patients. Therefore, specific differences between groups must be found in nervous structures interrogated by NIR radiation. In transcranial sonography, a non-invasive imaging technique that involves the use of ultrasound waves to visualize the substantia nigra in Parkinsonian patients [76], the ultrasound probe is located in the same position where we have placed the NIR probe. Therefore, the NIR radiation propagates across the brainstem, including the mesencephalon. Interestingly, transcranial sonography has shown changes in ultrasound signal in the substantia nigra in ET patients [77], as have the spectral data presented here. Substantia nigra hyperechogenicity is thought to reflect neuronal vulnerability or susceptibility to neurodegeneration, as suggested by a PET study conducted on healthy elderly subjects comparing 18F-Dopa uptake in subjects with normal-echogenic or hyperechogenic substantia nigra [78]. Hyperechogenity in ET patients has been interpreted as reflecting their greater risk to develop Parkinson’s disease compared to normal subjects [79]. A different transcranial ultrasound study [80] hypothesized that hyperechogenicity in the mesencephalon region found in a small number of ET patients could be due to impairment of the nearby red nucleus, an interpretation supported by PET studies [81].
Midbrain changes outside the substantia nigra take place in ET. An increase in water diffusion or a decrease in preferential direction of diffusion (i.e., fractional anisotropy) has been found in the inferior, median, and superior cerebellar peduncles [82,83], the pons [84], and red nucleus [85]. In the locus coeruleus region, the main site for noradrenaline synthesis in the brain, ET patients have reduced levels of parvalbumin compared to controls [86]. Changes in water diffusion and parvalbumin levels, along with imbalances in various neurotransmitters, may contribute to the chemical changes that determine the brainstem spectral signatures in ET patients.
Parvalbumin is a marker for GABAergic interneurons in the central nervous system. At the molecular level, ET has been linked to a generalized GABAergic dysfunction (especially in the cerebellum) that leads to neuronal hyperexcitability and more intense and frequent signals sent to the muscles [87]. GABA also plays a crucial role in synaptic plasticity, and its deficiency can therefore reduce the brain’s adaptive capacity [88]. GABA changes may indirectly influence other neurotransmitters [89], such as acetylcholine, which is involved in tremor generation, as shown by clinical benefit of anticholinergic drugs in tremor. GABAergic much more than glutamatergic transmission is preferentially associated with the expression of Synaptic Vesicle Glycoprotein 2A (SV2A) [90], a protein expressed in virtually all brain synapses. In inhibitory neurons, SV2A coordinates vesicle trafficking mediated by Synaptotagmin-I and it is therefore essential for maintaining normally balanced neurotransmission; in case of SV2A deficiency, inhibition decreases and excitation-inhibition balance is altered [91]. Interestingly, postmortem studies showed decreased SV2A binding in the cerebellum of ET patients, indicating reduced synaptic density [92].

4.3. Influence of Age and BMI in Regression Models

The influence of age and BMI on essential tremor (ET) is complex, and their relationship with disease characteristics is not straightforward. Age is a known risk factor for ET, with older individuals having an increased likelihood of developing the condition, potentially affecting the severity and progression of symptoms. Additionally, higher BMI may be linked to more pronounced tremor symptoms and could influence treatment outcomes [93].
However, regression models analyzing spectra from ET patients and healthy subjects suggest that age and BMI may not significantly alter the spectral characteristics used to differentiate these groups. The wavelengths identified through VIP scores in models that considered age and BMI as dependent variables do not align with those from PLS-DA models. These findings imply that age and BMI are not crucial for spectroscopic classification of ET. Moreover, the error margins in the regression models (4–5 years for age and 1–2 units for BMI) highlight the challenges in using these variables as reliable predictors. This suggests that other biological or environmental factors may play more important roles in the manifestation and severity of ET, emphasizing the need for further research.

5. Conclusions

The application of NIR technology in the field of movement disorders has predominantly concentrated on the utilization of functional NIR spectroscopy (fNIRS). This non-invasive technique enables the real-time measurement of changes in blood oxygenation and hemodynamics, thereby facilitating the monitoring of cortical activation during motor tasks. In patients with ET, fNIRS has provided insights into cerebellar activity and altered connectivity within the cerebello-thalamo-cortical circuit, both of which are pivotal in the generation of tremors. The results of previous studies suggest a correlation between the severity of tremors and cerebellar oscillatory activity. This indicates that NIR reflectance may serve as a potential biomarker for disease progression. Its non-invasive nature allows for continuous monitoring and integration with other neurophysiological techniques, such as electromyography (EMG) and electroencephalography (EEG), thereby enhancing understanding of ET pathophysiology and improving diagnostic accuracy.
Furthermore, optical spectroscopy and chemometrics are widely used for qualitative and quantitative analysis of samples, as in this study. To the best of our knowledge, no studies have applied a methodology similar to ours in patients with ET. This study confirms the feasibility of obtaining in vivo characterization of bodily structures non-invasively. Spectroscopy, a non-destructive technology widely used in many fields of science, allowed the collection of reflectance spectra in vivo from normal subjects and ET patients by NIR photon sampling. Chemometric analysis allowed us to develop and optimize a discriminative capability and classification of the spectral responses. These methods revealed that the optical properties of body regions sampled at cranial and extracranial sites differ in normal subjects and ET patients.
NIR technology holds promising clinical implications for the diagnosis and monitoring of ET. As a non-invasive, painless method, it enhances patient compliance and offers a quantitative approach to identifying biomarkers that could improve diagnostic accuracy and differentiate ET from other tremor disorders like parkinsonisms and dystonias. NIR’s potential for real-time monitoring allows for tracking disease progression and tremor severity, while its integration with machine learning could identify complex patterns for a more precise diagnosis. Additionally, NIR can be cost-effective compared to advanced imaging techniques and holds potential for wearable devices, offering continuous tremor monitoring in daily life and improving patient outcomes.

Author Contributions

Conceptualization, A.C. and G.B.; Methodology, A.C., A.P., G.B., S.S., R.G., D.G. (Daniela Greco), and D.G. (Davide Gattabria); Software, R.G. and D.G. (Davide Gattabria); Validation, A.C., A.M., A.P., G.B., S.S., P.M., R.G., D.G. (Daniela Greco), and D.G. (Davide Gattabria); Formal Analysis, A.C., A.P., G.B., S.S., R.G., and D.G. (Davide Gattabria); Investigation, A.C., A.P., G.B., R.G., and D.G. (Daniela Greco); Resources, A.C. and G.B.; Data Curation, A.C., A.P., G.B., R.G., and D.G. (Davide Gattabria); Writing—Original Draft Preparation, A.C., A.P., G.B., R.G., C.T., D.G. (Daniela Greco), and D.G. (Davide Gattabria); Writing—Review and Editing, A.C., G.B., R.G., D.G. (Daniela Greco), C.T., and D.G. (Davide Gattabria); Visualization, A.C., A.M., A.P., F.F., G.B., S.S., P.M., R.G., D.G. (Daniela Greco), and D.G. (Davide Gattabria); Supervision, A.C. and G.B. All authors reviewed the manuscript critically for intellectual content. All authors have read and agreed to the published version of the manuscript.

Funding

This research received no external funding.

Institutional Review Board Statement

The study was conducted according to the guidelines of the Declaration of Helsinki and approved by the local ethics committee (Comitato Etico Lazio 2, protocol number 0167183/2018).

Informed Consent Statement

Informed consent was obtained from all subjects involved in the study.

Data Availability Statement

The datasets generated during and/or analyzed during the study are available from the corresponding author on reasonable request.

Conflicts of Interest

The authors declare no conflicts of interest.

References

  1. Torricelli, A.; Pifferi, A.; Taroni, P.; Giambattistelli, E.; Cubeddu, R. In vivo optical characterization of human tissues from 610 to 1010 nm by time-resolved reflectance spectroscopy. Phys. Med. Biol. 2001, 46, 2227–2237. [Google Scholar] [CrossRef] [PubMed]
  2. Afara, I.O.; Shaikh, R.; Nippolainen, E.; Querido, W.; Torniainen, J.; Sarin, J.K.; Kandel, S.; Pleshko, N.; Töyräs, J. Characterization of connective tissues using near-infrared spectroscopy and imaging. Nat. Protoc. 2021, 16, 1297–1329. [Google Scholar] [CrossRef] [PubMed]
  3. Jacques, S.L. Optical properties of biological tissues: A review. Phys. Med. Biol. 2013, 58, R37–R61. [Google Scholar] [CrossRef]
  4. Ferrari, M.; Quaresima, V. A brief review on the history of human functional near-infrared spectroscopy (fNIRS) development and fields of application. NeuroImage 2012, 63, 921–935. [Google Scholar] [CrossRef]
  5. Currà, A.; Gasbarrone, R.; Cardillo, A.; Trompetto, C.; Fattapposta, F.; Pierelli, F.; Missori, P.; Bonifazi, G.; Serranti, S. Near-infrared spectroscopy as a tool for in vivo analysis of human muscles. Sci. Rep. 2019, 9, 8623. [Google Scholar] [CrossRef]
  6. Currà, A.; Gasbarrone, R.; Cardillo, A.; Fattapposta, F.; Missori, P.; Marinelli, L.; Bonifazi, G.; Serranti, S.; Trompetto, C. In vivo non-invasive near-infrared spectroscopy distinguishes normal, post-stroke, and botulinum toxin treated human muscles. Sci. Rep. 2021, 11, 17631. [Google Scholar] [CrossRef]
  7. Haubenberger, D.; Hallett, M. Essential Tremor. N. Engl. J. Med. 2018, 379, 596–597. [Google Scholar] [CrossRef]
  8. Louis, E.D. Non-motor symptoms in essential tremor: A review of the current data and state of the field. Park. Relat. Disord. 2016, 22 (Suppl. 1), S115–S118. [Google Scholar] [CrossRef]
  9. Mavroudis, I.; Petridis, F.; Kazis, D. Neuroimaging and neuropathological findings in essential tremor. Acta Neurol. Scand. 2019, 139, 491–496. [Google Scholar] [CrossRef]
  10. Gao, Y.; Ding, L.; Liu, J.; Wang, X.; Meng, Q. Exploring the diagnostic markers of essential tremor: A study based on machine learning algorithms. Open Life Sci. 2023, 18, 20220622. [Google Scholar] [CrossRef]
  11. Angelini, L.; Paparella, G.; De Biase, A.; Maraone, A.; Panfili, M.; Berardelli, I.; Cannavacciuolo, A.; Di Vita, A.; Margiotta, R.; Fabbrini, G.; et al. Longitudinal study of clinical and neurophysiological features in essential tremor. Eur. J. Neurol. 2023, 30, 631–640. [Google Scholar] [CrossRef] [PubMed]
  12. Purrer, V.; Pohl, E.; Lueckel, J.M.; Borger, V.; Sauer, M.; Radbruch, A.; Wüllner, U.; Schmeel, F.C. Artificial-intelligence-based MRI brain volumetry in patients with essential tremor and tremor-dominant Parkinson’s disease. Brain Commun. 2023, 5, fcad271. [Google Scholar] [CrossRef]
  13. Sharifi, S.; Buijink, A.W.G.; Luft, F.; Scheijbeler, E.P.; Potters, W.V.; van Wingen, G.; Heida, T.; Bour, L.J.; van Rootselaar, A.F. Differences in Olivo-Cerebellar Circuit and Cerebellar Network Connectivity in Essential Tremor: A Resting State fMRI Study. Cerebellum 2023, 22, 1123–1136. [Google Scholar] [CrossRef]
  14. Saccà, V.; Novellino, F.; Salsone, M.; Abou Jaoude, M.; Quattrone, A.; Chiriaco, C.; Madrigal, J.L.M. Challenging functional connectivity data: Machine learning application on essential tremor recognition. Neurol. Sci. 2023, 44, 199–207. [Google Scholar] [CrossRef]
  15. Angelini, L.; Terranova, R.; Lazzeri, G.; van den Berg, K.R.; Dirkx, M.F.; Paparella, G. The role of laboratory investigations in the classification of tremors. Neurol. Sci. 2023, 44, 4183–4192. [Google Scholar] [CrossRef] [PubMed]
  16. Fahn, S.; Tolosa, E.; Marín, C. Clinical rating scale for tremor. Park. Dis. Mov. Disord. 1993, 2, 271–280. [Google Scholar]
  17. Terravecchia, C.; Mostile, G.; Chisari, C.G.; Rascunà, C.; Terranova, R.; Cicero, C.E.; Giuliano, L.; Donzuso, G.; Sciacca, G.; Luca, A.; et al. Retinal Thickness in Essential Tremor and Early Parkinson Disease: Exploring Diagnostic Insights. J. Neuroophthalmol. 2024, 44, 35–40. [Google Scholar] [CrossRef]
  18. Lin, S.; Gao, C.; Li, H.; Huang, P.; Ling, Y.; Chen, Z.; Ren, K.; Chen, S. Wearable sensor-based gait analysis to discriminate early Parkinson’s disease from essential tremor. J. Neurol. 2023, 270, 2283–2301. [Google Scholar] [CrossRef]
  19. Zhao, Y.; Laguna, R.C.; Zhao, Y.; Liu, J.J.; He, X.; Yianni, J.; Sarrigiannis, P.G. A wavelet-based correlation analysis framework to study cerebromuscular activity in essential tremor. Complexity 2018, 2018, 7269494. [Google Scholar] [CrossRef]
  20. Bhatia, K.P.; Bain, P.; Bajaj, N.; Elble, R.J.; Hallett, M.; Louis, E.D.; Raethjen, J.; Stamelou, M.; Testa, C.M.; Deuschl, G.; et al. Consensus Statement on the classification of tremors. from the task force on tremor of the International Parkinson and Movement Disorder Society. Mov. Disord. Off. J. Mov. Disord. Soc. 2018, 33, 75–87. [Google Scholar] [CrossRef]
  21. Tröster, A.I.; Pahwa, R.; Fields, J.A.; Tanner, C.M.; Lyons, K.E. Quality of life in Essential Tremor Questionnaire (QUEST): Development and initial validation. Park. Relat. Disord. 2005, 11, 367–373. [Google Scholar] [CrossRef]
  22. Danner, M.; Locherer, M.; Hank, T.; Richter, K. Spectral Sampling with the ASD FIELDSPEC 4; GFZ Data Service. 2015. Available online: https://gfzpublic.gfz-potsdam.de/rest/items/item_1388298/component/file_1388299/content (accessed on 24 October 2024).
  23. Rinnan, Å.; Berg, F.v.d.; Engelsen, S.B. Review of the most common pre-processing techniques for near-infrared spectra. TrAC Trends Anal. Chem. 2009, 28, 1201–1222. [Google Scholar] [CrossRef]
  24. Wold, S.; Esbensen, K.; Geladi, P. Principal component analysis. Chemom. Intell. Lab. Syst. 1987, 2, 37–52. [Google Scholar] [CrossRef]
  25. Kennard, R.W.; Stone, L.A. Computer Aided Design of Experiments. Technometrics 1969, 11, 137–148. [Google Scholar] [CrossRef]
  26. Fawcett, T. An introduction to ROC analysis. Pattern Recognit. Lett. 2006, 27, 861–874. [Google Scholar] [CrossRef]
  27. Chong, I.-G.; Jun, C.-H. Performance of some variable selection methods when multicollinearity is present. Chemom. Intell. Lab. Syst. 2005, 78, 103–112. [Google Scholar] [CrossRef]
  28. Abdi, H. Partial least square regression (PLS regression). Encycl. Res. Methods Soc. Sci. 2003, 6, 792–795. [Google Scholar]
  29. Louis, E.D.; Lee, M.; Babij, R.; Ma, K.; Cortés, E.; Vonsattel, J.P.; Faust, P.L. Reduced Purkinje cell dendritic arborization and loss of dendritic spines in essential tremor. Brain 2014, 137, 3142–3148. [Google Scholar] [CrossRef]
  30. Nicoletti, V.; Cecchi, P.; Pesaresi, I.; Frosini, D.; Cosottini, M.; Ceravolo, R. Cerebello-thalamo-cortical network is intrinsically altered in essential tremor: Evidence from a resting state functional MRI study. Sci. Rep. 2020, 10, 16661. [Google Scholar] [CrossRef]
  31. Martuscello, R.T.; Kerridge, C.A.; Chatterjee, D.; Hartstone, W.G.; Kuo, S.H.; Sims, P.A.; Louis, E.D.; Faust, P.L. Gene expression analysis of the cerebellar cortex in essential tremor. Neurosci. Lett. 2020, 721, 134540. [Google Scholar] [CrossRef]
  32. Schreglmann, S.R.; Wang, D.; Peach, R.L.; Li, J.; Zhang, X.; Latorre, A.; Rhodes, E.; Panella, E.; Cassara, A.M.; Boyden, E.S.; et al. Non-invasive suppression of essential tremor via phase-locked disruption of its temporal coherence. Nat. Commun. 2021, 12, 363. [Google Scholar] [CrossRef]
  33. Shaikh, A.G.; Miura, K.; Optican, L.M.; Ramat, S.; Tripp, R.M.; Zee, D.S. Hypothetical membrane mechanisms in essential tremor. J. Transl. Med. 2008, 6, 68. [Google Scholar] [CrossRef]
  34. Hor, H.; Francescatto, L.; Bartesaghi, L.; Ortega-Cubero, S.; Kousi, M.; Lorenzo-Betancor, O.; Jiménez-Jiménez, F.J.; Gironell, A.; Clarimón, J.; Drechsel, O.; et al. Missense mutations in TENM4, a regulator of axon guidance and central myelination, cause essential tremor. Hum. Mol. Genet. 2015, 24, 5677–5686. [Google Scholar] [CrossRef] [PubMed]
  35. Kindler, C.; Upadhyay, N.; Purrer, V.; Schmeel, F.C.; Borger, V.; Scheef, L.; Wüllner, U.; Boecker, H. MRgFUS of the nucleus ventralis intermedius in essential tremor modulates functional connectivity within the classical tremor network and beyond. Park. Relat. Disord. 2023, 115, 105845. [Google Scholar] [CrossRef] [PubMed]
  36. Sakudo, A. Near-infrared spectroscopy for medical applications: Current status and future perspectives. Clin. Chim. Acta 2016, 455, 181–188. [Google Scholar] [CrossRef] [PubMed]
  37. Deshpande, S.; Gormley, M.E.; Carey, J.R. Muscle fiber orientation in muscles commonly injected with botulinum toxin: An anatomical pilot study. Neurotox. Res. 2006, 9, 115–120. [Google Scholar] [CrossRef]
  38. Lieber, R.L.; Fridén, J. Clinical significance of skeletal muscle architecture. Clin. Orthop. Relat. Res. 2001, 383, 140–151. [Google Scholar] [CrossRef]
  39. Jennekens, F.; Tomlinson, B.; Walton, J. Data on the distribution of fibre types in five human limb muscles An autopsy study. J. Neurol. Sci. 1971, 14, 245–257. [Google Scholar] [CrossRef]
  40. Johnson, M.A.; Polgar, J.; Weightman, D.; Appleton, D. Data on the distribution of fibre types in thirty-six human muscles: An autopsy study. J. Neurol. Sci. 1973, 18, 111–129. [Google Scholar] [CrossRef]
  41. Felder, A.; Ward, S.R.; Lieber, R.L. Sarcomere length measurement permits high resolution normalization of muscle fiber length in architectural studies. J. Exp. Biol. 2005, 208, 3275–3279. [Google Scholar] [CrossRef]
  42. Purslow, P.P. The structure and functional significance of variations in the connective tissue within muscle. Comp. Biochem. Physiol. Part A Mol. Integr. Physiol. 2002, 133, 947–966. [Google Scholar] [CrossRef] [PubMed]
  43. Bukharaeva, E.; Skorinkin, A. Cholinergic modulation of acetylcholine secretion at the neuromuscular junction. J. Evol. Biochem. Physiol. 2021, 57, 372–385. [Google Scholar] [CrossRef]
  44. Harris-Warrick, R.M. Voltage-sensitive ion channels in rhythmic motor systems. Curr. Opin. Neurobiol. 2002, 12, 646–651. [Google Scholar] [CrossRef]
  45. Rossi, A.E.; Dirksen, R.T. Sarcoplasmic reticulum: The dynamic calcium governor of muscle. Muscle Nerve Off. J. Am. Assoc. Electrodiagn. Med. 2006, 33, 715–731. [Google Scholar] [CrossRef]
  46. Protasi, F.; Girolami, B.; Roccabianca, S.; Rossi, D. Store-operated calcium entry: From physiology to tubular aggregate myopathy. Curr. Opin. Pharmacol. 2023, 68, 102347. [Google Scholar] [CrossRef]
  47. Barclay, C.; Curtin, N. Advances in understanding the energetics of muscle contraction. J. Biomech. 2023, 156, 111669. [Google Scholar] [CrossRef] [PubMed]
  48. Egan, B.; O’connor, P.L.; Zierath, J.R.; O’gorman, D.J. Time course analysis reveals gene-specific transcript and protein kinetics of adaptation to short-term aerobic exercise training in human skeletal muscle. PLoS ONE 2013, 8, e74098. [Google Scholar] [CrossRef] [PubMed]
  49. Free, D.B.; Syndergaard, I.; Pigg, A.C.; Muceli, S.; Thompson-Westra, J.; Mente, K.; Maurer, C.W.; Haubenberger, D.; Hallett, M.; Farina, D.; et al. Essential Tremor accentuates the pattern of tremor-band coherence between upper-limb muscles. J. Neurophysiol. 2023, 129, 524–540. [Google Scholar] [CrossRef]
  50. Gallego, J.A.; Dideriksen, J.L.; Holobar, A.; Ibáñez, J.; Glaser, V.; Romero, J.P.; Benito-León, J.; Pons, J.L.; Rocon, E.; Farina, D. The phase difference between neural drives to antagonist muscles in essential tremor is associated with the relative strength of supraspinal and afferent input. J. Neurosci. 2015, 35, 8925–8937. [Google Scholar] [CrossRef]
  51. Boyas, S.; Guével, A. Neuromuscular fatigue in healthy muscle: Underlying factors and adaptation mechanisms. Ann. Phys. Rehabil. Med. 2011, 54, 88–108. [Google Scholar] [CrossRef]
  52. Ruonala, V.; Meigal, A.; Rissanen, S.M.; Airaksinen, O.; Kankaanpää, M.; Karjalainen, P.A. EMG signal morphology and kinematic parameters in essential tremor and Parkinson’s disease patients. J. Electromyogr. Kinesiol. 2014, 24, 300–306. [Google Scholar] [CrossRef] [PubMed]
  53. Stavusis, J.; Lace, B.; Schäfer, J.; Geist, J.; Inashkina, I.; Kidere, D.; Pajusalu, S.; Wright, N.T.; Saak, A.; Weinhold, M.; et al. Novel mutations in MYBPC1 are associated with myogenic tremor and mild myopathy. Ann. Neurol. 2019, 86, 129–142. [Google Scholar] [CrossRef] [PubMed]
  54. Piantadosi, C.A.; Hemstreet, T.M.; Jöbsis-Vandervliet, F.F. Near-infrared spectrophotometric monitoring of oxygen distribution to intact brain and skeletal muscle tissues. Crit. Care Med. 1986, 14, 698–706. [Google Scholar] [CrossRef]
  55. Hazeki, O.; Seiyama, A.; Tamura, M. Near-infrared spectrophotometric monitoring of haemoglobin and cytochrome a, a 3 in situ. Oxyg. Transp. Tissue IX 1987, 215, 283–289. [Google Scholar]
  56. Fox, E.; Jöbsis-Vander Vliet, F.F.; Mitnick, M.H. Monitoring cerebral oxygen sufficiency in anesthesia and surgery. Oxyg. Transp. Tissue VII 1985, 191, 849–854. [Google Scholar]
  57. Brazy, J.E.; Lewis, D.V.; Mitnick, M.H.; vander Vliet, F.F.J.b. Noninvasive monitoring of cerebral oxygenation in preterm infants: Preliminary observations. Pediatrics 1985, 75, 217–225. [Google Scholar] [CrossRef]
  58. Ferrari, M.; De Marchis, C.; Giannini, I.; Di Nicola, A.; Agostino, R.; Nodari, S.; Bucci, G. Cerebral blood volume and hemoglobin oxygen saturation monitoring in neonatal brain by near IR spectroscopy. Oxyg. Transp. Tissue VIII 1986, 200, 203–211. [Google Scholar]
  59. Ferrari, M.; Zanette, E.; Giannini, I.; Sideri, G.; Fieschi, C.; Carpi, A. Effects of carotid artery compression test on regional cerebral blood volume, hemoglobin oxygen saturation and cytochrome-c-oxidase redox level in cerebrovascular patients. In Oxygen Transport to Tissue VIII; Springer: Berlin/Heidelberg, Germany, 1986; pp. 213–221. [Google Scholar]
  60. Louis, E.D.; Faust, P.L. Essential tremor pathology: Neurodegeneration and reorganization of neuronal connections. Nat. Rev. Neurol. 2020, 16, 69–83. [Google Scholar] [CrossRef]
  61. Shill, H.A.; Adler, C.H.; Sabbagh, M.N.; Connor, D.J.; Caviness, J.N.; Hentz, J.G.; Beach, T.G. Pathologic findings in prospectively ascertained essential tremor subjects. Neurology 2008, 70, 1452–1455. [Google Scholar] [CrossRef]
  62. Farrell, K.; Cosentino, S.; Iida, M.A.; Chapman, S.; Bennett, D.A.; Faust, P.L.; Louis, E.D.; Crary, J.F. Quantitative Assessment of Pathological Tau Burden in Essential Tremor: A Postmortem Study. J. Neuropathol. Exp. Neurol. 2019, 78, 31–37. [Google Scholar] [CrossRef]
  63. Bagepally, B.S.; Bhatt, M.D.; Chandran, V.; Saini, J.; Bharath, R.D.; Vasudev, M.K.; Prasad, C.; Yadav, R.; Pal, P.K. Decrease in cerebral and cerebellar gray matter in essential tremor: A voxel-based morphometric analysis under 3T MRI. J. Neuroimaging 2012, 22, 275–278. [Google Scholar] [CrossRef] [PubMed]
  64. Daniels, C.; Peller, M.; Wolff, S.; Alfke, K.; Witt, K.; Gaser, C.; Jansen, O.; Siebner, H.R.; Deuschl, G. Voxel-based morphometry shows no decreases in cerebellar gray matter volume in essential tremor. Neurology 2006, 67, 1452–1456. [Google Scholar] [CrossRef] [PubMed]
  65. Moll, N.M.; Rietsch, A.M.; Thomas, S.; Ransohoff, A.J.; Lee, J.C.; Fox, R.; Chang, A.; Ransohoff, R.M.; Fisher, E. Multiple sclerosis normal-appearing white matter: Pathology–imaging correlations. Ann. Neurol. 2011, 70, 764–773. [Google Scholar] [CrossRef]
  66. Prodoehl, J.; Li, H.; Planetta, P.J.; Goetz, C.G.; Shannon, K.M.; Tangonan, R.; Comella, C.L.; Simuni, T.; Zhou, X.J.; Leurgans, S.; et al. Diffusion tensor imaging of Parkinson’s disease, atypical parkinsonism, and essential tremor. Mov. Disord. 2013, 28, 1816–1822. [Google Scholar] [CrossRef]
  67. Sengul, Y.; Temur, H.O.; Corakcı, Z.; Sengul, H.S.; Dowd, H.; Ustun, I.; Alkan, A.; Louis, E.D. Brain microstructural changes and cognitive function in non-demented essential tremor patients: A diffusion tensor imaging study. Int. J. Neurosci. 2022, 132, 154–164. [Google Scholar] [CrossRef] [PubMed]
  68. Bianco, M.G.; Quattrone, A.; Sarica, A.; Aracri, F.; Calomino, C.; Caligiuri, M.E.; Novellino, F.; Nisticò, R.; Buonocore, J.; Crasà, M.; et al. Cortical involvement in essential tremor with and without rest tremor: A machine learning study. J. Neurol. 2023, 270, 4004–4012. [Google Scholar] [CrossRef]
  69. Younger, E.; Ellis, E.G.; Parsons, N.; Pantano, P.; Tommasin, S.; Caeyenberghs, K.; Benito-León, J.; Romero, J.P.; Joutsa, J.; Corp, D.T. Mapping Essential Tremor to a Common Brain Network Using Functional Connectivity Analysis. Neurology 2023, 101, e1483–e1494. [Google Scholar] [CrossRef] [PubMed]
  70. Hellwig, B.; Häussler, S.; Schelter, B.; Lauk, M.; Guschlbauer, B.; Timmer, J.; Lücking, C.H. Tremor-correlated cortical activity in essential tremor. Lancet 2001, 357, 519–523. [Google Scholar] [CrossRef]
  71. Lin, C.H.; Chen, C.M.; Lu, M.K.; Tsai, C.H.; Chiou, J.C.; Liao, J.R.; Duann, J.R. VBM Reveals Brain Volume Differences between Parkinson’s Disease and Essential Tremor Patients. Front. Hum. Neurosci. 2013, 7, 247. [Google Scholar] [CrossRef]
  72. Halliday, D.M.; Conway, B.A.; Farmer, S.F.; Shahani, U.; Russell, A.J.; Rosenberg, J.R. Coherence between low-frequency activation of the motor cortex and tremor in patients with essential tremor. Lancet 2000, 355, 1149–1153. [Google Scholar] [CrossRef]
  73. Hellriegel, H.; Schulz, E.M.; Siebner, H.R.; Deuschl, G.; Raethjen, J.H. Continuous theta-burst stimulation of the primary motor cortex in essential tremor. Clin. Neurophysiol. 2012, 123, 1010–1015. [Google Scholar] [CrossRef] [PubMed]
  74. Batra, D.; Kamble, N.; Bhattacharya, A.; Sahoo, L.; Yadav, R.; Pal, P.K. Modulatory effect of continuous theta burst stimulation in patients with essential tremor. Park. Relat. Disord. 2022, 94, 62–66. [Google Scholar] [CrossRef] [PubMed]
  75. Benito-León, J.; Serrano, J.I.; Louis, E.D.; Holobar, A.; Romero, J.P.; Povalej-Bržan, P.; Kranjec, J.; Bermejo-Pareja, F.; Del Castillo, M.D.; Posada, I.J.; et al. Essential tremor severity and anatomical changes in brain areas controlling movement sequencing. Ann. Clin. Transl. Neurol. 2018, 6, 83–97. [Google Scholar] [CrossRef] [PubMed]
  76. Becker, G.; Seufert, J.; Bogdahn, U.; Reichmann, H.; Reiners, K. Degeneration of substantia nigra in chronic Parkinson’s disease visualized by transcranial color-coded real-time sonography. Neurology 1995, 45, 182–184. [Google Scholar] [CrossRef]
  77. Stockner, H.; Sojer, M.; K, K.S.; Mueller, J.; Wenning, G.K.; Schmidauer, C.; Poewe, W. Midbrain sonography in patients with essential tremor. Mov. Disord. 2007, 22, 414–417. [Google Scholar] [CrossRef]
  78. Berg, D.; Siefker, C.; Ruprecht-Dörfler, P.; Becker, G. Relationship of substantia nigra echogenicity and motor function in elderly subjects. Neurology 2001, 56, 13–17. [Google Scholar] [CrossRef] [PubMed]
  79. Sprenger, F.S.; Wurster, I.; Seppi, K.; Stockner, H.; Scherfler, C.; Sojer, M.; Schmidauer, C.; Berg, D.; Poewe, W. Substantia nigra hyperechogenicity and Parkinson’s disease risk in patients with essential tremor. Mov. Disord. 2016, 31, 579–583. [Google Scholar] [CrossRef]
  80. Budisic, M.; Trkanjec, Z.; Bosnjak, J.; Lovrencic-Huzjan, A.; Vukovic, V.; Demarin, V. Distinguishing Parkinson’s disease and essential tremor with transcranial sonography. Acta Neurol. Scand. 2009, 119, 17–21. [Google Scholar] [CrossRef]
  81. Wills, A.J.; Jenkins, I.H.; Thompson, P.D.; Findley, L.J.; Brooks, D.J. Red nuclear and cerebellar but no olivary activation associated with essential tremor: A positron emission tomographic study. Ann. Neurol. 1994, 36, 636–642. [Google Scholar] [CrossRef]
  82. Klein, J.C.; Lorenz, B.; Kang, J.S.; Baudrexel, S.; Seifried, C.; van de Loo, S.; Steinmetz, H.; Deichmann, R.; Hilker, R. Diffusion tensor imaging of white matter involvement in essential tremor. Hum. Brain Mapp. 2011, 32, 896–904. [Google Scholar] [CrossRef]
  83. Nicoletti, G.; Manners, D.; Novellino, F.; Condino, F.; Malucelli, E.; Barbiroli, B.; Tonon, C.; Arabia, G.; Salsone, M.; Giofre’, L.; et al. Diffusion tensor MRI changes in cerebellar structures of patients with familial essential tremor. Neurology 2010, 74, 988–994. [Google Scholar] [CrossRef] [PubMed]
  84. Shin, D.H.; Han, B.S.; Kim, H.S.; Lee, P.H. Diffusion tensor imaging in patients with essential tremor. AJNR Am. J. Neuroradiol. 2008, 29, 151–153. [Google Scholar] [CrossRef]
  85. Jia, L.; Jia-Lin, S.; Qin, D.; Qing, L.; Yan, Z. A diffusion tensor imaging study in essential tremor. J. Neuroimaging 2011, 21, 370–374. [Google Scholar] [CrossRef]
  86. Shill, H.A.; Adler, C.H.; Beach, T.G.; Lue, L.F.; Caviness, J.N.; Sabbagh, M.N.; Sue, L.I.; Walker, D.G. Brain biochemistry in autopsied patients with essential tremor. Mov. Disord. 2012, 27, 113–117. [Google Scholar] [CrossRef] [PubMed]
  87. Boecker, H.; Weindl, A.; Brooks, D.J.; Ceballos-Baumann, A.O.; Liedtke, C.; Miederer, M.; Sprenger, T.; Wagner, K.J.; Miederer, I. GABAergic dysfunction in essential tremor: An 11C-flumazenil PET study. J. Nucl. Med. 2010, 51, 1030–1035. [Google Scholar] [CrossRef]
  88. Chuang, W.L.; Huang, Y.Z.; Lu, C.S.; Chen, R.S. Reduced cortical plasticity and GABAergic modulation in essential tremor. Mov. Disord. 2014, 29, 501–507. [Google Scholar] [CrossRef]
  89. Wichmann, T.; DeLong, M.R. Neurotransmitters and disorders of the basal ganglia. In Basic Neurochemistry; Elsevier: Amsterdam, The Netherlands, 2012; pp. 856–871. [Google Scholar]
  90. Rossi, R.; Arjmand, S.; Bærentzen, S.L.; Gjedde, A.; Landau, A.M. Synaptic vesicle glycoprotein 2A: Features and functions. Front. Neurosci. 2022, 16, 864514. [Google Scholar] [CrossRef]
  91. Bae, J.R.; Lee, W.; Jo, Y.O.; Han, S.; Koh, S.; Song, W.K.; Kim, S.H. Distinct synaptic vesicle recycling in inhibitory nerve terminals is coordinated by SV2A. Progress. Neurobiol. 2020, 194, 101879. [Google Scholar] [CrossRef] [PubMed]
  92. Yang, Y.; Zheng, C.; Chen, B.; Hernandez, N.C.; Faust, P.L.; Cai, Z.; Louis, E.D.; Matuskey, D. Decreased Synaptic Vesicle Glycoprotein 2A Binding in the Human Postmortem Essential Tremor Cerebellum: Evidence of Reduction in Synaptic Density. Cerebellum 2024, 23, 1053–1060. [Google Scholar] [CrossRef]
  93. Louis, E.D.; Marder, K.; Jurewicz, E.C.; Watner, D.; Levy, G.; Mejia-Santana, H. Body mass index in essential tremor. Arch. Neurol. 2002, 59, 1273–1277. [Google Scholar] [CrossRef]
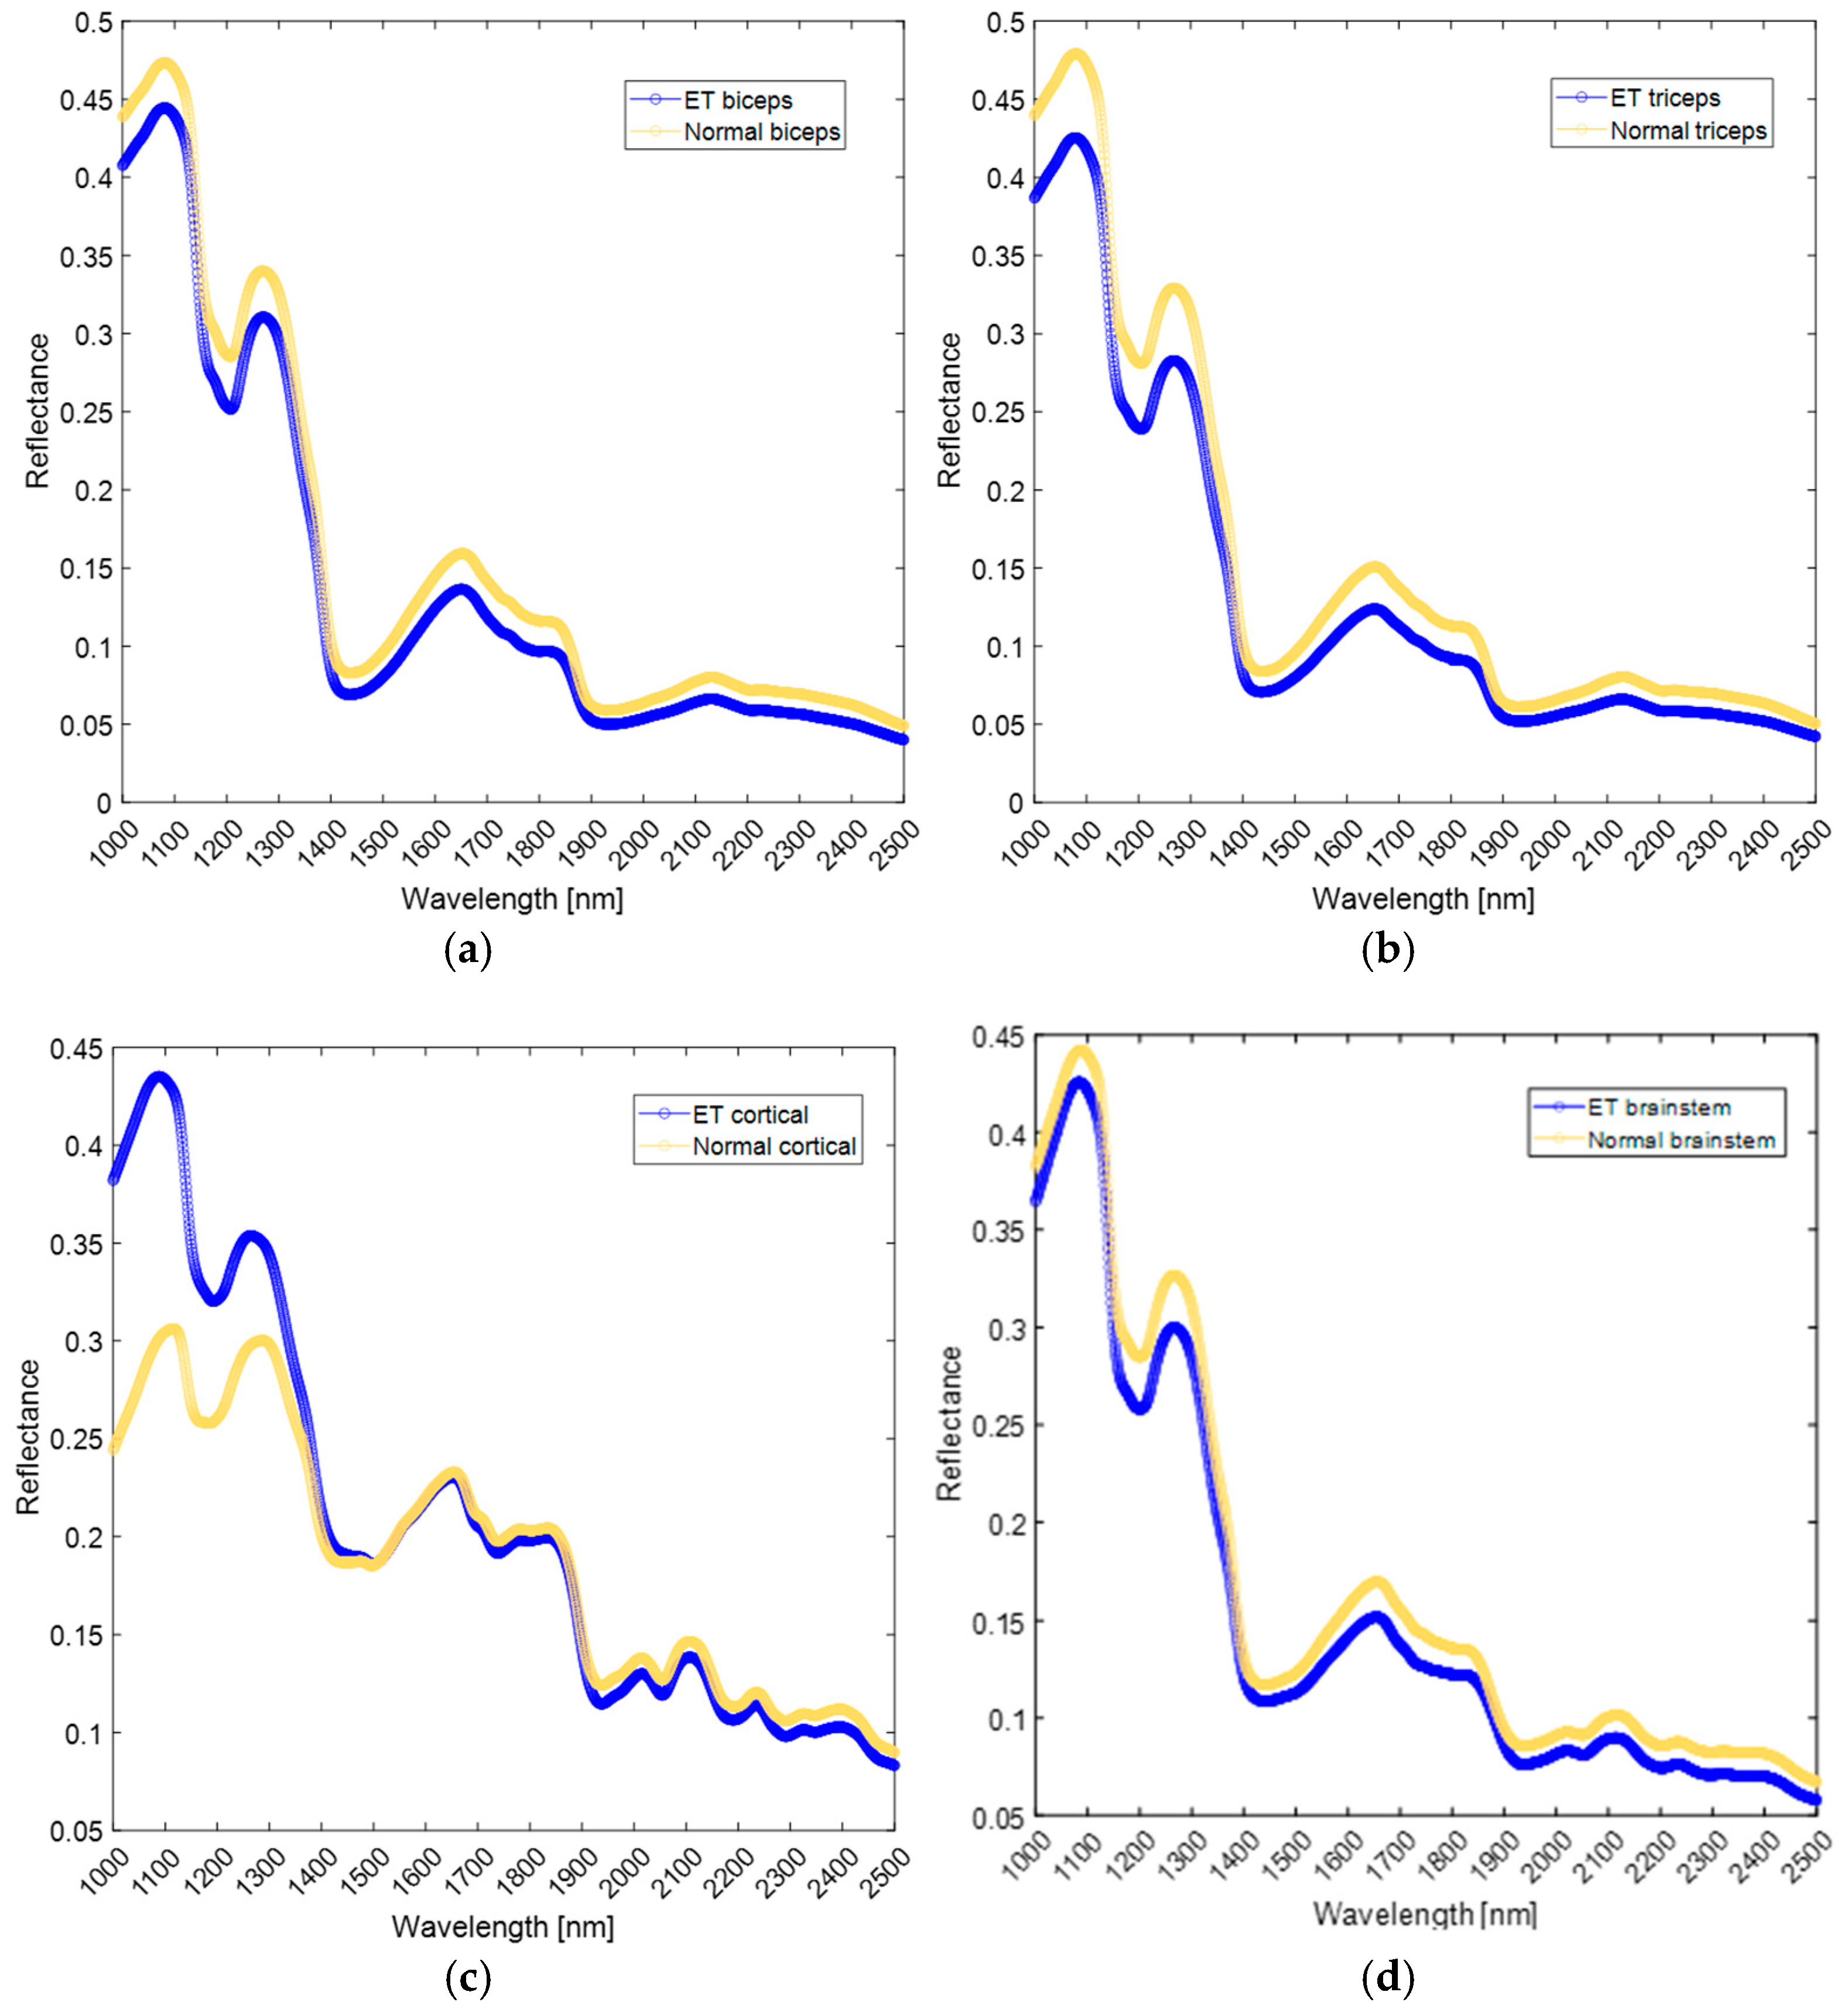
Figure 1. Average reflectance spectra collected from extracranial and cranial sites: (a) ET biceps vs. Normal biceps, (b) ET triceps vs. Normal triceps, (c) ET cortical vs. Normal cortical, and (d) ET brainstem vs. Normal brainstem.
Photonics 11 01025 g001
Figure 2. Principal Component Analysis (PCA) scores plot for the first two principal components, based on spectra collected at the extracranial/biceps site in both ET patients and healthy subjects (Normal) (a). The loadings plot for the first principal component (PC1) is shown in (b).
Photonics 11 01025 g002
Figure 3. Panel (a): scores plot of Principal Component Analysis (PCA) for the first two principal components, based on spectra collected from the extracranial/triceps site in both patients (ET) and healthy subjects (Normal). Panel (b): loadings plot for the first principal component.
Photonics 11 01025 g003
Figure 4. Panel (a): scores plot of Principal Component Analysis (PCA) for the first two components, based on spectra collected from the cranial/cortical site in both patients (ET) and healthy subjects (Normal). Panel (b): loadings plot for the first principal component.
Photonics 11 01025 g004
Figure 5. Panel (a): scores plot of Principal Component Analysis (PCA) for the first two components, based on spectra collected from the cranial/brainstem site in both patients (ET) and healthy subjects (Normal). Panel (b): loadings plot for the first principal component.
Photonics 11 01025 g005
Figure 6. VIP scores plot for “ET biceps/Normal biceps” (a) and “ET triceps/Normal triceps” (b).
Photonics 11 01025 g006
Figure 7. Panel (a) VIP scores plot for “ET cortical/Normal cortical”; panel (b) “ET brainstem/Normal brainstem”.
Photonics 11 01025 g007
Figure 8. Regression models for “ET biceps/Normal biceps” data based on age panel (a) and BMI panel (c), along with the corresponding VIP score plots for the age-based model panel (b) and the BMI-based model panel (d). Biceps (B) = ET biceps; Biceps (N) = Normal biceps.
Photonics 11 01025 g008
Figure 9. Regression models for “ET triceps/Normal triceps” data based on age panel (a) and BMI panel (c), including the VIP score plots for the age-based model panel (b) and the BMI-based model panel (d). Triceps (B) = ET triceps; Triceps (N) = Normal triceps.
Photonics 11 01025 g009
Figure 10. Regression models for “ET cortical/Normal cortical” data based on age panel (a) and BMI panel (c), along with VIP score plots for the age-based model panel (b) and the BMI-based model panel (d). Cerebral cortex (B) = ET cortical; Cerebral cortex (N) = Normal cortical.
Photonics 11 01025 g010aPhotonics 11 01025 g010b
Figure 11. Regression models for “ET brainstem/Normal brainstem” data based on age panel (a) and BMI panel (c), featuring the VIP score plots for the age-based model panel (b) and the BMI-based model panel (d). Mid-brain (B) = ET brainstem; Mid-brain (N) = Normal brainstem.
Photonics 11 01025 g011
Table 1. Demographic and anthropometric variables of the studied subjects.
IDConditionAge
[yrs]
SexWeight [kg]Height [cm]BMIFMTQUEST
B01ET86098170345452
B02ET81151160203211
B03ET2115816721230
B04ET86080177265436
B05ET7715616022246
B06ET741531552221183
B07ET76057160221528
B08ET8108117925126
B09ET680731732420
B10ET860781752590
B11ET72075177241814
B12ET89172163272569
B13ET54162164235106
B14ET80070171241730
B15ET7608917330143
B16ET741781523430172
NT01Normal7415815724--
NT02Normal7407017523--
NT03Normal5515816821--
NT04Normal2715416021--
NT05Normal2415816721--
NT06Normal2414716517--
NT07Normal3607517425--
NT08Normal2109018526--
NT09Normal59010217832--
NT10Normal6607416826--
NT11Normal5317515631--
NT12Normal5006817024--
NT13Normal5808317328--
NT14Normal2607217823--
NT15Normal2708017726--
NT16Normal3305716022--
Sex: 0 represents male and 1 represents female; FTM: Scores of the Fahn–Tolosa–Marín tremor rating scale [16]; QUEST: Scores of the Quality of Life in Essential Tremor Questionnaire [21].
Table 2. Statistical parameters obtained from PLS-DA for extracranial sites (biceps and triceps) and cranial sites (cortex and brainstem). Model phases: calibration (C), cross-validation (CV), and prediction (P).
ModelModel PhaseClassSensitivitySpecificityNumber of SpectraError RatePrecisionAccuracy
ET biceps/
Normal biceps
CET biceps11534011
Normal biceps11586011
CVET biceps11534011
Normal biceps11586011
PET biceps11266011
Normal biceps11214011
ET triceps/
Normal triceps
CET Triceps11544011
Normal triceps11576011
CVET Triceps11544011
Normal triceps11576011
PET Triceps11256011
Normal triceps11224011
ET cortical/
Normal cortical
CET cortical11224011
Normal cortical11224011
CVET cortical11224011
Normal cortical11224011
PET cortical1196011
Normal cortical1196011
ET brainstem/
Normal brainstem
CET brainstem11205011
Normal brainstem11243011
CET brainstem11205011
Normal brainstem11243011
PET brainstem11115011
Normal brainstem1177011
Table 3. Performance of age- and BMI-based PLS models for extracranial (biceps, triceps) and cranial (cortical, brainstem) sites.
DatasetPLSLVRMSECRMSECVC BiasCV BiasR2CR2CV
ET biceps/Normal bicepsAge45500.0060.9590.958
BMI41.621.650−0.0010.8270.821
ET triceps/Normal tricepsAge5440−0.0010.9710.967
BMI61.511.5900.0130.8510.833
ET cortical/Normal corticalAge44400.0270.970.966
BMI50.8410.9140−0.0010.9540.954
ET brainstem /Normal brainstemAge5450−0.0020.9640.955
BMI61.1721.3850−0.0020.910.875
LV: Latent Variable; RMSEC: Root Mean Square Error in calibration; RMSECV: Root Mean Square Error in cross-validation; C Bias: calibration Bias; CV Bias: cross-validation bias; R2C: coefficient of determination in calibration; R2CV: coefficient of determination in cross-validation.
Table 4. Wavelengths evaluated from the VIP scores of the PLS-DA and PLS models for extracranial sites.
Wavelengths (nm)BicepsTriceps
PLS-DAPLS
(Age)
PLS
(BMI)
PLS-DAPLS
(Age)
PLS
(BMI)
1000–1100 1000
1100–1200 1100; 1150–1200115011501150–1200
1200–1300 1200 1200
1300–1400 1350 1350–14001350–1400
1400–1500 1450–15001450–1500
1500–1600
1600–1700
1700–1800
1800–1900 1800
1900–2000 1900 1900
2000–2100
2100–2200
2200–23002200–2250
2300–2400
2400–25002500 25002500 2500
Table 5. Wavelengths evaluated from the VIP scores of the PLS-DA and PLS models for cranial sites.
Wavelengths
(nm)
Cerebral CortexMid-Brain
PLS-DAPLS
(Age)
PLS
(BMI)
PLS-DAPLS
(Age)
PLS
(BMI)
1000–1100 100010001000; 10501000; 1050–11001000
1100–1200 1150 1150–1200
1200–1300
1300–1400
1400–1500
1500–1600
1600–1700 1650
1700–1800 1700
1800–19001800–18501800; 1850–1900 1850–1900
1900–2000
2000–2100
2100–2200
2200–23002200–2250
2300–2400 2300
2400–2500 25002500
Disclaimer/Publisher’s Note: The statements, opinions and data contained in all publications are solely those of the individual author(s) and contributor(s) and not of MDPI and/or the editor(s). MDPI and/or the editor(s) disclaim responsibility for any injury to people or property resulting from any ideas, methods, instructions or products referred to in the content.