Article

Effects of Thickness and Grain Size on Harmonic Generation in Thin AlN Films

by
J. Seres
1,*,
E. Seres
1,
E. Céspedes
2,3,
L. Martinez-de-Olcoz
2,
M. Zabala
2 and
T. Schumm
1
1
Atominstitut—E141, Technische Universität Wien, Stadionallee 2, 1020 Vienna, Austria
2
Instituto de Microelectrónica de Barcelona, IMB-CNM (CSIC), Campus UAB, 08193 Barcelona, Spain
3
Instituto de Ciencia de Materiales de Madrid (CSIC), Cantoblanco, 28049 Madrid, Spain
*
Author to whom correspondence should be addressed.
Photonics 2024, 11(11), 1078; https://doi.org/10.3390/photonics11111078
Submission received: 22 October 2024 / Revised: 10 November 2024 / Accepted: 14 November 2024 / Published: 16 November 2024
(This article belongs to the Special Issue Advances in Laser Field Manipulation)

Abstract

:
High-harmonic generation from solid films is an attractive method for converting infrared laser pulses to ultraviolet and vacuum ultraviolet wavelengths and for examining the films using the generation process. In this work, AlN thin films grown on a sapphire substrate are studied. Below-band-gap third harmonics and above-band-gap fifth harmonics were generated using a Ti:sapphire oscillator running at 800 nm. A strong enhancement of the fifth-harmonic signal in the forward direction was observed from thicker 39 nm and 100 nm films compared to thinner 8 nm and 17 nm films. For the fifth harmonic generated in the backward direction, and also for the third harmonic in both the forward and backward directions, only a weak dependence of the harmonic signal on the film thickness was measured. Using both X-ray diffraction and dependence of the fifth harmonic on the laser polarization measurements, these behaviors are attributed to the crystallization and the grain size of the films, promising fifth-harmonic generation as a suitable tool to study AlN film properties.

1. Introduction

High-harmonic generation from solid media has gained attention in recent years because it provides a wide variety of materials that can be used and studied. The range of options is further widened when not only bulk (unstructured) materials, but thin films, interfaces, or nanostructures are considered. Bulk and film materials can produce substantially different high-harmonic spectra [1], and thin films has also been used successfully as effective media for nonlinear frequency conversion [2,3,4,5,6,7,8,9,10,11,12]. The harmonic signals generated from surfaces can again be different from the ones generated from interfaces between two materials [4,13,14]. Nanostructures, due to plasmonic resonances, are found to be able to enhance the nonlinear response and the harmonic generation efficiency [15,16,17,18,19,20,21,22,23,24]. Contrary to the high-harmonic generation from gases, solid samples generate harmonics in both the forward and backward directions [12,25,26,27,28], which further extends their usability [26].
The state of crystallization, like crystalline, polycrystalline, or amorphous, has been found to be essential but controversial. Comparing a crystalline GaP nanofilm with an amorphous one [29], the amorphous film produced more third-harmonic signals. Others observed higher harmonic signals from crystalline quartz than from its amorphous form [30]. The grain size of a polycrystalline CdTe film was identified as an important factor in high-harmonic generation [6].
For understanding the experimental results, propagation effects [1,4,5] were considered. Others highlighted the importance of defect centers [3] and the surface contribution [4,10,13,14] in the harmonic generation process. The crystal structures and involving symmetries strongly affect the harmonic generation efficiency, which has been extensively studied by measuring the harmonic signal dependence on the polarization direction of the driving laser pulses and modeling the generation process with directional dependent potentials [4,5,10,11,12,25,27,28,29].
The structural properties of AlN films are under extensive investigations [31,32,33] because AlN is a highly promising wide-band-gap semiconductor with excellent thermal conductivity, superior chemical stability and piezoelectric and ferroelectric properties [34]. For high-harmonic generation, its high optical damage threshold and high optical nonlinearity [35] are very advantageous when high harmonics are generated at high laser intensities [10,36].
In this work, AlN nanofilms with different thicknesses used to generate third and fifth harmonics of an 800 nm Ti–sapphire laser are investigated, leading to the observation of essential differences in the generated fifth-harmonic power in the forward direction. To address these observations, a detailed study of the films is performed, both with X-ray diffraction measurements and harmonic generation, exploiting the harmonic’s dependence on the polarization direction of the excitation laser.

2. Experimental Procedures

2.1. Experimental Setup for High-Harmonic Generation on Thin Films

For the harmonic generation experiments, a Ti:sapphire oscillator was used, which delivered 8 nJ, 28 fs ultrashort pulses at an 800 nm wavelength and at a 108 MHz repetition rate. The pulses were characterized before entering the measurement setup. The pulses were tightly focused to 5 µm size (FWHM) by a lens (f1 = 10 mm) onto the samples of AlN thin films grown on sapphire substrates. The laser intensity in the focus was estimated to approach 1 TW/cm2. The experimental setup is presented in Figure 1.
Since we were interested in measuring the signal up to the 5th harmonics at 160 nm, which is situated in the vacuum ultraviolet (VUV) spectral range, the full experimental setup, shown in Figure 1, was placed into a vacuum chamber. Before entering the vacuum chamber, the output pulses of the oscillator were negatively chirped using chirp mirrors, and a BK7 wedge pair was added to compensate and fine-tune the material dispersion of the window of the vacuum chamber and the focusing lens to obtain a compressed shortest pulse in the focus. The optimal pulse compression was determined by maximizing the 5th harmonic signal. The AlN film samples were placed into the focus at an angle of 25°. Since harmonics generated in both the transmission (forward, FW) and also in the reflection (backward, BW) directions were measured, the angle of incidence was chosen to avoid the clipping of the laser and the harmonic beams by the focusing lens.
Both in the transmission and reflection beam paths, VUV-grade MgF2 lenses focused the generated harmonic beams onto an aperture (diameter of 1 mm), which served as the input of the spectrometer. By moving the lenses, it was possible to choose and focus the desired harmonic order to the input aperture, while the laser beam and the other harmonic beam remained spatially filtered out for better signal–background contrast. With an additional VUV filter, which was used in all the measurements, it was possible to further improve the measurement of H5. The measured values of H3 and H5 were corrected by the transmissions of the filter at those wavelengths.
For a correct measurement, the full harmonic beam should pass the input aperture, and the full harmonic spectrum should pass the output slit of the spectrometer. This was achieved by means of a slit opening of 1 mm and a grating of 300 g/mm. The lenses and the M2 VUV mirror were placed onto motorized translation stages. Moving M2 made it possible to choose between the transmitted and reflected harmonic beam, and a motorized mirror mount for M2 was used to direct (fine alignment) the harmonic beams to the input aperture of the spectrometer under vacuum. Furthermore, a motorized rotation stage with a half-wave plate (HWP) before the focusing lens was used to rotate the polarization direction of the input laser beam. The selected harmonic beam was measured by a Hamamatsu R6836 photomultiplier, which is sensitive in the spectral range of 110 to 320 nm, and for recording a spectrum, the spectrometer grating was rotated. Typical recorded spectra for the 39 nm AlN film and the bare sapphire substrate (without film) are plotted in the inset of Figure 1.

2.2. Film Growth and Characterization

AlN films with different thicknesses were grown on 0.1 mm thick, EPI polished, c-cut (0001), sapphire substrates (VUV grade quality) using KS-800HR Kenosistec sputtering equipment. The (0001) sapphire is frequently used for AlN film deposition since the lattice mismatch between c-oriented AlN and the (0001) sapphire of 13% allows achieving a highly textured or heteroepitaxial film and therefore very good alignment of the c-axis grains [37]. Base pressure was in the range of 1·10−7 mbar. Prior to AlN growth, the substrates were cleaned using Ar etching (P = 5·10−3 mbar) at 200 W for 7 min. AlN layers were obtained from a metallic Al target (8”, 99.99% purity) using reactive RF magnetron sputtering with N2 (P = 5·10−3 mbar) at 650 W. During the deposition, the substrates were not intentionally heated. A pre-sputtering process was performed before film deposition. Under these conditions, slow deposition rates, around 1 nm/min, were achieved in order to favor AlN crystalline order. For selected samples, a 10 min rapid thermal annealing (RTA) at 700 °C in N2 was performed after growth.
To determine the films’ thickness, mechanical profilometry measurements using a Tencor P7 instrument (Milpitas, CA, USA) were performed on silicon chips prepared at same time as the sapphire ones. The films’ surface morphology was characterized by a Bruker Icon AFM instrument (Billerica, MA, USA). The crystalline properties of the films were characterized by X-ray diffraction (XRD), including theta–2theta and rocking curves collected with a D8 Advance-Bruker diffractometer using Cu Kα radiation.

3. Measurement Results

3.1. X-Ray Diffraction and AFM Measurements of the AlN Films

For the characterization of the grown AlN films, X-ray diffraction measurements were performed. The detailed procedure is described in Section 2.2 and the results are plotted in Figure 2. For the measurements, the next samples were used:
  • AlN films “as grown” with thicknesses of 8, 17, 39 and 100 nm.
  • AlN films annealed (RTA) with thicknesses of 8, 17, 39 and 100 nm.
  • Al2O3 substrate without film.
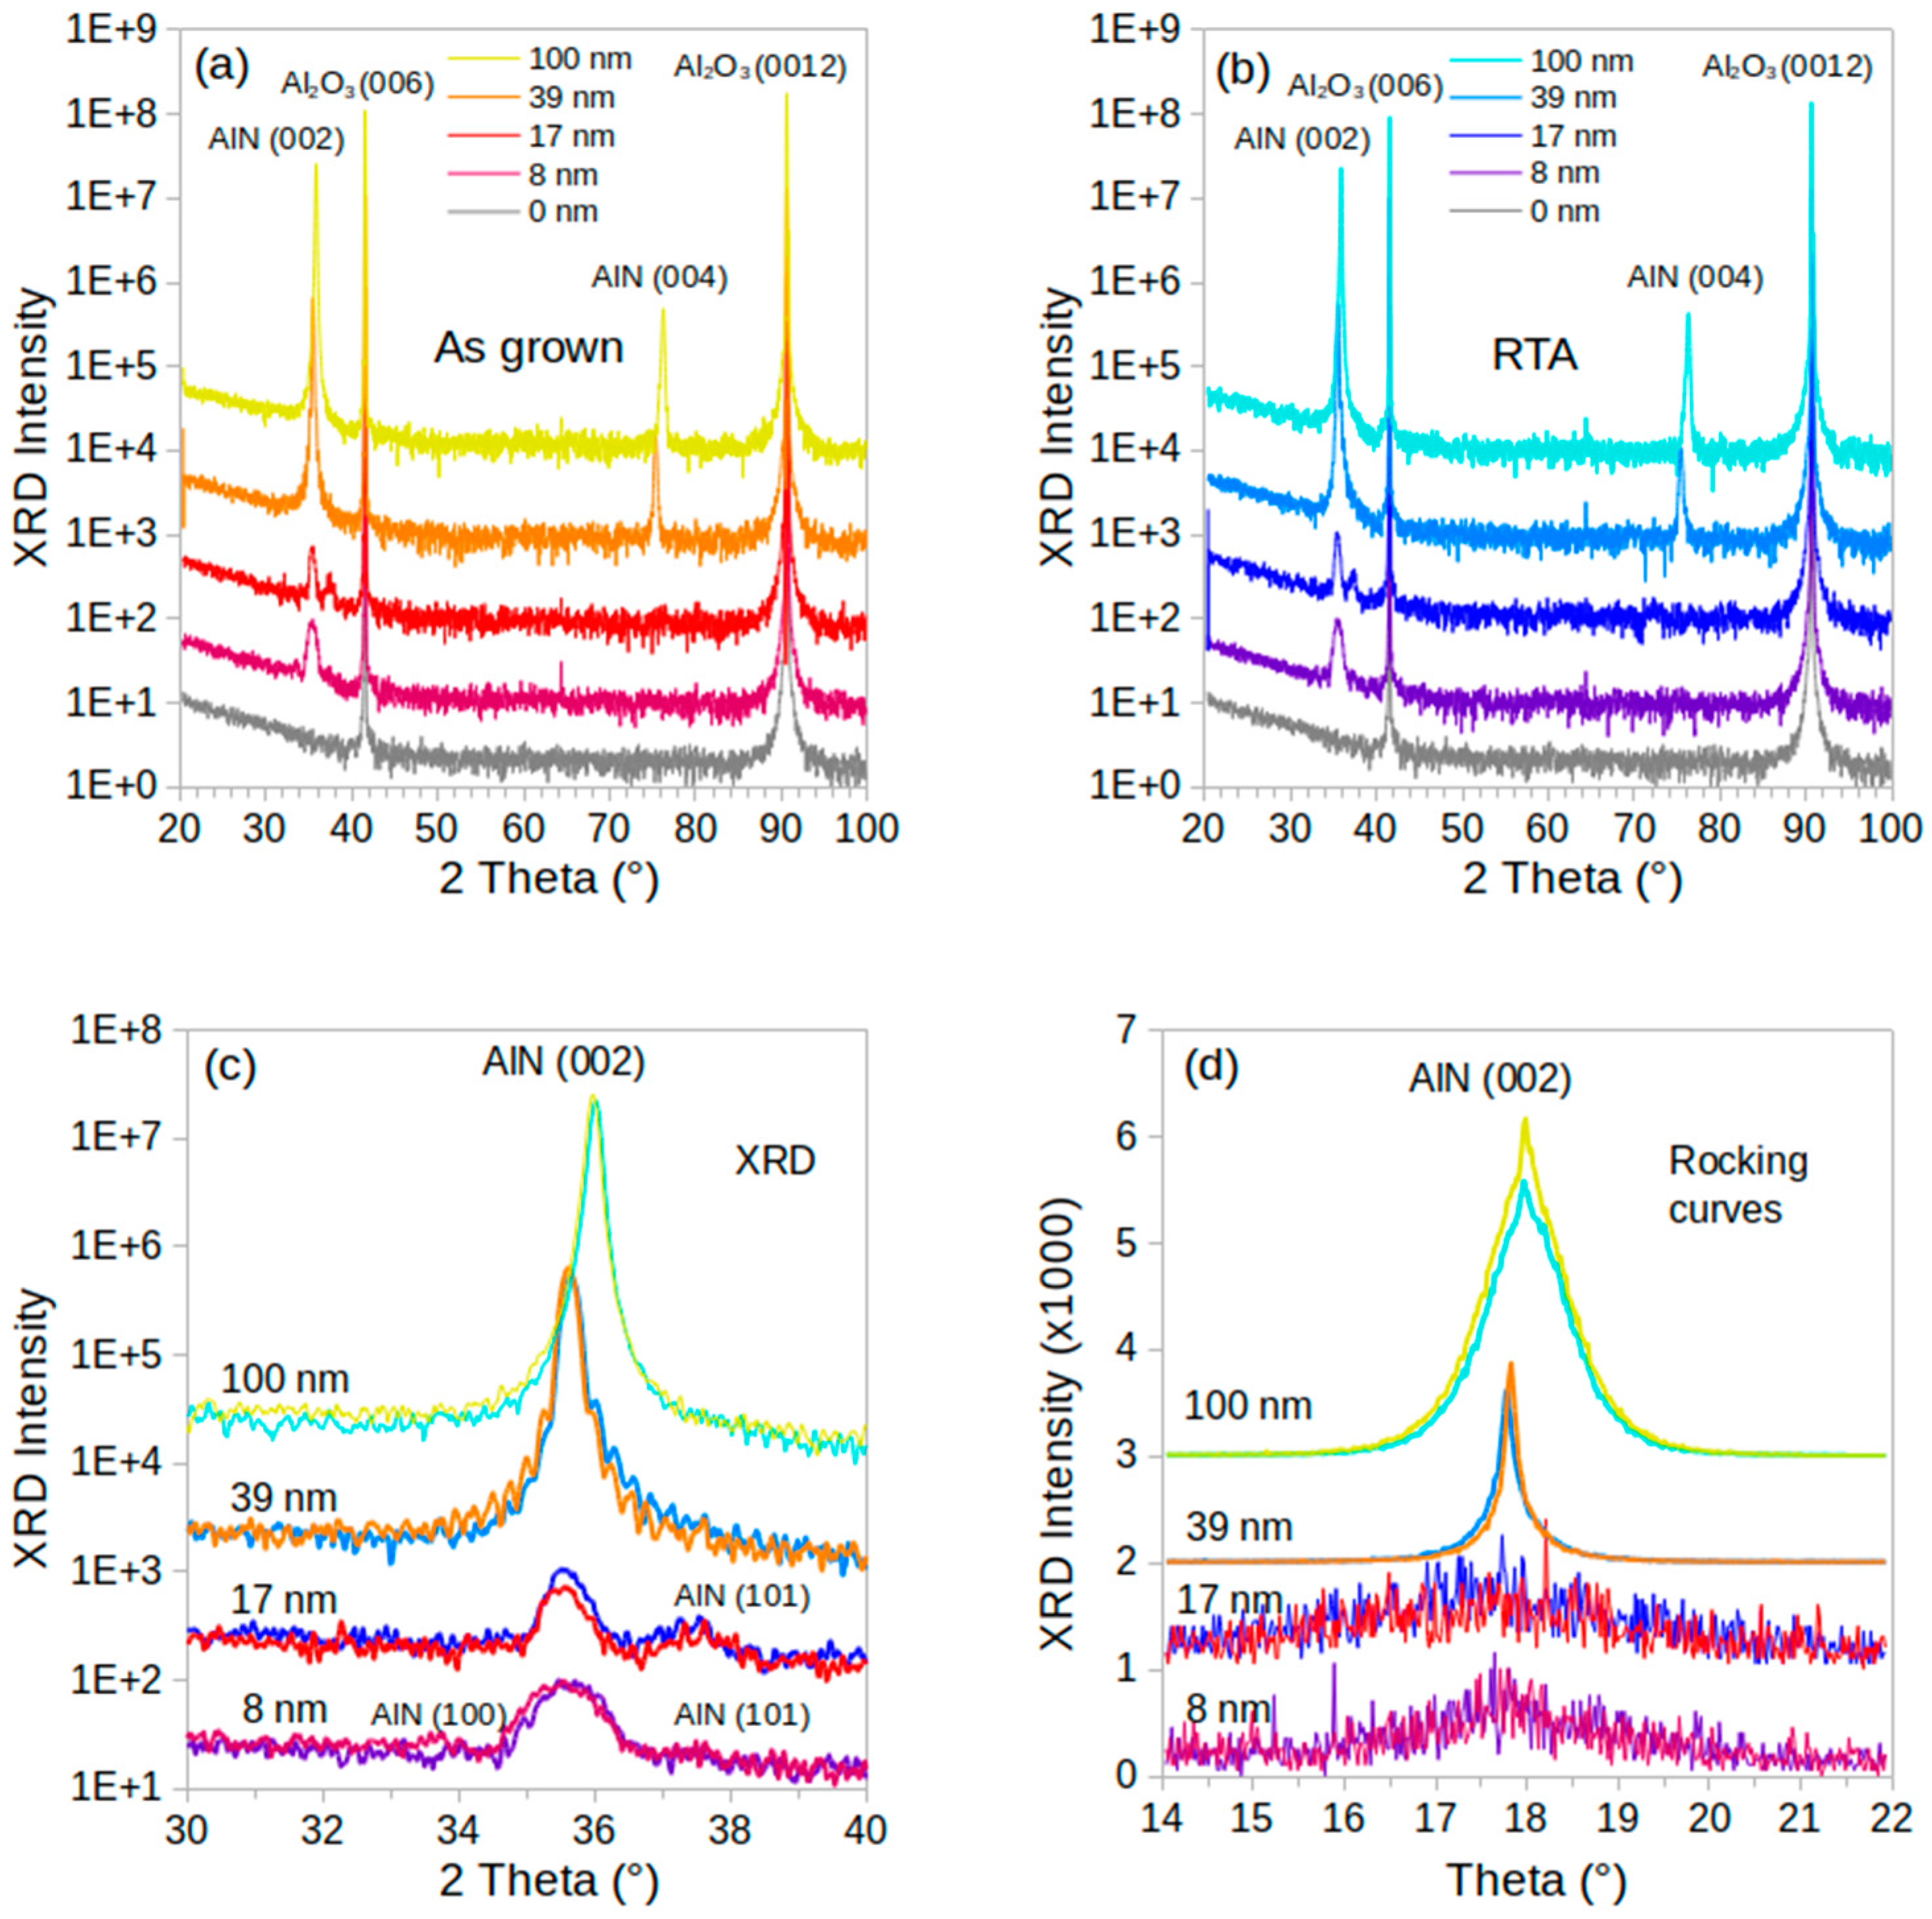
The theta–2theta X-ray diffractograms of the four different AlN films with varying thicknesses compared to the Al2O3 substrate are presented in Figure 2a,b for the “as-grown” and “RTA” samples. The X-ray diffraction measurements evidence c-axis-oriented AlN films onto the c-sapphire. For the thinner films (8 and 17 nm), broader (002) AlN diffraction peaks indicating smaller crystalline size and hints of (101) AlN orientation are observed. A minor (100) AlN Bragg peak is distinguished for the as-grown 8 nm film, not detected after annealing. For all the other samples, no essential differences can be observed between the as-grown and annealed samples.
The out-of-plane crystalline grain size calculated by the Scherrer equation [38] agrees quite well, considering a certain error, with whole-film thicknesses for the AlN films of approximately 9, 17 and 39 nm, indicating continuous grain growth all along the film thickness. In addition, in Figure 2a–c, a noticeable shift of the (002) Bragg peak (ranging between 35.52 and 35.64°) is observed for these films, indicating tensile stress (larger lattice constant c) for all these thinner AlN layers. In-plane compressive stress was also obtained by M. Ohtsuka et al. [39] for the AlN films on sapphire grown by pulsed DC reactive sputtering, depending on the sputtering pressure.
For the case of the 100 nm film, the obtained out-of-plane crystalline grain size calculated by the Scherrer formula is about 60 nm, being now smaller than the film thickness. Differing from the other films, two crystalline grains are inferred. This grain growth restraint might explain the stress relaxation as the film thickness increases, showing the 100 nm film having a (002) Bragg peak at 35.98°.
The (002) rocking curves, shown in Figure 2d, indicate very good (00l) alignment for both 40 and 100 nm thickness. For the 100 nm film, the observed two-component rocking curve related to regions or domains with different orders is compatible with the discontinuous grain growth previously mentioned. Among the sample series, we underline the highly c-axis crystalline order evidenced for the 39 nm film by XRD. The obtained full-width at half-maximum (FWHM) below 0.3° is very narrow compared to other oriented AlN films prepared by either DC or RF magnetron sputtering onto different substrates, including sapphire. [34] These results agree with those obtained by T. Aubert et al. [40], where highly (002)-textured AlN films with an FWHM of the rocking curve of less than 0.3° were achieved by RF sputtering under a high nitrogen concentration and moderate growth temperature (250 °C). In the present work, the highly oriented AlN films were obtained at similar sputtering conditions but a lower temperature (room temperature).
AFM measurements were performed on the samples at several selected positions to evaluate surface roughness. Representative AFM images are shown in Figure 3. The average root-mean-square (RMS) surface roughness is 0.41 nm (for the quartz substrate) and 0.34 nm, 0.30 nm and 0.31 nm, for the 8, 17 and 39 nm AlN films onto quartz. These results evidence smooth surfaces with an RMS surface roughness of around 0.3 nm for the investigated AlN films.

3.2. Effect of the AlN Film Thickness on the Harmonic Signal

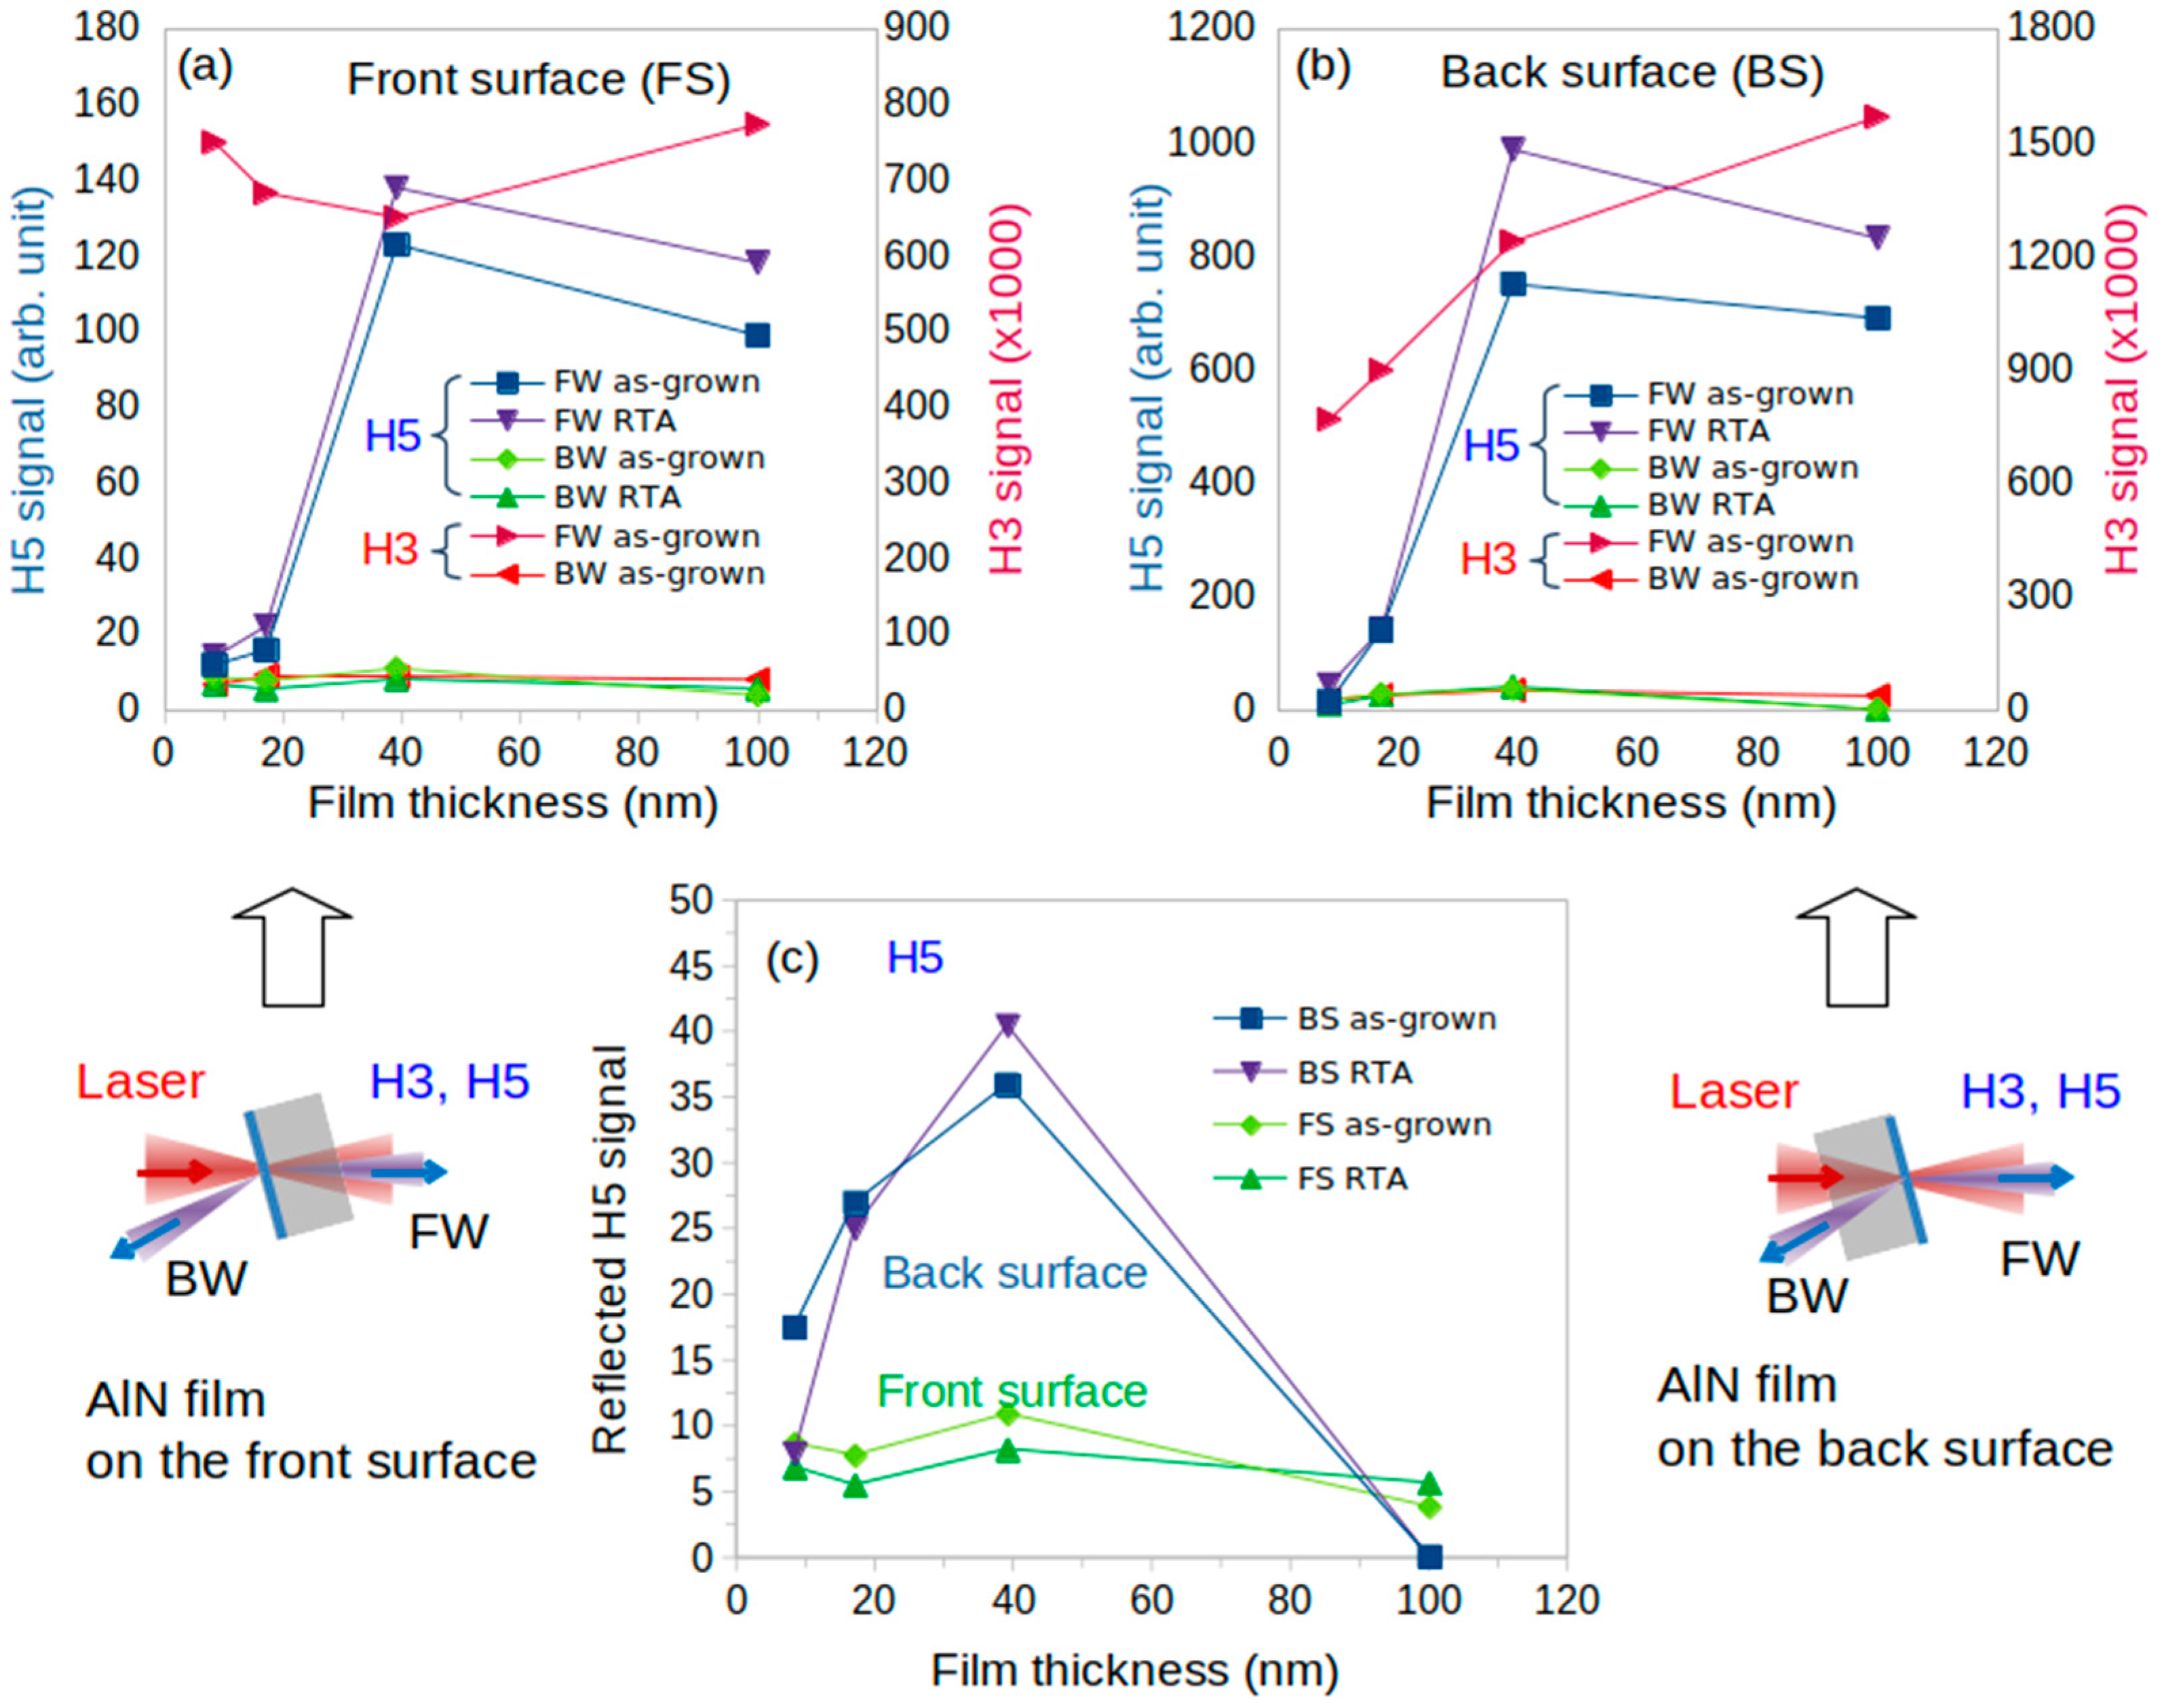
The previously described setup in Figure 1 allows measurement of the harmonic signals (H3 and H5) in both transmission (forward) and reflection (backward) based on the sample alignment. Hence, the samples were investigated in two orientations: with the AlN film on the front surface (incident laser hits the film first) and on the back surface (laser passes through the substrate before reaching the film), as shown in Figure 4. Furthermore, measurements were performed on samples with as-grown AlN films and with films after a rapid thermal annealing (RTA). The measurement results are presented in Figure 4.
Inspecting Figure 4, it is immediately obvious that the two thicker films, 39 nm and 100 nm, produced much higher H5 power in forward direction than the thinner films of 8 nm and 17 nm. Furthermore, when the AlN films were on the back surface of the substrate, the H5 signal was approx. 6 times stronger. A similar dependence of harmonic intensity on the film thickness was observed in quantum dots in [22]. Contrary to the forward direction, the backward H5 signals were weakly dependent on the film thickness, and especially for the films on the front surface, H5 was almost independent. For the sake of clarity, the backward H5 signals were also separately plotted in Figure 4c. However, the H3 power was in all cases weakly dependent on the film thickness both in the forward and backward directions. This difference can be explained in that H3 is a below-band-gap while H5 is an above-band-gap harmonic for AlN. A detailed explanation is presented in the Section 4.

3.3. Harmonic Power Dependence on the Laser Polarization

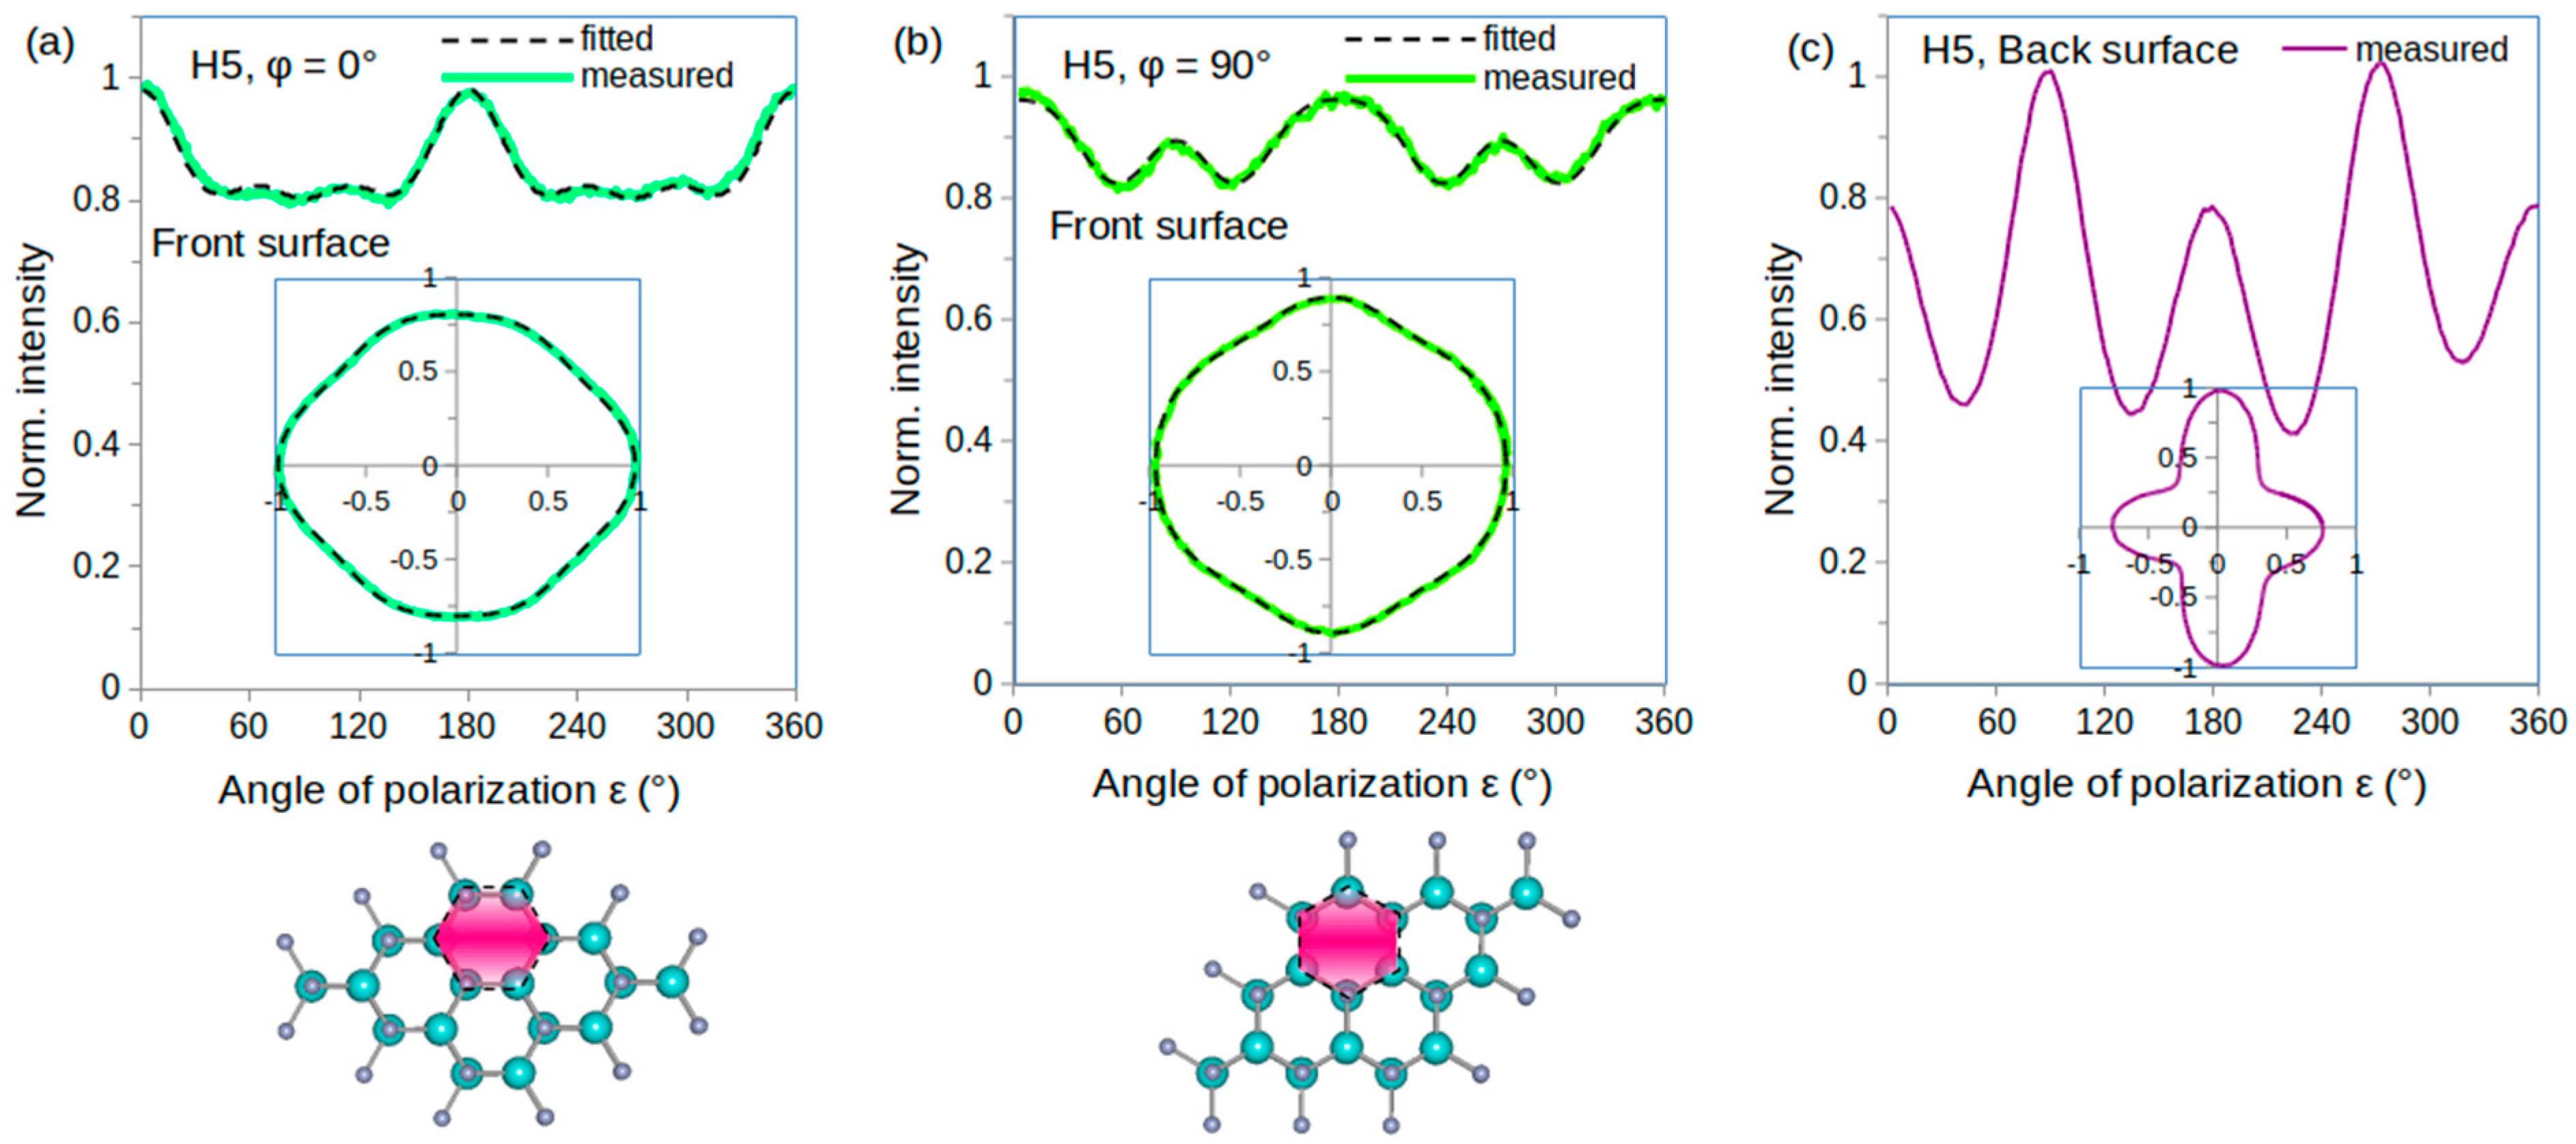
A high-order nonlinear interaction with a crystalline structure is an excellent tool for gaining information about the crystal structure and symmetries because nonlinear interactions strongly polarize the electron orbitals in the crystal and the orbital orientations follow the crystal structure. Electron orbitals and bonds can be randomly oriented in amorphous materials or oriented in certain well-defined directions in the periodic structures of crystals. By changing the polarization direction of the illuminating laser, nonlinear interactions increase when certain directions of the bond orientations are addressed. Considering our AlN films grown on a crystalline sapphire substrate, the AlN film follows the hexagonal structure of the sapphire surface with (001) orientation and grows in a hexagonal wurtzite structure (w-AlN) also with a (001) surface orientation. This hexagonal structure can be observed in the harmonic generation experiments, as presented in Figure 5. The sample was placed in such a way that the AlN film was on the front surface, where harmonics were generated. Choosing the front surface is crucial to obtain correct information about the polarization dependence, because any birefringence or optical activity of the substrate can distort the polarization of the incident laser beam and corrupt the measurement. To measure the polarization dependence of the generated harmonics, a half-wave plate was placed in the laser beam, the polarization direction was scanned via a motorized rotation stage, and the signal of the selected harmonic was measured after the monochromator.
It can be observed in the figures that the 6-fold symmetry of the w-AlN film is manifested when the film is on the front surface of the substrate, and the laser beam is not affected by the substrate before the interaction. The 6-fold symmetry has 60° rotational symmetry, meaning that at a 90° (or 30°) rotation of the sample along the (001) direction, the polarization dependence should change. This 90° rotation is clearly visible when comparing Figure 5a,b. When the AlN film is on the back surface, the laser beam passes through the substrate before reaching the AlN film. The birefringence of the sapphire substrate makes the laser elliptically polarized, which decreases the harmonic signal. The signal can only be maximal if the polarization direction is horizontal (x-axis) or vertical (y-axis), when the laser beam remains linearly polarized. This 4-fold symmetry is well visible in Figure 5c and dominating, while the much weaker 6-fold symmetry cannot be recognized.
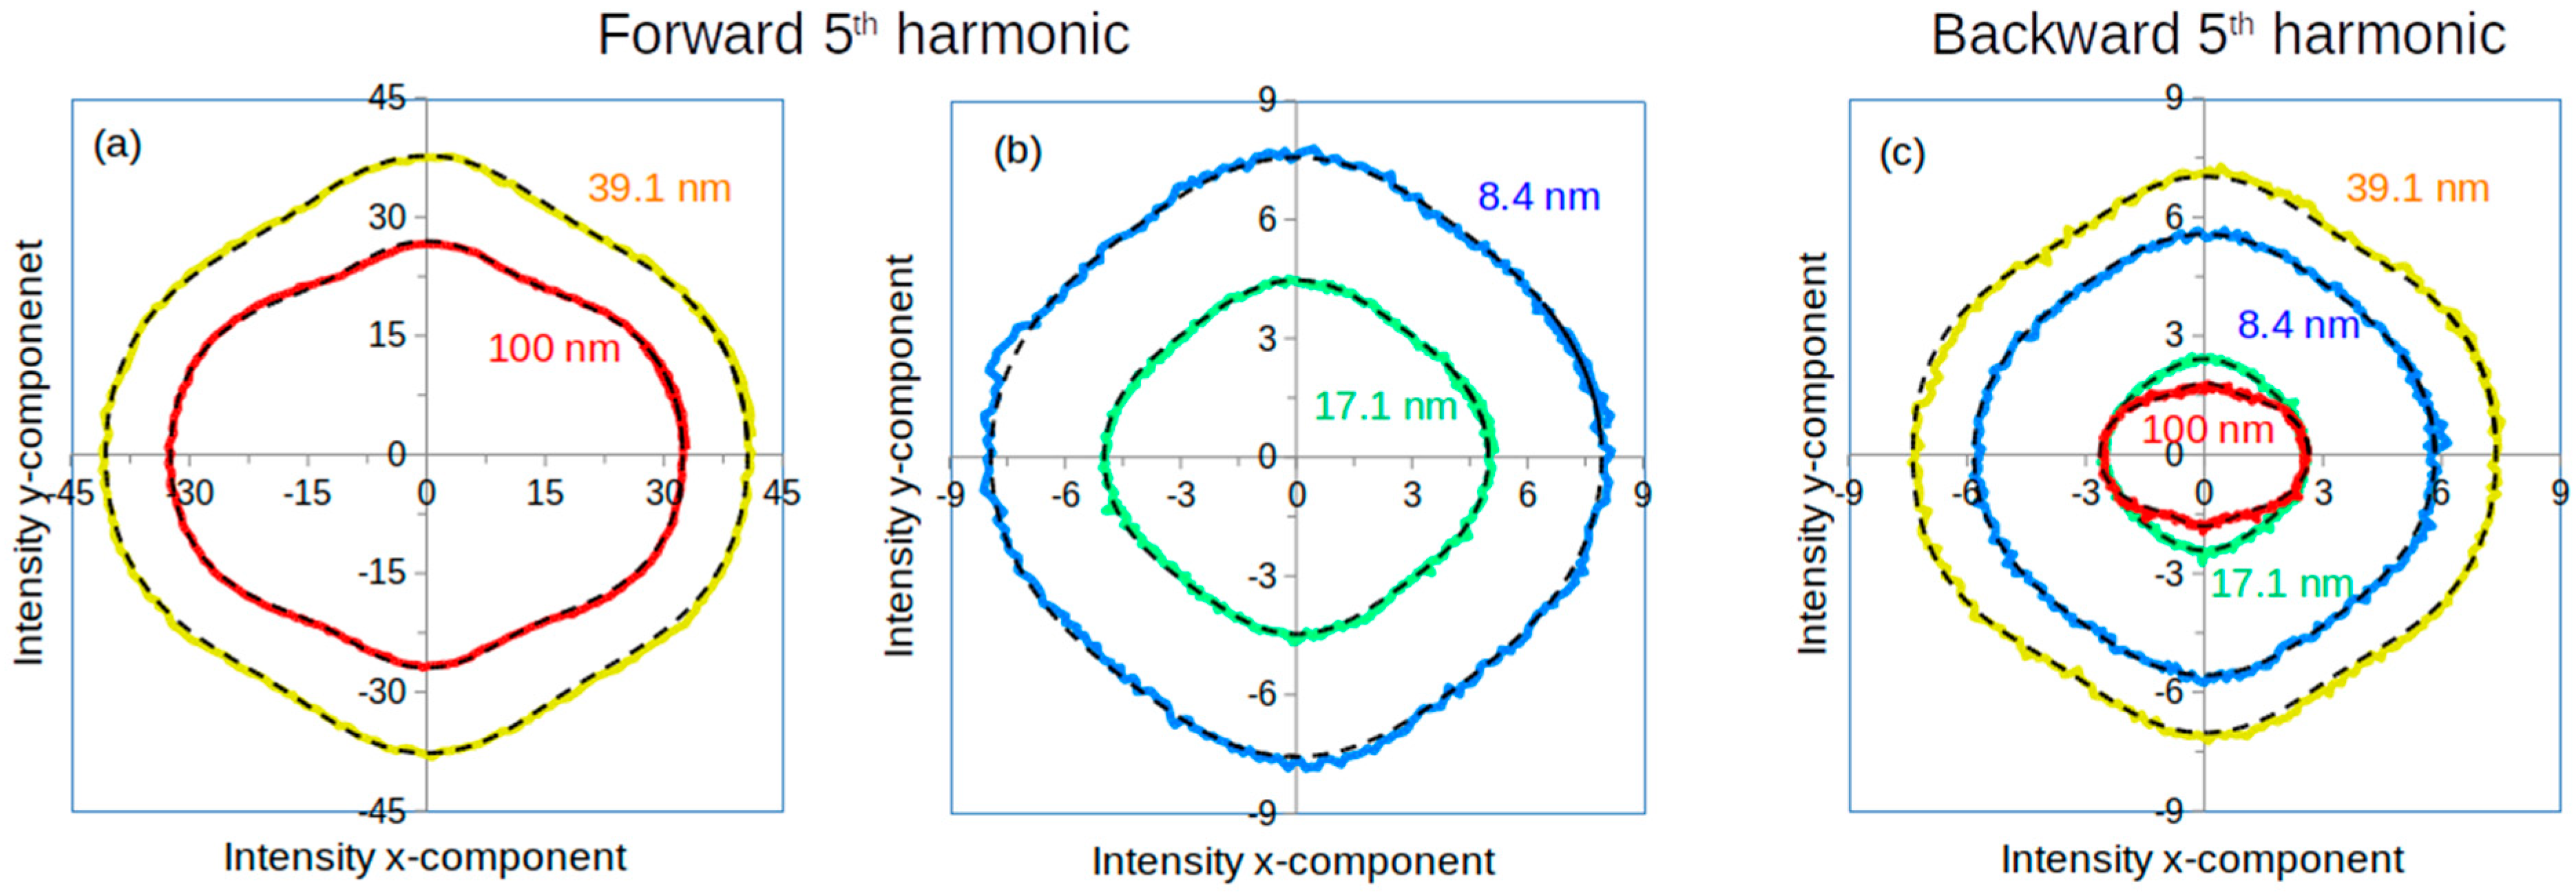
Furthermore, we examined the polarization dependence of the H5 signal for different AlN film thicknesses. The AlN film was also on the front surface of the sapphire substrate. The measurement results are plotted in Figure 6.
The measured polarization curves for the two thicker AlN films (39 nm and 100 nm) are separately plotted in Figure 6a from those of the two thinner AlN films in Figure 6b. This was chosen because of the large difference between the harmonic signals in the forward direction, which also can be seen in Figure 4a. Since the H5 signal is less dependent on the film thickness in the backward direction, Figure 6c shows all four films.
It can be observed for both the forward and backward directions that the two thicker films produce polarization curves with more obvious 6-fold symmetry, while for the two thinner films, the 6-fold symmetry still exists, but it is accompanied by 4-fold symmetry features. We simulated the polarization curves to understand this behavior, which is described in detail in the Section 4.

4. Discussion

4.1. Adaptation of the Bond Model to Describe the Polarization Dependence

To understand the polarization dependence of higher-order harmonics, susceptibility tensors of high orders are not the best approach because they are usually unknown, and in the case of strong-field interactions, the nonlinear processes are expected to be non-perturbative; their ranks usually differ from the order of the harmonics [7,11,23,24,27,28], and furthermore, susceptibility tensors are derived from perturbative interactions.
To describe and understand the shapes of the measured polarization curves in Figure 5a,b and Figure 6, the bond model of the harmonic generation [41,42,43] can be successfully used. This model was originally developed for describing perturbative harmonic generation, but it can be easily adapted and extended to a non-perturbative case. The bond model assumes that the system (in our case, the crystalline film) consists of electrons localized in bonds. The incident laser field can anharmonically polarize these bonds in the direction of the laser field, and consequently the polarization of the bonds depends on the relative directions of the laser polarization and the bonds. The polarized bonds radiate in the same direction as the laser polarization, and the superposition of these radiated fields produces the field of the harmonics. It is only necessary to know the directions of the bonds. The electric field of the q-th harmonic generated due to the anharmonic polarization of the bonds can be expressed [11] as
E q j α j b ^ j e ^ r
where α j is the strength of bond j; b ^ j and e ^ denote unit vectors giving the orientations (and not the direction) of the bond j and the electric field, which is expressed by the absolute value; and “r” is the rank of the process, which differs from the harmonic order (rq) for non-perturbative interactions and usually is a non-integer number [7,11,23,24,27,28]. The scalar product b ^ j e ^ is dependent only on the angle between the laser polarization and the bond.
It is important to note that this simple description of the non-perturbative HH generation assumes that the polarizability of the atoms/bonds is the same for positive and negative electric fields (centrosymmetric) and that the polarization direction of the harmonic is the same as that of the laser field. Consequently, it can be applied only for odd-order harmonics. However, the bond model can be used for even-order harmonics as well, as can be seen in [41,42,43] using a somewhat more complex formalism.
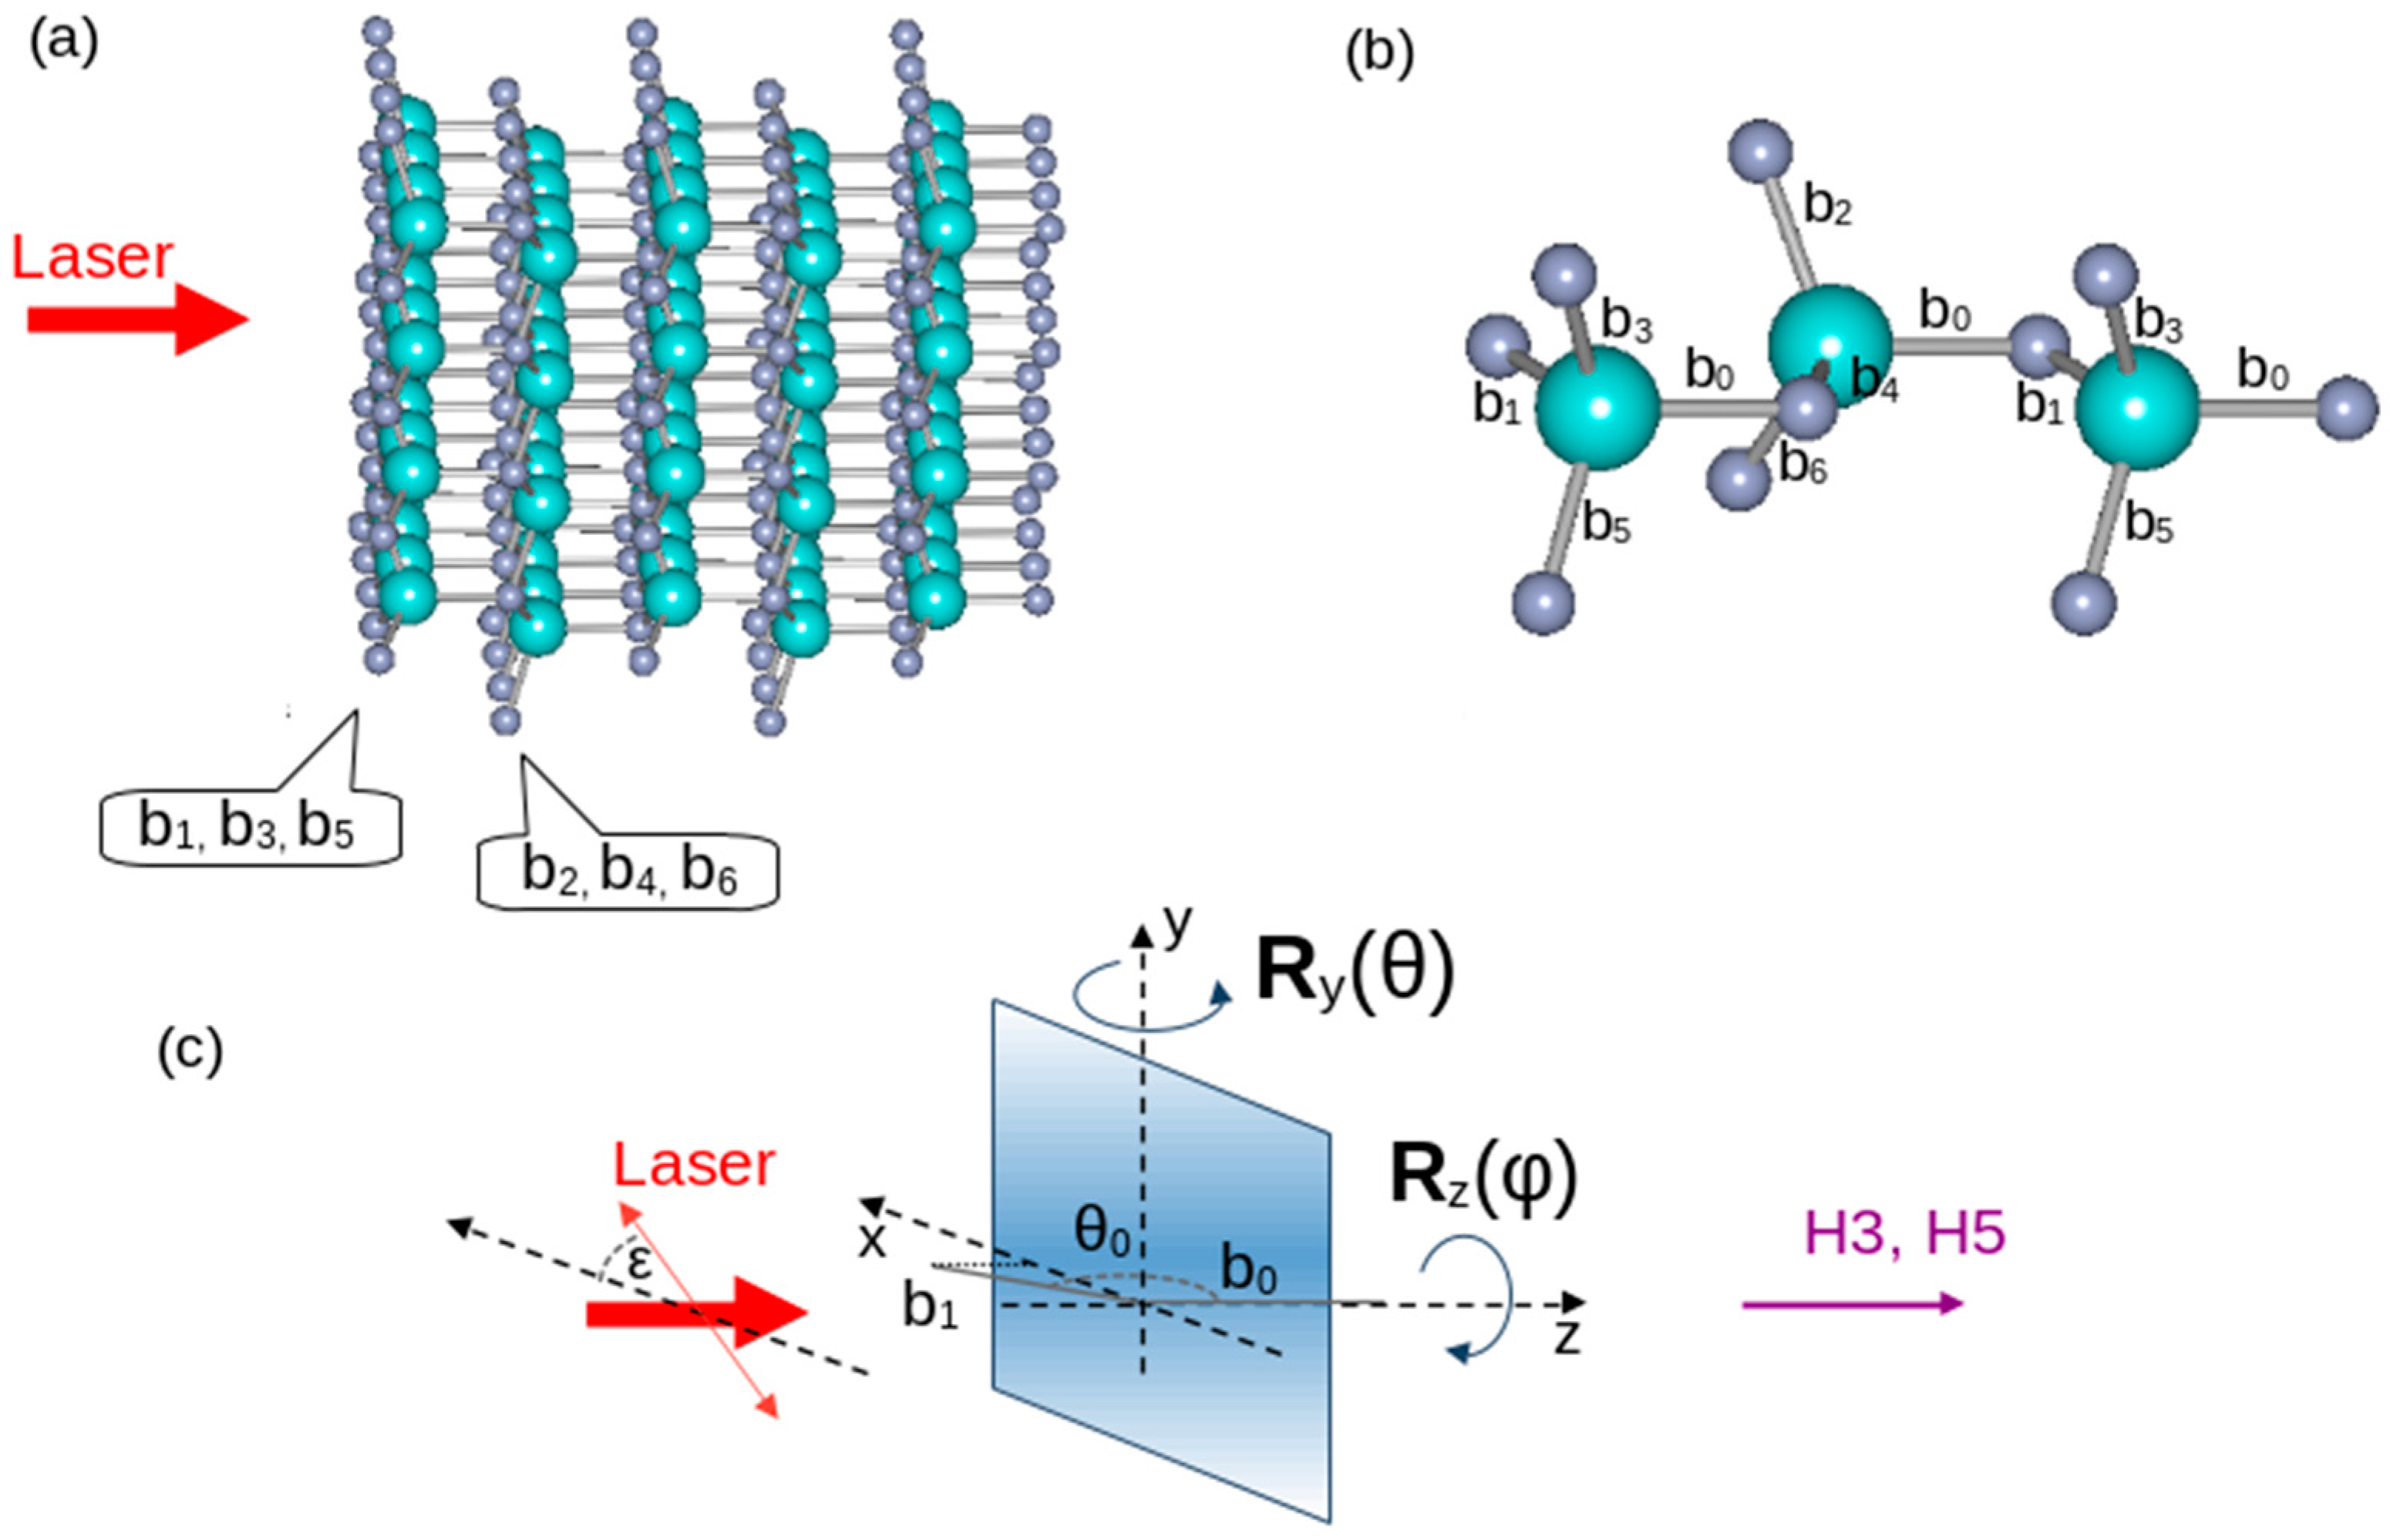
Following the notations described in Figure 7, the rotation matrices are as follows:
R z φ = c o s φ s i n φ 0 s i n φ c o s φ 0 0 0 1 ; R y θ = c o s θ 0 s i n θ 0 1 0 s i n θ 0 c o s θ ,
which can be used to produce the bond b1 from b0 by Ry rotation with θ0 = 108.19° and the further bonds by additional Rz rotation with φ j = φ 0 + j 1 60 ° , where φ0 = 0° or 90° is for Figure 5a or Figure 5b, respectively. The linear polarization of the electric field is defined by the angle ε as given in Figure 7c, and the bonds are
e ^ = c o s ε s i n ε 0 , b ^ 0 = 0 0 1 , b ^ j = R z φ j R y θ 0 b ^ 0 = s i n θ 0 c o s φ j s i n θ 0 s i n φ j c o s θ 0 .
Considering that the sample is further rotated along y-axes to obtain the θ = 25° angle of incidence, the final orientations of the bonds can be calculated as
b ^ j = R y θ R z φ j R y θ 0 b ^ 0 .

4.2. Obtaining the Shape of the Polarization Curves

Using the formalism described by Equations (1)–(4), it is possible to accurately reproduce the measured polarization curves in Figure 5a,b and in Figure 6, where fitted curves are plotted in dashed back lines. Because it is possible only to describe the measurement in arbitrary units, we are expecting equal bond strengths for b1 to b6 and set them to 1: α1 = α2 = … = α6 = 1, and the participation of the b0 bond as α0 is given in a relative unit. Additionally, we found that the “r” non-perturbative rank of the b0 bond as r0 should be considered as different from the same rank of all the other bj (j ≠ 0) bonds. The fitting parameters used are summarized in Table 1.
The measurements in Figure 5 were performed on the 39 nm thick AlN film and the corresponding parameters from Table 1 were used for fitting. The difference was only the rotation of the sample with φ0 = 0° or 90°. The participation of b0 bond was larger than that of other bonds, α0 = 3.36. The rank of the non-perturbative process was not so well defined: for b1-b6, it needed to be between 4.3 and 4.4, but for b0 a larger range from 5 to 6 was possible. As can be seen in Figure 5a,b, the calculated polarization curves match the measured ones excellently.
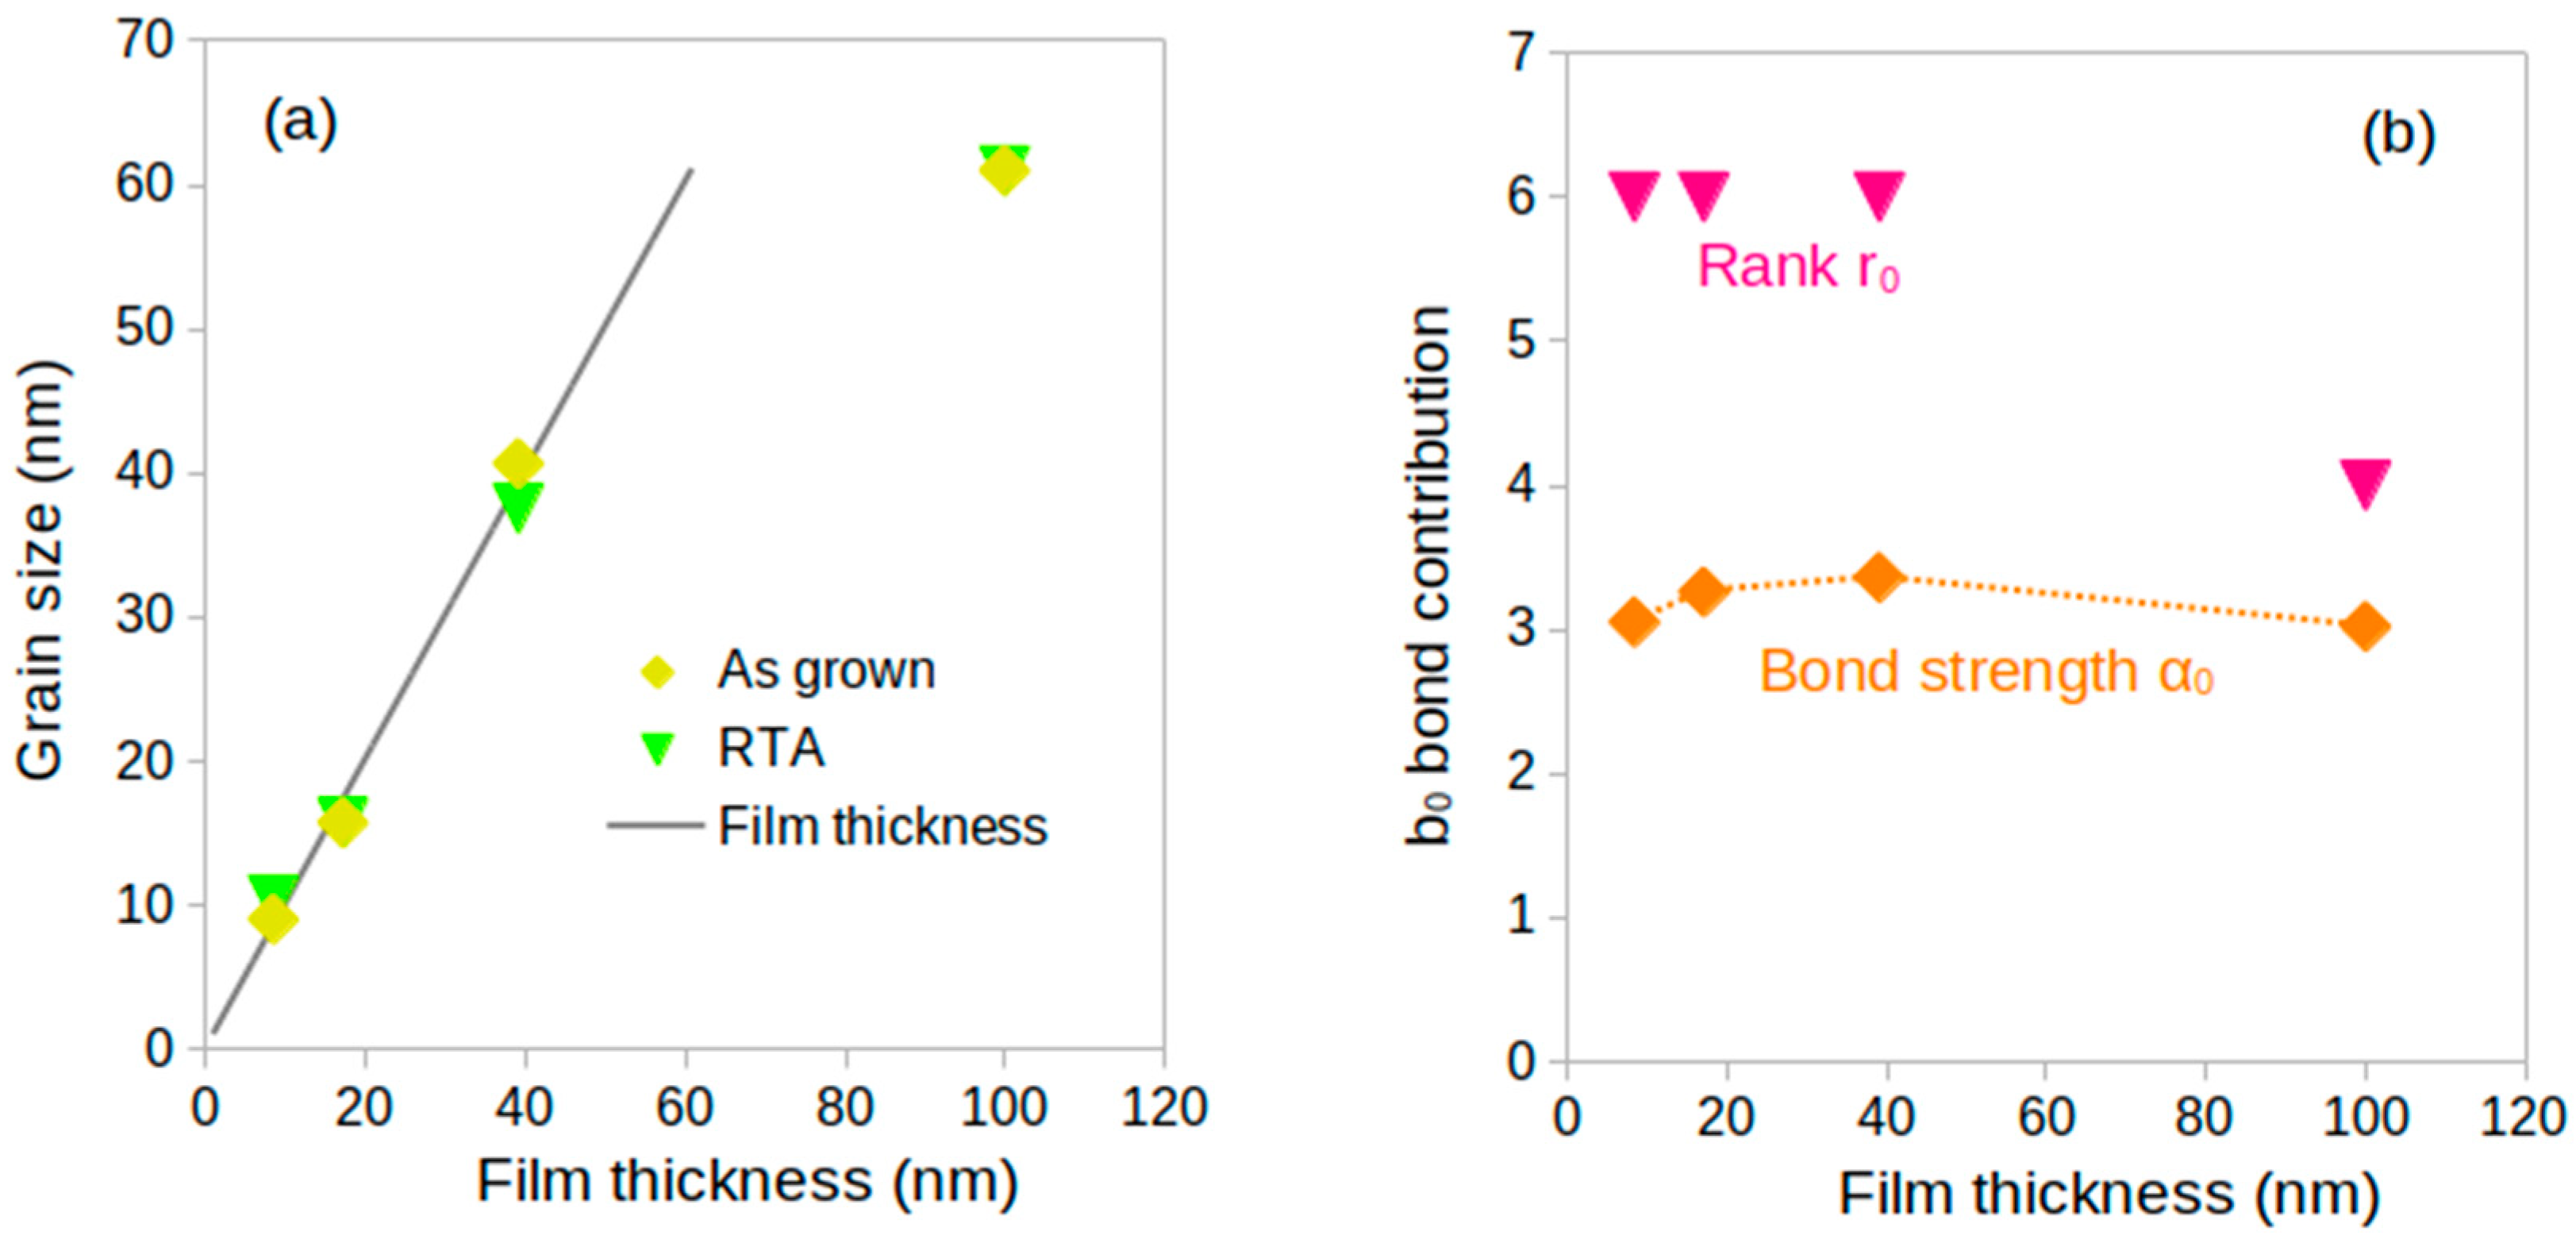
In Figure 6, the most interesting and dominant difference can be observed for the 100 nm film, for which r0 = 4 should be used for obtaining a good fitting, while for all other film thicknesses, r0 = 6. We compare this with the grain sizes of the films in Figure 8. As we already mentioned, the out-of-plane crystalline grain sizes calculated by the Scherrer equation [38] follow the film thicknesses for the three thinner films, indicating continuous grain growth all along the film thickness. As well, in Figure 2a–c, a noticeable shift of the (002) Bragg peak (ranging between 35.52 and 35.64°) is observed for these films, indicating tensile stress (larger lattice constant c) for all these thinner AlN layers. Because the b0 bond is in the c-direction, the presence of the tensile stress can be the reason for the high r0 = 6 rank of the bond contribution in the harmonic generation process. Studies also indicate the effect of the strain of the AlN on high-harmonic generation and optical properties [36,44].
For the case of the 100 nm film, the out-of-plane crystalline grain size is about 60 nm, being smaller than the film thickness. This grain growth restraint might explain the stress relaxation as the film thickness increases, with the 100 nm film showing a (002) Bragg peak at 35.98°. This stress relaxation can explain the smaller r0 = 4 rank of the b0 bonds, which is now almost the same as the ranks of the other bonds ranging between r = 4.2 and 4.4. Furthermore, differing from the other films, for the 100 nm film, two crystalline grains are inferred, which can cause the α0 contribution of the b0 bonds to become smaller, while for the thinner films, they increase slowly with the film thickness.

4.3. Harmonic Power Dependence on the Film Thicknesses

The behavior of the fitting parameters in Table 1 can also explain the measured power dependence of the harmonics (especially H5) plotted in Figure 4. The evolution of the crystalline characteristics of the films in Figure 2 can explain the H5 intensity dependency on the film thickness. The large increase in the forward H5 at a film thickness around 39 nm is in good correlation with the best crystalline quality of the same sample shown in Figure 2. Some of the decrease in the generated harmonic power in the case of the 100 nm film can be attributed to that the grain size became smaller than the film thickness, degrading the overall crystalline quality. RTA improved the forward H5 signal by around 20%; however, this increase is not essential, and XRD also shows only small differences in film quality for the as-grown and RTA films. For the ZnO film [1], a similarly low difference was measured for the annealed samples in case of odd-order harmonics; however, even-order harmonics were observed for the as-grown ZnO films. We did not observe even harmonics from the AlN films or observed only very weak ones at the detection limit, as can be seen in the inset of Figure 1; however H4 was observed at the Brewster angle of incidence [26]. For the backward H5 signal, the intensities from the 8 nm films are comparable to the forward signal, and the differences remain within the measurement accuracy. Contrary to the forward signals, the backward ones remain small and almost independent of the film thickness, as can be seen in Figure 4, but still a small maximum can be observed for the 39 nm film. Both for the forward and backward H5, the signal is larger when the AlN film is on the back surface of the sample. For H3, the observed differences between the harmonic signals generated on the front and back surface are smaller than that of H5. Of note, there is only a weak dependence on the film thickness.
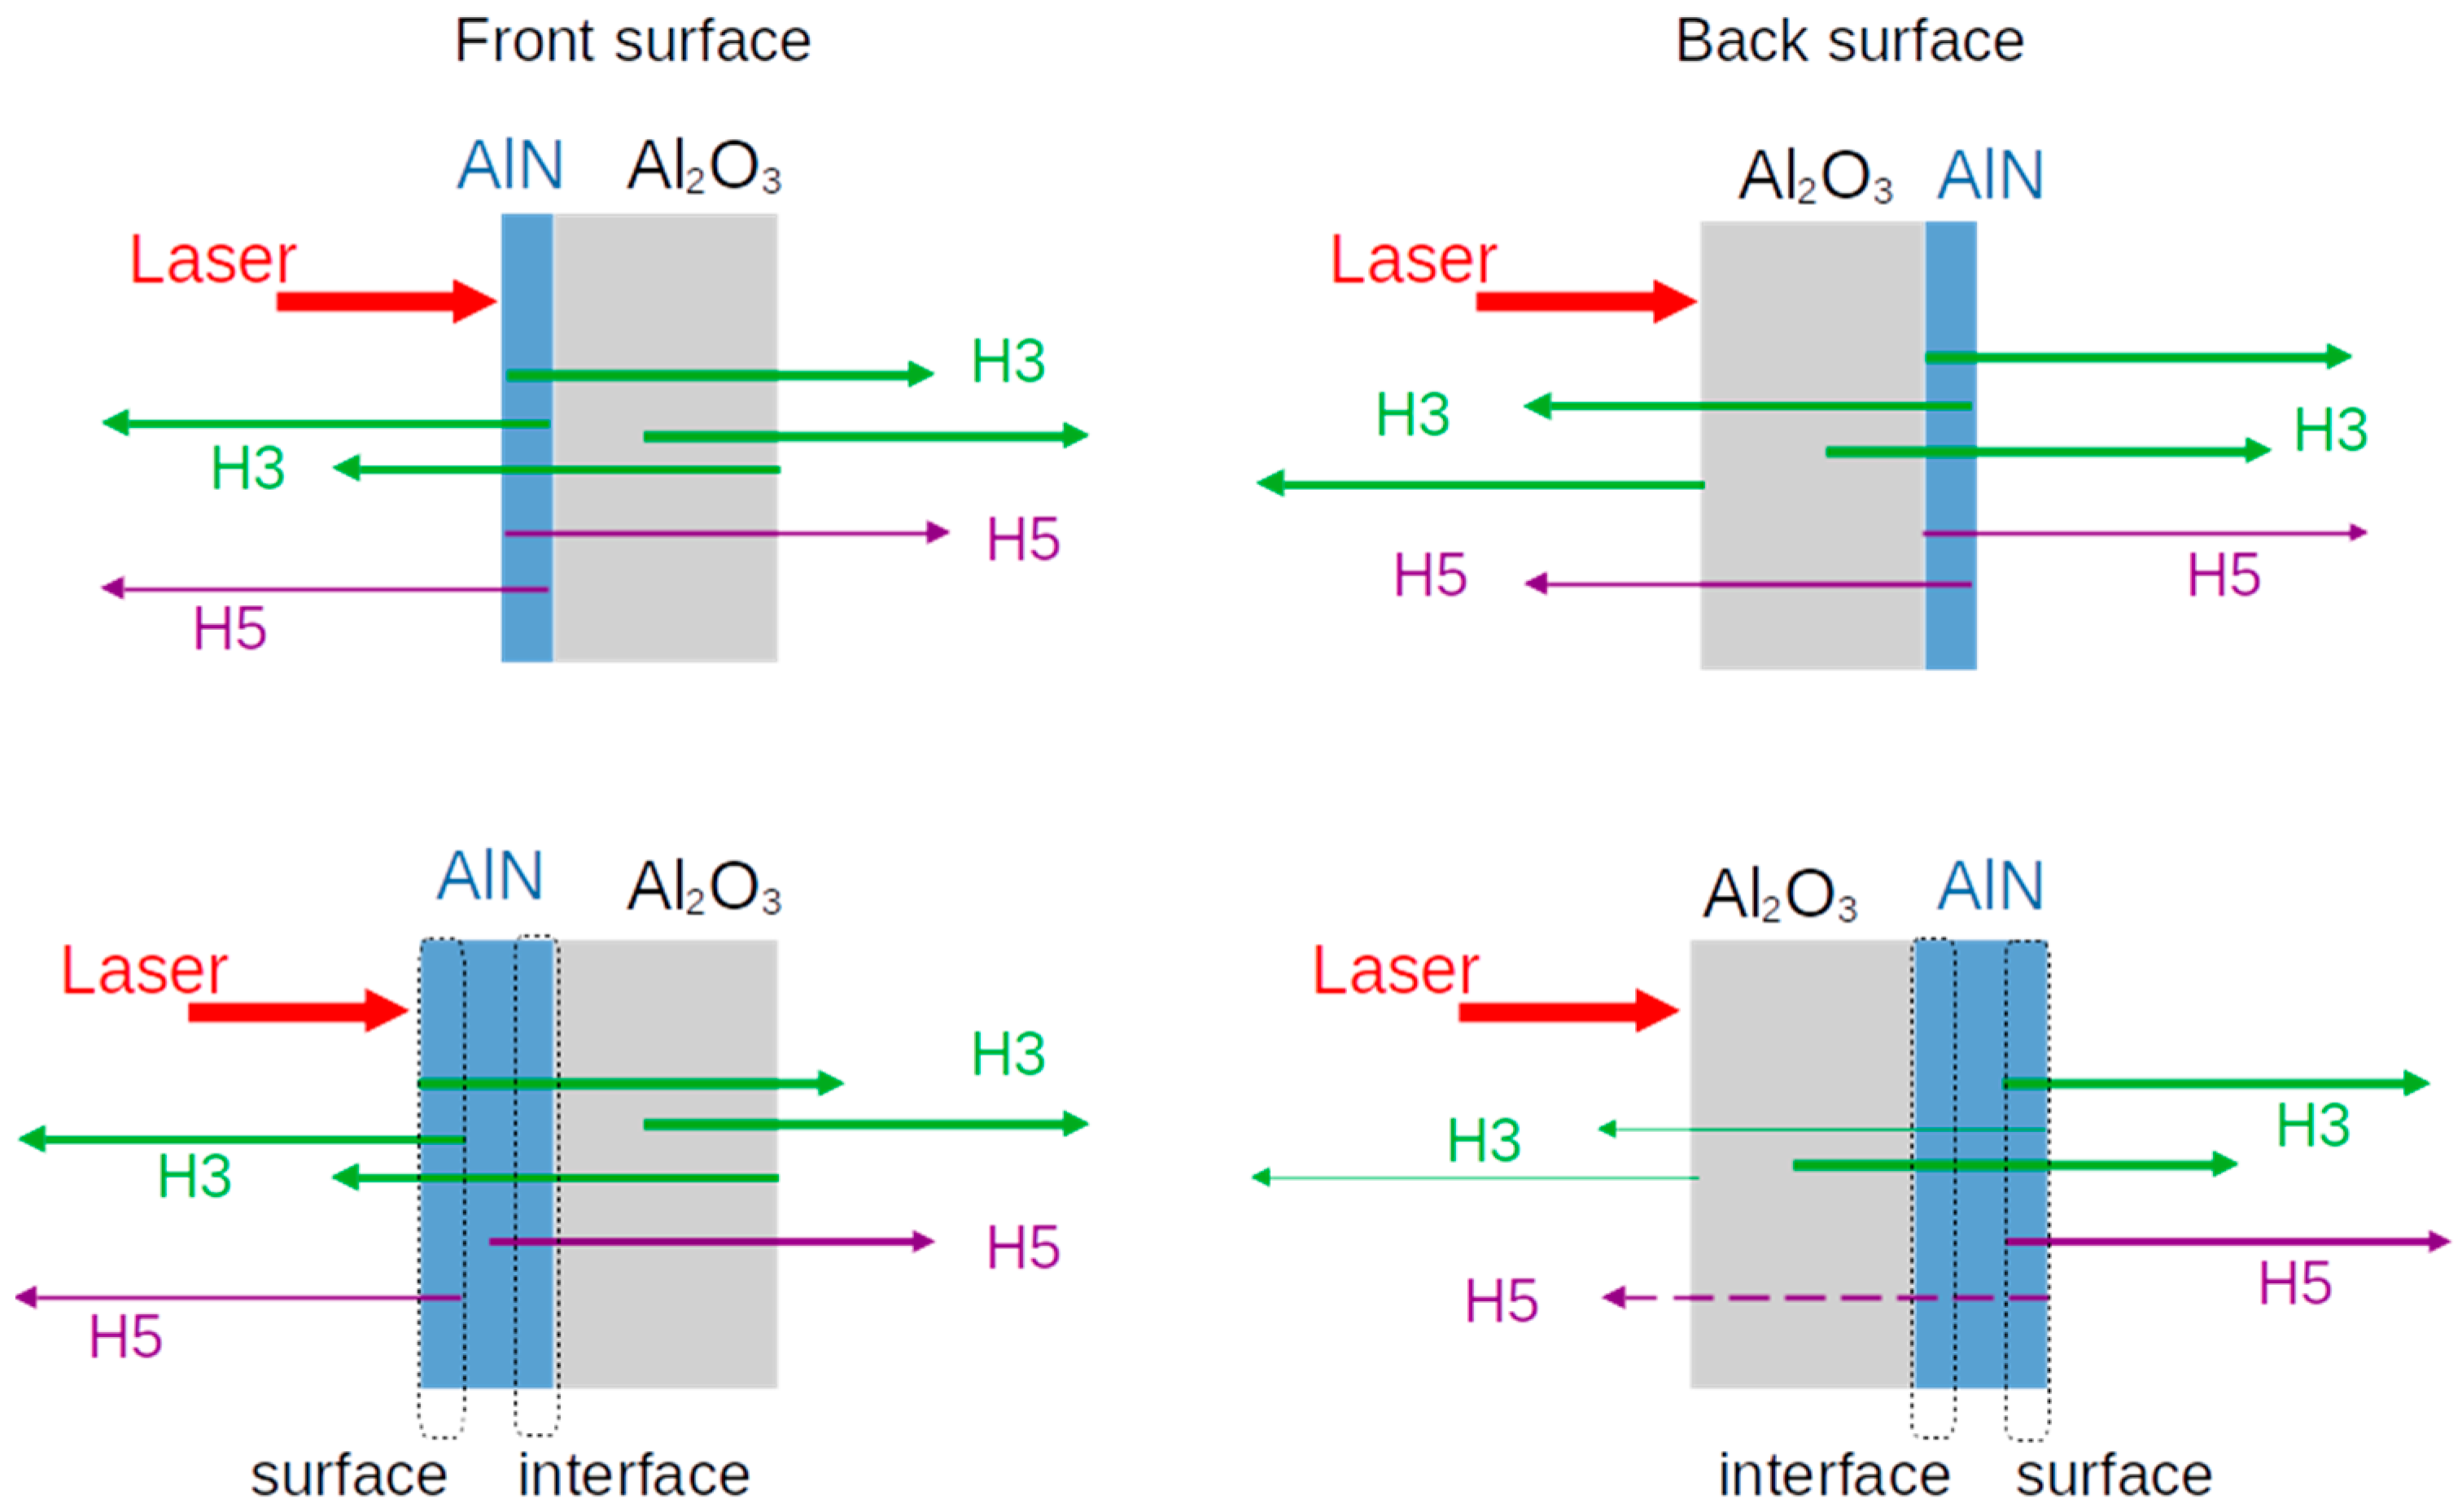
The observed behavior of the harmonic signals can be understood from Figure 9 considering that H3 is a below-band-gap harmonic without absorption and H5 is an above-band-gap harmonic experiencing absorption in the AlN film. The absorption length of H5 in AlN is around 10 nm [44]. This high absorption eliminates the Fabry–Perot effect [5] in our case. When the AlN film is suitably thin, as represented in the first row of Figure 9, absorption is not critical; however, the grain size of the AlN film is small, as can be seen from the XRD measurements in Figure 2, and consequently the generated H5 is small both in the backward and forward directions regardless of whether the film is on the front or the back surface of the sample. As the AlN films become thicker, grain size improves, and at a thickness of 39 nm, Figure 2 shows a very good crystalline quality. Because of the strong absorption of H5 in the film, H5 is mainly generated from the last approximately 10 nm of the material layer, meaning that H5 is generated from different parts of the film: from the surface layer or from the interface layer, depending on which direction the sample is illuminated by the laser pulses. This is significant because the crystalline properties at different parts of the film can be different [32], and it has been previously observed that harmonics from interfaces are usually weaker than from surfaces [13,14]. When the film is on the back surface, H5 is generated from the good-quality surface layer of the film; it does not experience reabsorption, and the strong H5 transmitted signal in Figure 4b is produced. However, when the film is on the front surface, H5 should be generated from the interface layer, where the film quality is still low, resulting in a weaker signal, similar to that from the very thin film. The H5 signal, which is generated somewhat earlier inside the film, where the film has better quality, is much stronger, and the remaining thin interface layer absorbs only a small part of the generated signal. This explains why the transmitted H5 signal in Figure 4a is still strong but weaker than in Figure 4b. The backward H5 signal is always generated from the surface layer if the film is on the front surface and remains almost independent of the film thickness. However, when the film is on the back surface, the backward H5 signal is generated from the surface layer and should be strong, but it has to go back through the film, which reabsorbs a part of the signal. This explains the stronger H5 backward signal in Figure 4c at thinner films and the lack of signal in the case of the 100 nm thick film, which completely absorbs the generated H5 signal. The effect of crystallization quality is also manifested in the fitting parameters of Table 1, namely in “r” and the expected refractive index of the sample “n”. It is observed in several measurements [33,44,45,46,47] that the refractive index of the AlN film depends on the film thickness and the growing methods, and it can change between 1.8 and 2.1. For forward H5 and for the 8 nm and 17 nm films, a good fitting required assuming a lower rank of r = 4.2 and a smaller refractive index of n = 2.0. As illustrated in Figure 9, the interface layer and the surface layer for thinner films are the same layer. For the two thicker films with higher forward H5 signals, a larger r = 4.4 and an n =2.1 are suitable, indicating better film quality in the range of the H5 generation, which now occurs inside the films for forward H5 and at the surface layer for backward H5.
In the case of H3, there is no reabsorption, and comparable signals are generated from the AlN film and also from the sapphire substrate, which explains the weak dependence of the H3 signal on the film thickness both when the films are on the front or on the back surface of the substrate. For H3, the cases do not make a significant difference; therefore, it is impossible to separate the H3 signal originating from the AlN film from the signal of the substrate, and the behavior of the H3 from the film cannot and was not studied in detail.

5. Conclusions

The effect of the thickness of an AlN film grown on a sapphire substrate on the generated high-harmonic power was examined. Two harmonics, the third harmonic and the fifth harmonic, were observed using short 28 fs pulses of a Ti:sapphire oscillator running at 800 nm. Owing to the ~6 eV band gap of the AlN films, the third harmonic was a below-band-gap and the fifth harmonic was an above-band-gap harmonic, while the sapphire substrate (band gap ~9 eV) was transparent at both harmonics. A strong enhancement of approx. 10 of the fifth-harmonic signal in the forward direction was observed for the thicker 39 nm and 100 nm films compared to the thinner 8 nm and 17 nm films. For the fifth harmonic generated in backward direction, only a weak dependence of the harmonic signal was measured.
To understand the observed behaviors, the films were investigated by X-ray diffraction and by measuring the fifth-harmonic power dependence on the laser polarization. Both methods presented good correlation and led to the conclusion that the observed behavior of the fifth harmonic is a consequence of the crystallization properties and the grain size of the grown films.
For the generated third harmonic, a weak dependence of the harmonic power on the film thickness was observed, which is attributed to the observation that the third harmonic is produced by both the AlN film and the sapphire substrate with comparable intensities.
Both the sapphire substrate and the AlN film on it are fully transparent across the optical spectral range. Even using third-harmonic generation, the AlN film cannot be clearly distinguished from the substrate. However, using the fifth-harmonic generation, the response of the AlN film becomes dominant or even exclusive, providing an excellent spectroscopic tool to study the films’ properties. In particular, if it is combined with XRD study, a more complete picture and comprehensive understanding of the films can be obtained. This method can be applied and further developed to examine other films on different substrates.

Author Contributions

Conceptualization, J.S., E.S. and T.S.; formal analysis, E.C., L.M.-d.-O. and M.Z.; investigation, J.S. and E.S.; writing—original draft preparation, J.S.; writing—review and editing, E.S., E.C., L.M.-d.-O., M.Z. and T.S.; supervision, T.S.; funding acquisition, T.S. and M.Z. All authors have read and agreed to the published version of the manuscript.

Funding

This work is part of the ThoriumNuclearClock project that has received funding from the European Research Council (ERC) under the European Union’s Horizon 2020 Research and Innovation Programme (grant agreement No. 856415). This work has received funding from the European Partnership on Metrology, co-financed by the European Union’s Horizon Europe Research and Innovation Programme and by the Participating States, under grant number 23FUN03 HIOC. We acknowledge support from the Österreichische Nationalstiftung für Forschung, Technologie und Entwicklung (AQUnet project). The Spanish ICTS Network “MICRONANOFABS” is partially funded by FEDER funds through “MINATEC-PLUS-2” project FICTS2019-02-40.

Institutional Review Board Statement

Not applicable.

Informed Consent Statement

Not applicable.

Data Availability Statement

Data presented in the publication are available from the corresponding author upon reasonable request.

Conflicts of Interest

The authors declare no conflicts of interest.

References

  1. Journigan, T.; Liu, Y.; Cabello, C.; Berriel, S.N.; Rudawski, N.G.; Banerjee, P.; Chini, M. High harmonic generation in epitaxially grown zinc oxide films. J. Opt. Soc. Am. B 2024, 41, B1–B6. [Google Scholar] [CrossRef]
  2. Rodríguez-Suné, L.; Scalora, M.; Johnson, A.S.; Cojocaru, C.; Akozbek, N.; Coppens, Z.J.; Perez-Salinas, D.; Wall, S.; Trull, J. Study of second and third harmonic generation from an indium tin oxide nanolayer: Influence of nonlocal effects and hot electrons. APL Photonics 2020, 5, 010801. [Google Scholar] [CrossRef]
  3. Korolev, V.; Sinelnik, A.D.; Rybin, M.V.; Lazarenko, P.; Kushchenko, O.M.; Glukhenkaya, V.; Kozyukhin, S.; Zuerch, M.; Spielmann, C.; Pertsch, T.; et al. Tunable high-order harmonic generation in GeSbTe nano-films. Nanophotonics 2024, 13, 3411–3419. [Google Scholar] [CrossRef]
  4. Yi, G.; Jeon, S.; Kwon, Y.W.; Park, J.; Nguyen, D.A.; Sandeep, C.S.S.; Hwang, W.S.; Hong, S.W.; Kim, S.; Kim, Y.-J. Enhanced third harmonic generation in ultrathin free-standing β-Ga2O3 nanomembranes: Study on surface and bulk contribution. Nanoscale 2022, 14, 175–186. [Google Scholar] [CrossRef] [PubMed]
  5. Biswas, R.; Dandu, M.; Menon, S.; Jha, K.K.; Jyothsna, K.M.; Majumdar, K.; Raghunathan, V. Third-harmonic generation in multilayer Tin Diselenide under the influence of Fabry-Perot interference effects. Opt. Express 2019, 27, 28855–28865. [Google Scholar] [CrossRef]
  6. Yang, H.; Long, Z.; Tian, K.; Lin, S.; He, L.; Zhao, D.; Li, Y.; Wu, H.; Chen, Z.-Y.; Wu, L.; et al. High-harmonic generation in polycrystalline CdTe nano-films via macroscopic investigations. Opt. Express 2022, 30, 47733–47743. [Google Scholar] [CrossRef]
  7. Zuber, D.; Kleinert, S.; Tajalli, A.; Steinecke, M.; Jupé, M.; Babushkin, I.; Ristau, D.; Morgner, U. Third and fifth order nonlinear susceptibilities in thin HfO2 layers. Opt. Express 2023, 31, 19309–19318. [Google Scholar] [CrossRef]
  8. Zheng, W.; Jiang, Y.; Wang, S.; Liu, C.; Bai, Y.; Liu, P.; Li, R. Frequency shift of even-order high harmonic generation in monolayer MoS2. Opt. Express 2023, 31, 27029–27040. [Google Scholar] [CrossRef]
  9. Chen, M.; Zhao, Y.; Ma, H.; Guo, M.; Zhang, G.; Chai, Y.; Jiang, H.; Lian, Y.; Wang, M.; Shao, J. Wavelength dependence of nonlinear optical susceptibility of ZnSe nanocrystalline film. Opt. Mater. 2022, 134, 113114. [Google Scholar] [CrossRef]
  10. Seres, J.; Seres, E.; Serrat, C.; Schumm, T. High harmonic generation in AlN due to out-of-surface electron orbitals. OSA Contin. 2021, 4, 47–54. [Google Scholar] [CrossRef]
  11. Seres, J.; Seres, E.; Céspedes, E.; Martinez-de-Olcoz, L.; Zabala, M.; Schumm, T. Nonperturbative Generation of Harmonics by Nanometer-Scale Localized Electronic States on the Surface of Bulk Materials and Nano-Films. Optics 2023, 4, 246–257. [Google Scholar] [CrossRef]
  12. Sekiguchi, F.; Yumoto, G.; Hirori, H.; Kanemitsu, Y. Polarization anomaly in high harmonics in the crossover region between perturbative and extreme nonlinearity in GaAs. Phys. Rev. B 2022, 106, L241201. [Google Scholar] [CrossRef]
  13. Tsang, T.Y.F. Optical third-harmonic generation at interfaces. Phys. Rev. A 1995, 52, 4116–4125. [Google Scholar] [CrossRef] [PubMed]
  14. Tsang, T. Third- and fifth-harmonic generation at the interfaces of glass and liquids. Phys. Rev. A 1996, 54, 5454–5457. [Google Scholar] [CrossRef] [PubMed]
  15. Semmlinger, M.; Zhang, M.; Tseng, M.L.; Huang, T.T.; Yang, J.; Tsai, D.P.; Nordlander, P.; Halas, N.J. Generating Third Harmonic Vacuum Ultraviolet Light with a TiO2 Metasurface. Nano Lett. 2019, 19, 8972–8978. [Google Scholar] [CrossRef]
  16. Sato, R.; Ishii, S.; Nagao, T.; Naito, M.; Takeda, Y. Broadband Plasmon Resonance Enhanced Third-Order Optical Nonlinearity in Refractory Titanium Nitride Nanostructures. ACS Photonics 2018, 59, 3452–3458. [Google Scholar] [CrossRef]
  17. Ganeev, R.A.; Kim, V.V.; Shuklov, I.A.; Popov, V.S.; Lavrentyev, N.A.; Ponomarenko, V.P.; Mardini, A.A.; Dyomkin, D.V.; Milenkovič, T.; Bundulis, A.; et al. Third harmonic generation in the thin films containing quantum dots and exfoliated nanoparticles. Appl. Phys. B 2022, 128, 202. [Google Scholar] [CrossRef]
  18. Guo, P.; Chang, R.P.; Schaller, R.D. Transient Negative Optical Nonlinearity of Indium Oxide Nanorod Arrays in the Full-Visible Range. ACS Photonics 2017, 4, 1494–1500. [Google Scholar] [CrossRef]
  19. Yan, Y.; Spear, N.J.; Meng, Q.; Singh, M.R.; Macdonald, J.E.; Haglund, R.F. Harmonic Generation up to Fifth Order from Al/Au/CuS Nanoparticle Films. Nano Lett. 2024, 24, 5085–5092. [Google Scholar] [CrossRef]
  20. Lu, P.; Yan, T.; Huang, J.; Xing, T.; Liu, H.; Han, Z.; Xu, X.; Tao, C. ITO-Induced Nonlinear Optical Response Enhancement of Titanium Nitride Thin Films. Nanomaterials 2024, 14, 1040. [Google Scholar] [CrossRef]
  21. Kim, S.; Jeong, T.I.; Park, J.; Ciappina, M.F.; Kim, S. Recent advances in ultrafast plasmonics: From strong field physics to ultraprecision spectroscopy. Nanophotonics 2022, 11, 2393–2431. [Google Scholar] [CrossRef]
  22. Nakagawa, K.; Hirori, H.; Sato, S.A.; Tahara, H.; Sekiguchi, F.; Yumoto, G.; Saruyama, M.; Sato, R.; Teranishi, T.; Kanemitsu, Y. Size-controlled quantum dots reveal the impact of intraband transitions on high-order harmonic generation in solids. Nat. Phys. 2022, 18, 874–878. [Google Scholar] [CrossRef]
  23. Peterka, P.; Šobáň, Z.; Trojánek, F.; Malý, P.; Kozák, M. High harmonic generation enhanced by magnetic dipole resonance in an amorphous silicon metasurface. Opt. Express 2023, 31, 6401–6410. [Google Scholar] [CrossRef] [PubMed]
  24. Han, S. High-Harmonic Generation Using a Single Dielectric Nanostructure. Photonics 2022, 9, 427. [Google Scholar] [CrossRef]
  25. Seres, J.; Seres, E.; Céspedes, E.; Martinez-de-Olcoz, L.; Zabala, M.; Schumm, T. Probing nonperturbative third and fifth harmonic generation on silicon without and with thermal oxide layer. J. Opt. 2023, 25, 105501. [Google Scholar] [CrossRef]
  26. Seres, E.; Seres, J.; Martinez-de-Olcoz, L.; Schumm, T. Compact tunable 80 MHz repetition rate vacuum ultraviolet light source up to 10 eV: Intracavity high harmonic generation by nonlinear reflection on a AlN nanofilm in a mode locked Ti: Sapphire oscillator. Opt. Express 2024, 32, 17593–17605. [Google Scholar] [CrossRef]
  27. Xia, P.; Kim, C.; Lu, F.; Kanai, T.; Akiyama, H.; Itatani, J.; Ishii, N. Nonlinear propagation effects in high harmonic generation in reflection and transmission from gallium arsenide. Opt. Express 2018, 26, 29393–29400. [Google Scholar] [CrossRef]
  28. Kaassamani, S.; Auguste, T.; Tancogne-Dejean, N.; Liu, X.; Boutu, W.; Merdji, H.; Gauthier, D. Polarization spectroscopy of high-order harmonic generation in gallium arsenide. Opt. Express 2022, 30, 40531–40539. [Google Scholar] [CrossRef]
  29. Tilmann, B.; Huq, T.; Possmayer, T.; Dranczewski, J.; Nickel, B.; Zhang, H.; Krivitsky, L.; Kuznetsov, A.I.; de S. Menezes, L.; Vezzoli, S.; et al. Comparison of Harmonic Generation from Crystalline and Amorphous Gallium Phosphide Nanofilms. Adv. Opt. Mater. 2023, 11, 2300269. [Google Scholar] [CrossRef]
  30. You, Y.; Yin, Y.; Wu, Y.; Chew, A.; Ren, X.; Zhuang, F.; Gholam-Mirzaei, S.; Chini, M.; Chang, Z.; Ghimire, S. High-harmonic generation in amorphous solids. Nat. Commun. 2017, 8, 724. [Google Scholar] [CrossRef]
  31. Liu, S.; Li, Y.; Tao, J.; Tang, R.; Zheng, X. Structural, Surface, and Optical Properties of AlN Thin Films Grown on Different Substrates by PEALD. Crystals 2023, 13, 910. [Google Scholar] [CrossRef]
  32. Abdallah, B.; Duquenne, C.; Besland, M.P.; Gautron, E.; Jouan, P.Y.; Tessier, P.Y.; Brault, J.; Cordier, Y.; Djouadi, M.A. Thickness and substrate effects on AlN thin film growth at room temperature. Eur. Phys. J. Appl. Phys. 2008, 43, 309–313. [Google Scholar] [CrossRef]
  33. Galca, A.C.; Stan, G.E.; Trinca, L.M.; Negrila, C.C.; Nistor, L.C. Structural and optical properties of c-axis oriented aluminum nitride thin films prepared at low temperature by reactive radio-frequency magnetron sputtering. Thin. Solid Film. 2012, 524, 328–333. [Google Scholar] [CrossRef]
  34. Iqbal, A.; Mohd-Yasin, F. Reactive Sputtering of Aluminum Nitride (002) Thin Films for Piezoelectric Applications: A Review. Sensors 2018, 18, 1797. [Google Scholar] [CrossRef] [PubMed]
  35. Zhao, M.; Xu, C.H.; Hu, W.J.; Wang, W.J.; Guo, L.W.; Chen, X.L. Observation of Two-Photon Absorption and Nonlinear Refraction in AlN. Chin. Phys. Lett. 2016, 33, 104201. [Google Scholar] [CrossRef]
  36. Wang, Z.W.; Jiang, S.C.; Yuan, G.L.; Wu, T.; Li, C.; Qian, C.; Jin, C.; Yu, C.; Hua, W.J.; Lu, R.F. Strain effect on the orientation-dependent harmonic spectrum of monolayer aluminum nitride. Sci. China-Phys. Mech. Astron. 2020, 63, 257311. [Google Scholar] [CrossRef]
  37. Sun, C.J.; Kung, P.; Saxler, A.; Ohsato, H.; Haritos, K.; Razeghi, M. A crystallographic model of (00·1) aluminum nitride epitaxial thin film growth on (00·1) sapphire substrate. J. Appl. Phys. 1994, 75, 3964. [Google Scholar] [CrossRef]
  38. Patterson, A.L. The scherrer formula for X-ray particle size determination. Phys. Rev. 1939, 56, 978–982. [Google Scholar] [CrossRef]
  39. Ohtsuka, M.; Takeuchi, H.; Fukuyama, H. Effect of sputtering pressure on crystalline quality and residual stress of AlN films deposited at 823 K on nitrided sapphire substrates by pulsed dc reactive sputtering. Jpn. J. Appl. Phys. 2016, 55, 05FD08. [Google Scholar] [CrossRef]
  40. Aubert, T.; Assouar, M.B.; Legrani, O.; Elmazria, O.; Tiusan, C.; Robert, S. Highly textured growth of AlN films on sapphire by magnetron sputtering for high temperature surface acoustic wave applications. J. Vac. Sci. Technol. A 2011, 29, 021010. [Google Scholar] [CrossRef]
  41. Hardhienata, H.; Faci, S.; Alejo-Molina, A.; Priatama, M.R.; Alatas, H.; Birowosuto, M.D. Quo Vadis Nonlinear Optics? An Alternative and Simple Approach to Third Rank Tensors in Semiconductors. Symmetry 2022, 14, 127. [Google Scholar] [CrossRef]
  42. Powell, G.D.; Wang, J.-F.; Aspnes, D.E. Simplified bond-hyperpolarizability model of second harmonic generation. Phys. Rev. B 2002, 65, 205320. [Google Scholar] [CrossRef]
  43. Hardhienata, H.; Priyadi, I.; Alatas, H.; Birowosuto, M.D.; Coquet, P. Bond model of second-harmonic generation in wurtzite ZnO(0002) structures with twin boundaries. J. Opt. Soc. Am. B 2019, 36, 1127–1137. [Google Scholar] [CrossRef]
  44. Kecik, D.; Bacaksiz, C.; Senger, R.T.; Durgun, E. Layer- and strain-dependent optoelectronic properties of hexagonal AlN. Phys. Rev. B 2015, 92, 165408. [Google Scholar] [CrossRef]
  45. Bowman, S.R.; Brown, C.G.; Taczak, B. Optical dispersion and phase matching in gallium nitride and aluminum nitride. Opt. Mater. Express 2018, 8, 1091–1099. [Google Scholar] [CrossRef]
  46. Wethkamp, T.; Wilmers, K.; Cobet, C.; Esser, N.; Richter, W.; Ambacher, O.; Stutzmann, M.; Cardona, M. Dielectric function of hexagonal AlN films determined by spectroscopic ellipsometry in the vacuum-uv spectral range. Phys. Rev. B 1999, 59, 1845–1849. [Google Scholar] [CrossRef]
  47. Gao, X.D.; Jiang, E.Y.; Liu, H.H.; Li, G.K.; Mi, W.B.; Li, Z.Q.; Wu, P.; Bai, H.L. Fabrication and characterization of orientated grown AlN films sputtered at room temperature. Phys. Stat. Sol. (a) 2007, 204, 1130–1137. [Google Scholar] [CrossRef]
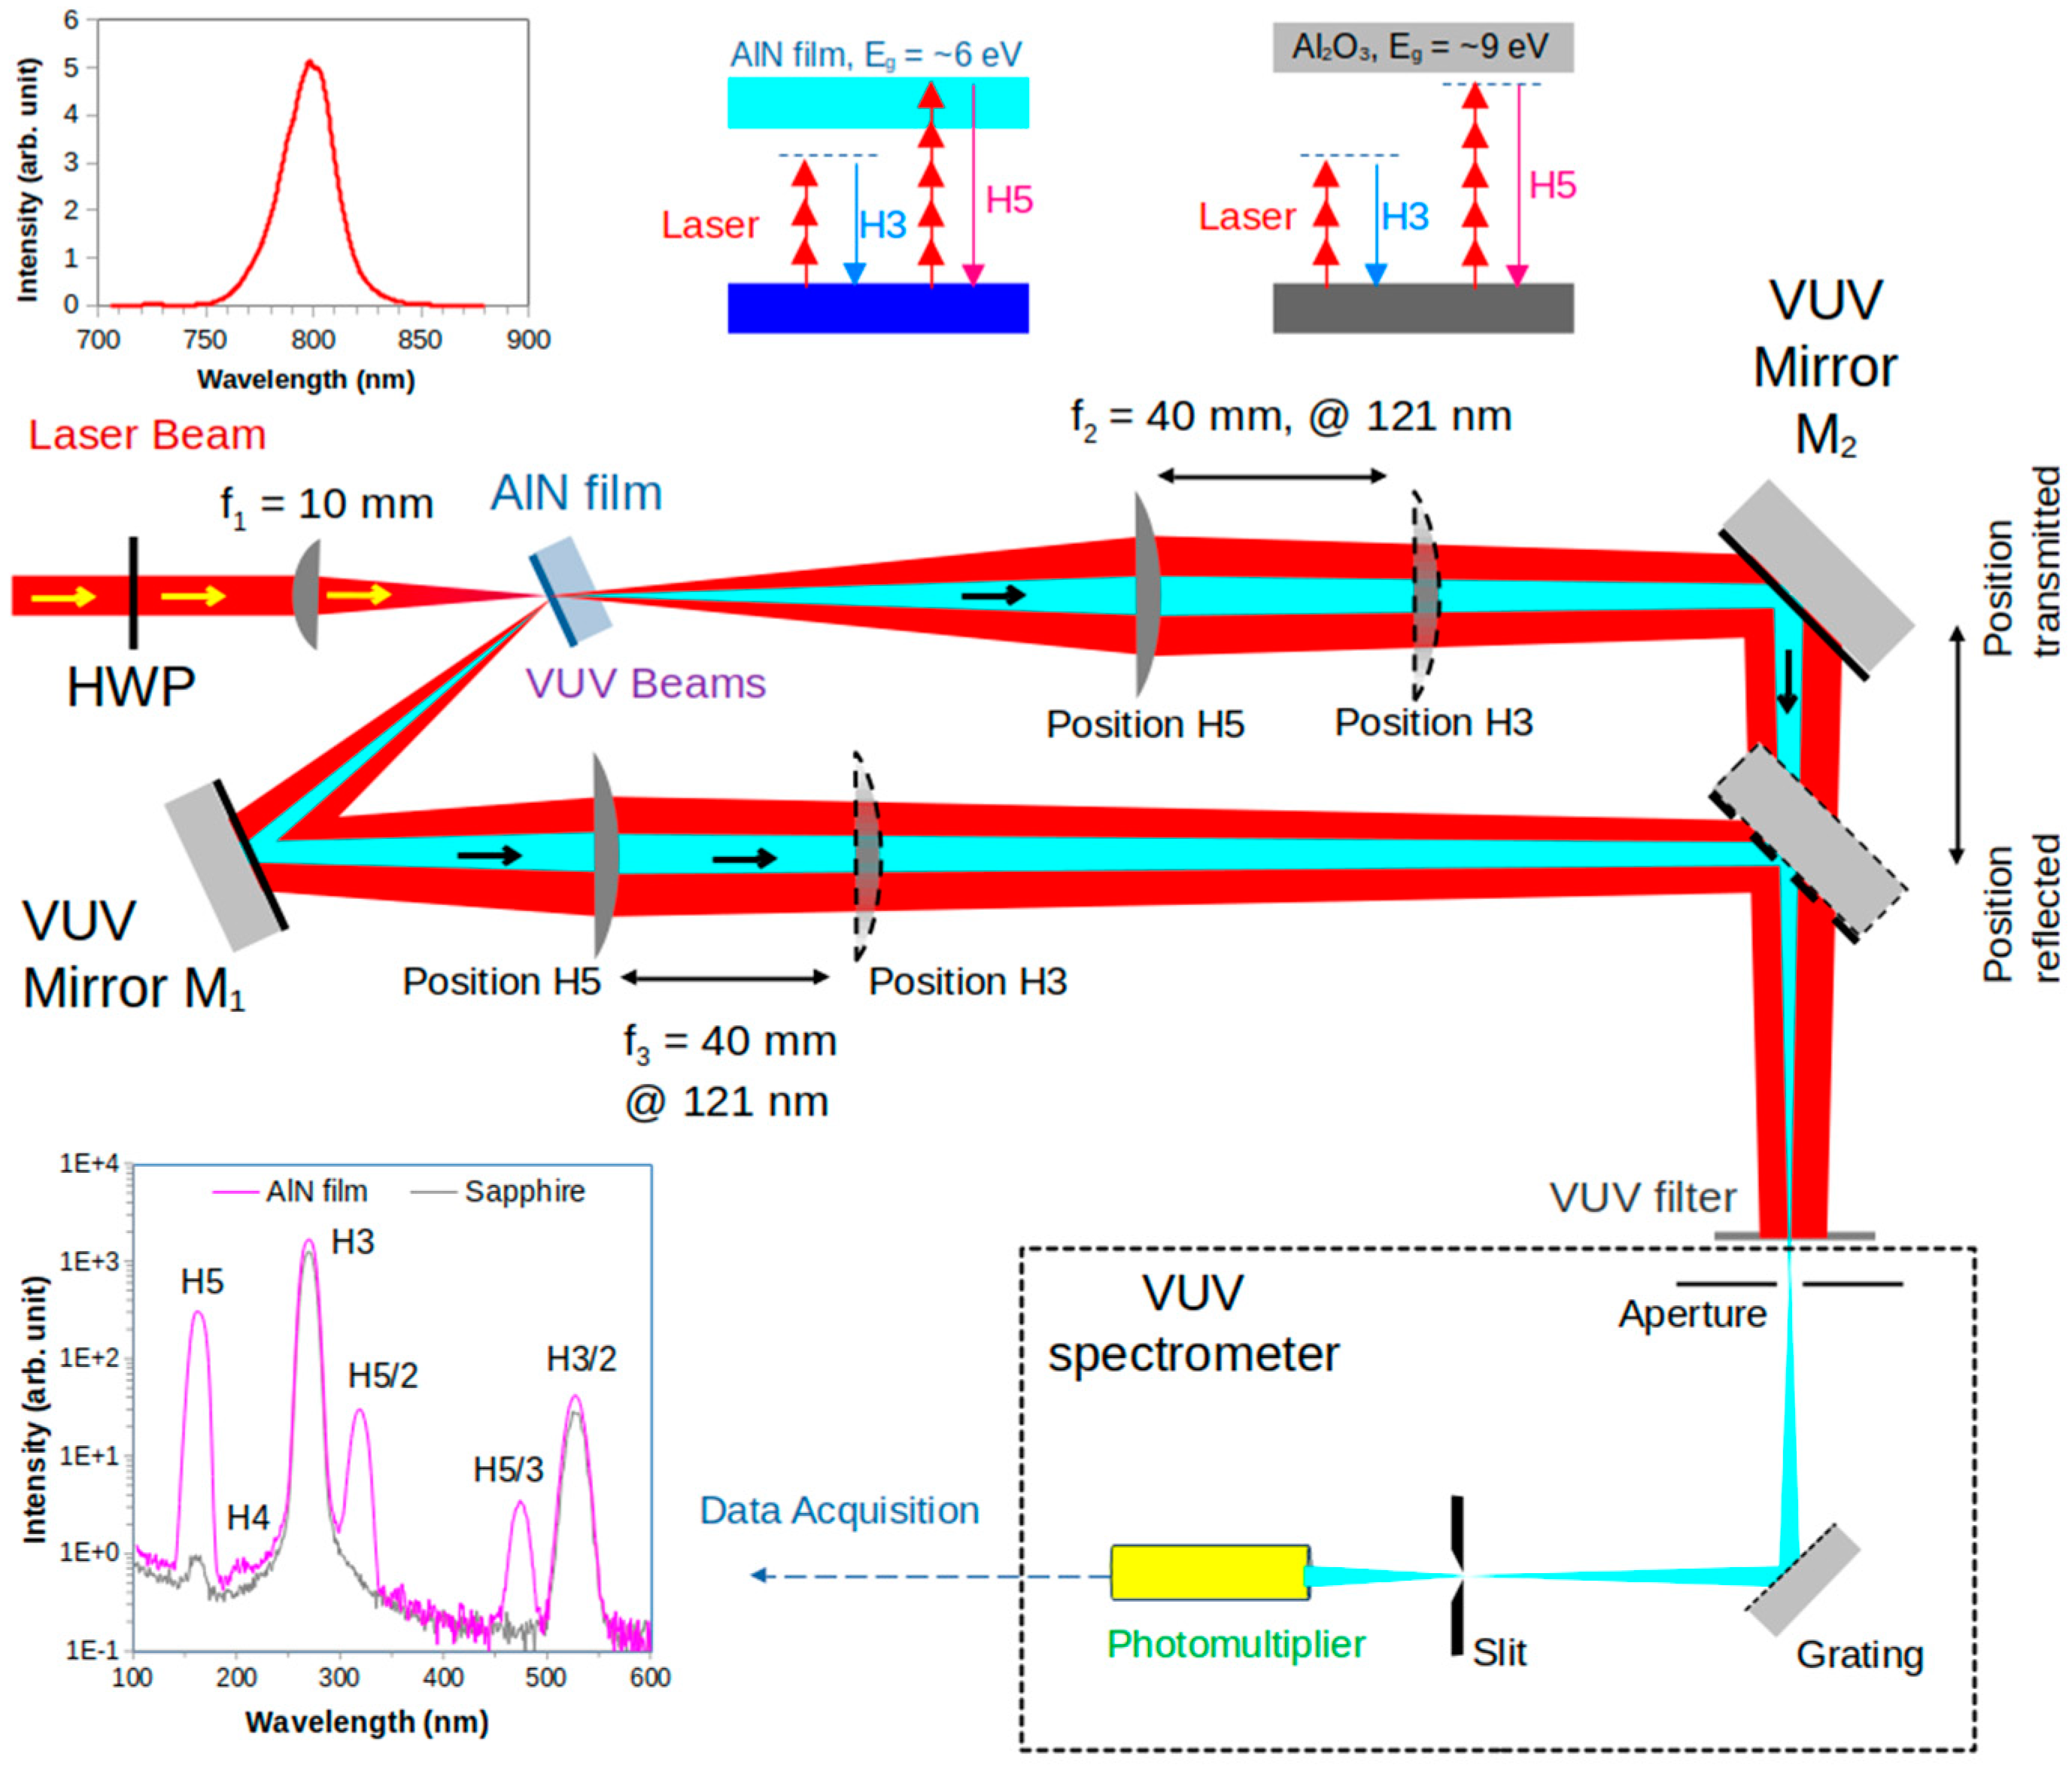
Figure 1. Experimental setup using transmission and reflection geometry for the measurements of the forward and backward 3rd and 5th harmonics generated on thin AlN films. The insets show the measured (left top) fundamental and (left bottom) harmonic spectra plotted (without the correction of the VUV filter spectral response) containing the H5 and the H3 lines and their higher diffraction orders for a 39 nm AlN film and another one for the sapphire substrate without film. (middle top) The band structures of the AlN film and the sapphire substrate with the harmonic generation processes. HWP: half-wave plate.
Photonics 11 01078 g001
Figure 2. XRD measurements of AlN films with different thicknesses on sapphire substrates: (a) as grown and (b) after rapid thermal annealing (RTA); (c) a zoom onto the AlN (002) peak and as-grown and RTA samples together with the same colors as in (a,b); (d) corresponding rocking curves.
Photonics 11 01078 g002
Figure 3. AFM images of (a) quartz substrate and AlN films of (b) 8 nm, (c) 17 nm and (d) 39 nm thickness onto quartz substrates.
Photonics 11 01078 g003
Figure 4. H3 and H5 signal dependence on the AlN film thickness. Both observation directions, namely forward (FW) and backward (BW), for harmonic signals are plotted. (a) The AlN film is on the front surface (FS) of the substrate. (b) The AlN film is on the back surface (BS) of the substrate. (c) The backward H5 signal is separately plotted for better visibility. In the insets, the corresponding definitions of the front and back surface arrangements are illustrated.
Photonics 11 01078 g004
Figure 5. Polarization dependence of H5 measured on the 39 nm thick AlN film. (a,b) The film is located at the front surface, together with the calculated one (detail in the text). The 6-fold symmetry of the w-AlN film is well resolved. For (b), the sample was rotated at 90° along the (001) direction (c-axes). The crystal structures with the highlighted hexagonal orientations are depicted under the corresponding panels. (c) Measured polarization dependence of H5 when the film was on the back surface of the sapphire substrate. The 4-fold symmetry is an effect of the birefringence of the substrate.
Photonics 11 01078 g005
Figure 6. Measured polarization dependence of the H5 signal for the different film thicknesses. The dashed black curves are fitted calculations. (a,b) measured in forward, (c) in backward direction.
Photonics 11 01078 g006
Figure 7. Bond orientations and notations for the calculations: (a) the laser beam illuminates the surface of the (001)-oriented w-AlN film containing a layered atomic structure; (b) one unit cell is highlighted with the bond notations; (c) definitions of the coordinate system and rotations.
Photonics 11 01078 g007
Figure 8. (a) The grains of the AlN film grow with the film thickness until the thickest film. (b) The contribution of the b0 bond to the H5 signal is in direct correlation with the grain growth in the film. For (a,b), the values are given in Table 1.
Photonics 11 01078 g008
Figure 9. Harmonic generation schemes when thinner and thicker AlN films are on the front or back surface.
Photonics 11 01078 g009
Table 1. Parameters used in Equation (1) to obtain the fitted polarization curves in Figure 5 and Figure 6 and the measured grain sizes.
α1 = … = α6 = 1Forward H5Backward H5Grain Size (nm)
d (nm)α0r0rn rnAs GrownRTA
83.0564.22.04.22.0910
173.2664.22.04.22.11616
393.3664.42.14.42.14138
1003.0244.42.14.22.06161
Disclaimer/Publisher’s Note: The statements, opinions and data contained in all publications are solely those of the individual author(s) and contributor(s) and not of MDPI and/or the editor(s). MDPI and/or the editor(s) disclaim responsibility for any injury to people or property resulting from any ideas, methods, instructions or products referred to in the content.