Article

Crosstalk-Free Multiplane Full-Color Holography Based on the Space Division Method

1
Institute of Optics and Electronics, Chinese Academy of Sciences, Chengdu 610209, China
2
School of Instrument Science and Opto-Electronic Engineering, Beihang University, Beijing 100191, China
*
Author to whom correspondence should be addressed.
Photonics 2024, 11(3), 230; https://doi.org/10.3390/photonics11030230
Submission received: 13 February 2024 / Revised: 26 February 2024 / Accepted: 28 February 2024 / Published: 2 March 2024

Abstract

:
This paper has proposed a full-color holography based on the space division method to provide a new solution for three-dimensional color holographic display. The hologram is divided into three different regions for the R, G, and B trichromatic hologram components, which will be designed separately at the corresponding positions. The projection images at different projection depths are preprocessed to meet dimension matching and position matching conditions. Different color images are reconstructed on a single plane and 19 planes in simulations and experiments, respectively, which verify the feasibility of the method. The designed phase-only holograms were fabricated on the silica substrate to obtain the diffraction optical element (DOE). Expect for one DOE, three lasers, and one CCD, no additional optical components are required to prompt a compact and simple experimental setup, which is expected to be used to realize full-color display.

1. Introduction

Holographic technology is used to record the amplitude and phase information of the object light wave based on the interference principle [1,2]. The brightness and shape distribution of the object surface can be restored by irradiating the hologram with the recorded reference light. The computer-generated hologram (CGH) technology that follows can solve the problems of precise interference optical path requests, high requirements for the stability of the system, and easy introduction of environmental noise by fully utilizing the computer analog recording process of holograms [3,4,5]. Therefore, CGH technology has become a research hotspot. The research on CGH displays mainly focuses on fast calculation [6,7], expanding size and viewing angle [8,9], improving imaging quality (noise elimination and true color) [10,11,12], etc. Compared with monochrome holograms, color holograms provide more vividly original information about the object and have become an important development direction for CGH display.
Color holography can be reconstructed by overlapping three trichromatic holographic images, which are generated by illuminating the hologram with R, G, and B trichromatic laser beams. Generally, the color holographic display is realized by loading different holograms on multiple spatial light modulators (SLMs) and synthesizing multiple reconstruction images. However, the use of multiple SLMs complicates the optical system [13]. Shimobaba T et al. [14] and Zhang Z et al. [15] proposed a method of realizing color holographic display by time division multiplexing. However, this method needs to accurately control the synchronization between the working time of the trichromatic light sources and the loading of the corresponding trichromatic hologram components. Specifically, when implementing multi-plane full-color holography, a higher requirement has been put forward for the response speed of the hardware.
In order to simplify the color holographic display system, Makowski M et al. proposed a method of depth multiplexing to realize the color holographic display [16]. The reconstructed image appears at different positions on the same axis, and the composite image of the trichromatic components will be obtained at the set reference position. In 2020, Deng Z et al. realized full-color complex-amplify vectorial holograms based on multi-freedom metasurfaces using the depth multiplexing method [17]. In 2021, our research team also conducted research on color holography and realized low-crosstalk full-color multi-plane holographic projection based on the depth multiplexing method [18]. The depth multiplexing method reduces the complexity and cost of the system, and the color image can be reconstructed with only one hologram. However, the crosstalk caused by different projection depths will blur the desired image, resulting in a deterioration of image quality. In addition, two unwanted images at different projection depths for each desired image will generate inevitably, resulting in depth waste and limiting the number of projection planes.
In order to avoid axial crosstalk to improve image quality, the space-division method divides the hologram or the projection area into three parts and generates three monochromatic light fields. A full-color hologram can be designed by pre-processing the images and placing the three monochromatic component images at different positions in the projection area. Then, the reconstructed light fields of the hologram can be perfectly overlapped by illuminating the hologram with different wavelengths and different angles [19]. In order to make the system compact, Tomoyoshi et al. proposed color electroholography based on the space-division method [20]. However, the off-axis illumination of this method makes it impossible to apply to multi-plane full-color holography. The method of overlapping trichromatic components by superimposing grating phases on the hologram has been proposed [21,22,23]. However, this method generates many invalid diffraction orders, resulting in obvious optical power loss and reduced diffraction efficiency.
Recently, meta-surface holography [24,25] has become a powerful technique to modulate the complex amplitude of light fields due to its merits of subwavelength pixel pitch, ultra-thinness, and multiplexing capabilities. Metasurface technology endows full-color holographic displays [26,27,28] with the ability to have a large field of view, high image quality, high integration, and large modulation capacity, which prompts the full-color 3D holographic display. However, the difficulty of design and fabrication remains a significant challenge for meta-surface applications.
In this paper, a crosstalk-free multiplane full-color holograph has been achieved based on the space-division method, attributed to the merits of coaxial illumination and off-axis reconstruction. The desired images at different projection depths are preprocessed to meet the requirements of dimension matching and position matching. According to the designed spatial relationship, the hologram is divided into three different regions, and the holograms with trichromatic components are designed separately at the corresponding positions. In the process of color image reconstruction, the parallel trichromatic laser beams are used to illuminate the corresponding regions of the hologram, and the overlapping regions in the projection plane are used to reconstruct the color image of the object. Different color images are reconstructed in a single plane and 19 planes by simulations and experiments, respectively, which verify the feasibility of the method. The main arrangement of the article is as follows: the second part is the principle of color image reproduction; the third part is the design method; the fourth part gives the simulation and experimental verification; and the last part is the summary of the full paper.

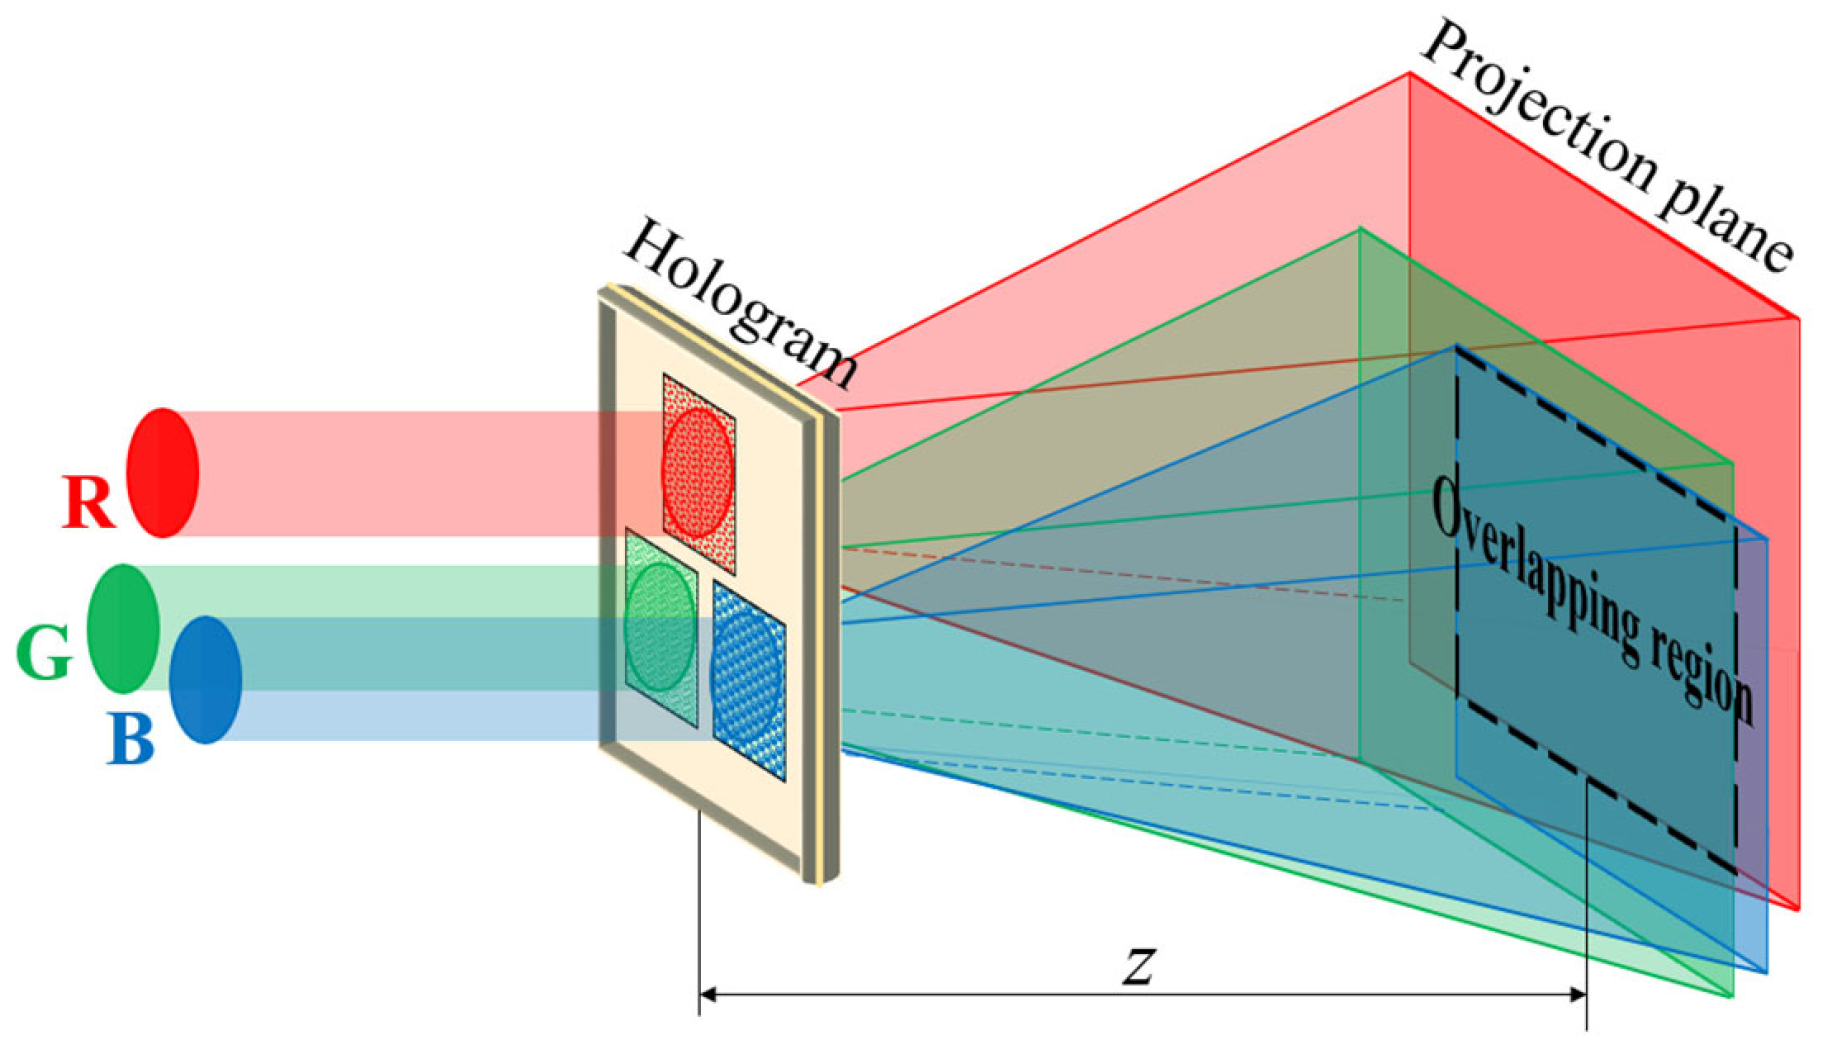
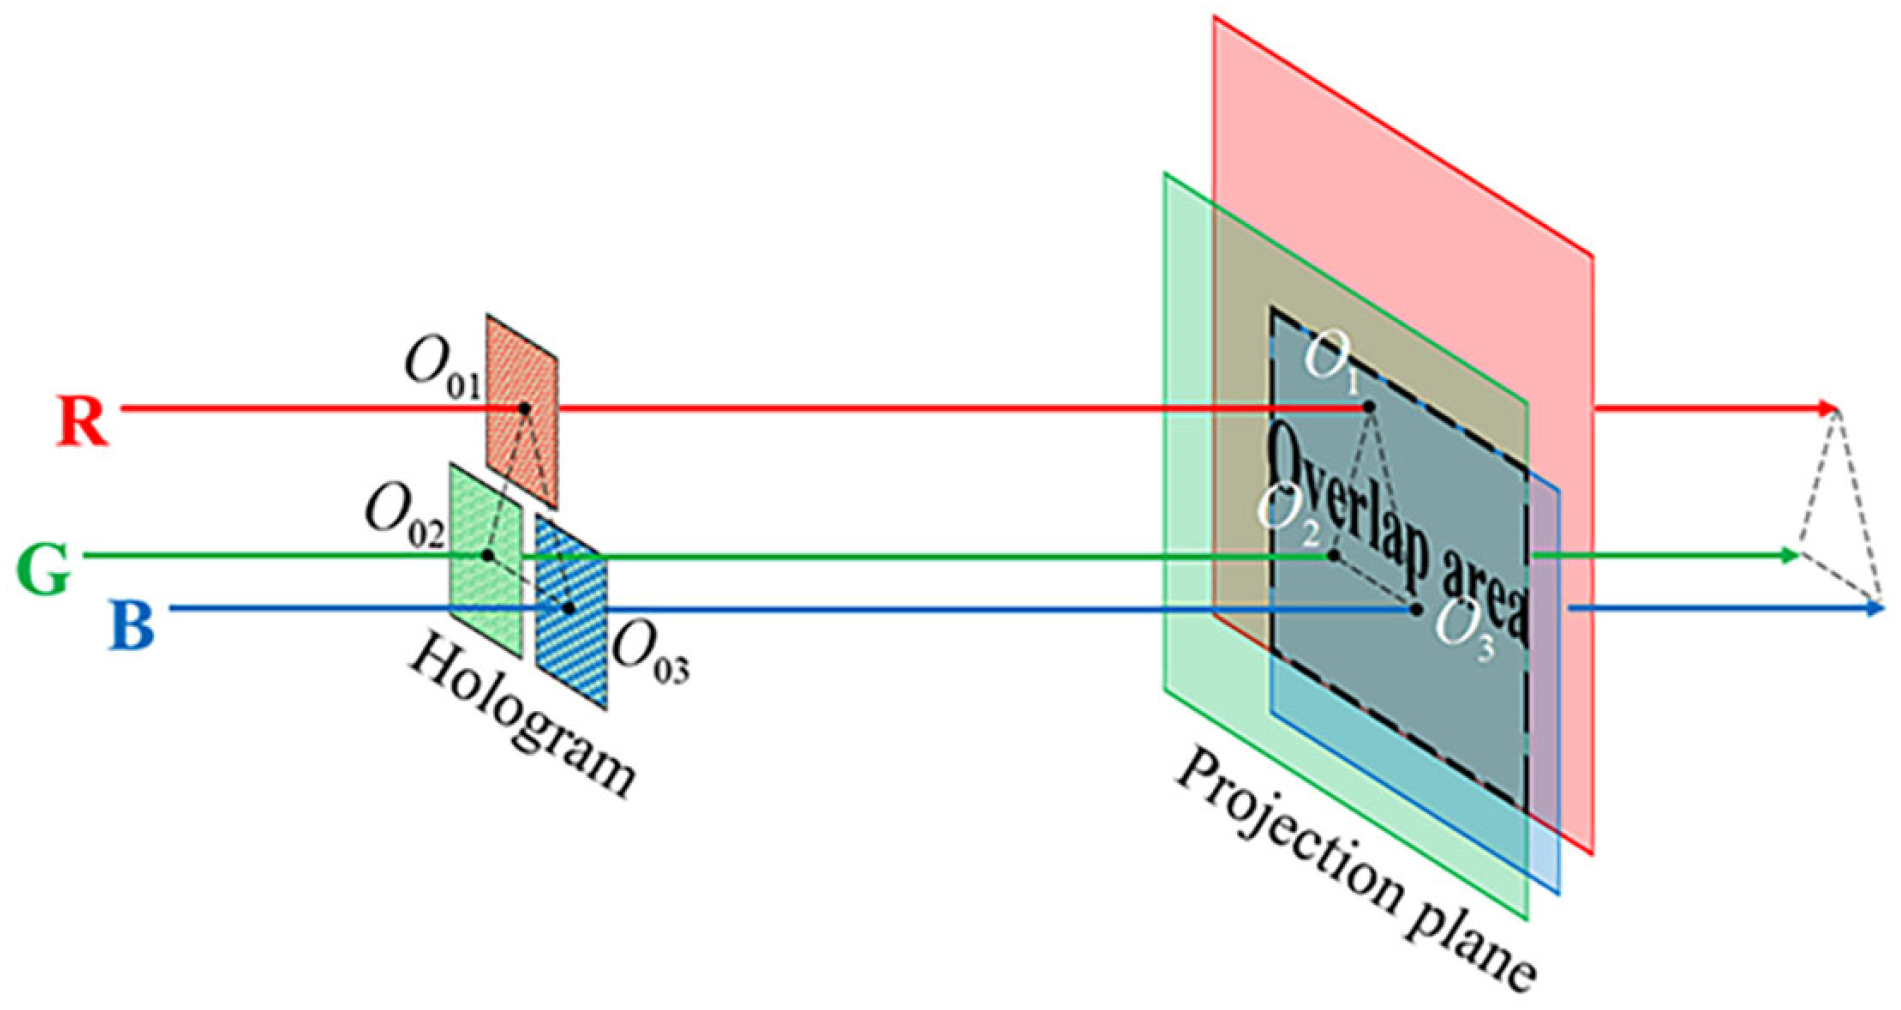
2. Principle of Color Image Reproduction
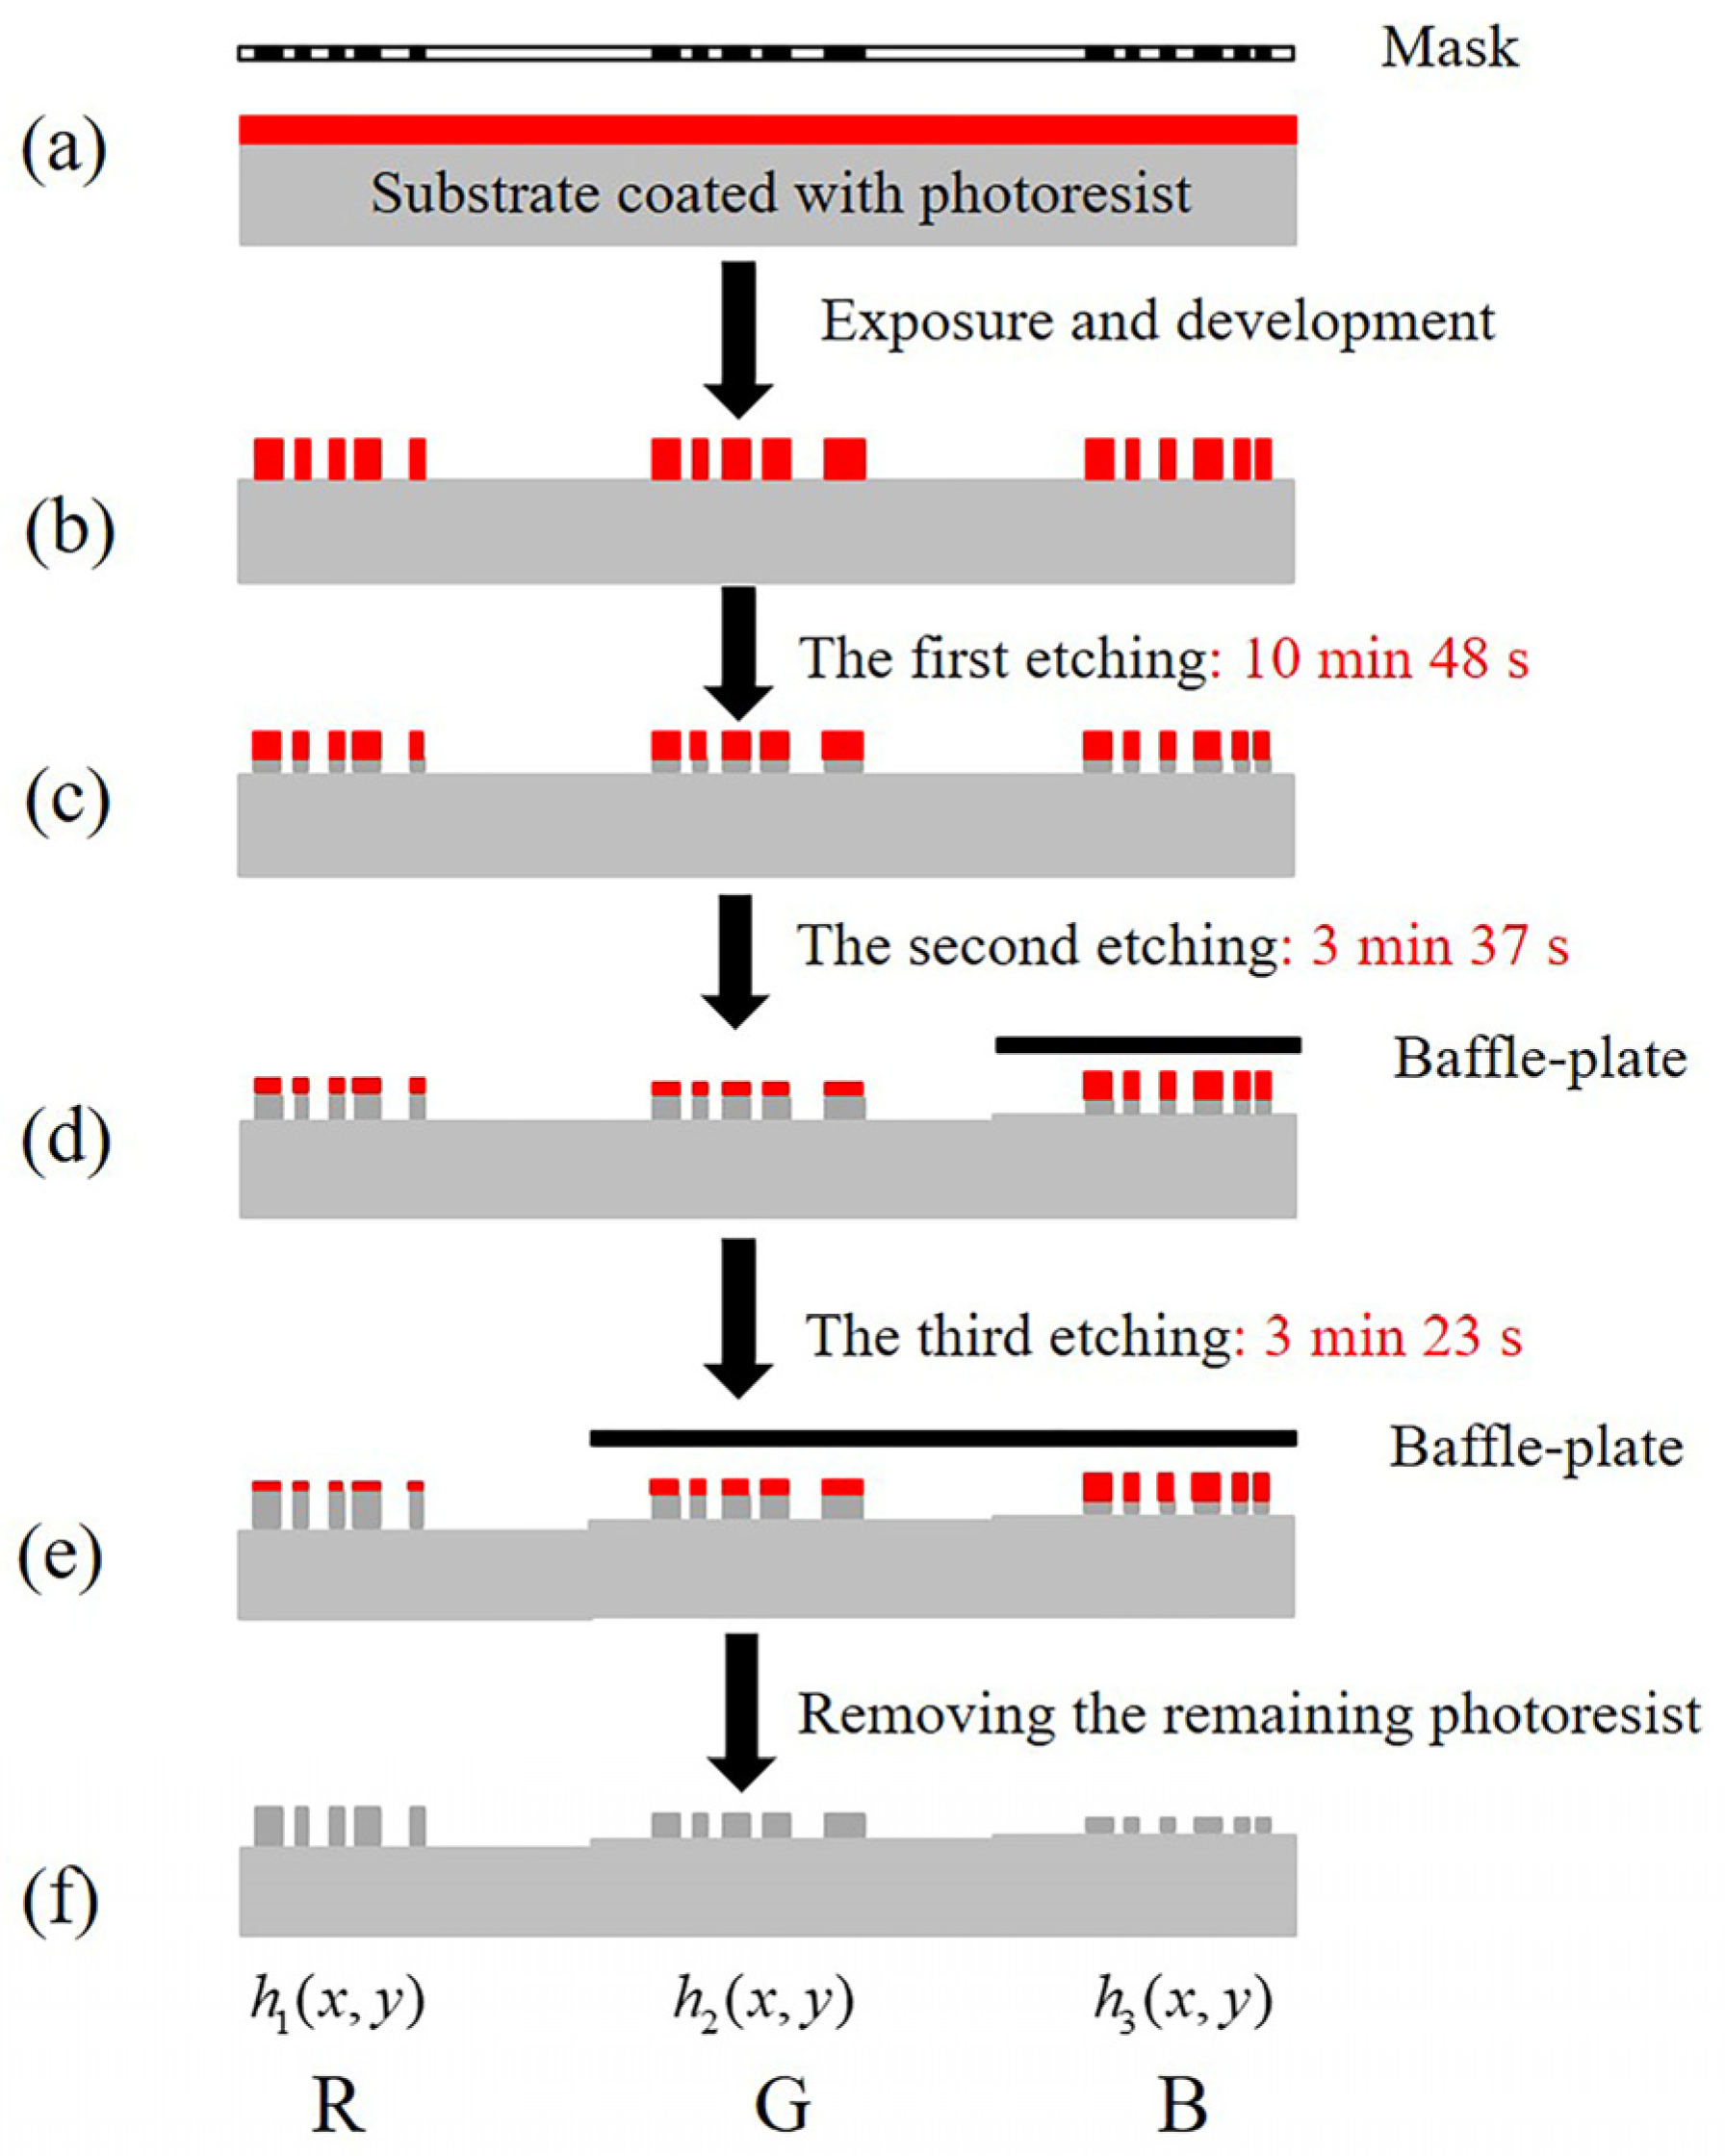
Because color objects can be regarded as images composed of trichromatic components, the phase recovery algorithm is used to recover the phase of monochromatic images to reconstruct the color objects. In this article, the hologram is divided into three different regions according to the designed spatial relationship, and the trichromatic hologram components are arranged separately at the corresponding positions. When the parallel trichromatic light beams irradiate the corresponding regions of the hologram, the diffracted light field changes with the propagation distance, and the overlapping area changes constantly. At the set distance z , the diffraction patterns of the trichromatic components will perfectly coincide in the overlapping region to realize the reproduction of the color object image, as shown in Figure 1.

3. Design Method

As is known, when the beam propagates through the hologram, the center of the projection plane is the same as the center of the hologram along the propagation direction. Therefore, according to this principle, the coordinate relationship between the hologram plane and the projection plane can be established. Assume that the centers of the R, G, and B hologram components are O 01 , O 02 and O 03 , respectively, and the centers of the corresponding projection planes along the propagation direction are marked as O 1 , O 2 and O 3 , as shown in Figure 2. As is known to all, the positional relationship between the centers of the trichromatic components remains unchanged from the hologram plane to the projection plane. When three parallel light beams irradiate the hologram in three different areas, the centers of the reconstruction images of the trichromatic components will be separated from each other, so the perfect overlapping of the trichromatic components cannot be realized. Therefore, it is necessary to preprocess the trichromatic components of the original color object.
In the projection plane (Figure 3), the image to be reconstructed is divided into signal and background domains. Assuming that the pixel numbers of the trichromatic hologram components are M × N , then in the projection plane, the pixel numbers of the reconstructed images in the trichromatic projection areas are also M × N . The trichromatic components of the original color image to be reconstructed are designed in the signal domains, and the background domains are set as black areas without brightness. The centers O 1 , O 2 and O 3 are the geometric centers of the projected areas. The interval coefficients K 1 , K 2 , K 3 , K 4 are designed as the number of pixels between the centers of O 01 , O 02 and O 03 . Due to the relative positions of the centers of O 1 , O 2 and O 3 are still consistent with the centers of O 01 , O 02 and O 03 of the trichromatic hologram components, the separation distances between O 1 , O 2 and O 3 are equal to the separation distances between O 01 , O 02 and O 03 . Therefore, the separation distances between O 1 and O 2 are K 1 × d , ( K 1 M ) in the y direction and K 3 × d , ( K 3 M ) in the x direction, where d represents the pixel size of the hologram. The separation distances between O 1 and O 3 are K 2 × d , ( K 2 M ) in the y direction and K 4 × d , ( K 4 M ) in the x direction.
The pixel number in the red component signal domain is P 1 × Q 1 , ( P 1 < M , Q 1 < M ) , and its center is marked as O 1 . The pixel number in the green component signal domain is P 2 × Q 2 , ( P 2 < M , Q 2 < M ) , and its center is marked as O 2 . The pixel number in the blue component signal domain is P 3 × Q 3 , ( P 3 < M , Q 3 < M ) , and its center is marked as O 3 . The centers of the signal domains will be designed to deviate from the geometric centers of the projected areas. The offset pixel numbers where O i deviates from O i can be represented by t i and r i , respectively, where i = 1 , 2 , 3 . It is worth noting that the center O 3 is taken as the origin, so the t i and r i can be positive or negative in the coordinate system. When t i is positive, it means O i is on the right side of O i in the x direction. When t i is negative, it means O i is on the left side of O i in the x direction. When r i is positive, it means that O i is above the O i in the y direction. When r i is negative, it means that O i is below the O i in the y direction.
In order to obtain the reconstruction of the color image at the distance z, it is necessary to ensure that the projection dimensions of the signal domains for different color components are the same at the projection distance z, and that the coordinate positions of the centers of the trichromatic signal domains coincide at the distance z. Therefore, the trichromatic components of the original color image need to be preprocessed, aiming at the target that the trichromatic components overlap perfectly at the distance z. The detailed methods are described in Section 3.1 and Section 3.2.

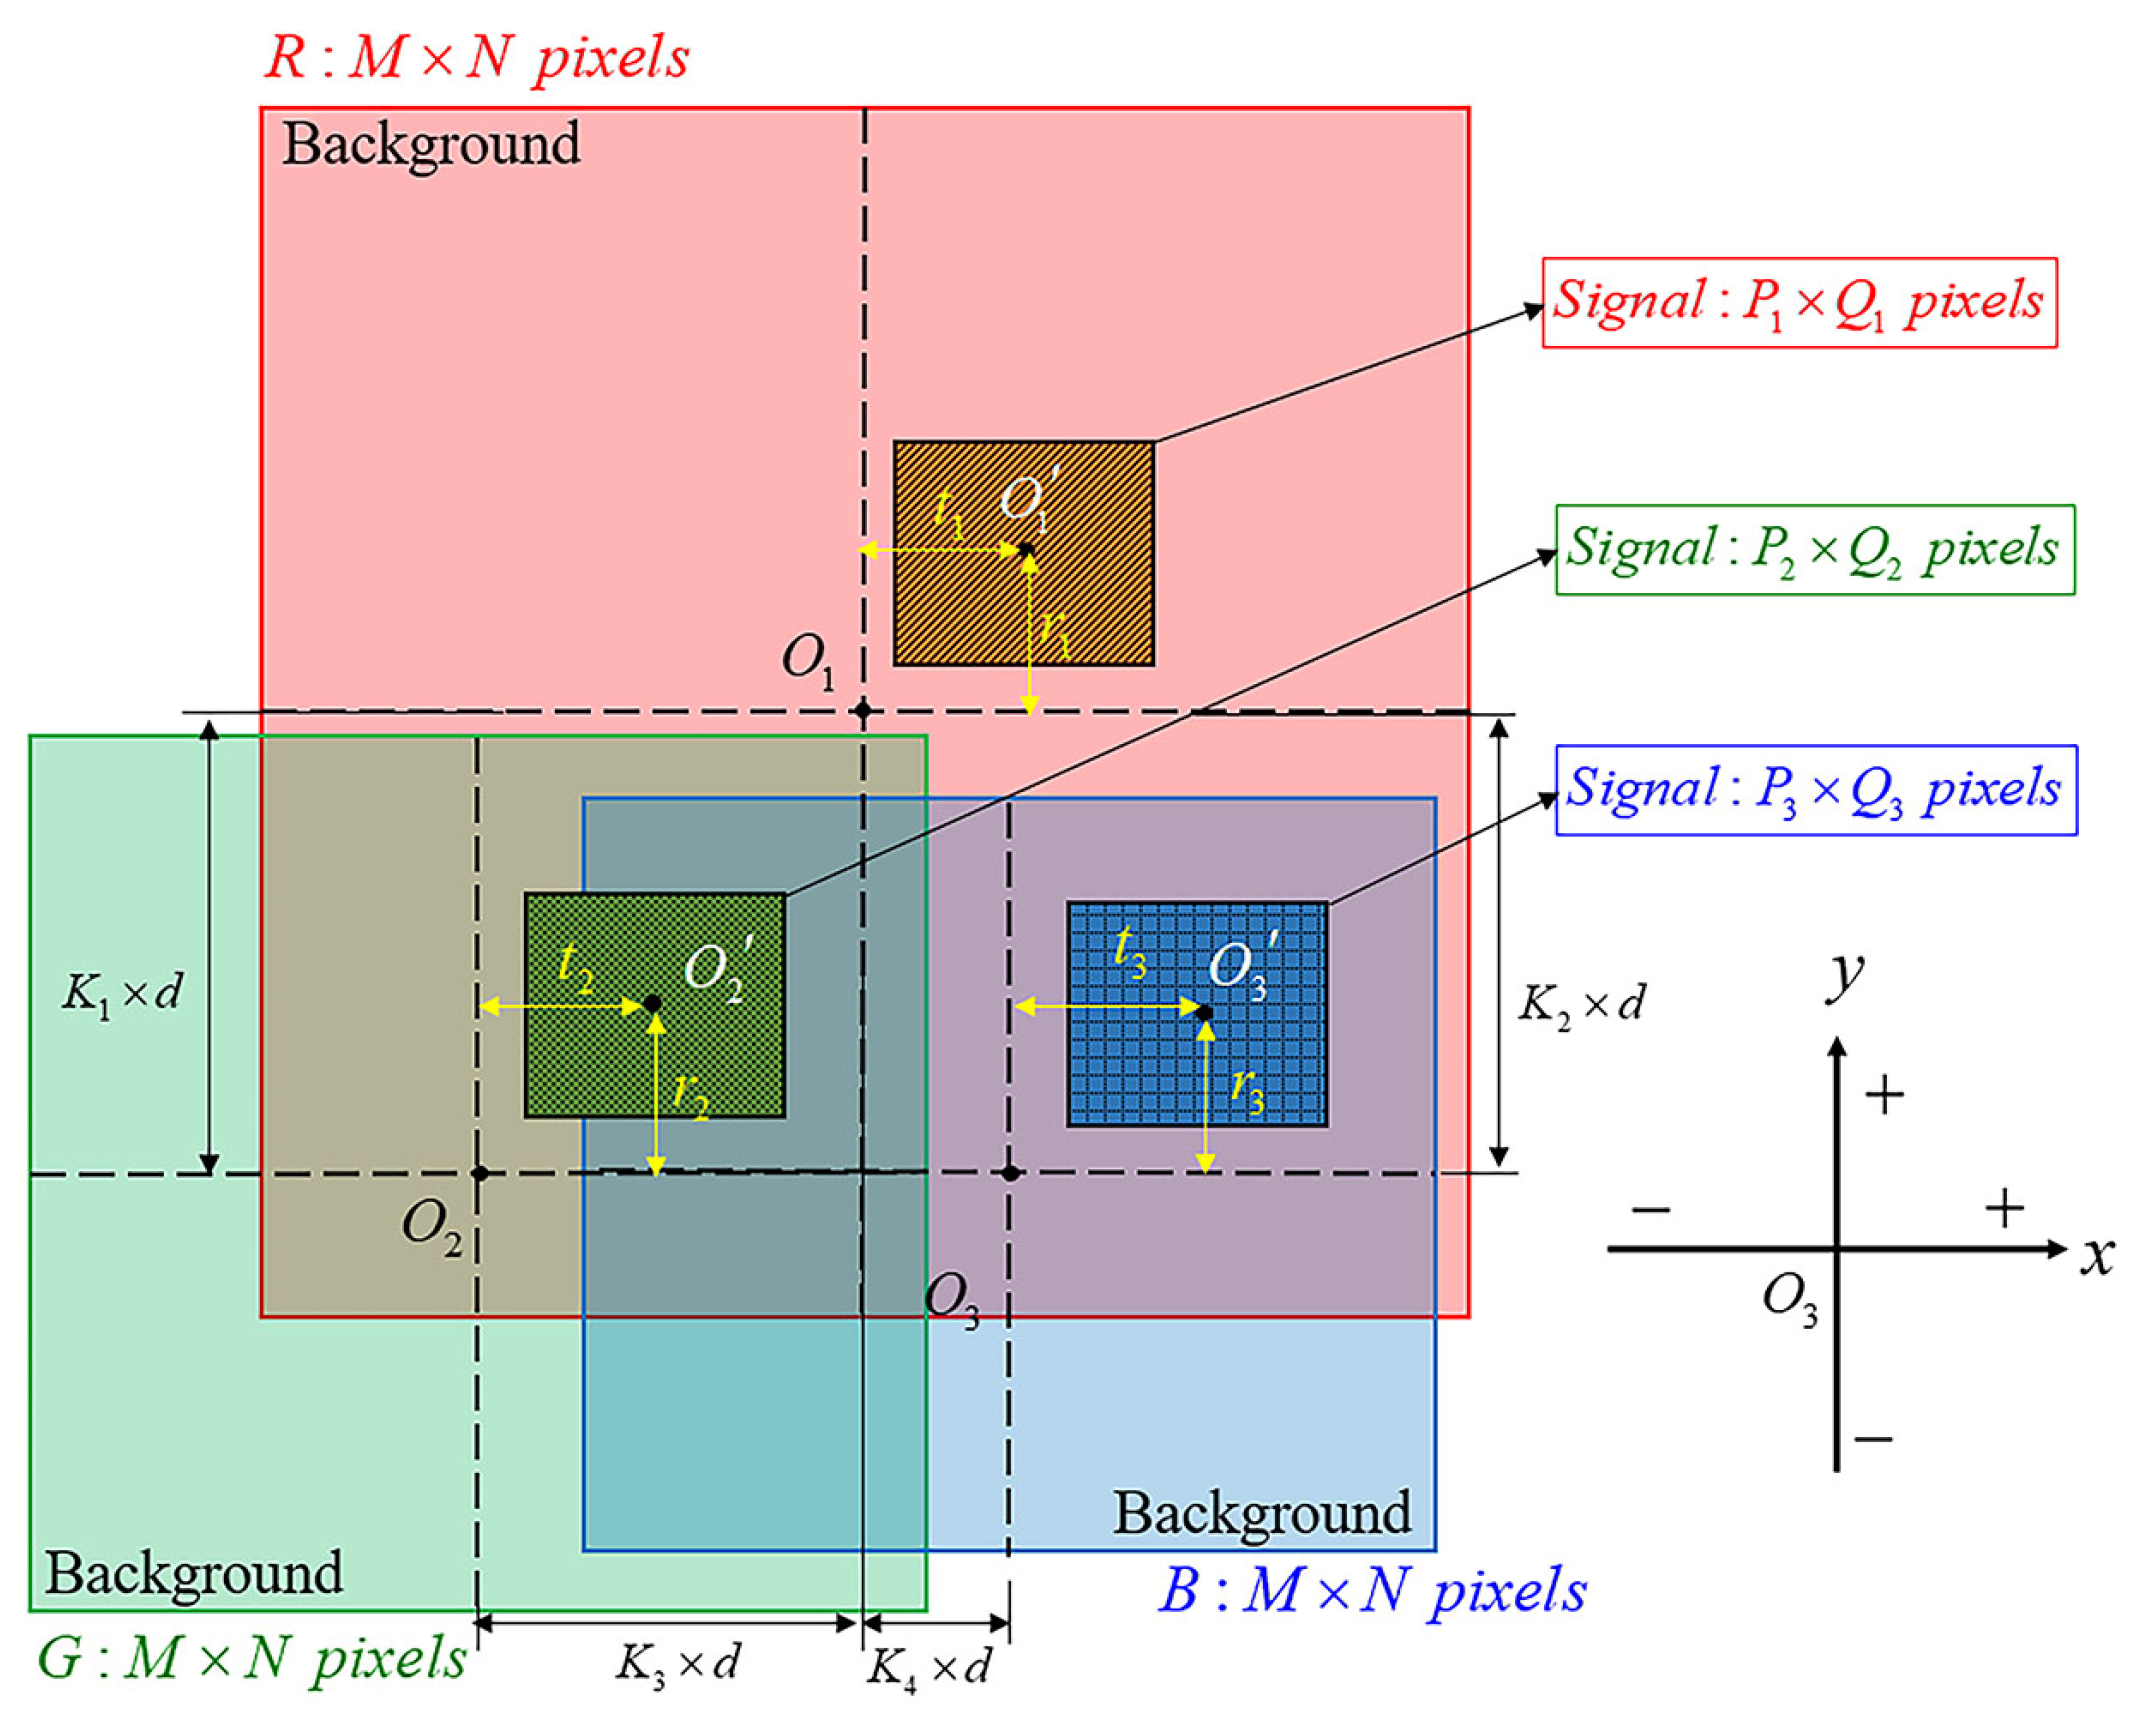
3.1. Image Dimension Matching

In order to ensure that the projection dimensions of the signal domains of trichromatic components are the same at the projection distance z, the signal domains need to meet the rule of Equation (1).
P 1 δ 1 y = P 2 δ 2 y = P 3 δ 3 y , Q 1 δ 1 x = Q 2 δ 2 x = Q 3 δ 3 x .
where δ i x   and   δ i y ( i = 1 , 2   and   3 ) are the sampling intervals of R, G, and B color components along the x-axis and y-axis in the projection plane, respectively. The sampling intervals satisfy Equation (2).
M δ i y = λ i z d i y , N δ i x = λ i z d i x .
where λ i   ( i = 1 , 2 , 3 ) are the wavelengths, corresponding to the R, G, and B components, respectively, and d i x   and   d i y ( i = 1 , 2   and   3 ) are the sampling intervals of the hologram along the x-axis and y-axis. Here, the sampling intervals of the R, G, and B components in the hologram plane are designed to be the same value of d. It means that d i x = d i y = d . When the pixel numbers of the holograms ( M × N ), pixel size (d), designed wavelength ( λ i ), and projection distance (z) are determined, the sampling intervals δ i x   and   δ i y can be confirmed by Equation (2). When M = N , δ i x = δ i y , which is marked as δ i for different components. It can be seen that Equation (2) is an important mathematical relationship between the hologram plane and the projection plane. Due to the different wavelengths λ i of the trichromatic components, the sampling intervals δ i in the projection plane are different. According to Equation (1), the pixel numbers in the signal domains of trichromatic components need to be scaled to meet the same projection dimensions at the projection distance z.

3.2. Image Position Matching

When the dimensions of the trichromatic components in signal domains are the same, it is also necessary to ensure that the coordinate positions of the centers O 1 , O 2 and O 3 of the signal domains coincide at the distance z, so as to realize the reconstruction of the color image (Figure 3). Therefore, the mathematical relationship between different color components has been established.
In the coordinate system (Figure 3), the coordinate of O 3 is ( t 3 δ 3 , r 3 δ 3 ) , the coordinate of O 2 is ( K 4 d K 3 d + t 2 δ 2 ,   K 2 d K 1 d + r 2 δ 2 ) and the coordinate of O 1 is ( K 4 d + t 1 δ ,   K 2 d + r 1 δ 1 ) . In order to make the three coordinates coincide, Equation (3) needs to be satisfied.
t 3 δ 3 = K 4 d K 3 d + t 2 δ 2 = K 4 d + t 1 δ 1 , r 3 δ 3 = K 2 d K 1 d + r 2 δ 2 = K 2 d + r 1 δ 1 .
Then, Equations (4) and (5) can be obtained by modifying Equation (3).
[ 0 0 1 δ 1 δ 2 0 δ 1 0 δ 3 ] [ t 1 t 2 t 3 ] = [ t 0 K 3 d K 4 d ] , { | t 1 | N Q 1 2 | t 2 | N Q 2 2 | t 3 | N Q 3 2 .
[ 0 0 1 δ 1 δ 2 0 δ 1 0 δ 3 ] [ r 1 r 2 r 3 ] = [ r 0 K 1 d K 2 d ] , { | r 1 | M P 1 2 | r 2 | M P 2 2 | r 3 | M P 3 2 .
where t 0 is the pixel number that O 3 deviates from O 3 initially in the x direction, i.e., t 3 = t 0 . The r 0 is the pixel number that O 3 deviates from O 3 initially in the y direction, i.e., r 3 = r 0 . According to the above rules, the pixel coordinate relationships between different color components can be calculated. So, the rules of the preprocessing of the trichromatic components can be formed according to the pixel coordinate relationship in the projection plane. When the pixel number in the signal domain of a certain color component (such as blue), the interval coefficients K 1 , K 2 , K 3   and   K 4 between the centers of the trichromatic hologram components, and the offsets t 0 and r 0 of a certain color component signal domain (such as blue) are determined, the preprocessing of the trichromatic components of the original color image can be completed.
The above analysis is about the reconstruction of a single-plane color image, and this method is also applicable to the reconstruction of a multiplane color image. Then, Equation (2) will be transformed into Equation (6) for multiplane projection. At this time, the sampling intervals δ i ( z j ) in different projection planes vary with different distances z j , ( j = 1 , 2 , , n ) , where n is an integer, whose physical meaning is the maximum number of projection planes.
M δ i ( z j ) = λ i z j d , N δ i ( z j ) = λ i z j d .
By substituting Equation (6) into Equations (4) and (5), the coefficients t i and r i related to the diffraction distance can be calculated, and then the position relationship for images projected at different distances z i can be obtained.

4. Simulation and Experimental Verification

According to the design principle of the third section, single-plane and multiplane color object reconstruction were realized, respectively. The R, G, and B wavelengths were set as 650 nm, 532 nm, and 405 nm, respectively.

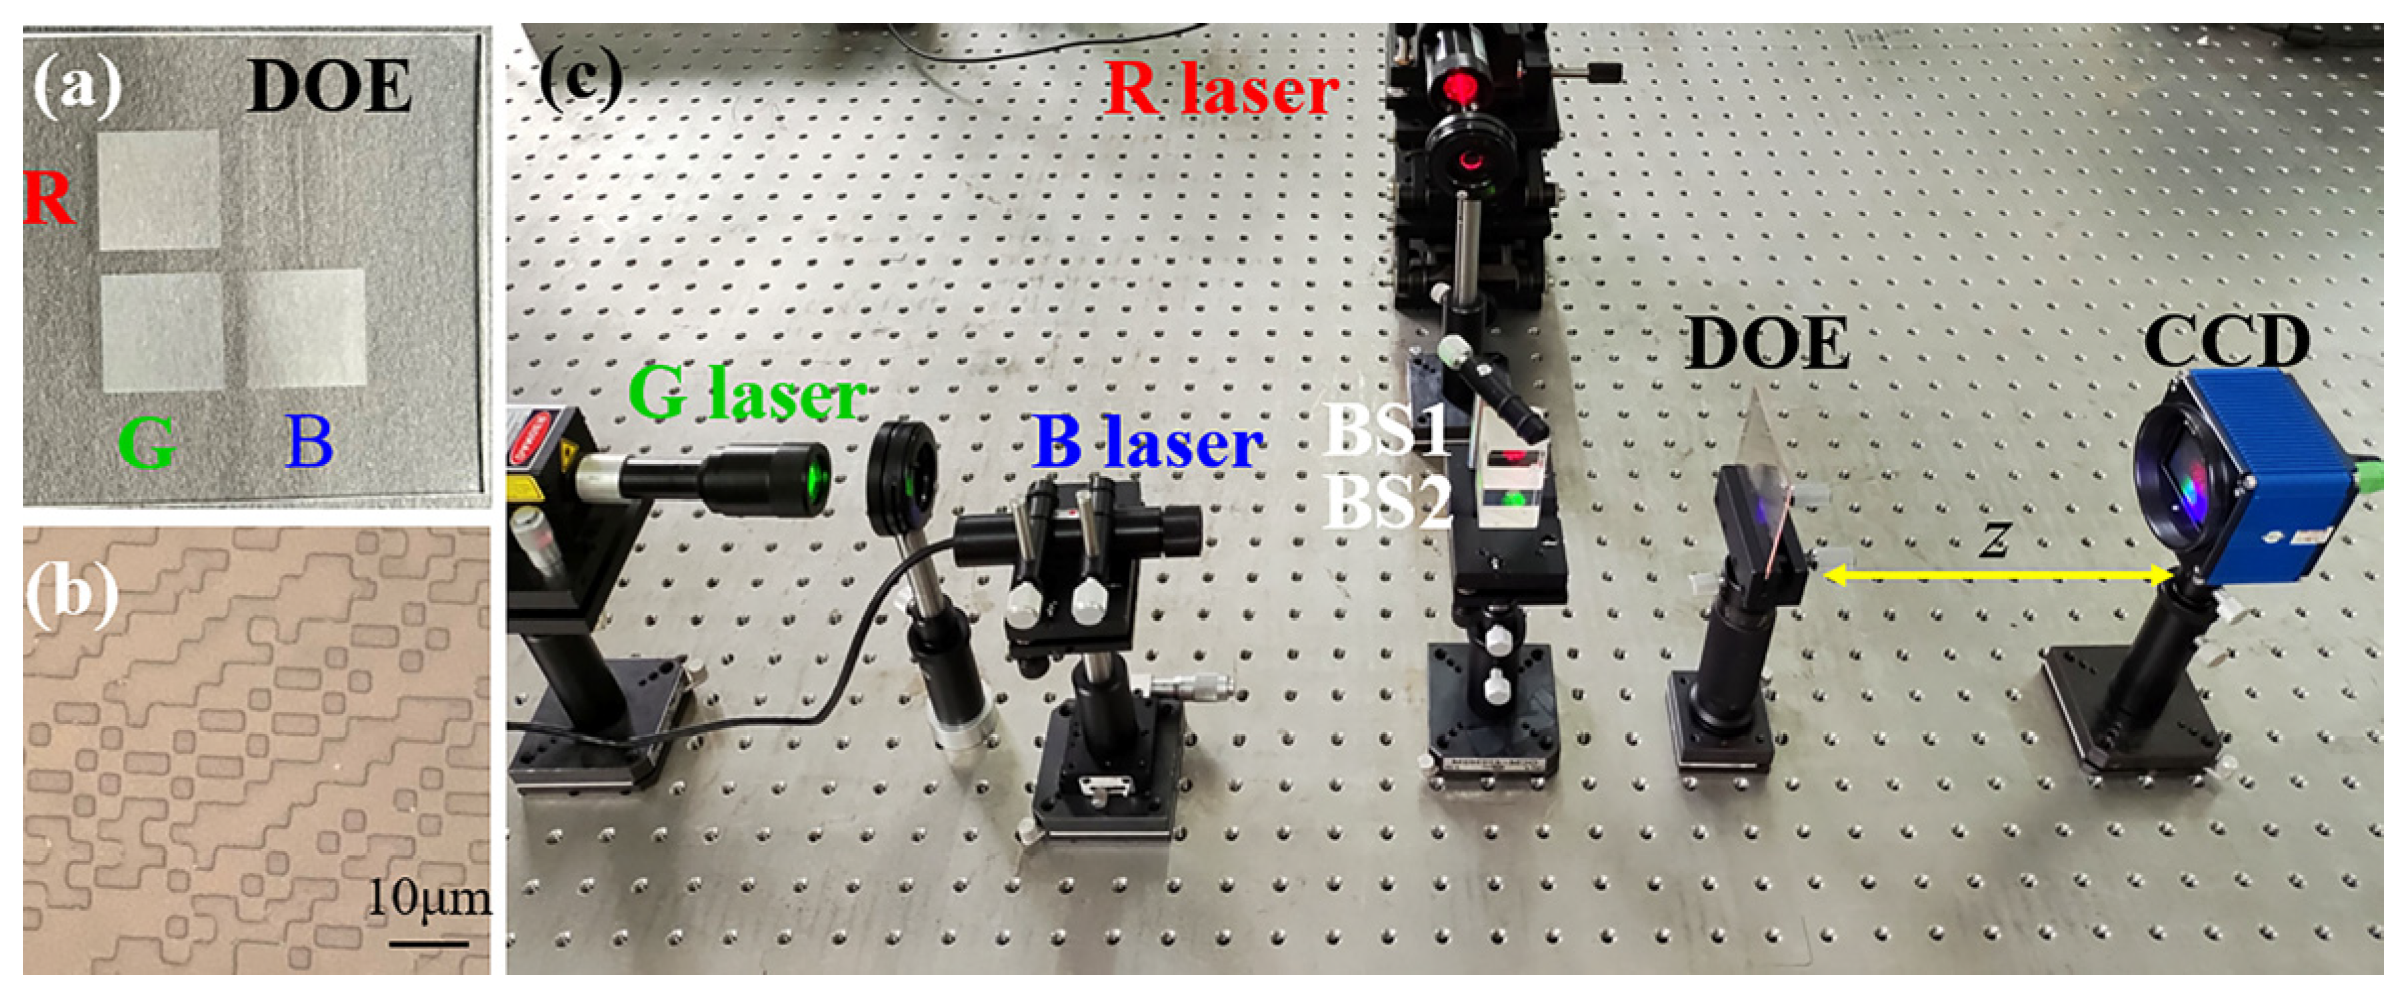
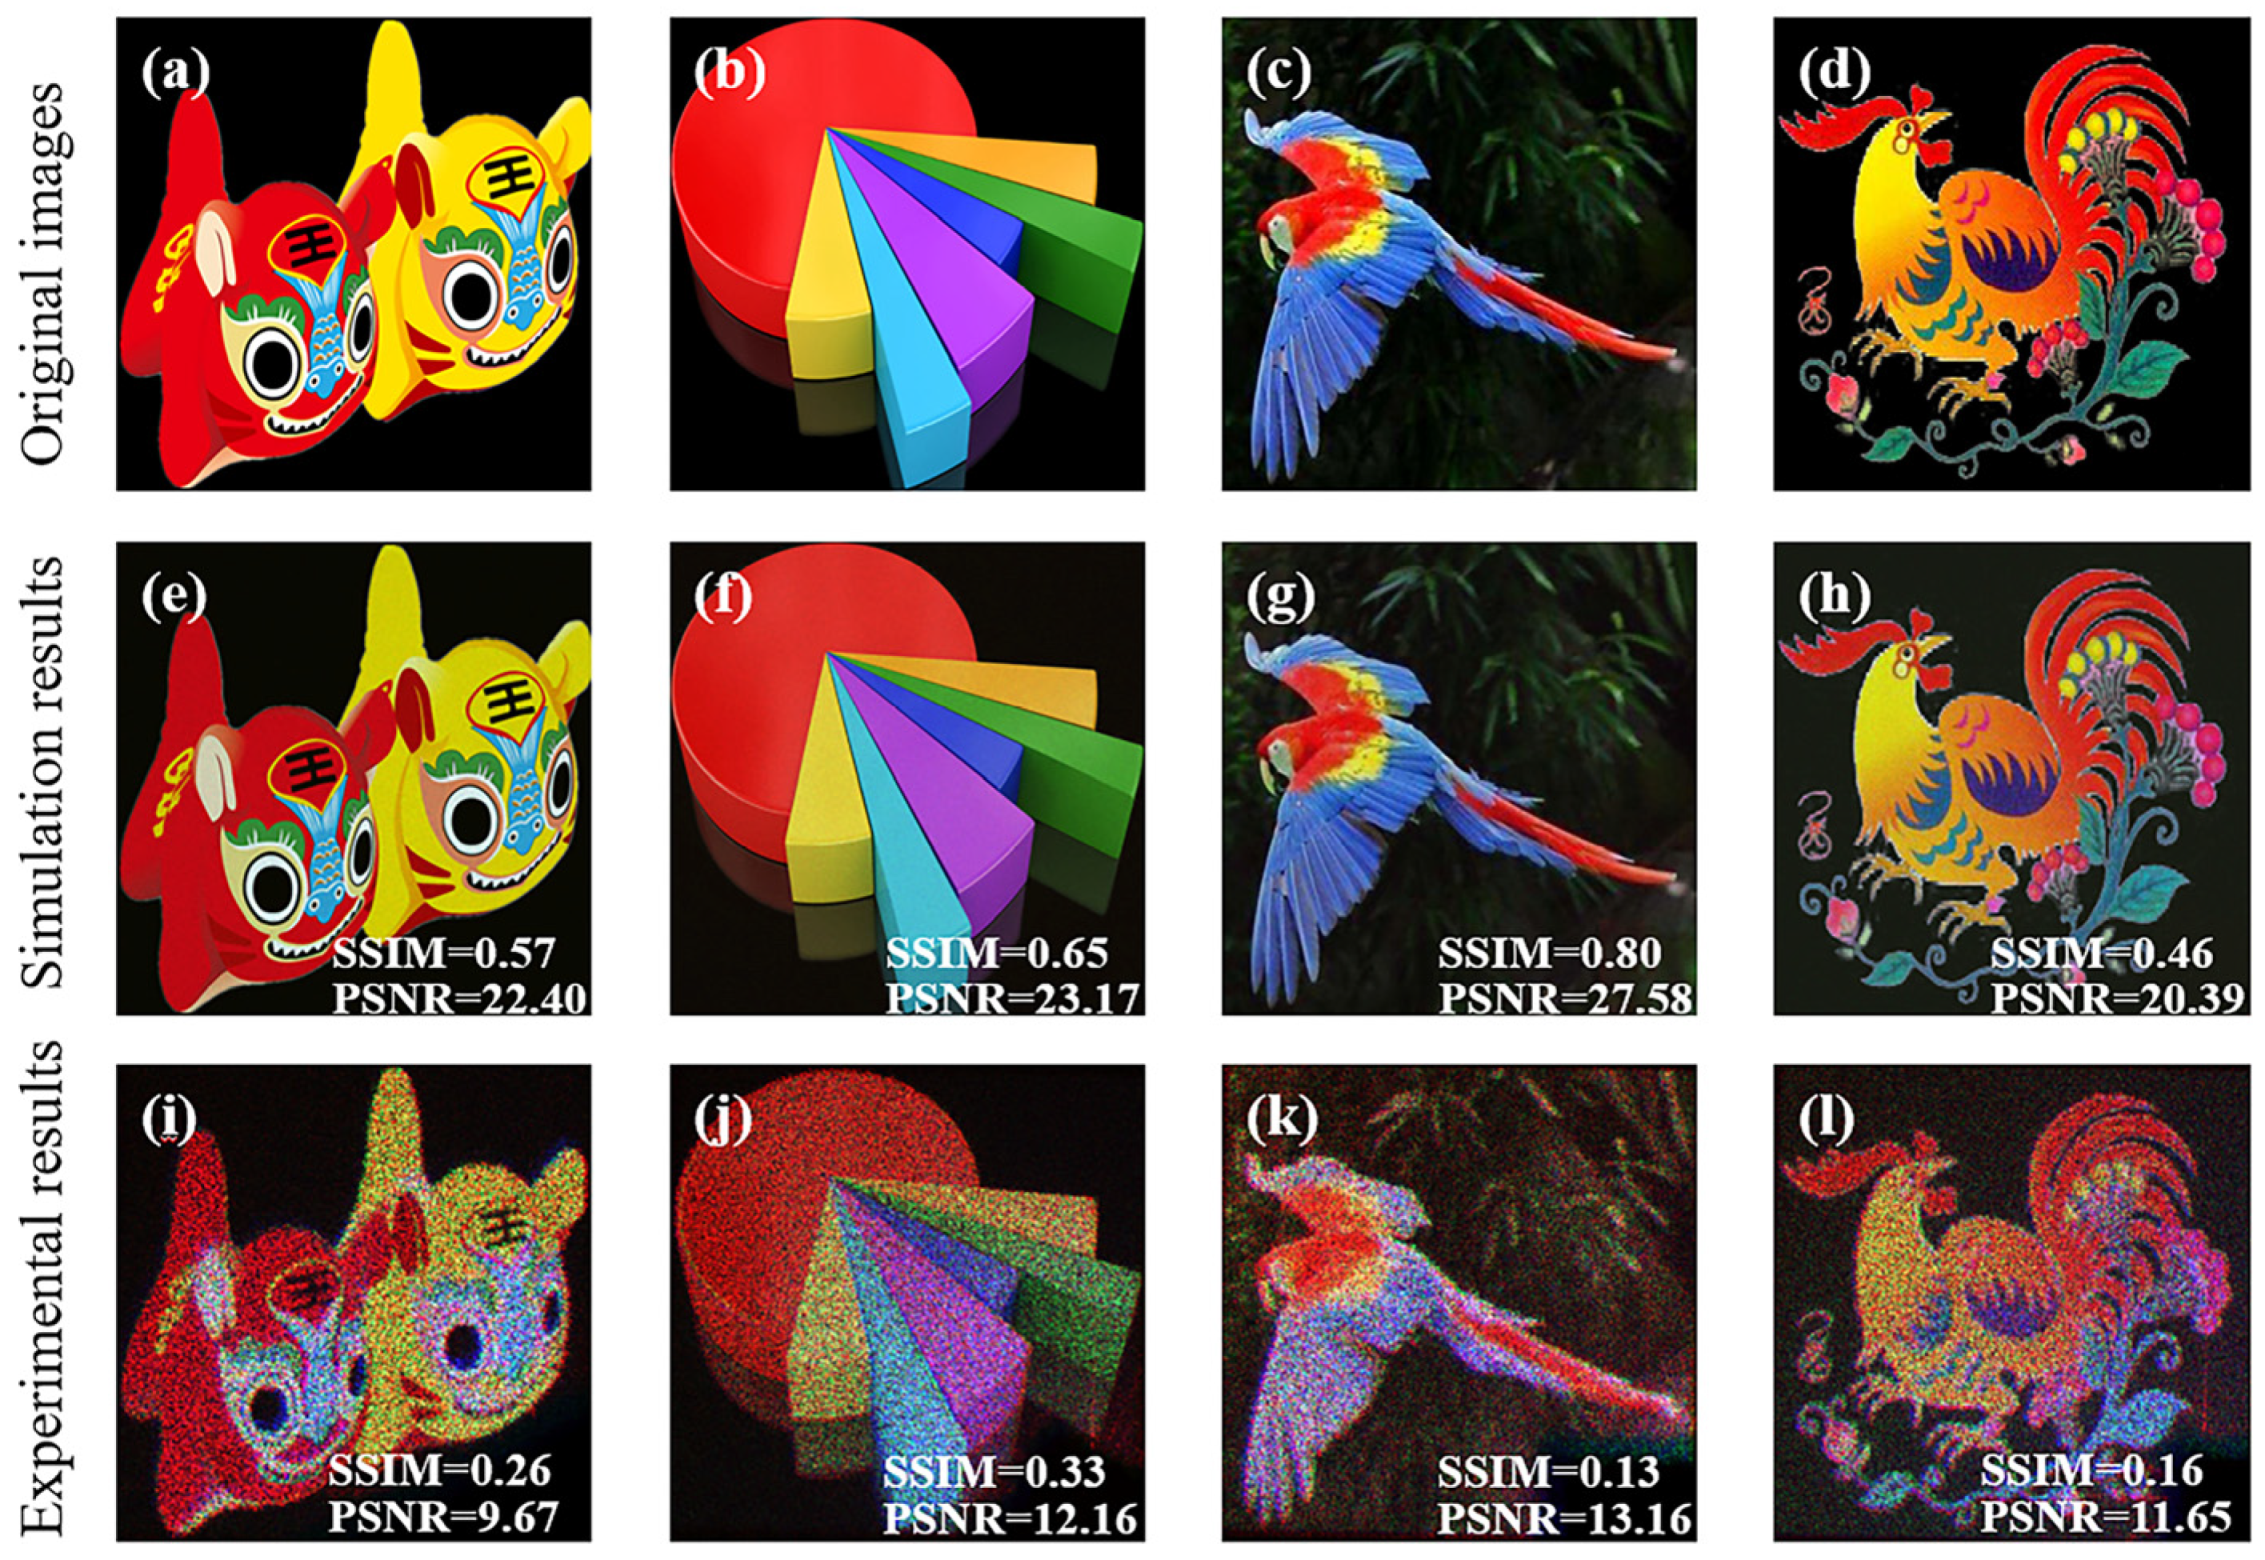
4.1. Single Plane Color Image Reconstruction

In simulations and experiments, the pixel numbers ( M × N ) of trichromatic hologram components were all set as 3000 × 3000 . The diffraction distance z and sampling interval d of the hologram were set as 0.3   m and 3   μ m , respectively. K 1 = 4000 , K 2 = 4000 , K 3 = 0   and   K 4 = 4000 . The pixel number P 3 × Q 3 of the blue component in the signal domain was set as 681 × 681 . The t 0 and r 0 were set as 1159 and 1159 , respectively. According to Equations (1), (2), (4) and (5), the pixel numbers and the central coordinates of the trichromatic image components were calculated as follows: P 1 × Q 1 = 424 × 424 , P 2 × Q 2 = 519 × 519 . O 1 ( 168 , 168 ) , O 2 ( 206 , 882 ) and O 3 ( 1159 , 1159 ) . The corresponding distribution is shown in Figure 4.
The trichromatic hologram components were designed based on the phase retrieval algorithm proposed in our previous work [29]. To verify the above design results, the hologram was quantized into a binary diffractive optical element (DOE) and fabricated on the fused silica by lithography.
The design details of the DOE are as follows: The trichromatic phase-only hologram components were designed based on the phase retrieval algorithm, which are represented as ϕ 1 ( x , y ) , ϕ 2 ( x , y ) and ϕ 3 ( x , y ) , respectively. The relief depths of the DOE can be expressed as h i ( x , y ) = λ i ϕ i ( x , y ) / [ 2 π ( n i 1 ) ] , ( i = 1 , 2 , 3 ) , where h i and n i represent the relief depth and the refractive index of different wavelengths, respectively. The three relief depth distributions were quantized into two levels and processed on a substrate. However, there is a problem in fabrication, that is, the corresponding level heights λ i / ( n i 1 ) of the three quantized relief depth distributions are not the same. After calculation, the theoretical depths of DOE for the R, G, and B wavelengths are 712 nm, 577 nm, and 432 nm, respectively. Therefore, the etching depths for different wavelengths are different, and the three regions need to be etched separately. The solution is as follows. The etching process is divided into three steps, as shown in Figure 5.
In step one [Figure 5b,c], the three distributions are etched simultaneously until the shallowest one (DOE for the B wavelengths) is formed. In step two [Figure 5c,d], the shallowest distribution is occluded, and the remaining two distributions continue to be etched until the medium one (DOE for the G wavelengths) is formed. In step three [Figure 5d,e], the first two distributions are occluded, and the remaining deepest one (DOE for the R wavelengths) continues to be etched. Thereby, three distributions containing different level heights can be processed on a substrate by taking advantage of the above method. As can be seen from Figure 5f, the fabricated three distributions h 1 ( x , y ) , h 2 ( x , y ) and h 3 ( x , y ) are all two-level structures, but have different depths. The fabricating process is described in detail below.
AZ1500 was chosen as the photoresist to carry out the exposure. The photoresist was spin-coated on the substrate with a rotation speed of 4000 rad/min. The process parameters of coating time, prebake temperature, and prebake time were 20 s, 100 °C, and 5~6 min, respectively. An exposure system was employed to perform the exposure process, whose illumination light source is a Hg lamp with a central wavelength of 365 nm and a power of 2.5 W. The total exposure times were 10 s. Process parameters of development, after-bake temperature, and after-bake time were 30 s, 120 °C, and 60 min, respectively. RIE was carried out to transfer the structure into the substrate. The three etching times were 10 min 48 s, 3 min 27 s, and 3 min 23 s, respectively. The pictures of the obtained elements are shown in Figure 3. The fabricated result is shown in Figure 6a. Figure 6b is a microscopic, enlarged view of the DOE. The relief depths were measured as 711 nm, 584 nm, and 427 nm by a step profilometer (Stylus Profiler System, Dektak XT, Bruker, Karlsruhe, Germany), which are close to the designed depths. The etching errors were controlled within 10 nm, which was a high level of micromachining.
The optical experiments were carried out to verify the design method, as shown in Figure 6c. Three parallel monochromatic lasers of designed wavelengths irradiate the corresponding regions of the DOE after passing through the beam splitters (BS). And the CCD (HR16000CTLGEC camera with a resolution of 4896 × 3248 and a pixel size of 7.4   μ m × 7.4   μ m ) was placed at a distance of 0.3   m from the DOE to capture the reconstructed color images.
In the experiment process, the incident R, G, and B laser beams need to be collimated to irradiate the areas of the trichromatic hologram components vertically. If one of the laser beams has a certain divergence angle, the size of the reconstructed image component at the designed distance will have a certain scaling, resulting in different sizes of the trichromatic images, which cannot achieve perfect coincidence. Therefore, the collimation of the laser beam should be calibrated before image reconstruction. In the specific experiment, the output spots of the lasers from the near distance (close to the laser output surface) to the far distance (such as 3 m) were dynamically observed and measured by CCD. When the difference between spot sizes at different distances was controlled within 10 pixels, it was considered that the collimation of the beam had been adjusted. At the same time, the trichromatic lasers passing through the beam splitter (BS) were adjusted to be parallel to each other and perpendicular to the DOE. It is important to note that if the laser beam is not irradiating in a strictly vertical manner at the DOE, it can result in a considerable degree of dislocation in the reconstructed trichromatic image components at the intended distance. This dislocation also impedes the achievement of perfect coincidence, rendering the output suboptimal. We judged whether the trichromatic laser beams were perpendicular to the DOE by observing whether there was dislocation between the reconstructed image components. As long as the trichromatic components in one of the projection planes can perfectly coincide, the subsequent components at different distances can perfectly coincide in the following multiplane color image reconstruction.
The image reconstruction quality was estimated by the structural similarity index (SSIM) and the peak signal-to-noise ratio (PSNR). The results are shown in Figure 7.
Figure 7a–d are four original colorful images. Figure 7e–h are the simulation results. Figure 7i–l are the experimental results. The simulation results show that high-quality color image reconstruction has been successfully achieved based on the proposed method. The experiment also achieved the perfect coincidence of the trichromatic image components. However, the image quality decreased slightly in the experiment because of the speckle noise caused by the laser coherence.

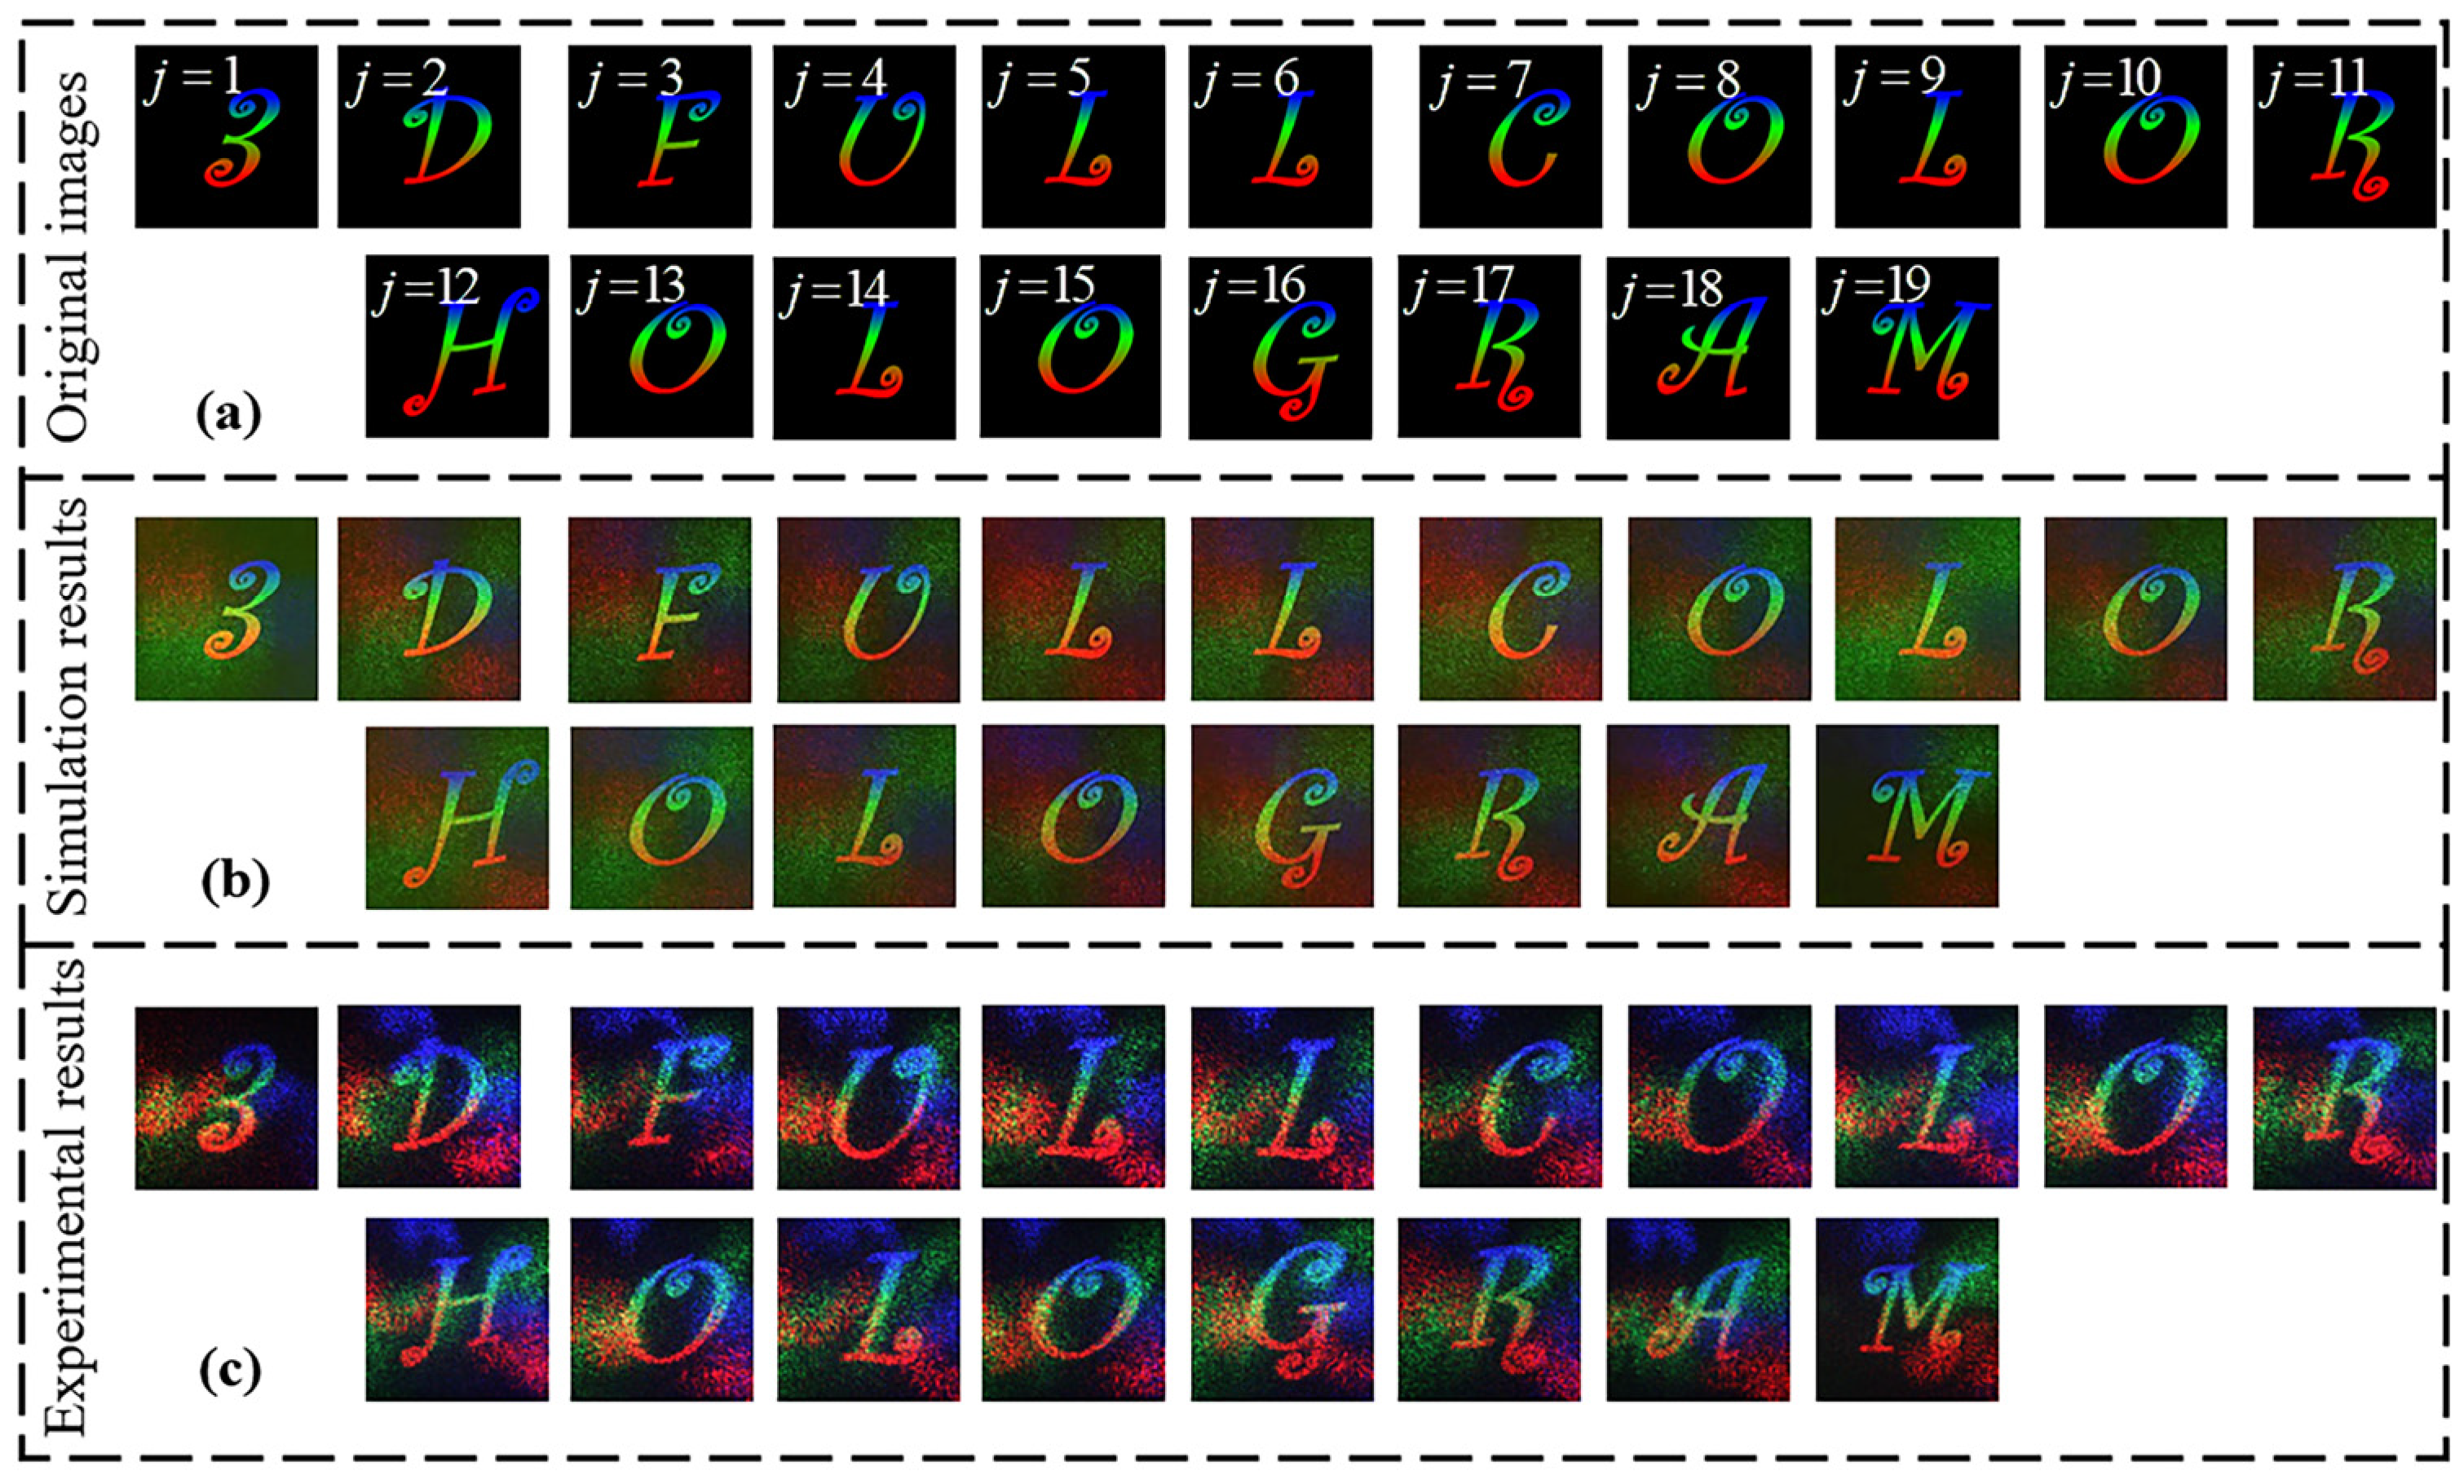
4.2. Multiplane Color Image Reconstruction

The full-color multiplane hologram was realized by combining the space division method proposed in this paper with a simple 3D phase retrieval algorithm [18,30]. As shown in Figure 8, 19 colorful letters “3D FULLCOLOR HOLOGRAM” were selected as the intensities of the desired light fields and were projected on 19 planes, respectively.
The pixel numbers of trichromatic hologram components were all set as 5000 × 5000 and the sampling interval was set as 3   μ m . The pixel numbers of the signal domain of blue components at different projection planes were all set as 500 × 500 . The interval coefficients of multiplane holograms ( K 1 ,   K 2 ,   K 3   and   K 4 ) were set as 6000 , 6000 , 0 and 6000 , respectively. The diffraction distances and offsets at different projection planes are calculated as shown in Table 1.
Therefore, according to Equations (4)–(6), the images were preprocessed to obtain the desired light fields. The hologram was fabricated, and the simulation and experimental verification were carried out. The 19 letters are successfully reconstructed on 19 planes, as shown in Figure 8.
The average SSIM and PSNR of the experimental results are 0.15 and 14 dB, which is close to that of the simulation results, which are 0.16 and 15.78 dB (Figure 9). The phase recovery algorithm proposed in Refs. [18,25] was used to realize multi-plane color image reconstruction. In order to balance the reconstruction quality of images at different distances, a random phase distribution was introduced in phase reconstruction. The random speckle noise was superimposed on the reconstructed color image in the simulation and experiment. Therefore, the influence of speckle noise caused by laser coherence can be ignored in the experimental process. In general, the validity of the proposed method is verified by simulation and experiment, and the image reconstruction quality is comparable in simulation and experiment.

5. Conclusions

In conclusion, a full-color multiplane hologram is designed based on the space division method. The axial crosstalk can be avoided to improve image quality by the proposed method. To overlap the R, G, and B trichromatic images perfectly, the requirements of dimension matching and position matching should be met for the desired images at different projection depths. The dimension matching condition ensures the same image size, and the position matching condition ensures the same center position for the R, G, and B trichromatic images. The simulation and experiment results validate the proposed method by reconstructing colorful images at different projection depths. The experimental optical path is compact and simple, which is expected to be used to realize full-color display.

Author Contributions

Conceptualization, Y.P.; methodology, Y.P. and A.C.; validation, A.C. and Q.D.; formal analysis, A.C.; investigation, A.C.; resources, Q.D.; data curation, A.C. and Q.D.; writing—original draft preparation, A.C.; writing—review and editing, Y.P. and Q.D.; visualization, Y.P. and A.C.; supervision, Y.P. and A.C.; project administration, Q.D.; funding acquisition, Q.D. All authors have read and agreed to the published version of the manuscript.

Funding

This research was funded by the National Natural Science Foundation of China (61905251).

Institutional Review Board Statement

Not applicable.

Informed Consent Statement

Not applicable.

Data Availability Statement

The raw data supporting the conclusions of this article will be made available by the authors on request.

Conflicts of Interest

The authors declare no conflicts of interest.

References

  1. Bruder, F.-K.; Fäcke, T.; Rölle, T. Thermal Fringe Formation during a Hologram Recording Using a Dry Photopolymer. Photonics 2021, 8, 589. [Google Scholar] [CrossRef]
  2. Shin, C.-W.; Wu, H.-Y.; Kwon, K.-C.; Piao, Y.-L.; Lee, K.-Y.; Gil, S.-K.; Kim, N. Diffraction Efficiency Enhancement and Optimization in Full-Color HOE Using the Inhibition Characteristics of the Photopolymer. Opt. Express 2021, 29, 1175. [Google Scholar] [CrossRef]
  3. Wang, W.; Wang, X.; Xu, B.; Chen, J. Optical Image Encryption and Authentication Using Phase-Only Computer-Generated Hologram. Opt. Lasers Eng. 2021, 146, 106722. [Google Scholar] [CrossRef]
  4. Mu, C.-T.; Chen, C.-H. Diffractive Distortion of a Pixelated Computer-Generated Hologram with Oblique Illumination. Appl. Opt. 2020, 59, 7153. [Google Scholar] [CrossRef]
  5. Bai, Y.; Zhang, Z.; Chen, T.; Wang, R.; Wei, H.; Zeng, X.; Zhang, X. Evaluation of Wavefront Aberrations Induced by Overlay Errors in Stitching Computer-Generated Holograms. Opt. Lasers Eng. 2022, 152, 106944. [Google Scholar] [CrossRef]
  6. Sifatul Islam, M.; Piao, Y.-L.; Zhao, Y.; Kwon, K.-C.; Cho, E.; Kim, N. Max-Depth-Range Technique for Faster Full-Color Hologram Generation. Appl. Opt. 2020, 59, 3156. [Google Scholar] [CrossRef] [PubMed]
  7. Yamada, S.; Shimobaba, T.; Kakue, T.; Ito, T. Full-Color Computer-Generated Hologram Using Wavelet Transform and Color Space Conversion. Opt. Express 2019, 27, 8153. [Google Scholar] [CrossRef] [PubMed]
  8. Park, S.; Lee, J.; Lim, S.; Kim, M.; Ahn, S.; Hwang, S.; Jeon, S.; Jeong, J.; Hahn, J.; Kim, H. Wide-Viewing Full-Color Depthmap Computer-Generated Holograms. Opt. Express 2021, 29, 26793. [Google Scholar] [CrossRef] [PubMed]
  9. Martinez-Carranza, J.; Kozacki, T.; Kukołowicz, R.; Chlipala, M.; Idicula, M.S. Occlusion Culling for Wide-Angle Computer-Generated Holograms Using Phase Added Stereogram Technique. Photonics 2021, 8, 298. [Google Scholar] [CrossRef]
  10. Zheng, H.; Zhou, C.; Shui, X.; Yu, Y. Computer-Generated Full-Color Phase-Only Hologram Using a Multiplane Iterative Algorithm with Dynamic Compensation. Appl. Opt. 2022, 61, B262. [Google Scholar] [CrossRef]
  11. Sakamoto, Y.; Oshinomi, T.; Matsuno, K. Method of Calculating Speckle-Reduced Hologram Data Using a Convergence Light Wave for a Computer-Generated Hologram. Appl. Opt. 2023, 62, 1970. [Google Scholar] [CrossRef] [PubMed]
  12. Sando, Y.; Itoh, M.; Yatagai, T. Full-Color Computer-Generated Holograms Using 3-D Fourier Spectra. Opt. Express 2004, 12, 6246. [Google Scholar] [CrossRef]
  13. Nakayama, H.; Takada, N.; Ichihashi, Y.; Awazu, S.; Shimobaba, T.; Masuda, N.; Ito, T. Real-Time Color Electroholography Using Multiple Graphics Processing Units and Multiple High-Definition Liquid-Crystal Display Panels. Appl. Opt. 2010, 49, 5993. [Google Scholar] [CrossRef]
  14. Shimobaba, T.; Ito, T. A Color Holographic Reconstruction System by Time Division Multiplexing with Reference Lights of Laser. Opt. Rev. 2003, 10, 339–341. [Google Scholar] [CrossRef]
  15. Zhang, Z.; Chen, S.; Zheng, H.; Zeng, Z.; Gao, H.; Yu, Y.; Asundi, A.K. Full-Color Holographic 3D Display Using Slice-Based Fractional Fourier Transform Combined with Free-Space Fresnel Diffraction. Appl. Opt. 2017, 56, 5668. [Google Scholar] [CrossRef]
  16. Makowski, M.; Sypek, M.; Kolodziejczyk, A. Colorful Reconstructions from a Thin Multi-Plane Phase Hologram. Opt. Express 2008, 16, 11618. [Google Scholar] [CrossRef] [PubMed]
  17. Deng, Z.; Jin, M.; Ye, X.; Wang, S.; Shi, T.; Deng, J.; Mao, N.; Cao, Y.; Guan, B.; Alù, A.; et al. Full-Color Complex-Amplitude Vectorial Holograms Based on Multi-Freedom Metasurfaces. Adv. Funct. Mater. 2020, 30, 1910610. [Google Scholar] [CrossRef]
  18. Pang, Y.; Cao, A.; Wang, J.; Pang, H.; Deng, Q. Simple Encoding Method of Phase-Only Hologram for Low Crosstalk Full-Color Multi-Plane Holographic Projection. Opt. Lasers Eng. 2021, 147, 106748. [Google Scholar] [CrossRef]
  19. Shimobaba, T.; Takahashi, T.; Masuda, N.; Ito, T. Numerical Study of Color Holographic Projection Using Space-Division Method. Opt. Express 2011, 19, 10287. [Google Scholar] [CrossRef]
  20. Ito, T.; Okano, K. Color Electroholography by Three Colored Reference Lights Simultaneously Incident upon One Hologram Panel. Opt. Express 2004, 12, 4320. [Google Scholar] [CrossRef]
  21. Makowski, M.; Ducin, I.; Kakarenko, K.; Suszek, J.; Sypek, M.; Kolodziejczyk, A. Simple Holographic Projection in Color. Opt. Express 2012, 20, 25130. [Google Scholar] [CrossRef] [PubMed]
  22. Wang, J.; Liu, L.; Cao, A.; Pang, H.; Xu, C.; Mu, Q.; Chen, J.; Shi, L.; Deng, Q. Generation of Color Images by Utilizing a Single Composite Diffractive Optical Element. Micromachines 2018, 9, 508. [Google Scholar] [CrossRef] [PubMed]
  23. Makowski, M.; Ducin, I.; Sypek, M.; Siemion, A.; Siemion, A.; Suszek, J.; Kolodziejczyk, A. Color Image Projection Based on Fourier Holograms. Opt. Lett. 2010, 35, 1227. [Google Scholar] [CrossRef] [PubMed]
  24. Kim, J.; Seong, J.; Yang, Y.; Moon, S.-W.; Badloe, T.; Rho, J. Tunable Metasurfaces towards Versatile Metalenses and Metaholograms: A Review. Adv. Photonics 2022, 4, 024001. [Google Scholar] [CrossRef]
  25. Su, D.; Wang, X.; Shang, G.; Ding, X.; Burokur, S.N.; Liu, J.; Li, H. Amplitude-Phase Modulation Metasurface Hologram with Inverse Angular Spectrum Diffraction Theory. J. Phys. Appl. Phys. 2022, 55, 235102. [Google Scholar] [CrossRef]
  26. Kim, N.; Ee, H.-S. Multi-Color Metasurface Hologram Based on Depth-Division Multiplexing Method. J. Korean Phys. Soc. 2023, 82, 166–172. [Google Scholar] [CrossRef]
  27. Li, X.; Chen, Q.; Zhang, X.; Zhao, R.; Xiao, S.; Wang, Y.; Huang, L. Time-Sequential Color Code Division Multiplexing Holographic Display with Metasurface. Opto-Electron. Adv. 2023, 6, 220060. [Google Scholar] [CrossRef]
  28. Wan, W.; Yang, W.; Ye, S.; Jiang, X.; Han, Y.; Feng, H.; Liu, Y.; Gong, Q.; Xiao, S.; Li, Y. Tunable Full-Color Vectorial Meta-Holography. Adv. Opt. Mater. 2022, 10, 2201478. [Google Scholar] [CrossRef]
  29. Pang, Y.; Wu, X.; Pang, H.; Liu, L.; Xue, L.; Liu, W.; Shi, L.; Cao, A.; Deng, Q. Error Tracking-Control-Reduction Algorithm for Designing Diffractive Optical Element with High Image Reconstruction Quality. Opt. Express 2020, 28, 10090. [Google Scholar] [CrossRef]
  30. Makey, G.; Yavuz, Ö.; Kesim, D.K.; Turnalı, A.; Elahi, P.; Ilday, S.; Tokel, O.; Ilday, F.Ö. Breaking Crosstalk Limits to Dynamic Holography Using Orthogonality of High-Dimensional Random Vectors. Nat. Photonics 2019, 13, 251–256. [Google Scholar] [CrossRef]
Figure 1. Principle of the reproduction of the color image.
Photonics 11 00230 g001
Figure 2. The positional relationship between the centers of the trichromatic components from the hologram plane to the projection plane.
Photonics 11 00230 g002
Figure 3. The distribution of the reconstructed image in the projection plane.
Photonics 11 00230 g003
Figure 4. The design results of the trichromatic image components in the projection plane.
Photonics 11 00230 g004
Figure 5. Three-step method for etching the DOE. (a) The designed mask and the substrate coated with photoresist. The red area and the gray area represent photoresist and silica substrate, respectively. (b) The structure of the mask is transformed into the photoresist with a 2-depth level by exposure and development. (c) The structure of photoresist is transformed into the silica substrate by RIE, and the shallowest depth distribution h 3 ( x , y ) corresponding to blue light has been formed in advance. (d) A baffle plate is used to occlude the depth distribution of h 3 ( x , y ) to prevent excessive etching, while the remaining two distributions h 1 ( x , y ) and h 2 ( x , y ) corresponding to red and green light are etched continuously until a depth of h 2 ( x , y ) is achieved. (e) A baffle plate is used to occlude the depth distribution of h 2 ( x , y ) and h 3 ( x , y ) to prevent excessive etching, while the distributions of h 1 ( x , y ) are etched continuously. (f) The remaining photoresist is removed.
Photonics 11 00230 g005
Figure 6. The optical experiment. (a) The fabrication results; (b) the microscopic, enlarged view of the DOE; (c) the experimental setup.
Photonics 11 00230 g006
Figure 7. The single plane color image reconstruction. (ad) The original images; (eh) the simulation results; (il) the experimental results.
Photonics 11 00230 g007
Figure 8. The multiplane color image reconstruction. (a) The original images; (b) the simulation results; (c) the experimental results.
Photonics 11 00230 g008
Figure 9. The SSIM (a) and PSNR (b) of the simulation and experimental results of the multiplane color image reconstruction.
Photonics 11 00230 g009
Table 1. The diffraction distances and offsets at different projection planes.
Plane  j 12345678910
z j 140147.1154.9163.6173.4184.3196.8211.1227.6246.9
t 0 −2250−2141−2033−1925−1817−1708−1600−1492−1384−1275
r 0 2250214120331925181717081600149213841275
111213141516171819
z j 269.8297.3331.2373.7428.7502.8607.8768.21043.8
t 0 −1167−1059−951−842−734−626−518−410−301
r 0 11671059951842734626518410301
Disclaimer/Publisher’s Note: The statements, opinions and data contained in all publications are solely those of the individual author(s) and contributor(s) and not of MDPI and/or the editor(s). MDPI and/or the editor(s) disclaim responsibility for any injury to people or property resulting from any ideas, methods, instructions or products referred to in the content.

