Article

Portable Diffuse Optical Tomography for Three-Dimensional Functional Neuroimaging in the Hospital

1
Department of Medical Engineering, University of South Florida, Tampa, FL 33620, USA
2
Department of Psychiatry and Behavioral Neurosciences, University of South Florida, Tampa, FL 33620, USA
3
Department of Psychiatry, University of Florida, Gainesville, FL 32611, USA
4
Department of Psychiatry, Edward Hines Jr. Veterans Administration Hospital, Hines, IL 60141, USA
5
Department of Neurology, Chengdu Fifth People’s Hospital (The Second Clinical Medical College, Affiliated Fifth People’s Hospital of Chengdu University of Traditional Chinese Medicine), Chengdu 611130, China
6
Department of Behavioral Sciences and Social Medicine, Florida State University, Tallahassee, FL 32306, USA
*
Author to whom correspondence should be addressed.
These authors contributed equally to this work.
Photonics 2024, 11(3), 238; https://doi.org/10.3390/photonics11030238
Submission received: 26 October 2023 / Revised: 27 February 2024 / Accepted: 27 February 2024 / Published: 6 March 2024
(This article belongs to the Section Biophotonics and Biomedical Optics)

Abstract

:
Functional neuroimaging studies of neuropsychiatric disorders and cognitive impairment are commonly conducted in the clinic setting but less so in the acutely medically ill while hospitalized. This is largely due to technical and logistical limitations, given the lack of portable devices with high spatial and temporal resolutions. This exploratory study reports on the development and implementation of a novel diffuse optical tomography (DOT) system that can be employed for bedside three-dimensional functional neuroimaging. To test this portable DOT system, our protocol included a task-based sequence involving the Months Backwards Test with imaging centered on the bilateral prefrontal cortex. Fifteen subjects were recruited from intensive care units and the general wards of a single tertiary academic hospital and included in our final analysis. Volumetric hemoglobin analyses of the dorsolateral prefrontal cortex (DLPFC) and dorsomedial prefrontal cortex (DMPFC) were reliably captured in all our subjects. The peak value was calculated to be 3.36 µM and 0.74 µM for oxygenated-hemoglobin (HbO) and total-hemoglobin (HbT) (p < 0.042, [HbT]), respectively. The standard error was calculated to be 4.58 uM and 3.68 uM for (HbO) and (HbT). We additionally developed a seed-based correlation analysis to demonstrate the capability of DOT in studying functional connectivity. The right DLPFC was found to be moderately associated with the left DLPFC in all our subjects (r = 0.656). The DMPFC was observed to be associated with the left DLPFC but less so (r = 0.273) at the group level. Overall, the contribution of left-to-right DLPFC connectivity was significantly higher than left DLPFC to DMPFC in our group (p = 0.012). Future studies should investigate the potential of such a DOT system in the research of neuropsychiatric and neurocognitive disorders within the hospital to study different types of mechanisms, pathophysiology, and interventions that occur acutely and can advance our knowledge of these disorders.

1. Introduction

Cognitive impairment in the general hospital is common, and 25% to 40% of admitted older patients suffer from a pre-existing neurocognitive disorder or experience a cognitive disturbance due to another cause, including delirium, traumatic brain injury, or critical illness-related sequelae [1,2,3,4]. The presence of any cognitive impairment leads to an increased risk of negative outcomes, such as mortality rates, longer hospitalization stays, and institutionalization after discharge [5,6]. Furthermore, new cognitive insults to patients already diagnosed with a dementia disorder may precipitate permanent worsening of neurocognitive function [7]. As such, the study of acute types of cognitive impairment in the hospital remains of paramount importance for developing improved prevention and detection of such disorders, along with a further understanding of the pathophysiology of long-term neurocognitive dysfunction and progression of dementia post-hospitalization.
The task of assessing and quantifying acute cognitive impairment in a hospital setting can be challenging. Due to the severity of medical illness, many patients are likely unable to tolerate comprehensive neuropsychological batteries and detailed examinations [8]. There is a plethora of brief screening instruments for the detection of delirium and acute changes in cognition; however, these tools are limited in terms of overall objective grading capabilities that are not rater-dependent [9,10]. Additionally, there are even fewer validated and expeditious options available for rating the severity of dementia and other types of cognitive impairment in such an acute setting [11]. Ideally, these bedside assessments should be paired with neuroimaging modalities to capture an objective measure of cognitive dysfunction. Unfortunately, the logistics of transporting patients for structural imaging or using popular functional methods (e.g., functional magnetic resonance imaging [fMRI] or single-photon emission computed tomography [SPECT]) are not routinely feasible, given the medical status of many patients.
In terms of portable options, electroencephalography (EEG) has been employed for the detection, study, and monitoring of many types of cognitive disturbances in the hospital [12,13,14]. Beyond clinical EEG procedures, quantitative EEG (qEEG) has even been utilized to predict long-term cognitive dysfunction after acute medical illnesses [15]. However, this technique is limited by its spatial resolution and inability to create advanced spatially focused functional connectivity maps of neurocognitive disturbances [16]. Another portable and attractive option is functional near-infrared spectroscopy (fNIRS). Near-infrared light is effectively absorbed by chromophores, such as hemoglobin, and passes relatively unimpeded via the scalp and skull to the brain. Thus, fNIRS measures changes in oxy- and de-oxyhemoglobin and captures hemodynamic response patterns, which are used as surrogate markers for brain activity [17]. It possesses a higher spatial resolution than EEG but still only produces a topographical two-dimensional map of brain regions [18]. Our proposed alternative that combines portability with three-dimensional functional imaging capabilities is diffuse optical tomography (DOT).
DOT is an optical imaging technique that takes advantage of the relative transparency of biological tissue to near-infrared (NIR) light. Hemoglobin, cytochromes, and metabolites are robust chromophores, and by detecting intrinsic changes in their absorption, fluorescence, and scattering, optical modalities are able to generate advanced functional images. Unlike fNIRS, DOT incorporates multiple NIR wavelengths, overlapping channels, and a wider range of source-detector distances for more sophisticated data acquisition [19]. It has successfully been used clinically for research in stroke, epilepsy, cancer, arthritis, cortical evoked responses, transcranial magnetic stimulation, and depression [20,21,22,23,24,25,26]. By offering volumetric and three-dimensional analyses then, DOT is an ideal option for bedside functional neuroimaging in the hospital environment. In this exploratory study, we sought to determine the feasibility of using a portable DOT system for capturing hemodynamic activation in the prefrontal cortex of hospitalized medically ill subjects. We utilized a resting and task-based imaging sequence involving the Months Backwards Test, given its validated and rapid characteristics as a neurocognitive screen. Additionally, we developed a seed-based correlation analysis for use in our DOT system to assess functional connectivity within our regions of interest.

2. Materials and Methods

2.1. Portable Diffuse Optical Tomography System

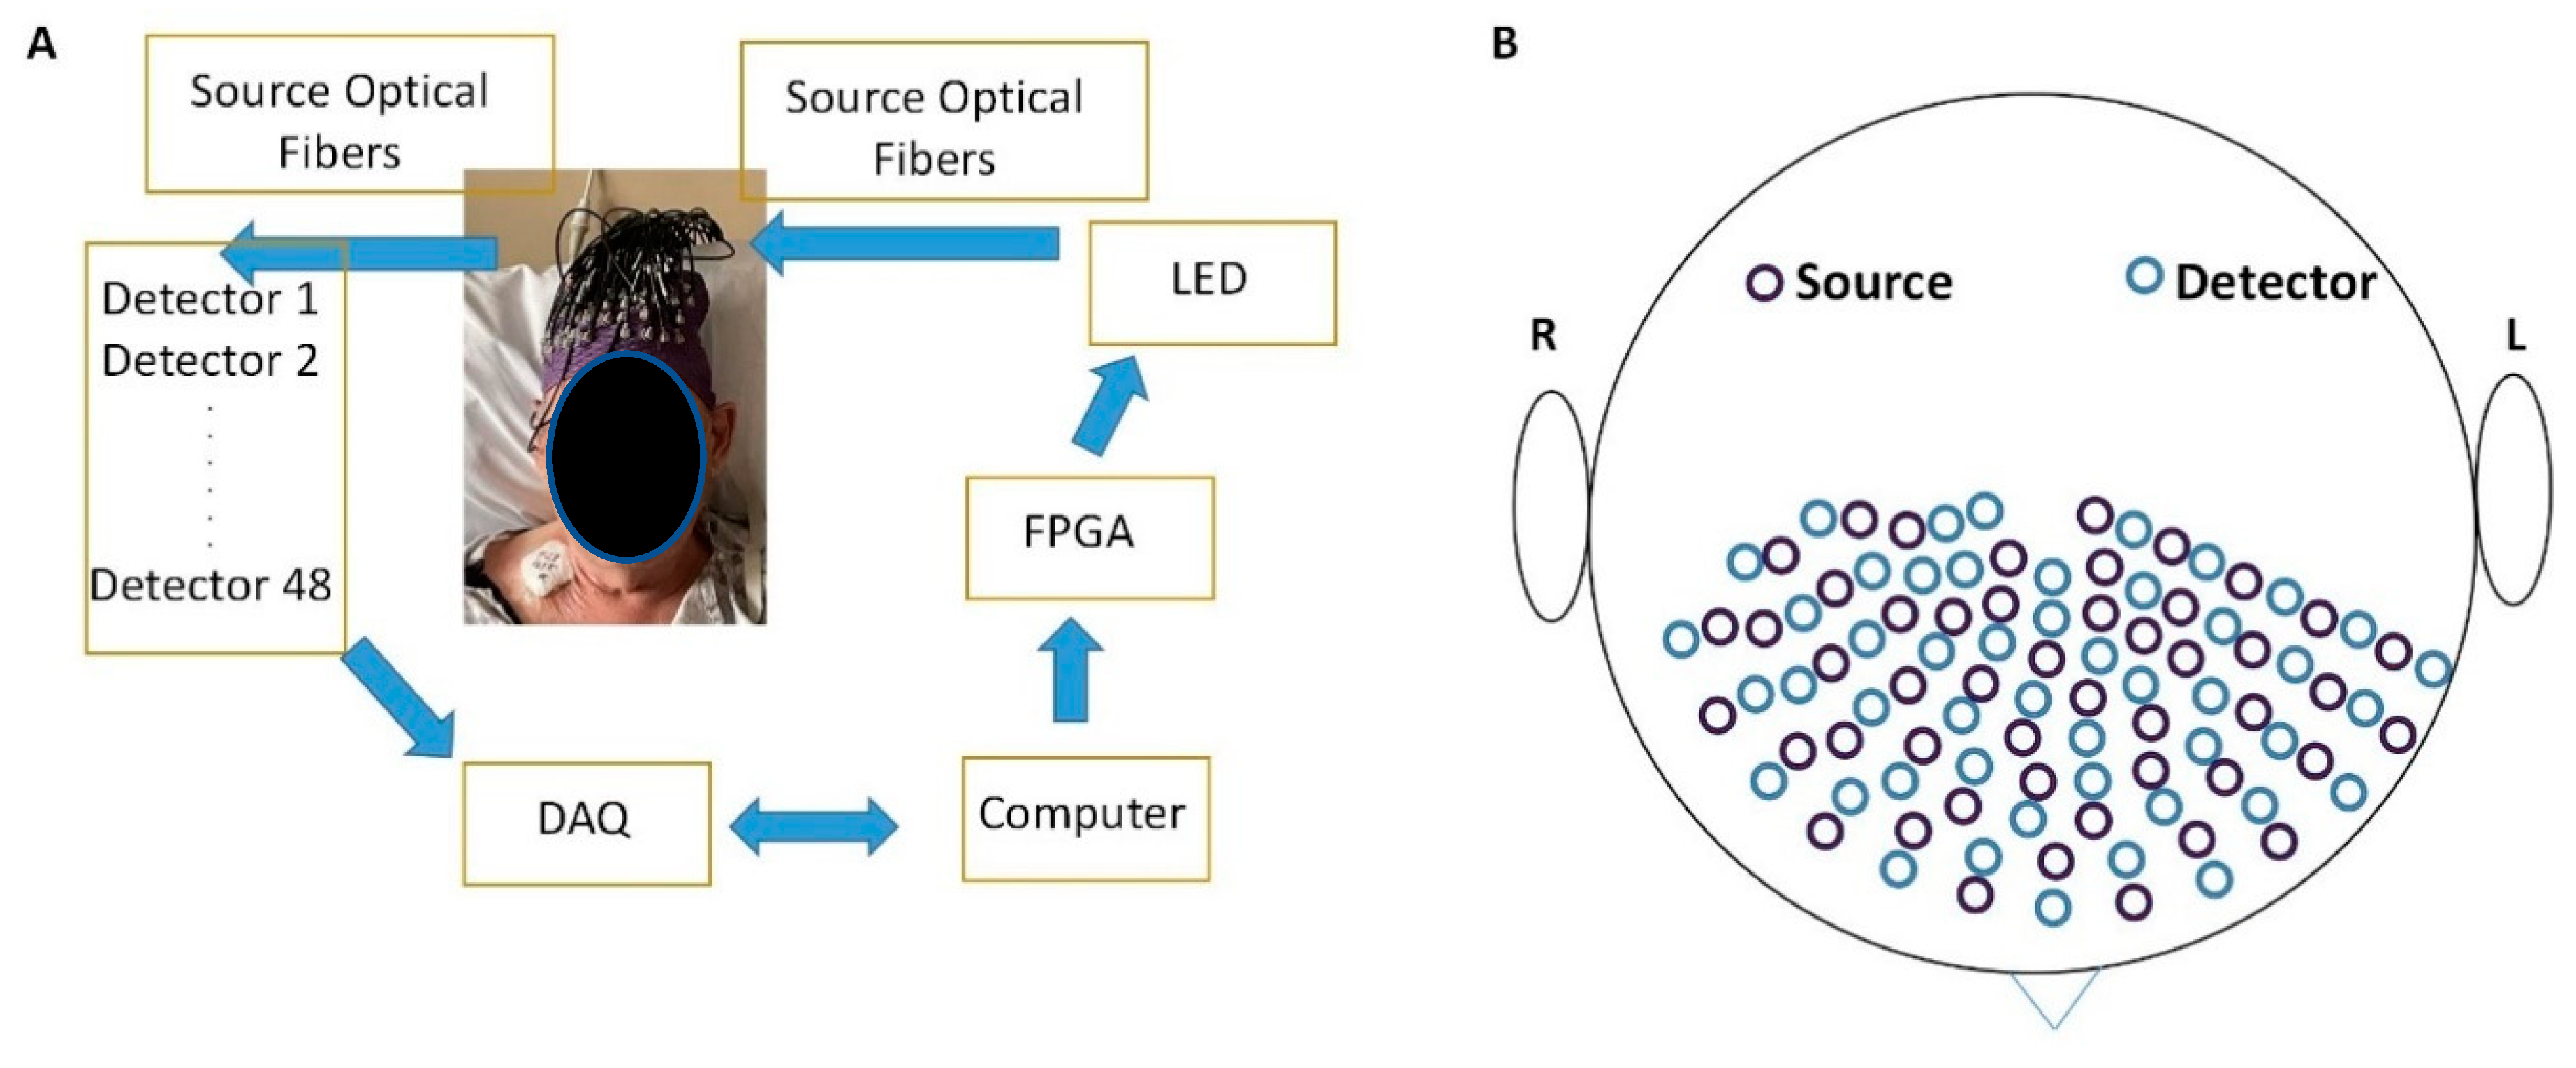
The innovative design for this portable system involves the development of our mobile custom brain interface (Figure 1). The system consists of a main computer that controls groups of light-emitting diodes via core boards, which then deliver light beams in a timed sequence. The subsequent diffusing light is received by pairs of highly sensitive photodiode detectors (the DOT “probe”). This probe is connected to a two-layer interface coupled with a flexible 256-channel electroencephalogram cap tailored to fit the head size of any subject (Figure 2). The optical fiber bundles were designed to be flexible and lightweight and were supported by a custom-built arm. The source-detector pairs included home-designed adapters that allowed for 90-degree rotations. The entire system was installed into a moveable cart for portability purposes.

2.2. Light-Emitting Diodes (LEDs)

Two groups of high-power NIR LEDs at wavelengths of 780 nm and 850 nm were chosen as the light sources (Marubeni, Japan manufacturer). The rising and falling time of the LED is less than 50 ns. The pulse width is 10 µs. Radiant power is approximately 1.6 W to ensure the energy for the light signal. Forty-eight pairs of LEDs with 780 nm and 850 nm were controlled by the self-designed LED driver to make sure that the rising and falling time was compatible with the data acquisition system.

2.3. Detection Units

The photodiode detectors (48 in total) were chosen to cover a large dynamic detection range. The high-sensitivity avalanche photodiode detectors (Hamamatsu C5460-1) consist of an APD and a low-noise current-to-voltage amplifier, which is suitable for low-light-level detection. The photon sensitivity at 30 dB is 1.5 × 10⁸ V/W, and the electronic noise level is 1 mV. The noise equivalent intensity is 6.7 pW. Since the maximum output voltage is about 10 V, accordingly, the maximum detectable light power is 67 nW.

2.4. Optical Fibers

The typical attenuation for the plastic optical fiber is 100 db/km, with a large numerical aperture of 0.4 to allow for a greater difference in time delay between individual propagating modes, which increases mode dispersion and limits bandwidth. Bifurcated optical fiber bundles are used to deliver light from the LEDs to the 48 source positions sequentially, as required by the construction algorithm, and to send the diffused light to the photodiode detectors. We built two ring-shaped interfaces, with diameters of 3 cm and 4 cm, respectively, for the phantom experiment and initial in vivo testing.

2.5. Mesh Design

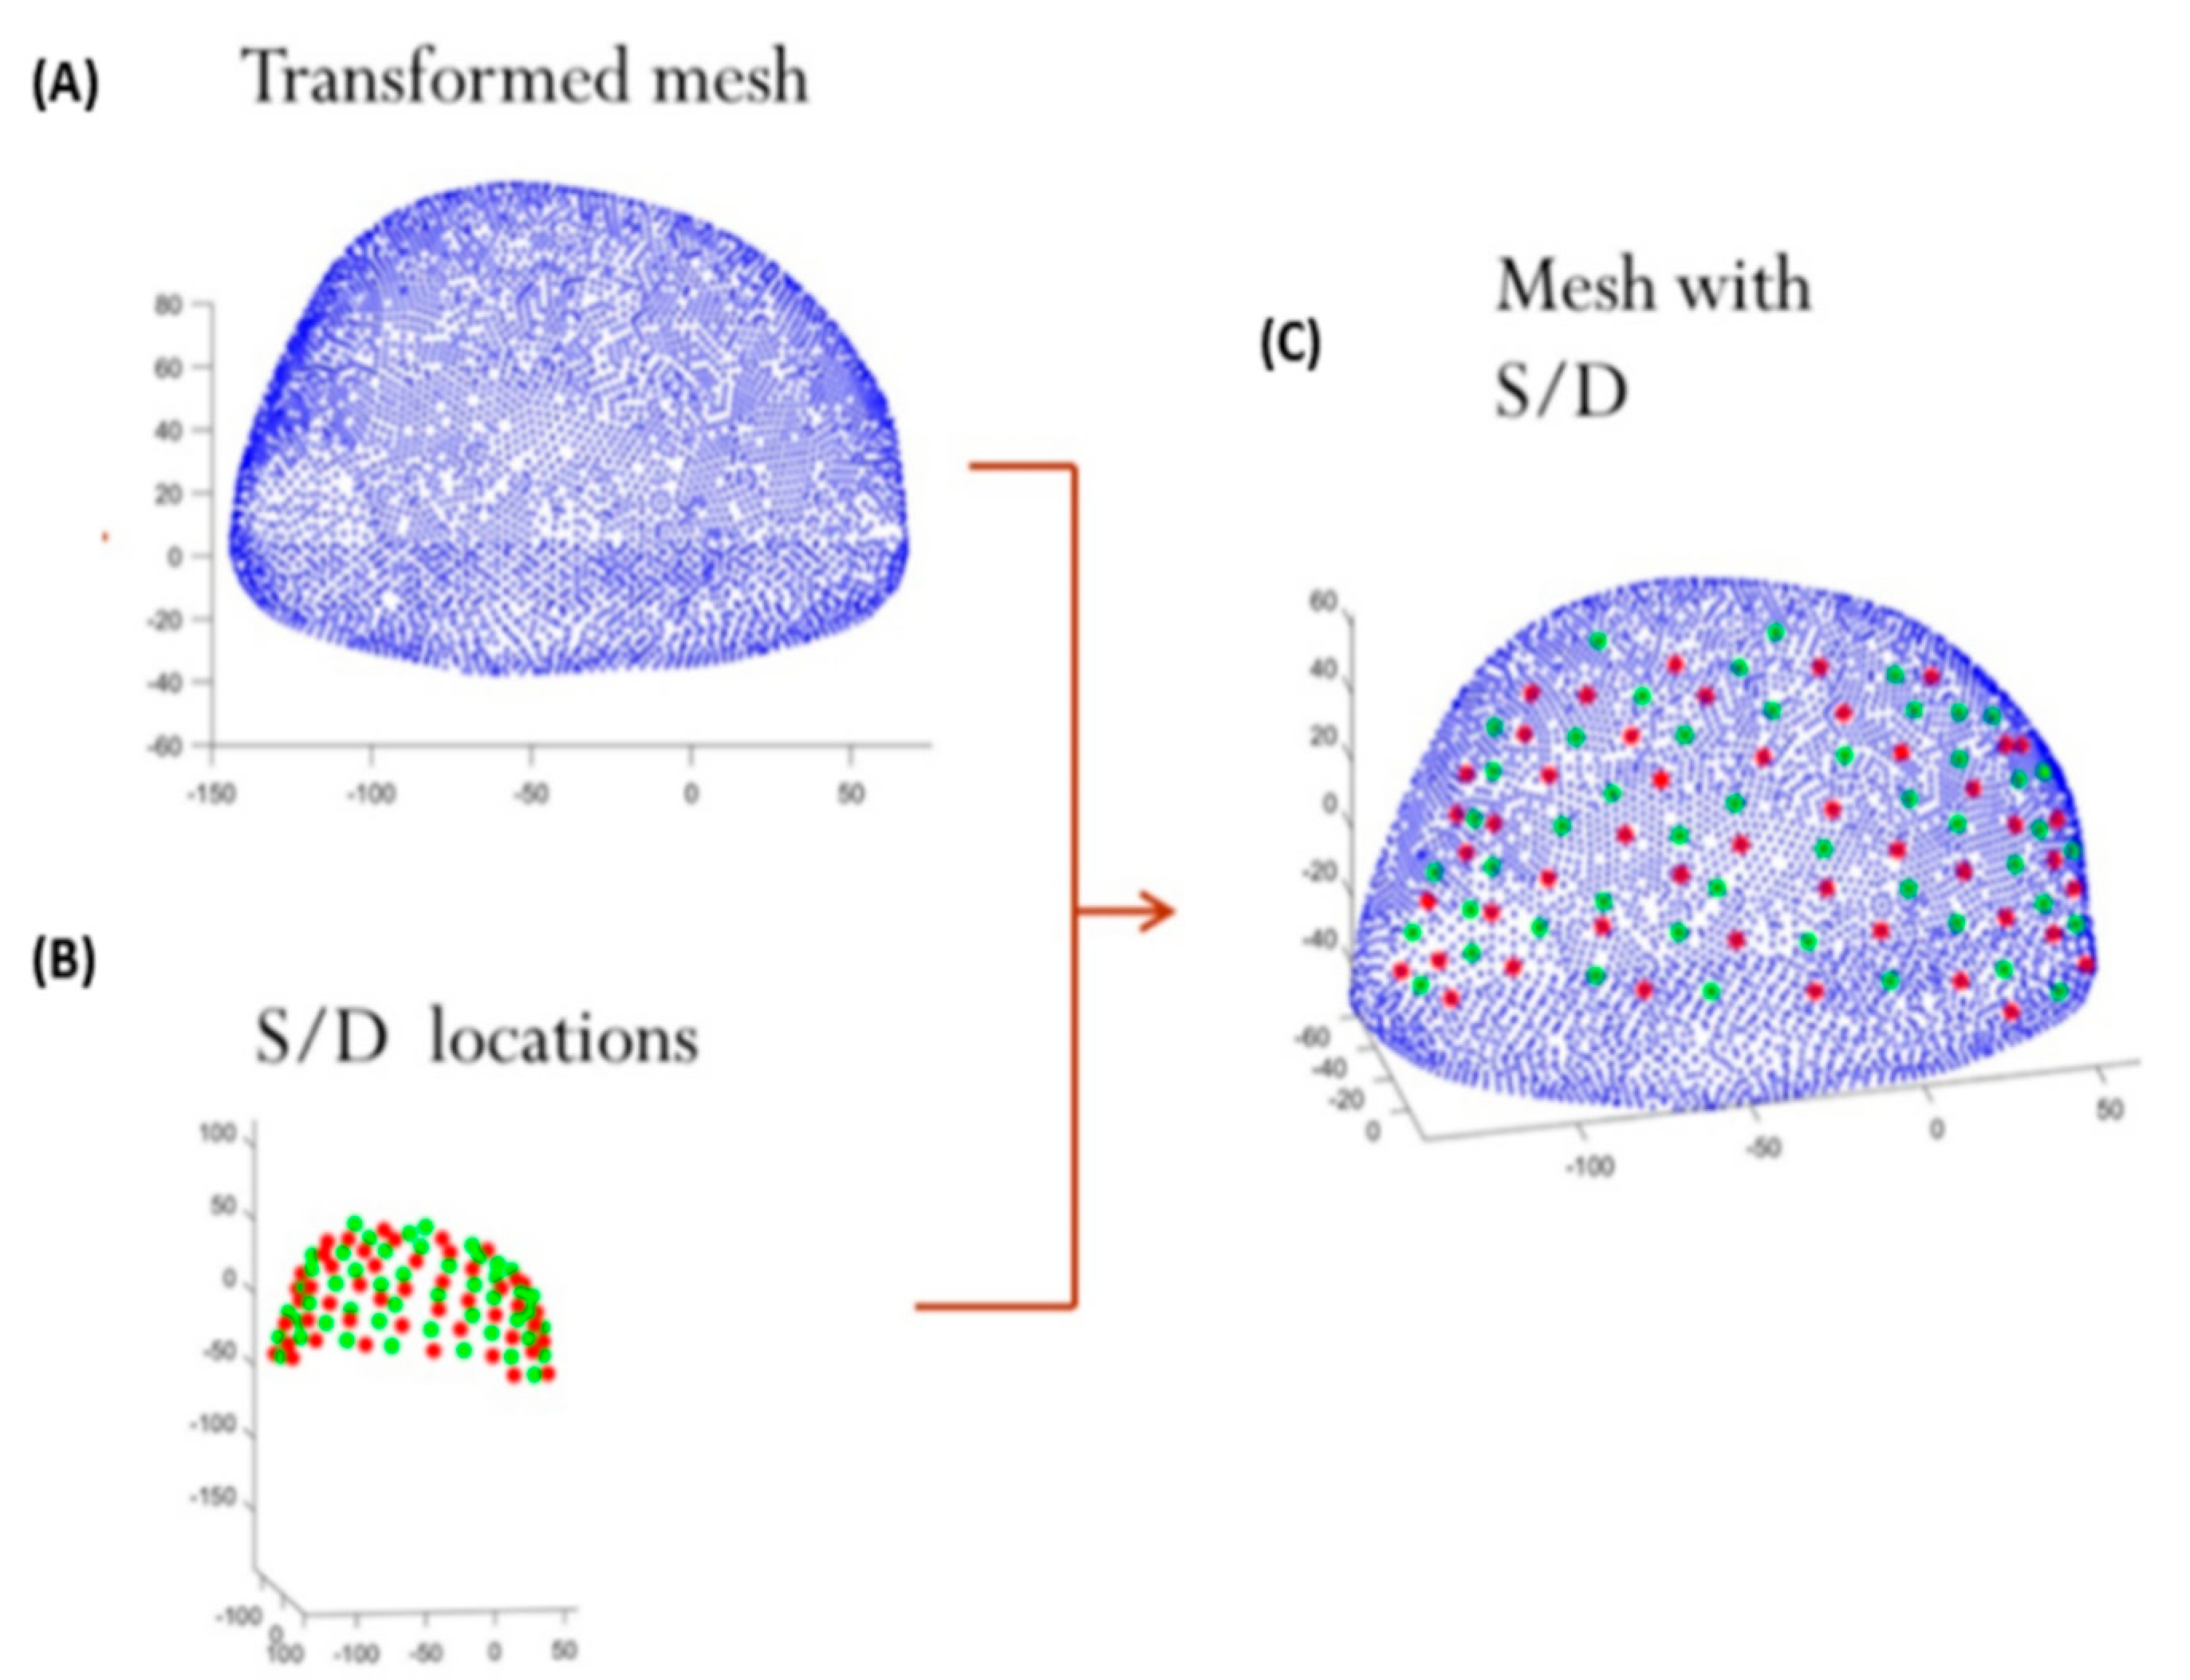
We followed the concept that brain activation could be detected accurately by using an atlas-guided approach without a subject-specific MRI. We used a Montreal Neurological Institute-based coordinate system, as discussed in our previous system [24,25]. The 3D finite element mesh for each brain was produced using the brain contour measured by a 3D magnetic space digitizer coupled with a head atlas approach. A partial head was selected and transformed into mesh from the whole head atlas, which contained our regions of interest in the brain (Figure 3A). Each subject’s locations of 13 landmarks (NZ, IZ, LPA, RPA, CZ, PZ, OZ, T8, C4, Fpz, Fz, T7, and C3) and 48 source-detector pairs were measured by the 3D magnetic space digitizer (Figure 3B). Atlas and landmarks of each human subject generated a subject-specific mesh by affine transformation. The positions of source-detector locations were projected to the new subject-specific mesh and then used for 3D DOT image reconstruction (Figure 3C) [27].
After obtaining the location of the source-detector pairs, the registered mesh was used in the image reconstruction algorithm described above to recover the distribution of the tissue absorption coefficient [28]. Each node in the registered mesh can be used to obtain the value of absorption coefficients. Due to the multiple spectra of NIR lights, we used the Beer–Lambert law to calculate the relative hemoglobin response for the regions of interest.

2.6. Adapter Design

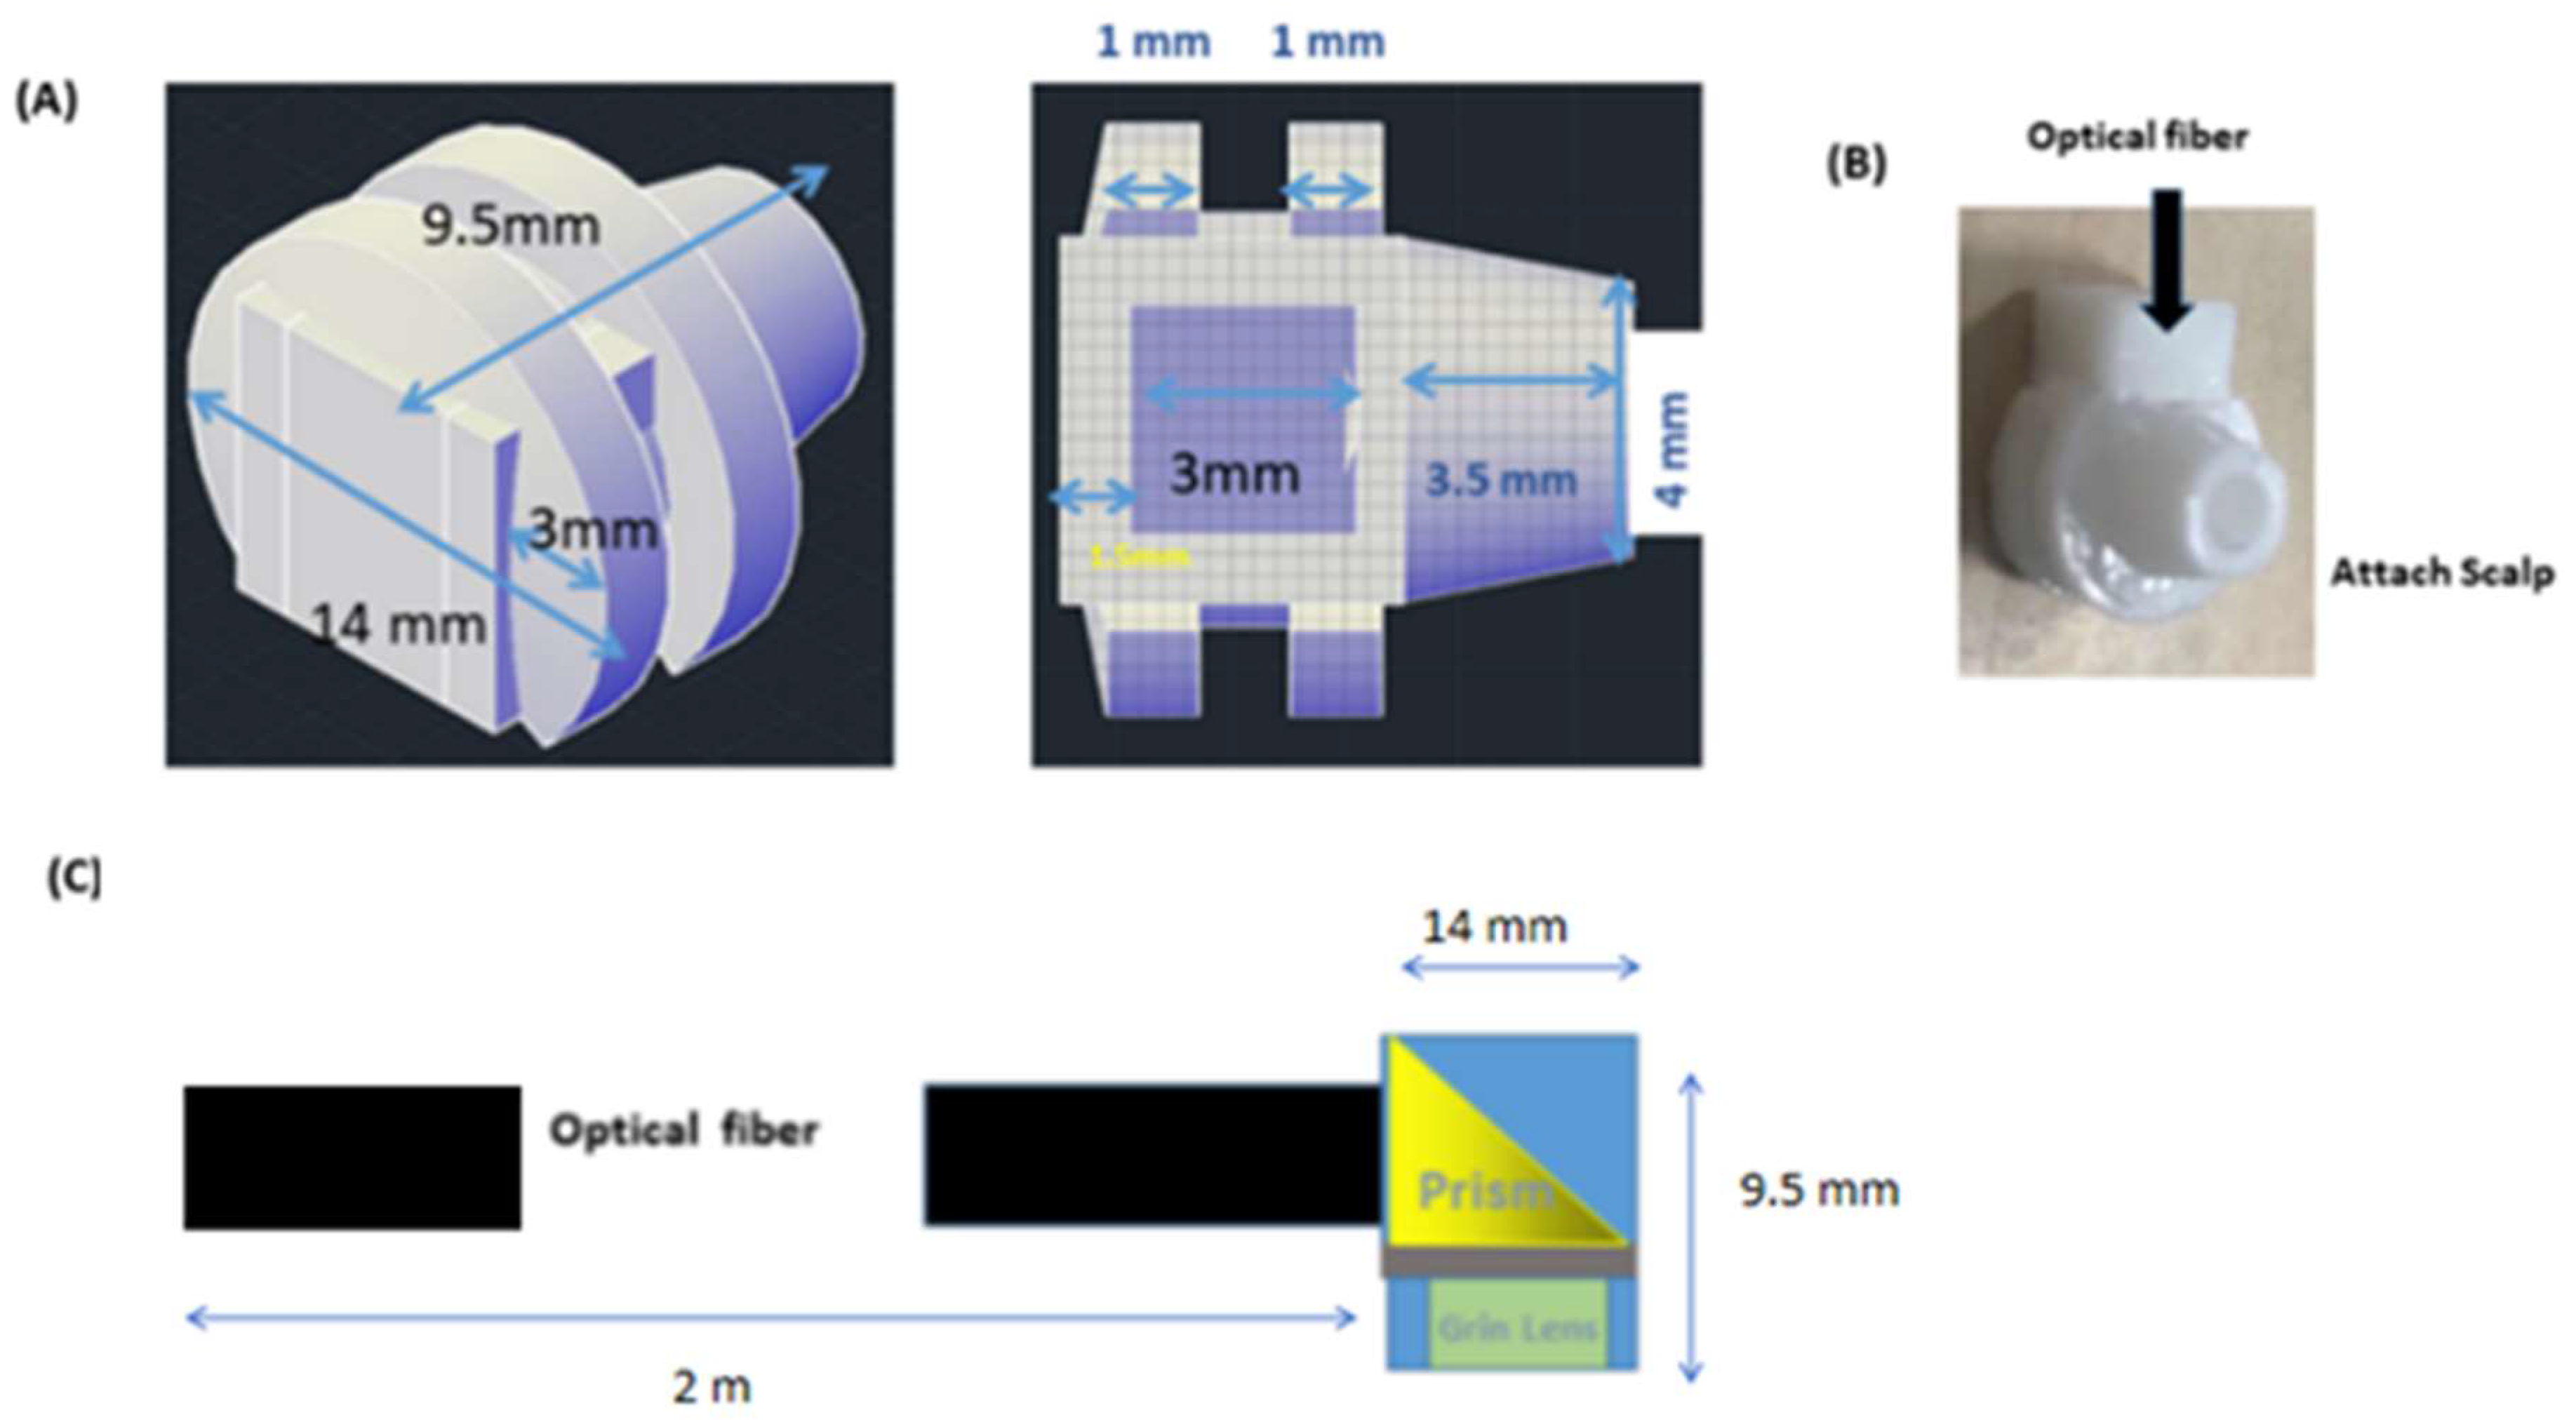
As Figure 4 shows, we designed an adapter with a prism and grin lens to reflect the optical path 90 degrees (Figure 4A). These adapters were placed and fixed onto the 3D-printed custom interface (Figure 4C). The newly designed interface was subsequently validated in a series of brain phantom experiments prior to usage in our study.

2.7. Phantom Experiments

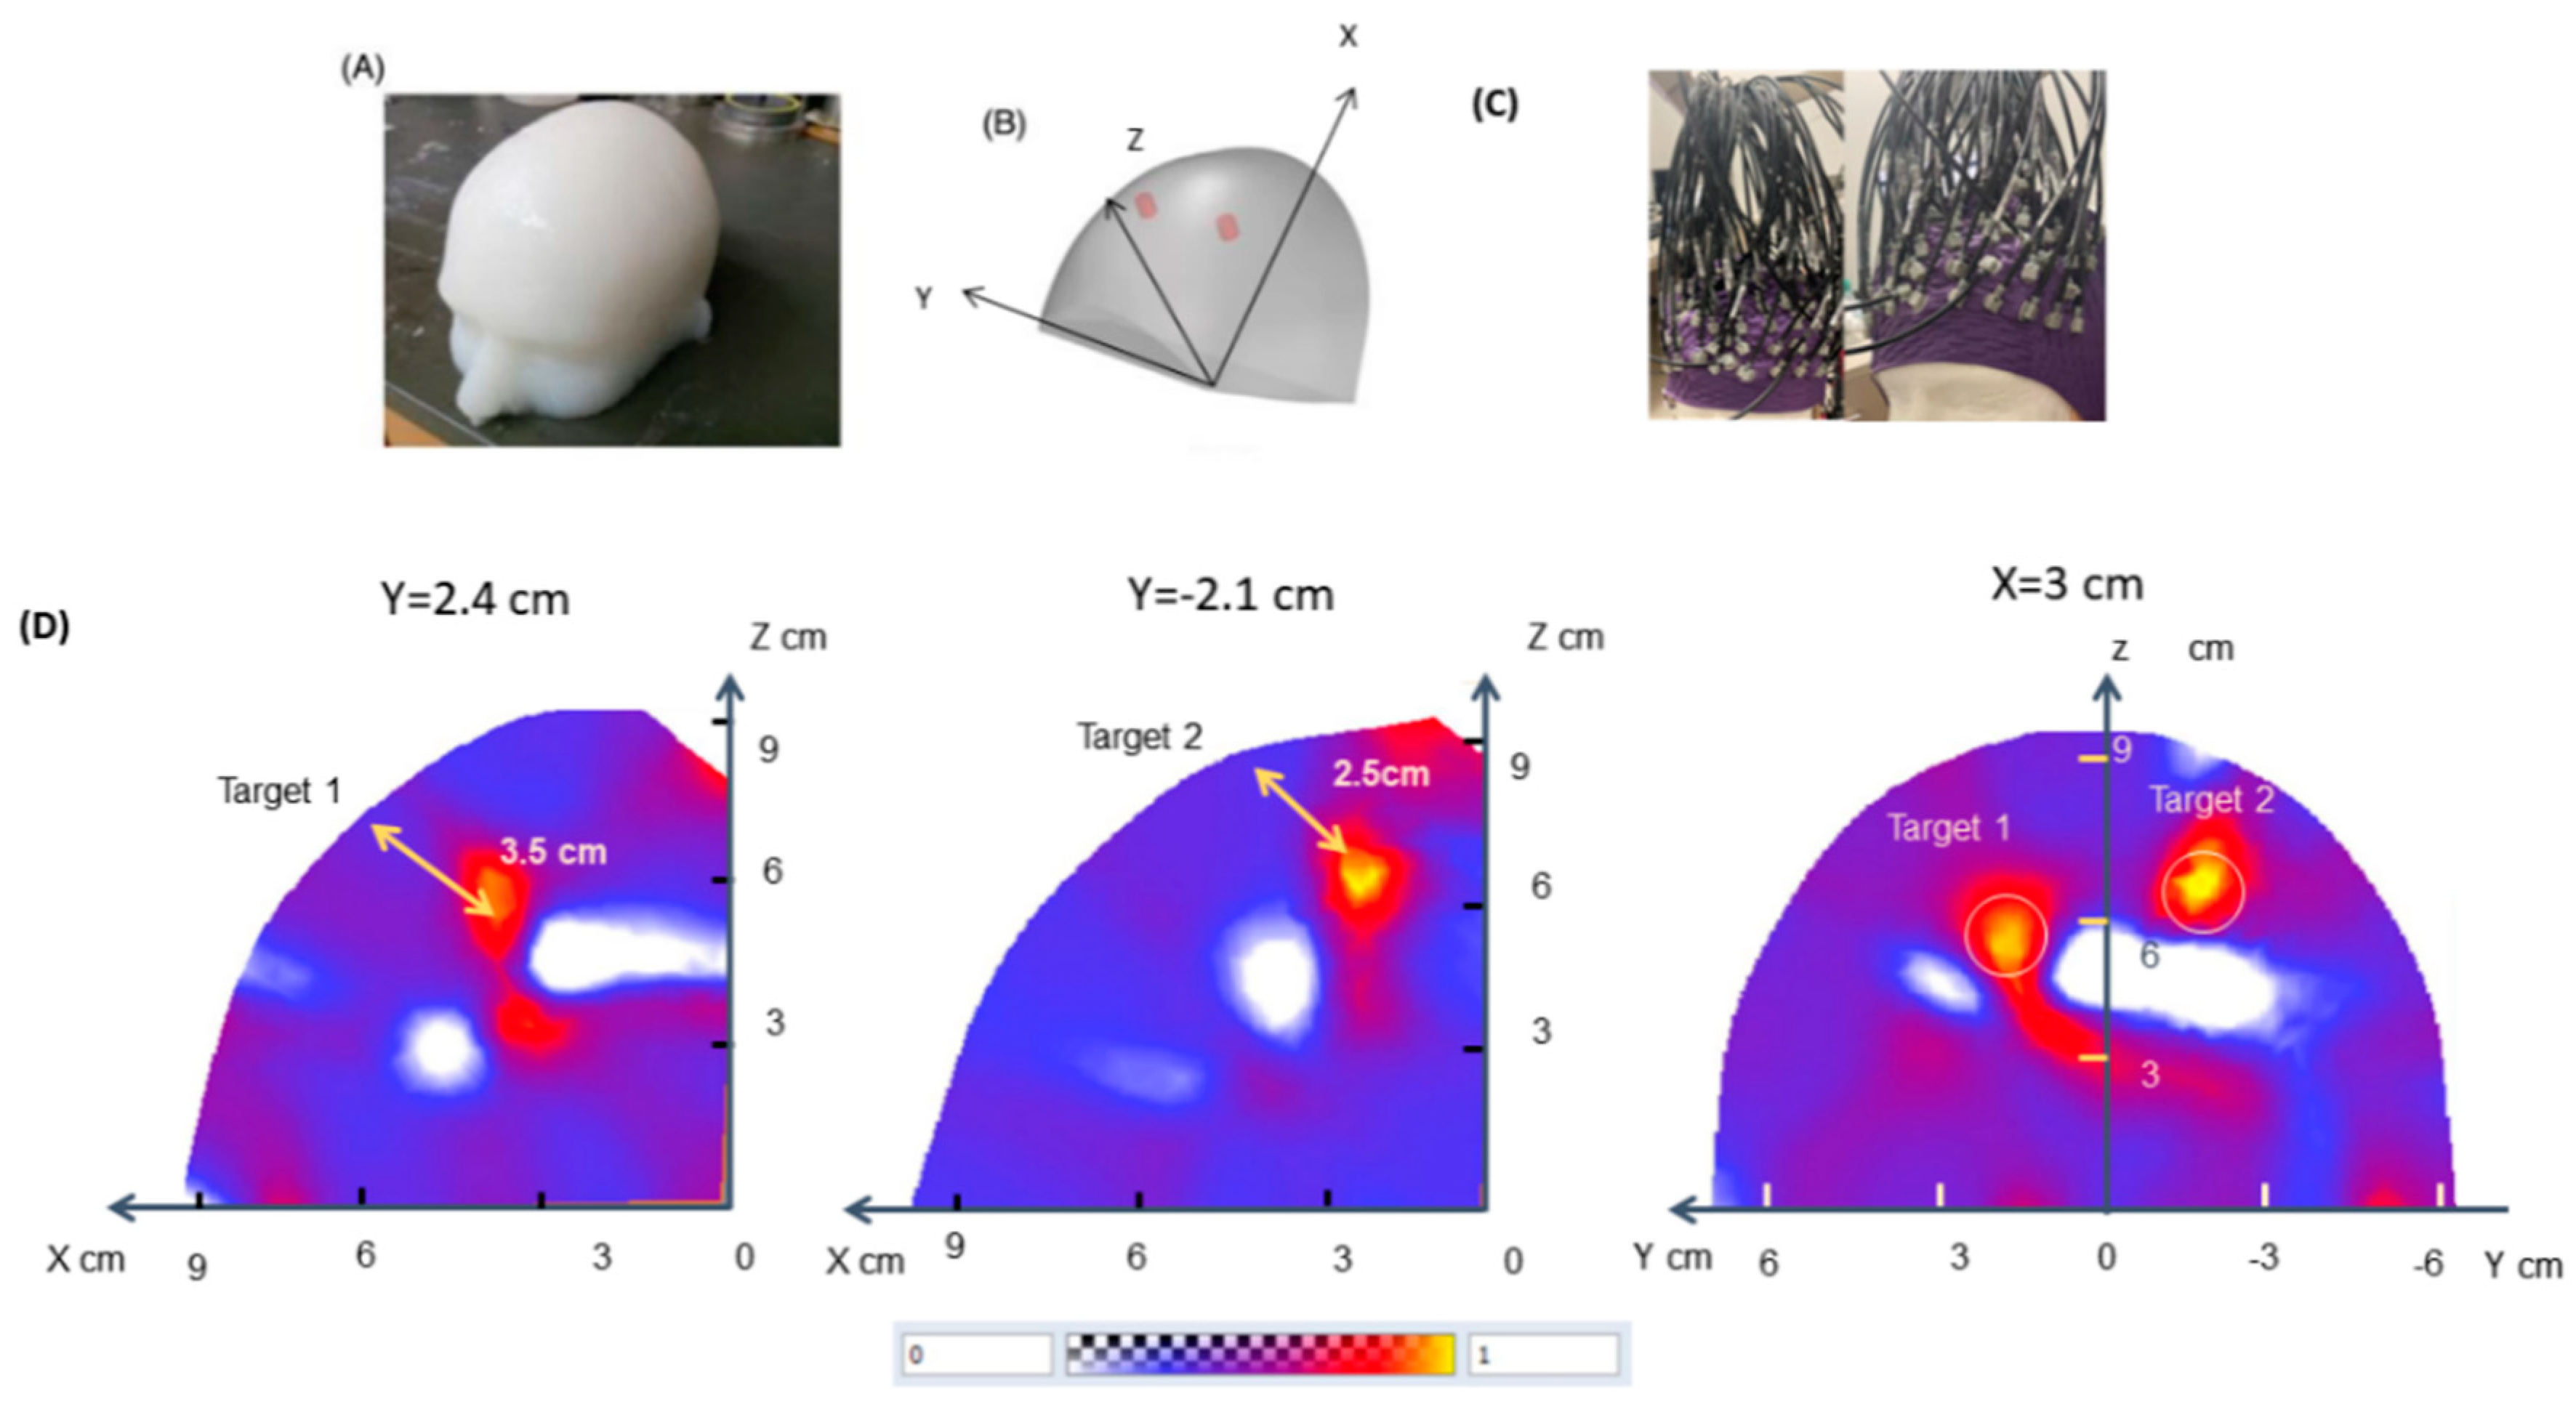
Before applying the new DOT system to our human study, we performed tissue-mimicking phantom experiments following the actual steps that would be taken in the subsequent human experiments (Figure 5). First, a head-shaped phantom was made using an adult head model. The tissue-mimicking phantom was made of TiO2 as the scatterer, India ink as the absorber, and 2% agar as the solidification material. Two cylindrical targets (radius = 5 mm and height = 5 mm) were placed in the homogeneous background with 0.016 mm−1 absorption coefficient and 1.2 mm−1 scattering coefficient. To demonstrate the depth-resolving capability of our system, two targets with two times higher absorption and scattering coefficients of the background were placed at the depth of 25 mm and 35 mm below the surface. The new head interface with adapter-connected fiber bundles was placed on the phantom. Positional information of the source-detector pairs was mimicked based on our human cortical regions of interest, and optical signals at 780 nm and 850 nm were recorded. Figure 5B shows the reconstructed absorption image at 780 nm, and the X and Y cut planes can be seen in Figure 5D for the two targets. Furthermore, in Figure 5D, the targets can clearly be detected and visualized, which displays the depth-solving ability of our new DOT system. A similar image quality was obtained at 850 nm, thus demonstrating our ability to localize targets with different optical properties at the appropriate depths.

2.8. DOT Image Reconstruction

A brief summary of DOT image reconstructions is provided. However, for full details, refs. [27,28] should be consulted as the complete principles are beyond the scope of this article. In DOT, the photon diffusion/transport model establishes a mathematical relationship between imaging parameters and observable/computable photon density, providing a manageable foundation for image reconstruction. The most commonly used wavelengths in DOT imaging for tissue excitation are in the NIR region, ranging from 700 nm to 900 nm, offering penetration depths extending to several centimeters. The model entails a partial differential or integral equation, necessitating numerical methods for solution. The photon diffusion equation (Equation (1)) combined with the Robin boundary condition (Equation (2)) are indispensable in the DOT image reconstruction algorithm. Φ ( r ) is the photon density; α is the coefficient related to internal reflection at the boundary; D r and μ α ( r ) are the diffusion and absorption coefficients, and S ( r ) is the source term.
· D r · Φ r μ α r Φ r = S ( r )
D r Φ n = α Φ
The diffusion coefficient D r can be defined as D r = 1 ( μ α r + μ s r ) , where μ s ( r ) is the reduced scattering coefficient.
The goal of the DOT reconstruction algorithm is to retrieve μ α ( r ) and μ s ( r ) values across all positions within the computational domain. This is accomplished using a regularized Newton’s method, iteratively updating an initial optical property distribution to minimize a weighted sum of squared differences between computed and measured optical data along the domain’s boundary. Additionally, a calibration method was implemented to mitigate errors arising from variations in source/detection intensities/positions and system hardware.

2.9. Recruitment

In this study, subjects were recruited at the Tampa General Hospital through collaboration with various medical and surgical teams. Eligibility criteria included patients aged 18 years or older and current admission at the hospital. Participants were screened by a consultation-liaison psychiatrist on the research team prior to enrollment to confirm that no delirium or significant cognitive impairment was present for consent purposes. Written informed consent was obtained by each subject prior to recruitment. Demographic data was collected from each participant. This study was approved by the University of South Florida Institutional Review Board. All research and methods were performed in accordance with relevant guidelines and regulations. Informed consent from subject participants to publish identifying images was obtained as well (Figure 1 and Figure 2).

2.10. Imaging Protocol

For image acquisition, the DOT probe was positioned over the bilateral prefrontal cortices. The environment was made as dim as tolerable for the subject in order to minimize light pollution. A resting-state scanning sequence was obtained for two minutes prior to the task and then two minutes post-task. Participants were asked to let their minds wander, avoid repetitive thoughts, keep their eyes open, and maintain their attention on a central fixation point. This was followed by a 60 s task-based imaging sequence where the subject was instructed to perform a Months Backwards Test (MBT). This was selected due to its well-validated status, rapid time to administer, and simplicity across various educational backgrounds. It is a test of attention, concentration, working memory, executive function, cognitive flexibility, and processing speed [29]. Reverse verbal tasks have previously been studied with fMRI and were used to robustly activate the bilateral prefrontal cortices [30]. For clinical purposes, the MBT has also been used to study cognitive function in Parkinson’s disease, dementia, delirium, and other neurocognitive disorders, particularly in the hospital [31,32,33]. As such, its flexibility was hypothesized to pair well with our portable DOT setup, given our regions of interest.

2.11. Image Analysis and Processing

Regions of interest were identified on an MRIcron ch2.nii.gz. MRI template. Montreal Neurological Institute (MNI) coordinates and a Cartesian three-dimensional system were used in combination with a 256-channel EEG system. The origin [0,0,0] was set at C18. The direction of the X, Y, and Z axes were defined as right to left, posterior to anterior, and inferior to superior. Data from each channel was processed and analyzed (one channel represents a single source-detector pair (48 channels in total). The raw data for each channel was inspected in order to exclude epochs with significant discontinuity. Only a few channels had epochs with inadequate measurements due to motion artifacts and were removed accordingly. A band pass filter (cut-off frequencies fH = 9 Hz, fL = 0.02 Hz) was employed to exclude instrumental noise and saturated signals. Skin pigmentation was accounted for based on inherent DOT algorithms and adjustment of signal output and interface settings to prevent data acquisition pollution. Data were averaged across the participant group, and resting time was used as a baseline for the task-based data collection. The data acquired at each wavelength were used to construct a three-dimensional image of the tissue absorption coefficient using the image reconstruction algorithm described above [28]. With the collection of the photon signals, the concentrations of oxy- and deoxy-hemoglobin ([HbO] and [Hb]) were calculated using the recovered absorption coefficients at both wavelengths based on the Beer–Lambert law [34]. With a least-square fitting procedure and pseudo-inverse matrix calculation, total hemoglobin concentration, [HbT], was calculated by summing up [HbO] and [Hb], which is proportional to cerebral blood volume [35]. After obtaining the relative hemoglobin response for each subject, those data sets were analyzed with paired Student’s t-test for comparison of means. The t-test evaluates the null hypothesis that regions in the brain have the same mean intensity values. All statistical analyses were performed at a significance level of 0.05. Subject means could vary around an individualized intercept across trials. Redundant analysis was conducted using repeated measures analysis of variance (ANOVA) to allow for an appropriate interpretation of the results.

2.12. Seed-Based Correlation Analysis

In general, the term “functional connectivity” indicates the similarity in patterns of brain activity between regions and represents the likelihood of neuronal communication within distinct regions [36]. Two regions are said to be functionally connected if the time series of their activity is highly correlated [37]. Seed-based Correlation Analysis (SCA) is one of the most common ways to explore such functional connectivity within the brain. Based on the time series of a seed voxel (or region of interest), connectivity is calculated as the correlation of time series to all other voxels in the brain [38]. The result of an SCA is a connectivity map showing the correlation for each voxel, indicating how well its time series correlates with the time series of the seed. SCA and other functional connectivity analyses are routinely employed in fMRI for numerous studies in aging, mild cognitive impairment, and various major neurocognitive disorders and dementias [39]. Within the field of optical imaging, only several fNIRS studies and a single DOT study previously reported have developed their own functional connectivity analyses, though not used in a clinically relevant population and with a limited number of channels compared to our interface [40,41,42].

2.13. Pearson Correlation Coefficient as a Measure of Connectivity

Pearson linear correlation coefficient (r) is a common correlation coefficient used within imaging analyses. It is a statistical measure of the degree to which variables change their values in relation to each other or, in other words, expresses the level to which two variables are linearly related [43]. It is defined as follows:
r x 1 , x 2 = n = 1 N ( x 1 , n x 1 ¯ ) ( x 2 , n * x 2 * ¯ ) n = 1 N ( x 1 , n x 1 ¯ ) 2 n = 1 N ( x 2 , n * x 2 * ¯ ) 2 ,
where N is the number of samples; x 1 and x 2 , are the series being analyzed; { . } ¯ represents mean values of the observed series, and { . } * is the complex conjugate operator (if the values in series are complex). The resulting r ranges from −1 (indicating perfect negative correlation) to +1 (indicating perfect positive correlation). A zero value is an indicator of no linear signal relationship.
With the formulation of the Pearson coefficient, the seed-based function connectivity between any voxel x 1 and seed voxel x 2 can be written as
C S B x 1 , x 2 = t = 1 T S x 1 , t   S ( x 2 , t ) t = 1 T S 2 ( x 1 , t ) t = 1 T S 2 ( x 2 , t ) ,
where S ( x , t ) is the demeaned hemoglobin signal from voxel x at t, and T is the number of time points in this experiment. The denominator of this equation is a normalization factor that can be ignored for the purpose of this theory [44]. For our seed-based correlation analysis method, all the time-series-related brain voxels were calculated and classified in our specified brain regions. A region of interest was distributed by the nominal voxel based on the 3D coordinate information specified in our protocol. Each nominal voxel dimension is 3 mm × 3 mm × 3 mm. The partial correlations from all partitions were calculated by the Pearson correlation analysis with time-series data during the experiment. This method guarantees that each single partition provides a complete set of partial correlations between the seed region and every voxel selected within the brain. The final output is a vector of group-level t-statistics for voxels in the brain, with the t-test representing the functional connectivity strength between the seed region and a voxel in the brain.

3. Results

3.1. Demographic Data

In this experiment, 18 subjects (9 male, 9 female) with a mean age of 61.5 ± 5.2 years were initially recruited. Two subjects were excluded due to significant motion artifacts that could not be rectified. One subject was excluded due to discharge from the hospital and inability to complete the scan. In total, 15 individuals (8 male, 7 female) with a mean age of 62.3 ± 6.7 years were included in our final analysis. All the participants were right-handed and had normal or corrected-to-normal vision. Subjects were mostly of Caucasian descent, with two males and one female who were African-American. Six subjects were in the intensive care unit (ICU) at the time of participation in our experiment, and nine subjects were in the general wards. The reason for the admission was noted to be heterogeneous. Education levels were documented as well: four of the males had a college education, while the other four completed high school; four of the females had a college education, and three completed high school.

3.2. Hemodynamic Responses and Image Reconstructions

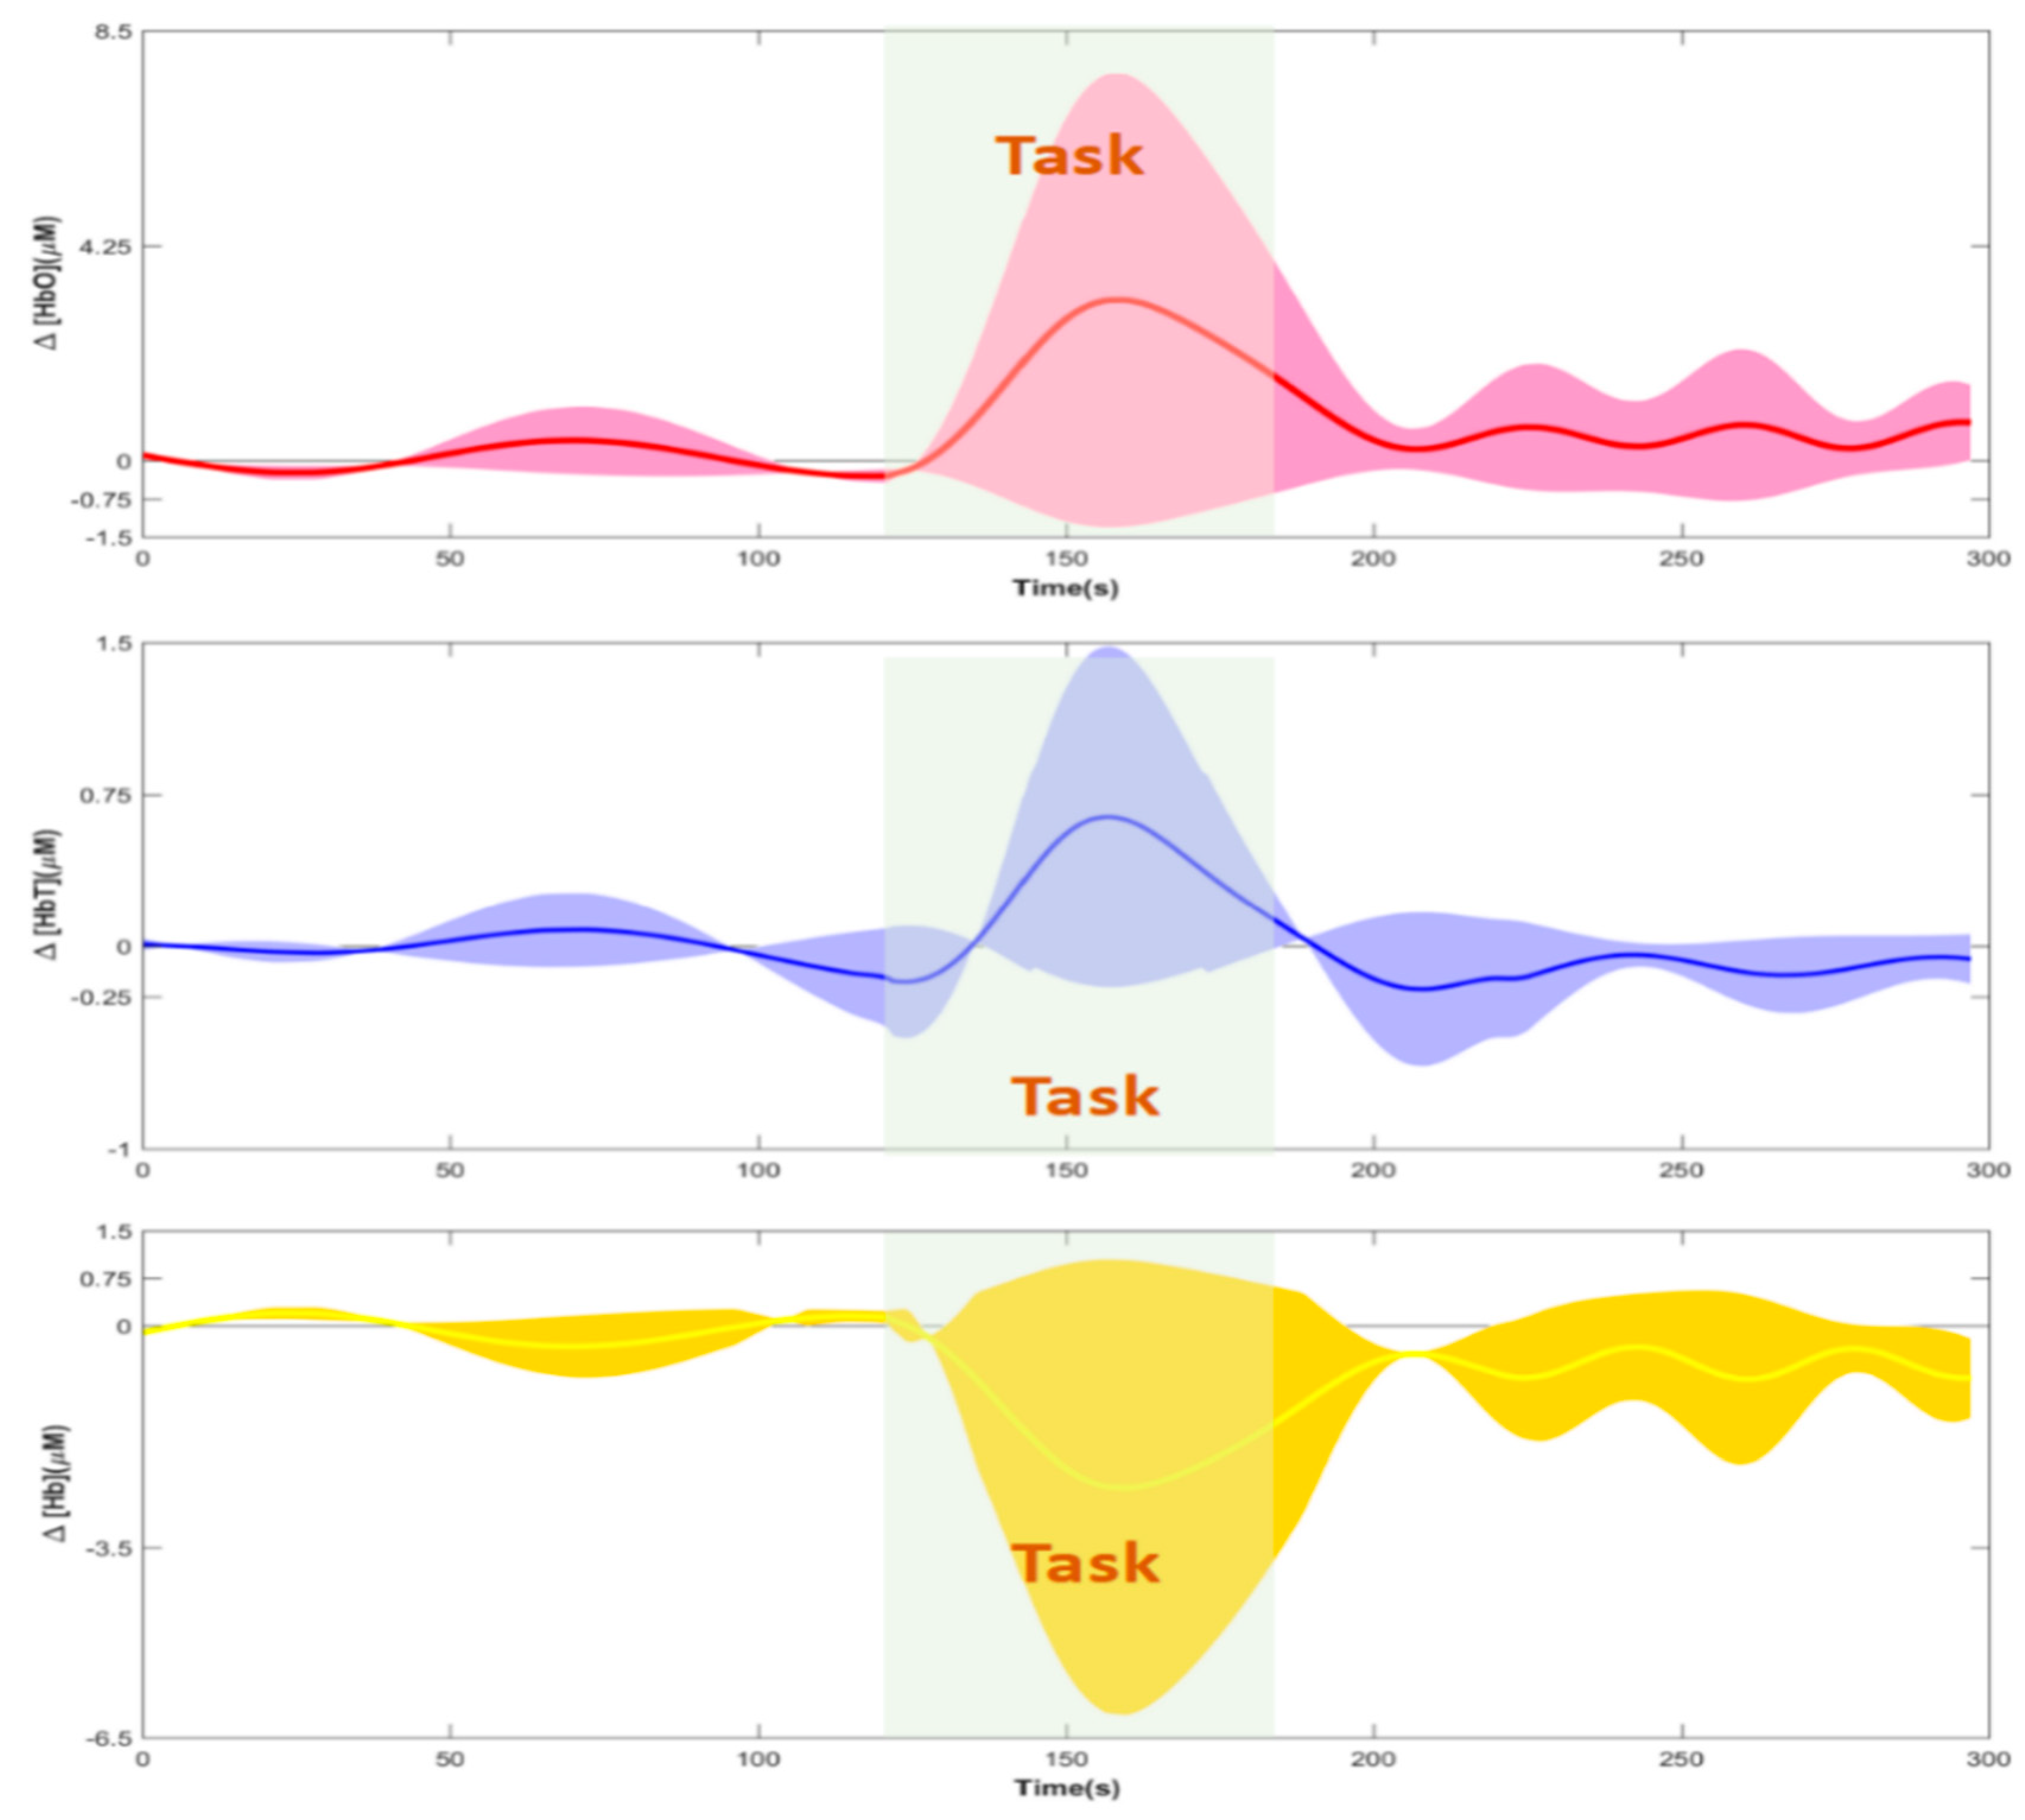
Hemodynamic activities were observed in the bilateral prefrontal cortices while participants were performing the MBT. Data for the experiment group are shown in Figure 6, indicating the changes in [HbT], [HbO], and [Hb] during the task. As illustrated, each trial generated a time-locked hemodynamic change reliably and accurately. In our study group, [HbO] and [HbT] began to increase sharply between 123-s to 125-s and peaked at 154-s (in reference to resting baseline). The peak value was calculated to be 3.36 µM and 0.74 µM for [HbO] and [HbT] (p < 0.042, [HbT]), respectively. The standard error was calculated to be 4.58 uM and 3.68 uM for [HbO] and [HbT]. [HbO] and [HbT] decreased sharply to the minimum level within 50 s after 154 s and returned to baseline in the next 10 s (p < 0.033, [HbT]). As for [Hb], it decreased sharply at 122 s point and reached a nadir at 156 s. The average value of change was calculated to be 2.62 µM (p < 0.04).
Three-dimensional image reconstructions were successfully captured in all our regions of interest within the bilateral dorsal prefrontal cortex. The most robust signal and volume change was detected in the left dorsolateral prefrontal cortex (DLPFC) during the task, which was expected given the reverse nature of the MBT. The right DLPFC and DMPFC were also reliably activated in all of our subjects as well. The averaged peak HbT across our regions of interest can be observed in Figure 7.

3.3. Seed-Based Correlation Analysis Results

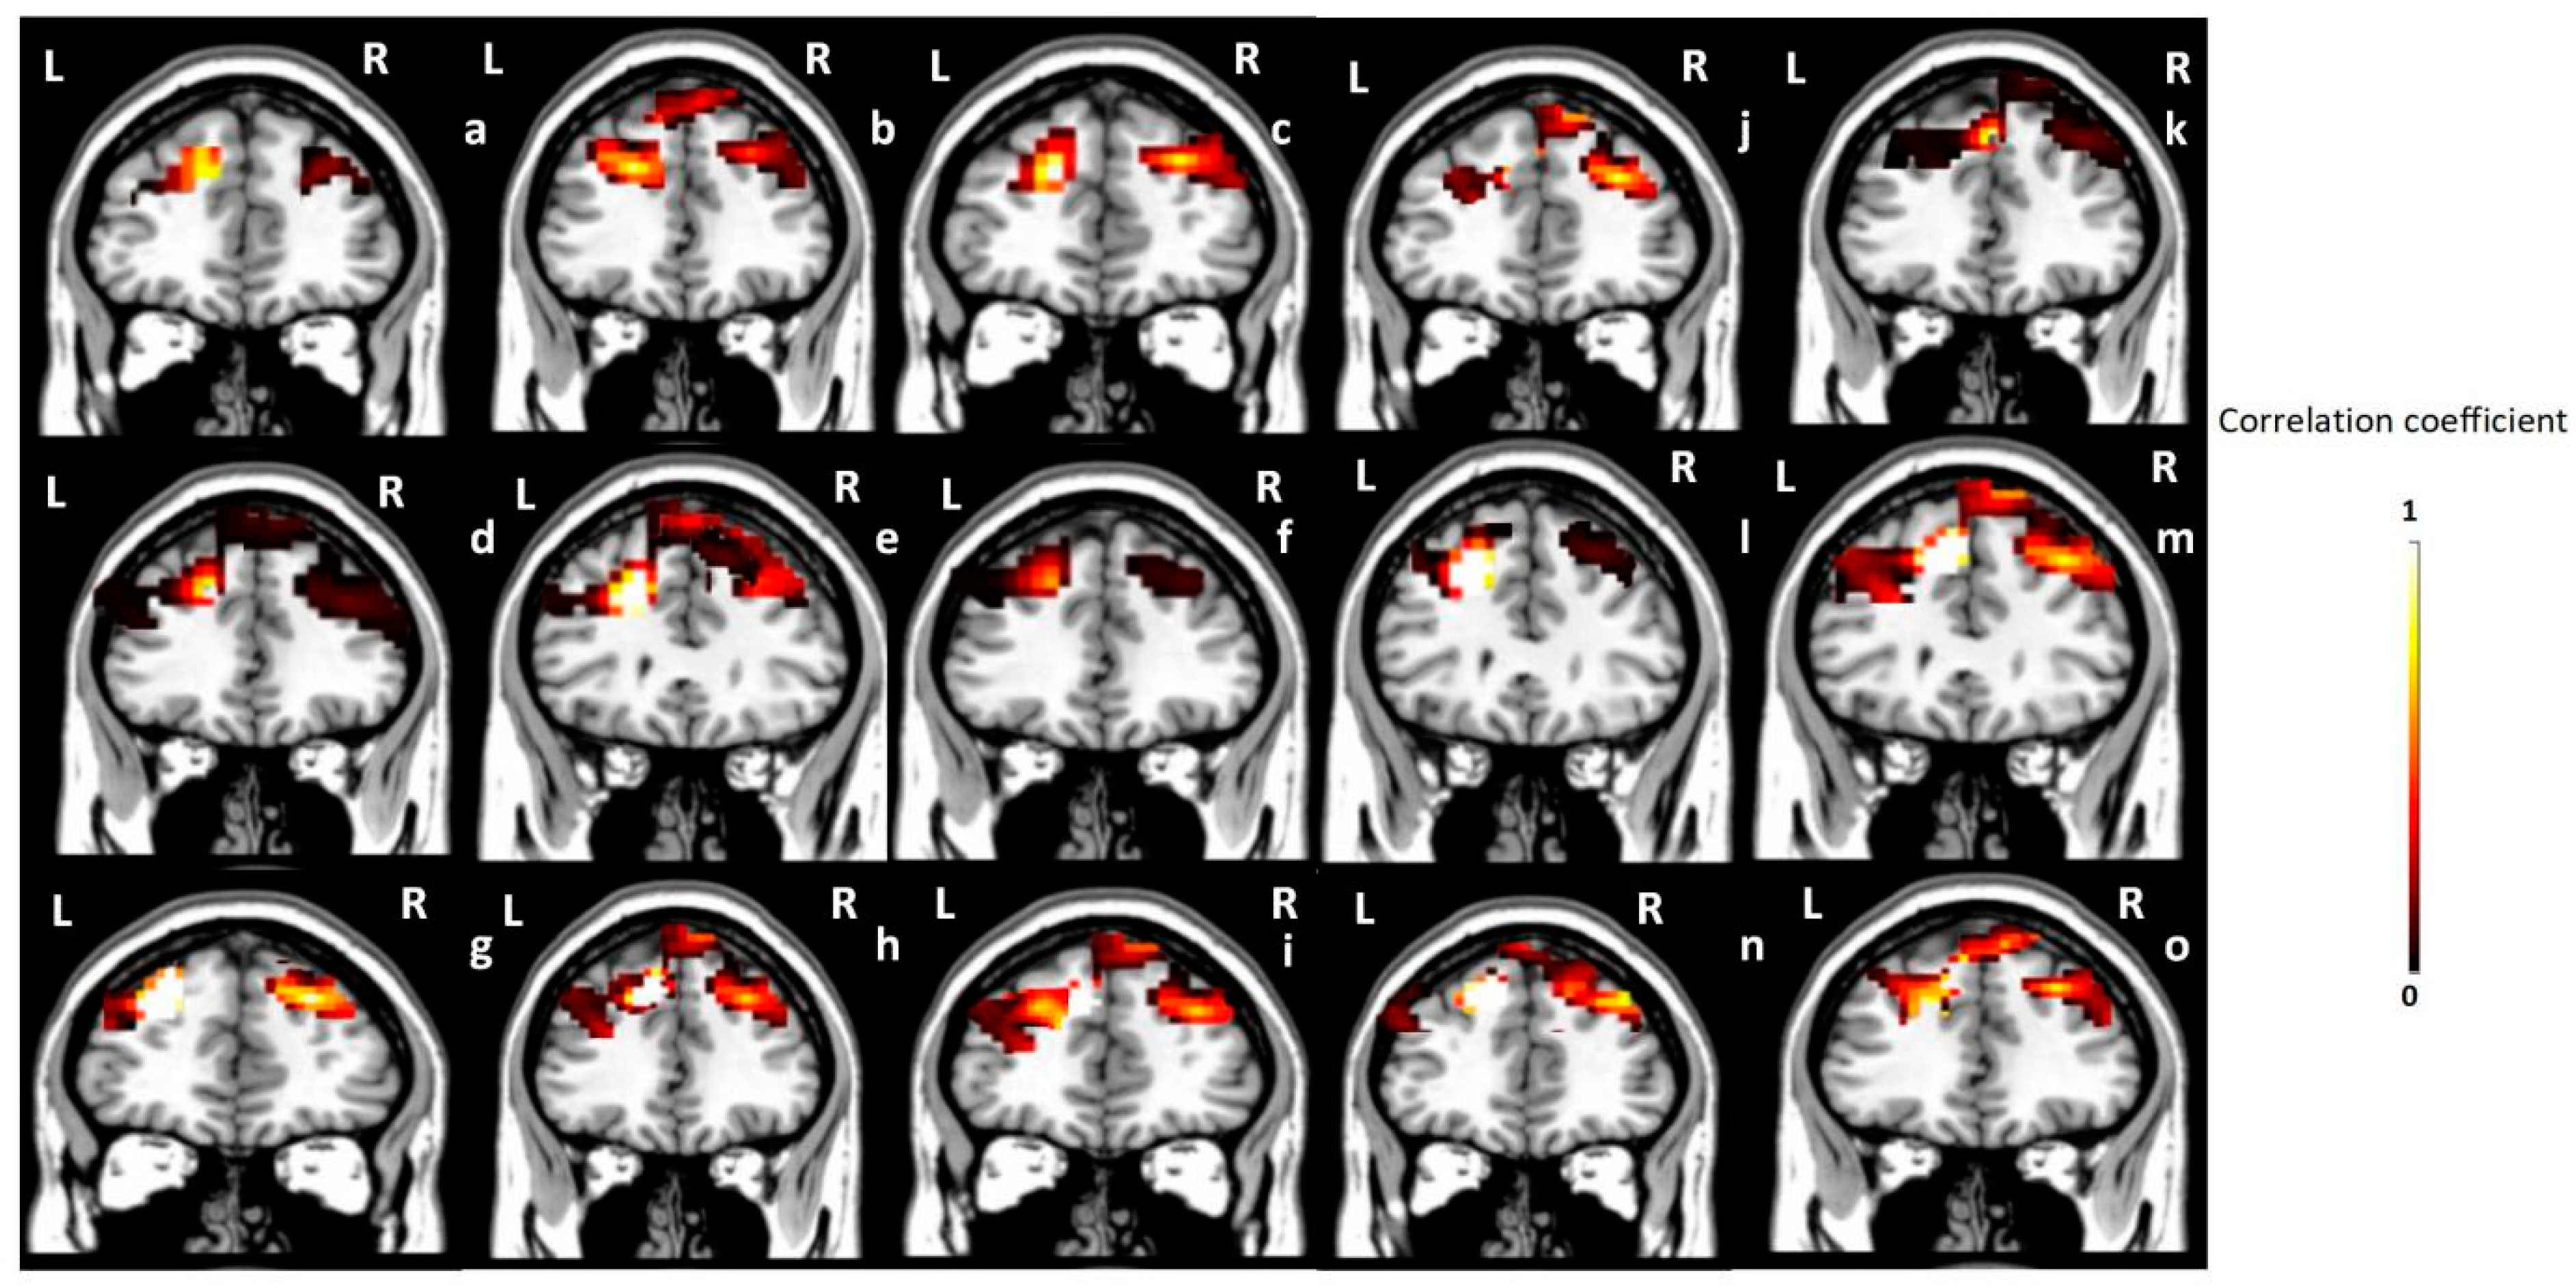
For our SCA (Figure 8), the left DLPFC was chosen as the seed region based on prior results published regarding regions activated during the MBT [22]. The peak HbT value was reliably captured and analyzed for this computation. The right DLPFC was found to be moderately associated with the left DLPFC in all of our subjects (r = 0.656). The DMPFC was observed to be associated with the left DLPFC, but less so (r = 0.273) at the group level. Overall, the contribution of left-to-right DLPFC connectivity was significantly higher than left DLPFC to DMPFC in our group (p = 0.012).

4. Discussion

To date, this is the first exploratory pilot study that demonstrates the feasibility of employing a portable DOT system in the hospital for functional neuroimaging of the brain in the acutely medically ill. Our task-based protocol demonstrates robust prefrontal cortical activation during the MBT that was quantified in all subjects. Three-dimensional images of high spatiotemporal resolution were also reliably produced and measured within our regions of interest. Moreover, we developed a DOT seed-based correlation analysis that could be applied to study functional connectivity within the brain portably as well. Presently, no previously published studies have combined the use of a task-based DOT approach in such a setting.
Functional neuroimaging offers valuable information for neuropsychiatric disorders and neurocognitive disorders. However, traditional techniques cannot be widely implemented due to the size and cost of each device. More portable devices, such as EEG and fNIRS, also lack spatial resolution or depth localizing capabilities; thus, their potential is more limited [40]. Given our novel design and flexible interface, DOT should be considered an attractive alternative for researchers in future endeavors within the hospital and even for multi-site clinic studies. Our sample size notably included ICU and general ward patients. For the ICU in particular, these patients are critically ill and often hemodynamically unstable. As such, they may be unable to tolerate significant movements (e.g., transporting a patient into a CT or MRI). The scanning duration and time away from the unit are other obstacles due to the continuous monitoring required by the ICU patients. Many of these patients already have arterial and intravenous lines, foley catheters, oropharyngeal tubes, and ventilators attached to them. Thus, the addition of a neuroimaging device is yet another potential discomfort, highlighting the necessity of a flexible bedside system such as ours.
Our hemoglobin analysis within our regions of interest in the prefrontal cortex revealed significant activation in the bilateral DLPFC and DMPFC during the MBT. This has previously been studied with fMRI and positron emission tomography (PET) experiments in which reverse processing tasks activated the DLPFC and medial gyri, along with other cortical structures [30,45]. Greater involvement of these more complex areas suggested that these regions were more susceptible to aging; thus, MBT has been widely studied in various neurocognitive and neuropsychiatric disorders [29]. Our results reliably corroborated these previous findings and demonstrated that DOT was able to capture similar three-dimensional functional data of high spatiotemporal resolution as well during this specific task. The prefrontal cortex, in particular, is a highly implicated region in many disorders and syndromes that are often first diagnosed in the hospital setting. These include delirium, dementia, traumatic brain injuries, and Parkinson’s disease [46,47,48,49]. Additionally, patients with these chronic neurocognitive disorders may present to the hospital in an acute worsening state that is out of the norm. As such, the ability to study these states lends further evidence for the need to not only focus on studying these patients in clinics, but also while they are hospitalized as well. Using neuroimaging to capture such data would be an effective method for comparing functional data during hospitalization and then post-hospitalization. This type of approach may elucidate the mechanisms or pathophysiology underlying these disorders. Moreover, only investigating them in a less acutely disturbed state may lead to incomplete conclusions. Furthermore, various clinical interventions are often performed while any of these patients with neuropsychiatric disorders are hospitalized; thus, having a readily available functional imaging tool for monitoring improvements and personalizing treatments according to objective data is another avenue to pursue.
In terms of our functional connectivity data and SCA, our results highlight the first study to incorporate a DOT functional connectivity analysis portably in a hospitalized sample with a task-based protocol. Previously, White et al. were the first to publish a resting state functional connectivity DOT approach with 24 sources and 28 detectors measuring response within specific regions of the visual and motor cortices. Their results were validated against fMRI and demonstrated a similar correlation analysis [42]. The novelty of our system involves a more mobile setup in addition to a wider array of source-detector pairs for imaging a larger brain region of interest. A stronger association between the left and the right DLPFCs during the MBT was observed compared to the association between the left DLPFC and the DMPFC. The connection between DLPFC regions is to be expected, as the MBT engages areas involved in attention, working memory, and executive function [29]. The DLPFC is the prime regulator of these core functions in the brain; thus, it has been known to activate the most during reverse tasks [50]. The DMPFC also plays an important role in attention, inhibitory control, and working memory [51]. However, compared to the DLPFC, it has an additional crucial function involved in emotional regulation and mentalization [52]. The MBT is unlikely to fully activate the DMPFC, given the characteristics of the task itself. Both regions are nonetheless highly implicated in many neuropsychiatric and neurocognitive disorders, as stated above, and therefore, the capability of our DOT system in capturing activation within these regions demonstrates the potential to use DOT to study these areas in many patient populations.
Though our results introduce a novel approach toward implementing DOT in clinical populations, several limitations must be acknowledged. This was a pilot study with heterogeneous and small sample size; thus, our results and analyses require validation with larger samples. Our study group included hospitalized medically ill patients; however, none had active neurocognitive impairment; thus, no comparison could be made regarding hemoglobin and functional connectivity results. DOT and our custom interface have several barriers that have to be considered. Movement artifacts and physiological signal contamination are technical limitations common to all optical imaging modalities. Although the movement artifact and physical restrictions are less than MRI or CT, appropriate filters and image processing still must be thoroughly conducted. The presence of excessive light in the room is also a restriction that has to be mitigated as much as possible in order to not interfere with DOT image acquisition. Notably, our interface involved the prefrontal cortex only; thus, our image analyses and SCA were restricted to this region. Future studies with entire hemispheric arrays should be investigated in order to advance our technology further.

5. Conclusions

In summary, this is the first study to demonstrate the capability of a portable DOT system for acquiring three-dimensional functional data in hospitalized, medically ill subjects. Moreover, we developed a functional connectivity analysis that can be applied to study the relationships between various regions of the brain, similar to fMRI and other more conventional techniques. Future studies should investigate the potential of such a DOT system in the investigation of acute neuropsychiatric and neurocognitive disorders within the hospital to study different types of mechanisms, pathophysiology, and interventions that occur acutely and can advance our knowledge of these disorders.

Author Contributions

S.J. and H.J. conceived and directed the presented study. S.J. and R.C. recruited and enrolled all subjects. J.H., H.Y. and H.J. constructed the imaging device in its entirety. Y.Y. assisted with protocol creation, neuropsychological test interpretations, and edits. S.J. and J.H. performed all imaging and statistical analyses. F.A.K. and H.J. were the main supervisors and assisted with final data analysis, study logistics, and manuscript writing. S.J. and J.H. were the primary writers of this manuscript, with supervision and guidance from the other co-authors. All authors have read and agreed to the published version of the manuscript.

Funding

This research received no external funding.

Institutional Review Board Statement

This study was approved by the University of South Florida Institutional Review Board (IRB #000832). All research and methods were performed in accordance with relevant guidelines and regulations.

Informed Consent Statement

Informed consent was obtained from all subjects involved in this study.

Data Availability Statement

The datasets used and/or analyzed during the current study are available from the corresponding author upon reasonable request.

Conflicts of Interest

None of the other authors listed have any competing interests, conflicts, or financial disclosures to report.

References

  1. Mukadam, N.; Sampson, E.L. A systematic review of the prevalence, associations and outcomes of dementia in older general hospital inpatients. Int. Psychogeriatr. 2011, 23, 344–355. [Google Scholar] [CrossRef]
  2. Vasilevskis, E.E.; Han, J.H.; Hughes, C.G.; Ely, E.W. Epidemiology and risk factors for delirium across hospital settings. Best Pract. Res. Clin. Anaesthesiol. 2012, 26, 277–287. [Google Scholar] [CrossRef]
  3. Rabinowitz, A.R.; Levin, H.S. Cognitive sequelae of traumatic brain injury. Psychiatr. Clin. N. Am. 2014, 37, 1–11. [Google Scholar] [CrossRef]
  4. Pandharipande, P.P.; Girard, T.D.; Ely, E.W. Long-term cognitive impairment after critical illness. N. Engl. J. Med. 2014, 370, 185–186. [Google Scholar] [CrossRef]
  5. Fogg, C.; Griffiths, P.; Meredith, P.; Bridges, J. Hospital outcomes of older people with cognitive impairment: An integrative review. Int. J. Geriatr. Psychiatry 2018, 33, 1177–1197. [Google Scholar] [CrossRef]
  6. Zhang, T.; Ren, Y.; Shen, P.; Jiang, S.; Yang, Y.; Wang, Y.; Li, Z.; Yang, Y. Prevalence and Associated Risk Factors of Cognitive Frailty: A Systematic Review and Meta-Analysis. Front. Aging Neurosci. 2022, 13, 755926. [Google Scholar] [CrossRef]
  7. Fong, T.G.; Davis, D.; Growdon, M.E.; Albuquerque, A.; Inouye, S.K. The interface between delirium and dementia in elderly adults. Lancet Neurol. 2015, 14, 823–832, Erratum in Lancet Neurol. 2015, 14, 788. [Google Scholar] [CrossRef]
  8. Howieson, D. Current limitations of neuropsychological tests and assessment procedures. Clin. Neuropsychol. 2019, 33, 200–208. [Google Scholar] [CrossRef]
  9. Helfand, B.K.I.; D’Aquila, M.L.; Tabloski, P.; Erickson, K.; Yue, J.; Fong, T.G.; Hshieh, T.T.; Metzger, E.D.; Schmitt, E.M.; Boudreaux, E.D.; et al. Detecting Delirium: A Systematic Review of Identification Instruments for Non-ICU Settings. J. Am. Geriatr. Soc. 2021, 69, 547–555. [Google Scholar] [CrossRef]
  10. Jones, R.N.; Cizginer, S.; Pavlech, L.; Albuquerque, A.; Daiello, L.A.; Dharmarajan, K.; Gleason, L.J.; Helfand, B.; Massimo, L.; Oh, E.; et al. Better Assessment of Illness (BASIL) Study Group. Assessment of Instruments for Measurement of Delirium Severity: A Systematic Review. JAMA Intern. Med. 2019, 179, 231–239. [Google Scholar] [CrossRef]
  11. Sheehan, B. Assessment scales in dementia. Ther. Adv. Neurol. Disord. 2012, 5, 349–358. [Google Scholar] [CrossRef]
  12. Wiegand, T.L.T.; Rémi, J.; Dimitriadis, K. Electroencephalography in delirium assessment: A scoping review. BMC Neurol. 2022, 22, 86. [Google Scholar] [CrossRef] [PubMed]
  13. Pauli, R.; O’Donnell, A.; Cruse, D. Resting-State Electroencephalography for Prognosis in Disorders of Consciousness Following Traumatic Brain Injury. Front. Neurol. 2020, 11, 586945. [Google Scholar] [CrossRef] [PubMed]
  14. Cassani, R.; Estarellas, M.; San-Martin, R.; Fraga, F.J.; Falk, T.H. Systematic Review on Resting-State EEG for Alzheimer’s Disease Diagnosis and Progression Assessment. Dis. Markers 2018, 2018, 5174815. [Google Scholar] [CrossRef] [PubMed]
  15. Deiner, S.; Luo, X.; Silverstein, J.H.; Sano, M. Can Intraoperative Processed EEG Predict Postoperative Cognitive Dysfunction in the Elderly? Clin. Ther. 2015, 37, 2700–2705. [Google Scholar] [CrossRef] [PubMed]
  16. Michel, C.M.; Brunet, D. EEG Source Imaging: A Practical Review of the Analysis Steps. Front. Neurol. 2019, 10, 325. [Google Scholar] [CrossRef] [PubMed]
  17. Elwell, C.E.; Cooper, C.E. Making light work: Illuminating the future of biomedical optics. Philos. Trans. R. Soc. A Math Phys. Eng. Sci. 2011, 369, 4358–4379. [Google Scholar] [CrossRef] [PubMed]
  18. Delpy, D.T.; Cope, M. Quantification in tissue near-infrared spectroscopy. Philos. Trans. R. Soc. B Biol. Sci. 1997, 352, 649–659. [Google Scholar] [CrossRef]
  19. Hoshi, Y.; Yamada, Y. Overview of diffuse optical tomography and its clinical applications. J. Biomed. Opt. 2016, 21, 091312. [Google Scholar] [CrossRef]
  20. Zhang, T.; Zhou, J.; Jiang, R.; Yang, H.; Carney, P.R.; Jiang, H. Pre-seizure state identified by diffuse optical tomography. Sci. Rep. 2014, 4, 3798. [Google Scholar] [CrossRef]
  21. Liang, X.; Zhang, Q.; Li, C.; Grobmyer, S.R.; Fajardo, L.L.; Jiang, H. Phase-contrast diffuse optical tomography pilot results in the breast. Acad. Radiol. 2008, 15, 859–866. [Google Scholar] [CrossRef]
  22. Yuan, Z.; Zhang, Q.; Sobel, E.S.; Jiang, H. Tomographic x-ray-guided three-dimensional diffuse optical tomography of osteoarthritis in the finger joints. J. Biomed. Opt. 2008, 13, 044006. [Google Scholar] [CrossRef]
  23. Zeff, B.W.; White, B.R.; Dehghani, H.; Schlaggar, B.L.; Culver, J.P. Retinotopic mapping of adult human visual cortex with high-density diffuse optical tomography. Proc. Natl. Acad. Sci. USA 2007, 104, 12169–12174. [Google Scholar] [CrossRef]
  24. Huang, J.; Jiang, S.; Wagoner, R.; Yang, H.; Currier, G.; Jiang, H. Three-dimensional optical imaging of brain activation during transcranial magnetic stimulation. J. X-ray Sci. Technol. 2021, 29, 891–902. [Google Scholar] [CrossRef] [PubMed]
  25. Jiang, S.; Huang, J.; Yang, H.; Wagoner, R.; Kozel, F.A.; Currier, G.; Jiang, H. Neuroimaging of depression with diffuse optical tomography during repetitive transcranial magnetic stimulation. Sci. Rep. 2021, 11, 7328. [Google Scholar] [CrossRef] [PubMed]
  26. Jiang, S.; Carpenter, L.L.; Jiang, H. Optical neuroimaging: Advancing transcranial magnetic stimulation treatments of psychiatric disorders. Vis. Comput. Ind. Biomed. Art 2022, 5, 22. [Google Scholar] [CrossRef] [PubMed]
  27. Dai, X.; Zhang, T.; Yang, H.; Tang, J.; Carney, P.R.; Jiang, H. Fast noninvasive functional diffuse optical tomography for brain imaging. J. Biophotonics 2017, 11, e201600267. [Google Scholar] [CrossRef]
  28. Jiang, H. Diffuse Optical Tomography: Principles and Applications, 1st ed.; CRC Press: Boca Raton, FL, USA, 2010. [Google Scholar]
  29. Meagher, J.; Leonard, M.; Donoghue, L.; O’regan, N.; Timmons, S.; Exton, C.; Cullen, W.; Dunne, C.; Adamis, D.; Maclullich, A.J.; et al. Months backward test: A review of its use in clinical studies. World J. Psychiatry 2015, 5, 305–314. [Google Scholar] [CrossRef] [PubMed]
  30. Wildgruber, D.; Kischka, U.; Ackermann, H.; Klose, U.; Grodd, W. Dynamic pattern of brain activation during sequencing of word strings evaluated by fMRI. Brain Res. Cogn. Brain Res. 1999, 7, 285–294. [Google Scholar] [CrossRef]
  31. Marinus, J.; Visser, M.; Verwey, N.A.; Verhey, F.R.; Middelkoop, H.A.; Stiggelbout, A.M.; van Hilten, J.J. Assessment of cognition in Parkinson’s disease. Neurology 2003, 61, 1222–1228. [Google Scholar] [CrossRef] [PubMed]
  32. Tardiff, M.; Roy, M.; Remi, B.; Laforce, R. Months backward test as a reliable predictor of cognitive decline in mild Alzheimer’s disease. Alzheimer’s Dement. 2013, 9, S741–S742. [Google Scholar] [CrossRef]
  33. Bellelli, G.; Morandi, A.; Davis, D.H.; Mazzola, P.; Turco, R.; Gentile, S.; Ryan, T.; Cash, H.; Guerini, F.; Torpilliesi, T.; et al. Validation of the 4AT, a new instrument for rapid delirium screening: A study in 234 hospitalised older people. Age Ageing 2014, 43, 496–502, Erratum in Age Ageing 2015, 44, 175. [Google Scholar] [CrossRef] [PubMed]
  34. Bluestone, A.Y.; Stewart, M.; Lasker, J.; Abdoulaev, G.S.; Hielscher, A.H. Three-dimensional optical tomographic brain imaging in small animals, part 1: Hypercapnia. J. Biomed. Opt. 2004, 9, 1046–1062. [Google Scholar] [CrossRef] [PubMed]
  35. Gagnon, L.; Yücel, M.A.; Dehaes, M.; Cooper, R.J.; Perdue, K.L.; Selb, J.; Boas, D.A. Quantification of the cortical contribution to the NIRS signal over the motor cortex using concurrent NIRS-fMRI measurements. Neuroimage 2012, 59, 3933–3940. [Google Scholar] [CrossRef]
  36. Turnbull, L.; Hütt, M.-T.; Ioannides, A.A.; Kininmonth, S.; Poeppl, R.; Tockner, K.; Bracken, L.J.; Keesstra, S.; Liu, L.; Masselink, R.; et al. Connectivity and complex systems: Learning from a multi-disciplinary perspective. Appl. Netw. Sci. 2018, 3, 11. [Google Scholar] [CrossRef] [PubMed]
  37. Lim, S.; Radicchi, F.; van den Heuvel, M.P.; Sporns, O. Discordant attributes of structural and functional brain connectivity in a two-layer multiplex network. Sci. Rep. 2019, 9, 2885. [Google Scholar] [CrossRef]
  38. Wu, L.; Caprihan, A.; Bustillo, J.; Mayer, A.; Calhoun, V. An approach to directly link ICA and seed-based functional connectivity: Application to schizophrenia. Neuroimage 2018, 179, 448–470. [Google Scholar] [CrossRef]
  39. Dennis, E.L.; Thompson, P.M. Functional brain connectivity using fMRI in aging and Alzheimer’s disease. Neuropsychol. Rev. 2014, 24, 49–62. [Google Scholar] [CrossRef]
  40. Lu, C.M.; Zhang, Y.J.; Biswal, B.B.; Zang, Y.F.; Peng, D.L.; Zhu, C.Z. Use of fNIRS to assess resting state functional connectivity. J. Neurosci. Methods 2010, 186, 242–249. [Google Scholar] [CrossRef]
  41. Zhang, H.; Zhang, Y.J.; Lu, C.M.; Ma, S.Y.; Zang, Y.F.; Zhu, C.Z. Functional connectivity as revealed by independent component analysis of resting-state fNIRS measurements. Neuroimage 2010, 51, 1150–1161. [Google Scholar] [CrossRef]
  42. White, B.R.; Snyder, A.Z.; Cohen, A.L.; Petersen, S.E.; Raichle, M.E.; Schlaggar, B.L.; Culver, J.P. Resting-state functional connectivity in the human brain revealed with diffuse optical tomography. Neuroimage 2009, 47, 148–156. [Google Scholar] [CrossRef]
  43. Šverko, Z.; Vrankić, M.; Vlahinić, S.; Rogelj, P. Complex Pearson Correlation Coefficient for EEG Connectivity Analysis. Sensors 2022, 22, 1477. [Google Scholar] [CrossRef] [PubMed]
  44. Joel, S.E.; Caffo, B.S.; van Zijl, P.C.; Pekar, J.J. On the relationship between seed-based and ICA-based measures of functional connectivity. Magn. Reson. Med. 2011, 66, 644–657. [Google Scholar] [CrossRef] [PubMed]
  45. Gerton, B.K.; Brown, T.T.; Meyer-Lindenberg, A.; Kohn, P.; Holt, J.L.; Olsen, R.K.; Berman, K.F. Shared and distinct neurophysiological components of the digits forward and backward tasks as revealed by functional neuroimaging. Neuropsychologia 2004, 42, 1781–1787. [Google Scholar] [CrossRef] [PubMed]
  46. Friedman, N.P.; Robbins, T.W. The role of prefrontal cortex in cognitive control and executive function. Neuropsychopharmacology 2022, 47, 72–89. [Google Scholar] [CrossRef] [PubMed]
  47. Smith, C.J.; Xiong, G.; Elkind, J.A.; Putnam, B.; Cohen, A.S. Brain Injury Impairs Working Memory and Prefrontal Circuit Function. Front. Neurol. 2015, 6, 240. [Google Scholar] [CrossRef] [PubMed]
  48. Haggstrom, L.; Welschinger, R.; Caplan, G.A. Functional neuroimaging offers insights into delirium pathophysiology: A systematic review. Australas. J. Ageing 2017, 36, 186–192. [Google Scholar] [CrossRef] [PubMed]
  49. Chen, Y.; Dang, M.; Zhang, Z. Brain mechanisms underlying neuropsychiatric symptoms in Alzheimer’s disease: A systematic review of symptom-general and -specific lesion patterns. Mol. Neurodegener. 2021, 16, 38. [Google Scholar] [CrossRef] [PubMed]
  50. Barbey, A.K.; Koenigs, M.; Grafman, J. Dorsolateral prefrontal contributions to human working memory. Cortex 2013, 49, 1195–1205. [Google Scholar] [CrossRef]
  51. Jobson, D.D.; Hase, Y.; Clarkson, A.N.; Kalaria, R.N. The role of the medial prefrontal cortex in cognition, ageing and dementia. Brain Commun. 2021, 3, fcab125. [Google Scholar] [CrossRef]
  52. Ford, J.H.; Kensinger, E.A. Older adults recruit dorsomedial prefrontal cortex to decrease negativity during retrieval of emotionally complex real-world events. Neuropsychologia 2019, 135, 107239. [Google Scholar] [CrossRef] [PubMed]
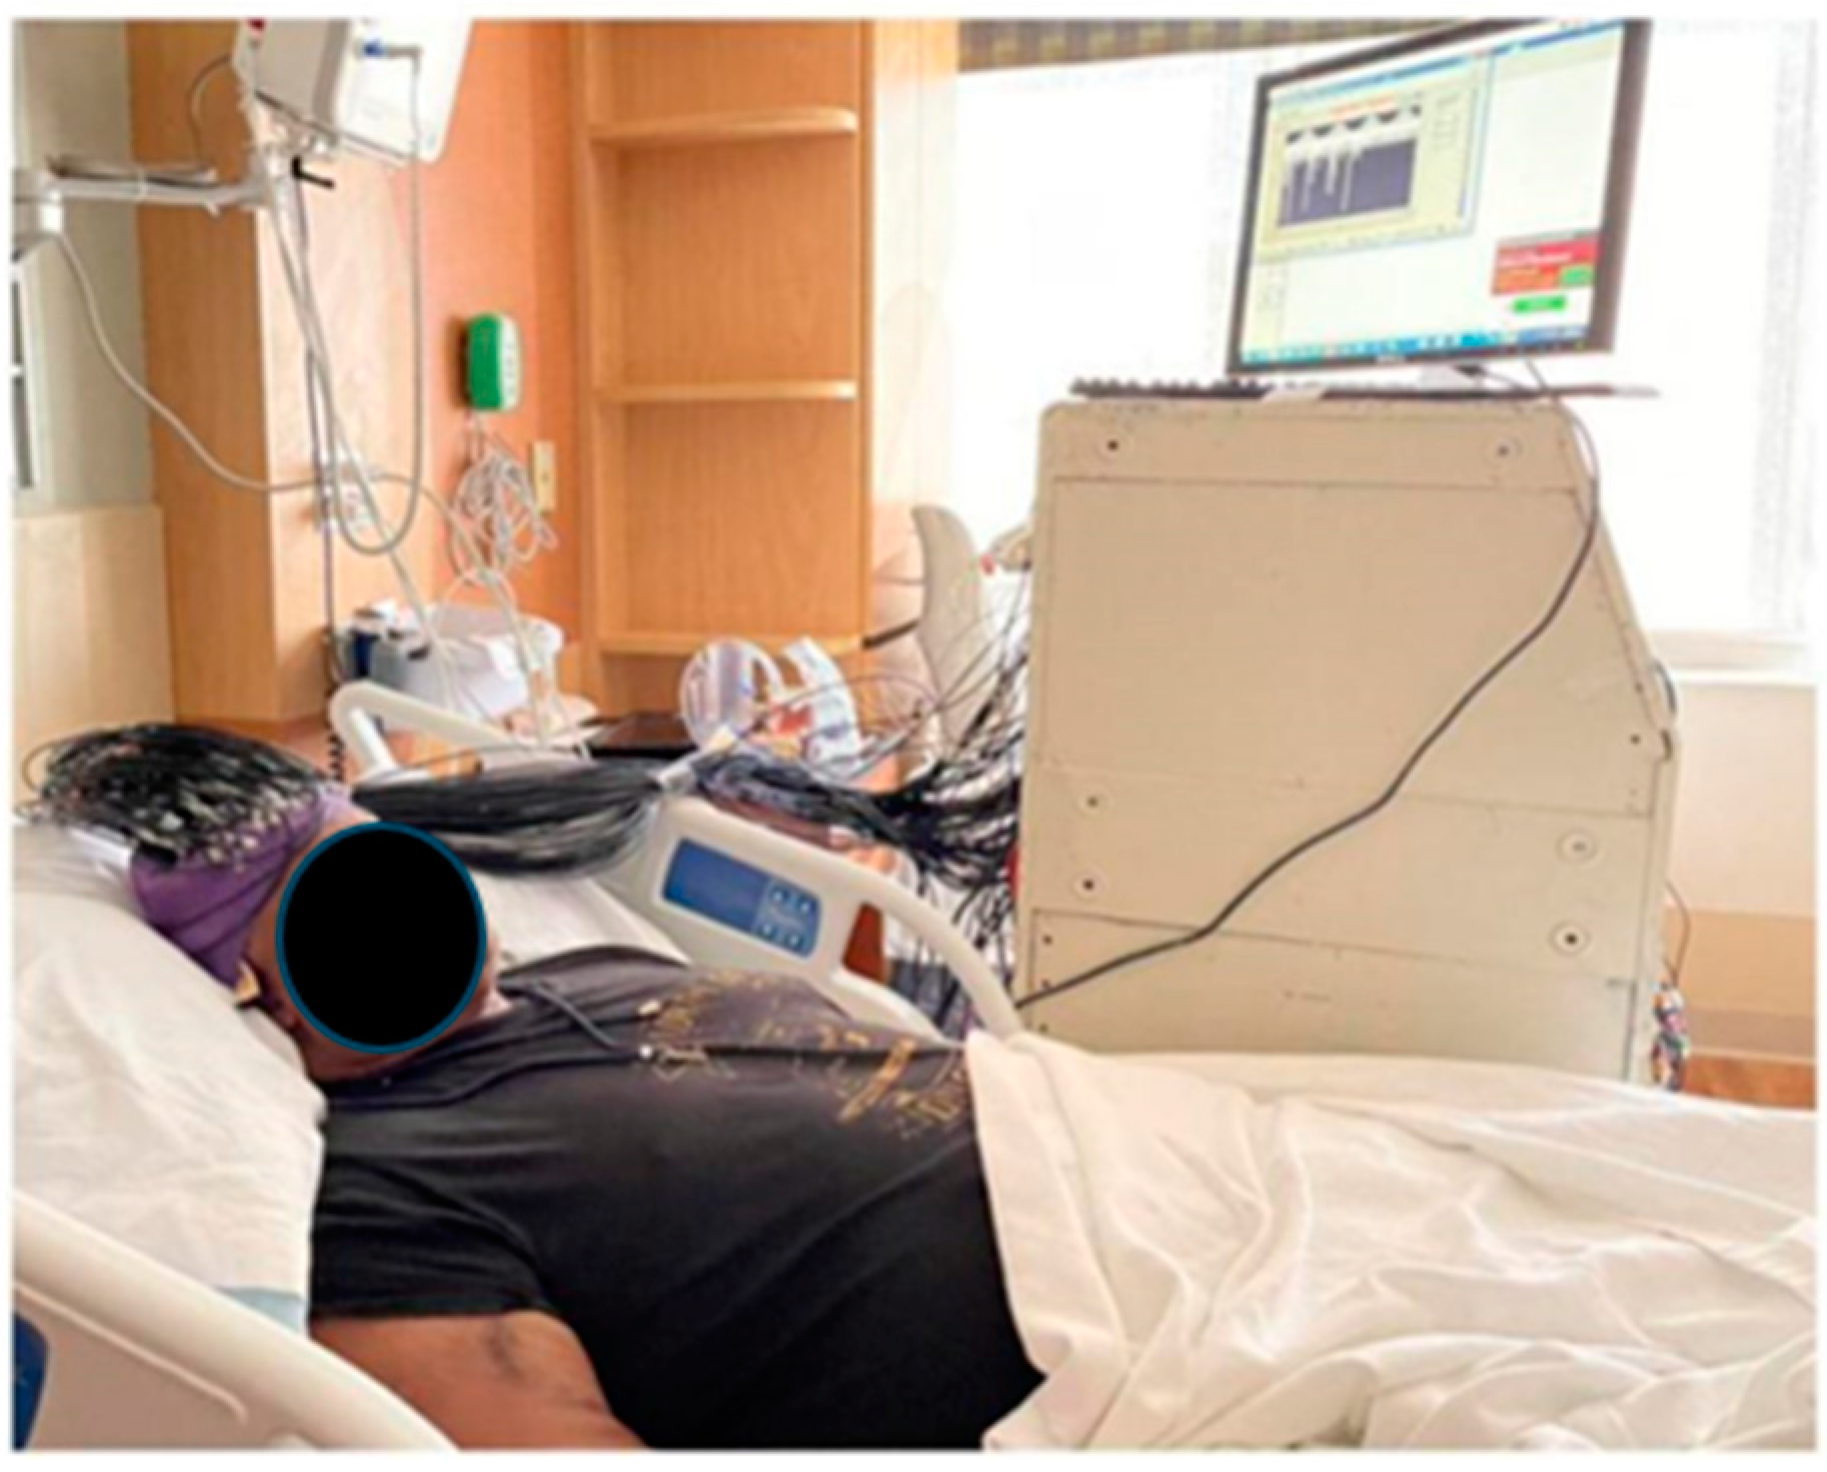
Figure 1. Example of DOT imaging data acquisition in the hospital environment.
Photonics 11 00238 g001
Figure 2. Schematic of DOT imaging system. (A) Example of head interface on a subject. (B) A total of 48 source-detector pairs were placed on the bilateral prefrontal cortices. DAQ = data acquisition system; LED = light emitting diode; FPGA = field-programmable gate array.
Photonics 11 00238 g002
Figure 3. Partial transformed mesh with registered sources and detectors. (A) Partially transformed mesh from the head atlas. (B) 3D location of 48 source-detector pairs. (C) Projection of 48 pairs of source and detector on the transformed mesh.
Photonics 11 00238 g003
Figure 4. Adapter design and interface fiber with optode. (A) Sketch of adapter designed by AutoCAD. (B) Sample of 3D-printed adapter. (C) Sketch of prism and grin lens position along with photograph of adapter connected with interface and fiber. All units are designated as millimeters (mm).
Photonics 11 00238 g004
Figure 5. Brain phantom experiment. (A) Tissue-mimicking head-shape phantom. (B) Actual target positions. (C) Phantom and head interface/fiber bundles. (D) Reconstructed absorption image at 780 nm for different cut planes. Normalization was conducted to represent relative change, with parameters set in units of cm−1.
Photonics 11 00238 g005
Figure 6. Hemoglobin analyses for the study group (n = 15). Averaged time course of oxygenated [HbO; red], total [HbT; blue], and deoxygenated [Hb; yellow] hemoglobin signals in the study group for the bilateral prefrontal cortices. The X-axis represents the time from 0 to 300 s, and the Y-axis represents the mean and standard deviation for relative hemoglobin concentration in µM/L. The Months Backward Test task-based sequence began at 120 s and ended at 180 s.
Photonics 11 00238 g006
Figure 7. Image reconstruction for group subjects (ao) at the time of peak HbT within the bilateral prefrontal cortices during the Months Backwards Test (n = 15). Units are represented as μM/L.
Photonics 11 00238 g007
Figure 8. Seed-based correlation analysis of the bilateral prefrontal cortex for subjects (ao) at time of peak HbT during the Months Backwards Test (n = 15).
Photonics 11 00238 g008
Disclaimer/Publisher’s Note: The statements, opinions and data contained in all publications are solely those of the individual author(s) and contributor(s) and not of MDPI and/or the editor(s). MDPI and/or the editor(s) disclaim responsibility for any injury to people or property resulting from any ideas, methods, instructions or products referred to in the content.