Article

Microwave Photonics Broadband Doppler Velocity Simulator with High Spurious Suppression Ratio by Using Serrodyne Modulation

1
School of Physics and Optoelectronic Engineering, Beijing University of Technology, Beijing 100124, China
2
Beijing Engineering Research Center of Precision Measurement Technology and Instruments, Beijing University of Technology, Beijing 100124, China
3
Henan Institute of Metrology, Zhengzhou 450000, China
*
Author to whom correspondence should be addressed.
Photonics 2024, 11(4), 357; https://doi.org/10.3390/photonics11040357
Submission received: 7 March 2024 / Revised: 4 April 2024 / Accepted: 7 April 2024 / Published: 12 April 2024
(This article belongs to the Section Optoelectronics and Optical Materials)

Abstract

:
A Doppler velocity simulation method based on serrodyne modulation is proposed to achieve the frequency shift from hundred hertz to megahertz. One sub-phase modulation (PM) in a dual-parallel dual-drive Mach–Zehnder modulator loads a sawtooth signal to achieve a small frequency shift of the optical carrier. The other three sub-PMs implement carrier-suppressed double-band modulation of the RF signal. The RF signal is directly coupled from the receiving antenna to the modulator’s RF port without any electrical devices like a 90° hybrid, which ensures a broad operational bandwidth of the system. After filtering out one of the RF modulation sidebands by an optical filter, Doppler frequency shifting (DFS) is realized through frequency beating. The half-wave voltage of modulators rapidly decreases at low frequency shifts, leading to an increase in spurious signals. In order to improve the spurious suppression ratio (SSR) of DFS, a digital pre-distortion compensation based on the measured half-wave voltage is implemented in the frequency domain. Experimental results show that SSRs are larger than 35 dB when frequency shifts range from 0.1 kHz to 1 MHz. The RF operation bandwidth covers 2–40 GHz. The effectiveness of a Doppler velocity simulator is evaluated, and the simulation velocity error is less than 0.06 km/h. The proposed method has potential applications in both broadband electronic warfare and traffic metering applications.

1. Introduction

Microwave radar can not only measure the distance of a target, but can also measure the velocity of the target by the Doppler effect, which has the advantages of all-weather, long-distance, and strong adaptability functionality. Doppler velocity simulators (DVSs) make a small frequency shift to the radar detection signal, leading to the change in Doppler frequency deviation, so the effect of radar deception jamming can be achieved. A motor vehicle radar velocimeter needs to be checked and calibrated regularly using the DVSs [1,2]. In electronic warfare, a DVS, as an important approach to radar jamming, is applied to disturb the velocity measurements of enemy radar. Conventional DVSs are based on tuning forks [3], electrical mixers [3], electrical serrodyne modulation [4], and digital radio frequency memory (DRFM) [5,6]. Among them, the tuning fork method possesses a simple structure and low cost, but it has a low gain and is hardly flexible. The electrical mixer is characterized by fine adaptability; nevertheless, its bandwidth and spurious suppression ratio (SSR) are low. Electrical serrodyne modulation has a preferable SSR (~20 dB) but a low bandwidth (<10 GHz) [7]. The DRFM down-converts radar signals into digital signals and implements signal replication, delay, and Doppler frequency shift in the digital domain, and then it is upconverted to produce a false interference signal. DRFM technology has excellent flexibility. However, the bandwidth of DRFM is limited by the sampling rate of the analog-to-digital converter, probably leading to pulse fingerprint information loss. With the increasing demand for detection accuracy in radar, a large bandwidth and high operating frequency are urgently required [8,9,10]. It is now difficult for the traditional Doppler velocity simulation methods to meet these requirements.
Owing to the processing in optical domain, microwave photonics technology has inherent advantages such as a large bandwidth, low loss, and resistance to electromagnetic interference [11,12,13,14]. Various microwave photonic frequency-shifting methods based on double sideband (DSB) modulation have been studied [15,16,17]. However, optical filters are required to suppress the optical carrier, so it is difficult to produce frequency shifts smaller than 1 GHz. In [18], a filterless frequency shift method based on carrier suppressed single sideband (CS-SSB) modulation is proposed. Nevertheless, the usage of a 90° hybrid limits the lower frequency shift. In addition, serrodyne modulation has been introduced into microwave photonic frequency shifters, which solves the problem of a low frequency shift. In [19], a frequency shift of 20 kHz with an SSR of 23 dB was achieved based on two parallel MZM modulators. However, it is difficult to implement higher frequency shifts because the sawtooth wave signal is loaded to the DC bias. A switched dual-channel serrodyne modulation technique [20] has been used to increase the SSR to 50 dB; nevertheless, the frequency shift is quite small (~50 Hz). In [21], the CS-SSB modulation and serrodyne modulation were, respectively, accomplished through a DPMZM and a PM. This parallel structure enables a wide frequency shift range; nevertheless, a non-common path structure will introduce extra coherent noises. Recently, a frequency-shifting method based on dual-parallel dual-drive MZM (DP-DDMZM) was investigated [22]. Frequency shifting in the range of 1 MHz over the RF bandwidth from 2 to 18 GHz was verified. However, the SSR decreased rapidly when the frequency conversion was at the 100 Hz level, and it was a challenge for the balun to achieve a larger RF bandwidth.
In this paper, we propose and demonstrate a microwave photonics Doppler velocity simulator with high SSR and large bandwidth range. The modulator half-wave voltages at low frequencies were measured. Based on these data, the pre-distortion compensation of the sawtooth wave was fulfilled by correcting the frequency response. Without any electrical bridges, the RF signal is directly coupled from the receiving antenna to the modulator, which fully utilizes the large bandwidth of microwave photonics. Within a large frequency range from 2 GHz to 40 GHz, a frequency shift from 0.1 kHz to 1 MHz is achieved and the SSR is greater than 35 dB. Finally, the effectiveness was evaluated via a radar velocimeter calibration system, and the velocity simulation error was less than 0.06 km/h.

2. Principles and Methods

2.1. Doppler Frequency Shift Principle

The structure of the proposed microwave photonics Doppler velocity simulator is shown in Figure 1. The system consists of a laser diode (LD), a DP-DDMZM, an optical bandpass filter (OBPF), an erbium-doped optical fiber amplifier (EDFA), and a photodetector (PD). The DP-DDMZM is composed of two parallel MZMs. The sub-PM in the upper MZM is loaded with a sawtooth wave signal to realize a small frequency shift of the optical carrier. One sub-PM in the lower MZM is fed by an RF signal and the other two sub-PMs are idle. The carrier-suppressed DSB modulation of the RF signal is achieved by adjusting the three bias voltages. An OBPF filters out one of the RF sidebands. The retained sideband and the frequency-shifted optical carrier beats at the PD to obtain a frequency-shifted signal.
A sawtooth wave is generated by an arbitrary waveform generator (AWG). A standard sawtooth wave can be expressed as
u S t = V S t T S n , n T S t < n + 1 T S
where V S and T S are the peak-to-peak voltage and period of the sawtooth wave, respectively.
In the ideal case, the phase change of the optical carrier is linearly related to the drive voltage. However, due to the special structure of the modulator’s RF electrodes, when the drive signal is less than kHz level, the modulator’s half-wave voltage decreases dramatically, resulting in a nonlinear distortion of the phase shift for the optical carrier [22]. To simplify the analysis, all the splitting ratios of the Y branch in the DP-DDMZM modulator are assumed to be 1:1. Then, the modulated optical signal of the sawtooth wave can be expressed as
E P M 1 t E c exp j ω c t + j π u S t / V π
where E c and ω c are the amplitude and angular frequency of the optical carrier; V π is the half-wave voltage of the RF port in the modulator. Equation (2) is expanded as
E P M 1 t E c exp j ω c t n = n = + a n exp j n ω S t
where ω S = 2 π / T S is the angular frequency of the sawtooth wave. a n can be calculated by the following equation:
a n = 1 T 0 T S cos π V π u S t n ω s t d t
When the sawtooth wave amplitude satisfies V S = 2 V π , it can be found that a 1 = 1 and a n = 0 ( n 1 ). In this situation, the desired frequency shifting of the optical carrier can be realized.
The microwave signal V R F cos ω R F t is directly coupled to an RF port in the modulator, and the RF ports of the other two PMs are overhanging. The output of the DP-DDMZM is denoted as
E D P D D M Z M t E P M 1 t + E c e j ω c t e j θ 1 + E c e j ω c t e j θ 2 + e j m R F cos ω R F t e j θ 3 E c e j ω c t e j ω S t + e j θ 1 + e j θ 2 + θ 3 + J 0 m R F e j θ 3 + J 1 m R F e j ω R F t e j θ 3 J 1 m R F e j ω R F t e j θ 3
where m R F = π V R F / V π is the modulation depth of the microwave signal and θ i = π V b i / V π ( i = 1, 2, 3) is the phase shift produced by the DC bias voltage. From Equation (5), it can be seen that the carrier is suppressed when the DC bias voltage satisfies e j θ 1 + e j θ 2 + θ 3 + J 0 m R F e j θ 3 = 0 . Under this condition, the CS-DSB modulation can be achieved. Afterwards, the sideband at ω c ω R F is filtered out using an OBPF to implement the CS-SSB modulation, and the OBPF output can be expressed as
E O B P F t E c e j ω c t e j ω S t + J 1 m R F e j ω R F t e j θ 3
The photocurrent after the frequency beating at PD is
i ω R F ω S t 2 η E c 2 e j ω c t J 1 m R F cos ω R F t ω S t + θ 3
where η is the responsivity of the photodetector. It can be seen that this scheme can achieve a Doppler shift of the RF signal with the same frequency shift as the sawtooth wave frequency.

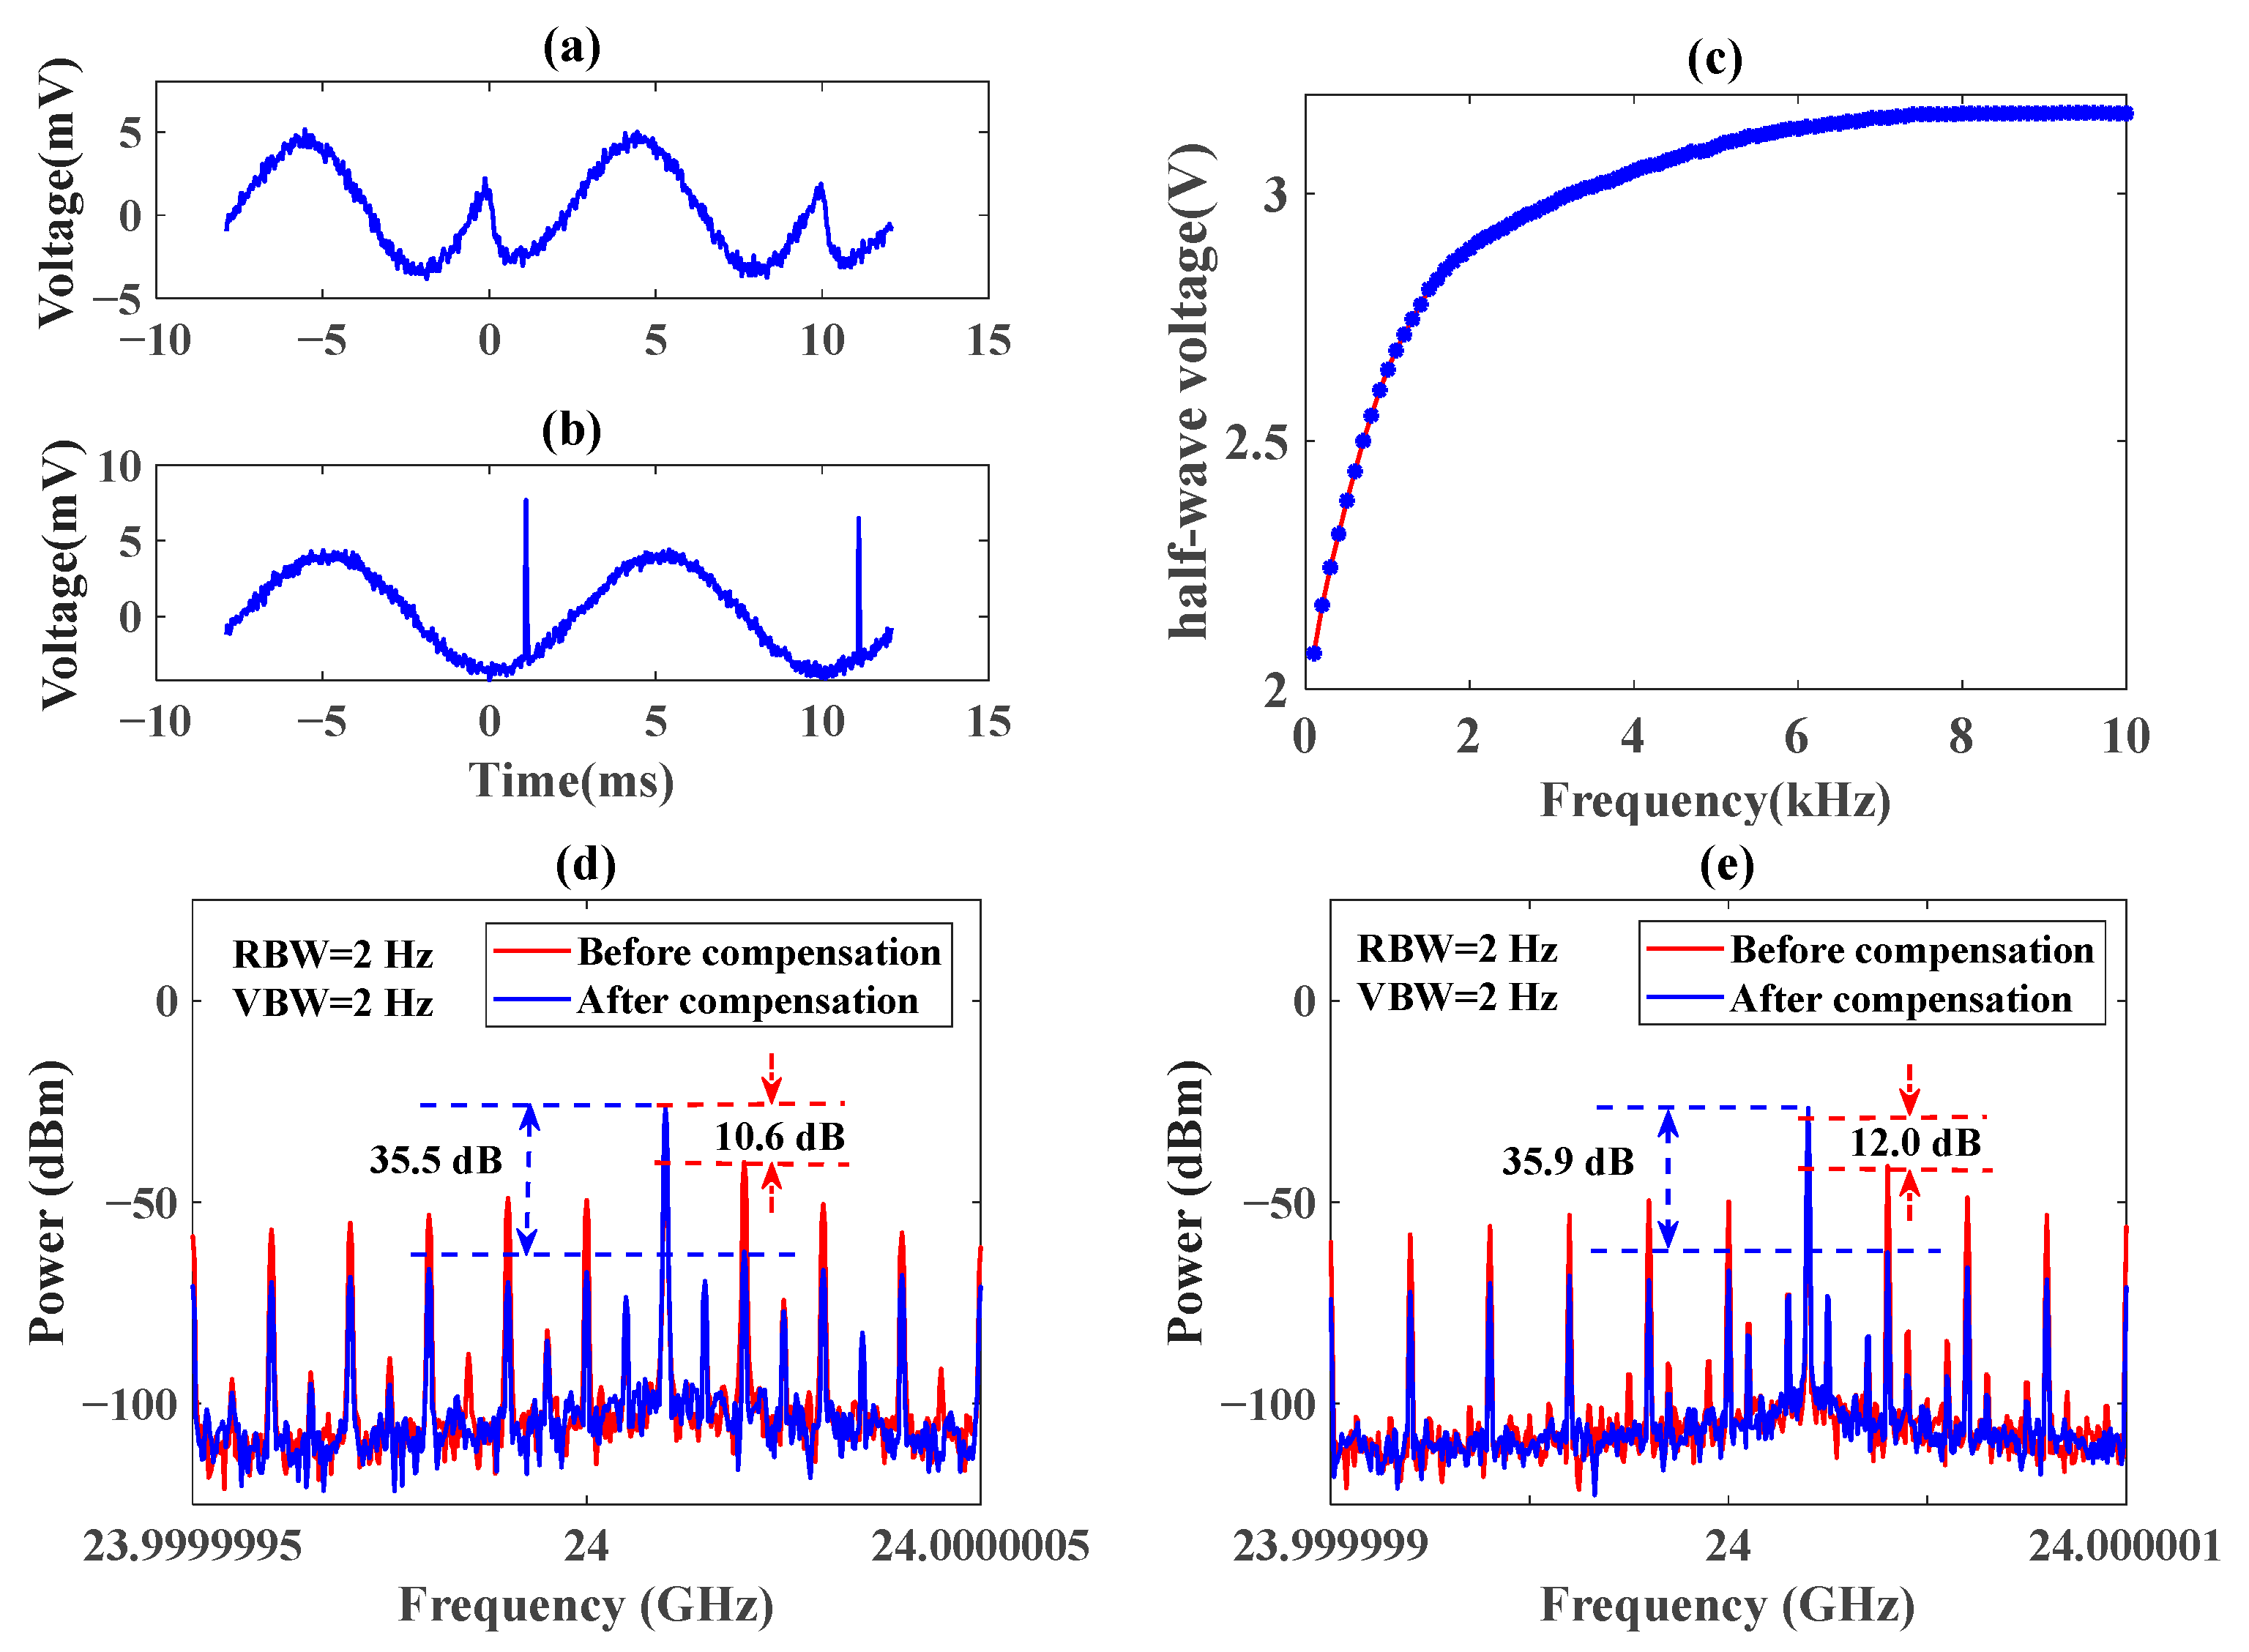
2.2. Pre-Distortion Compensation of the Sawtooth Wave

When a sawtooth wave signal is loaded to a modulator, a frequency shift is introduced for the optical carrier. During this conversion, various distortions are generated, leading to a decrease in the SSR of the frequency-shifted signal. There are many factors causing the decrease in SSRs, such as sawtooth wave linearity distortion, non-flat modulator frequency response, and amplitude modulation effect [22]. Among them, the non-flat frequency response of the modulator has the most prominent effect. The half-wave voltage of the modulator drops rapidly, especially at frequencies below the kHz level. The Fourier expression of the sawtooth wave signal is given by
U S ω = V S 2 V S π n = 1 sin n ω S t n
The V S / n for the component at n ω S is adjusted according to actual system transfer function H ω . Then, a compensated system transfer function H ω is constructed. The corrected sawtooth waveform u c t can be obtained by inverse Fourier transform.
The transfer function of the modulator RF port inherently describes the electrical-optical conversion efficiency, which can be indirectly denoted by the frequency response of the half-wave voltage. Therefore, to reduce the distortion introduced by the modulator, the half-wave voltages at low frequencies need to be measured for the pre-distortion compensation. The measurement of the half-wave voltage can be performed using the scheme as shown in Figure 2. AWG1 generates a low-frequency cosine signal, and AWG2 outputs a sawtooth wave signal. The cosine and sawtooth signals are loaded to the test port by combining them through a power splitter, where the frequency of the test signal is much smaller than the sawtooth wave frequency, and the peak-to-peak value of the sawtooth wave is tuned to achieve the CS-SSB modulation. To simplify the analysis, the other three PMs are equated to one PM. The β and φ are the splitting ratio and phase difference between the PM to be measured and the equivalent PM. The output optical signal of DP-DDMZM can be expressed as
E D P D D M Z M t E c 1 + β 2 e j ω c t 1 + β 2 e j m r cos ω r t + θ r + j φ + j ω S t
m r = π V r / V π ω r
where m r is the modulation depth of the low-frequency test signal; V r , ω r , and θ r are its amplitude, angular frequency, and initial phase, respectively. After passing through the photodetector, the ratio of photocurrent components at ω S + ω r and ω S can be obtained, respectively, as
A ω S + ω r A ω S = J 1 m r J 0 m r
The power deviation between ω s + ω r and ω s is measured by the spectrometer, and the half-wave voltage of the modulator at the test frequency can be calculated by combining Equations (10) and (11).

3. Results

In order to verify the performance of the system, the experimental system is built according to Figure 1. The LD (NKT Photonics, Koheras BASIK X15, Beijing, China) has an output wavelength of 1550 nm and a power of 14.0 dBm. A sawtooth wave is generated by an AWG (Rigol RG5352, Beijing, China) and loaded to one of the RF ports of the upper MZM in the DP-DDMZM (Fujitsu FTM7960EX, Beijing, China). The bandwidth of the AWG is 350 MHz, the maximum frequency of the output sawtooth wave is 10 MHz, and the maximum output peak-to-peak is 10 V at a 50 Ω load impedance. A microwave signal generator (MSG, Agilent E8257D, Beijing, China) produces an RF signal, and it is loaded to one of the RF ports in the lower MZM. The remaining two RF ports are overhanging. The OBPF is inserted to filter out one of the RF sidebands. After being amplified by an EDFA, the optical-electronics conversion is realized by a photodetector with a bandwidth of 50 GHz. The spectrum of this output signal is measured by an electrical spectrum analyzer (ESA, Keysight N9020B, Beijing, China). As the frequency interval of the spurious sidebands of the Doppler-shifted signals in the experiment is quite small, with a minimum interval of 100 Hz, it is necessary to synchronize the MSG with a 10 MHz reference clock of the ESA. This operation can avoid the spectral shift caused by the error of the ESA frequency measurements and ensure the accuracy of the measurement results.

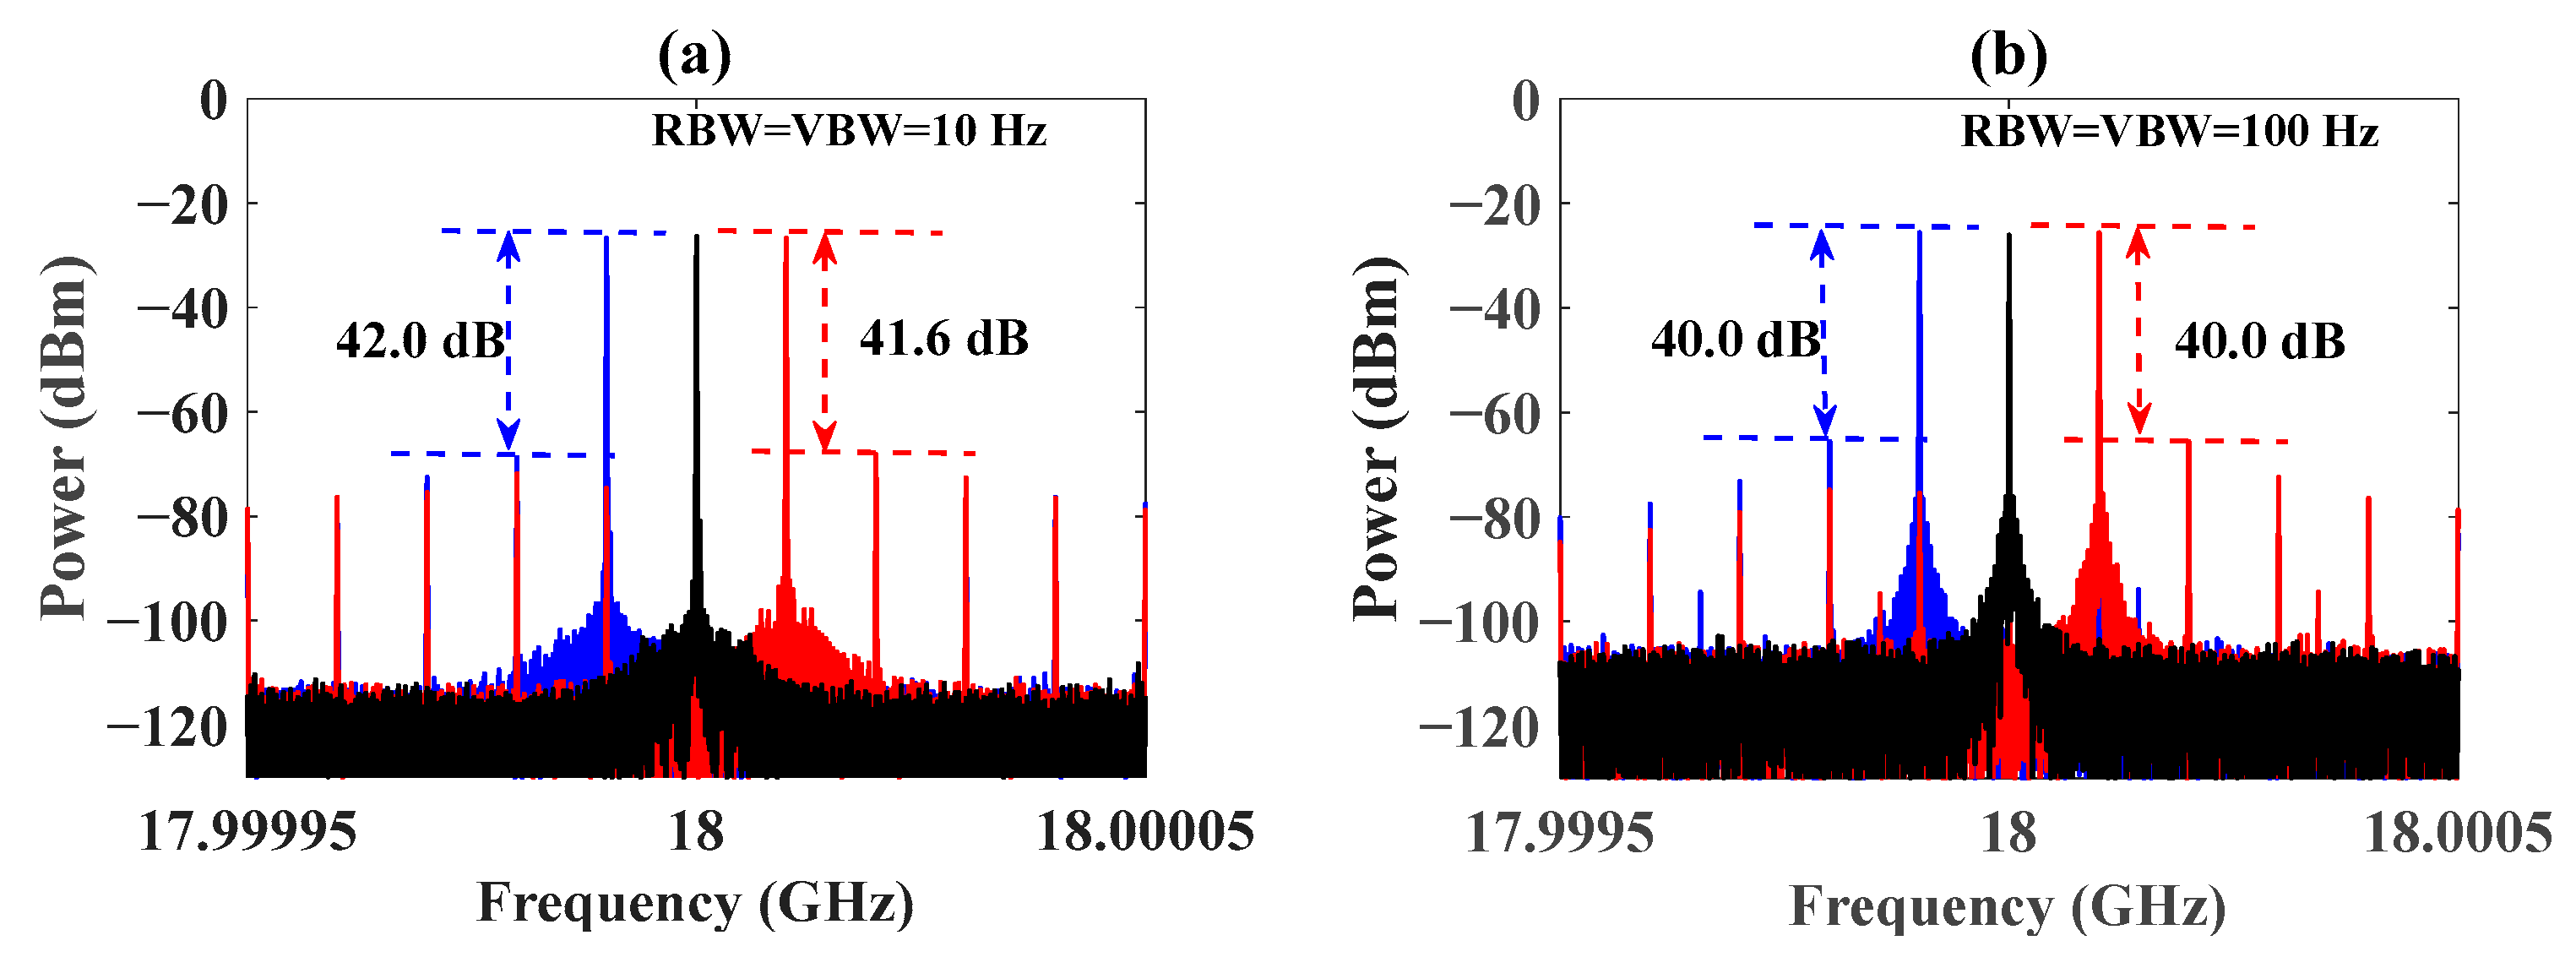
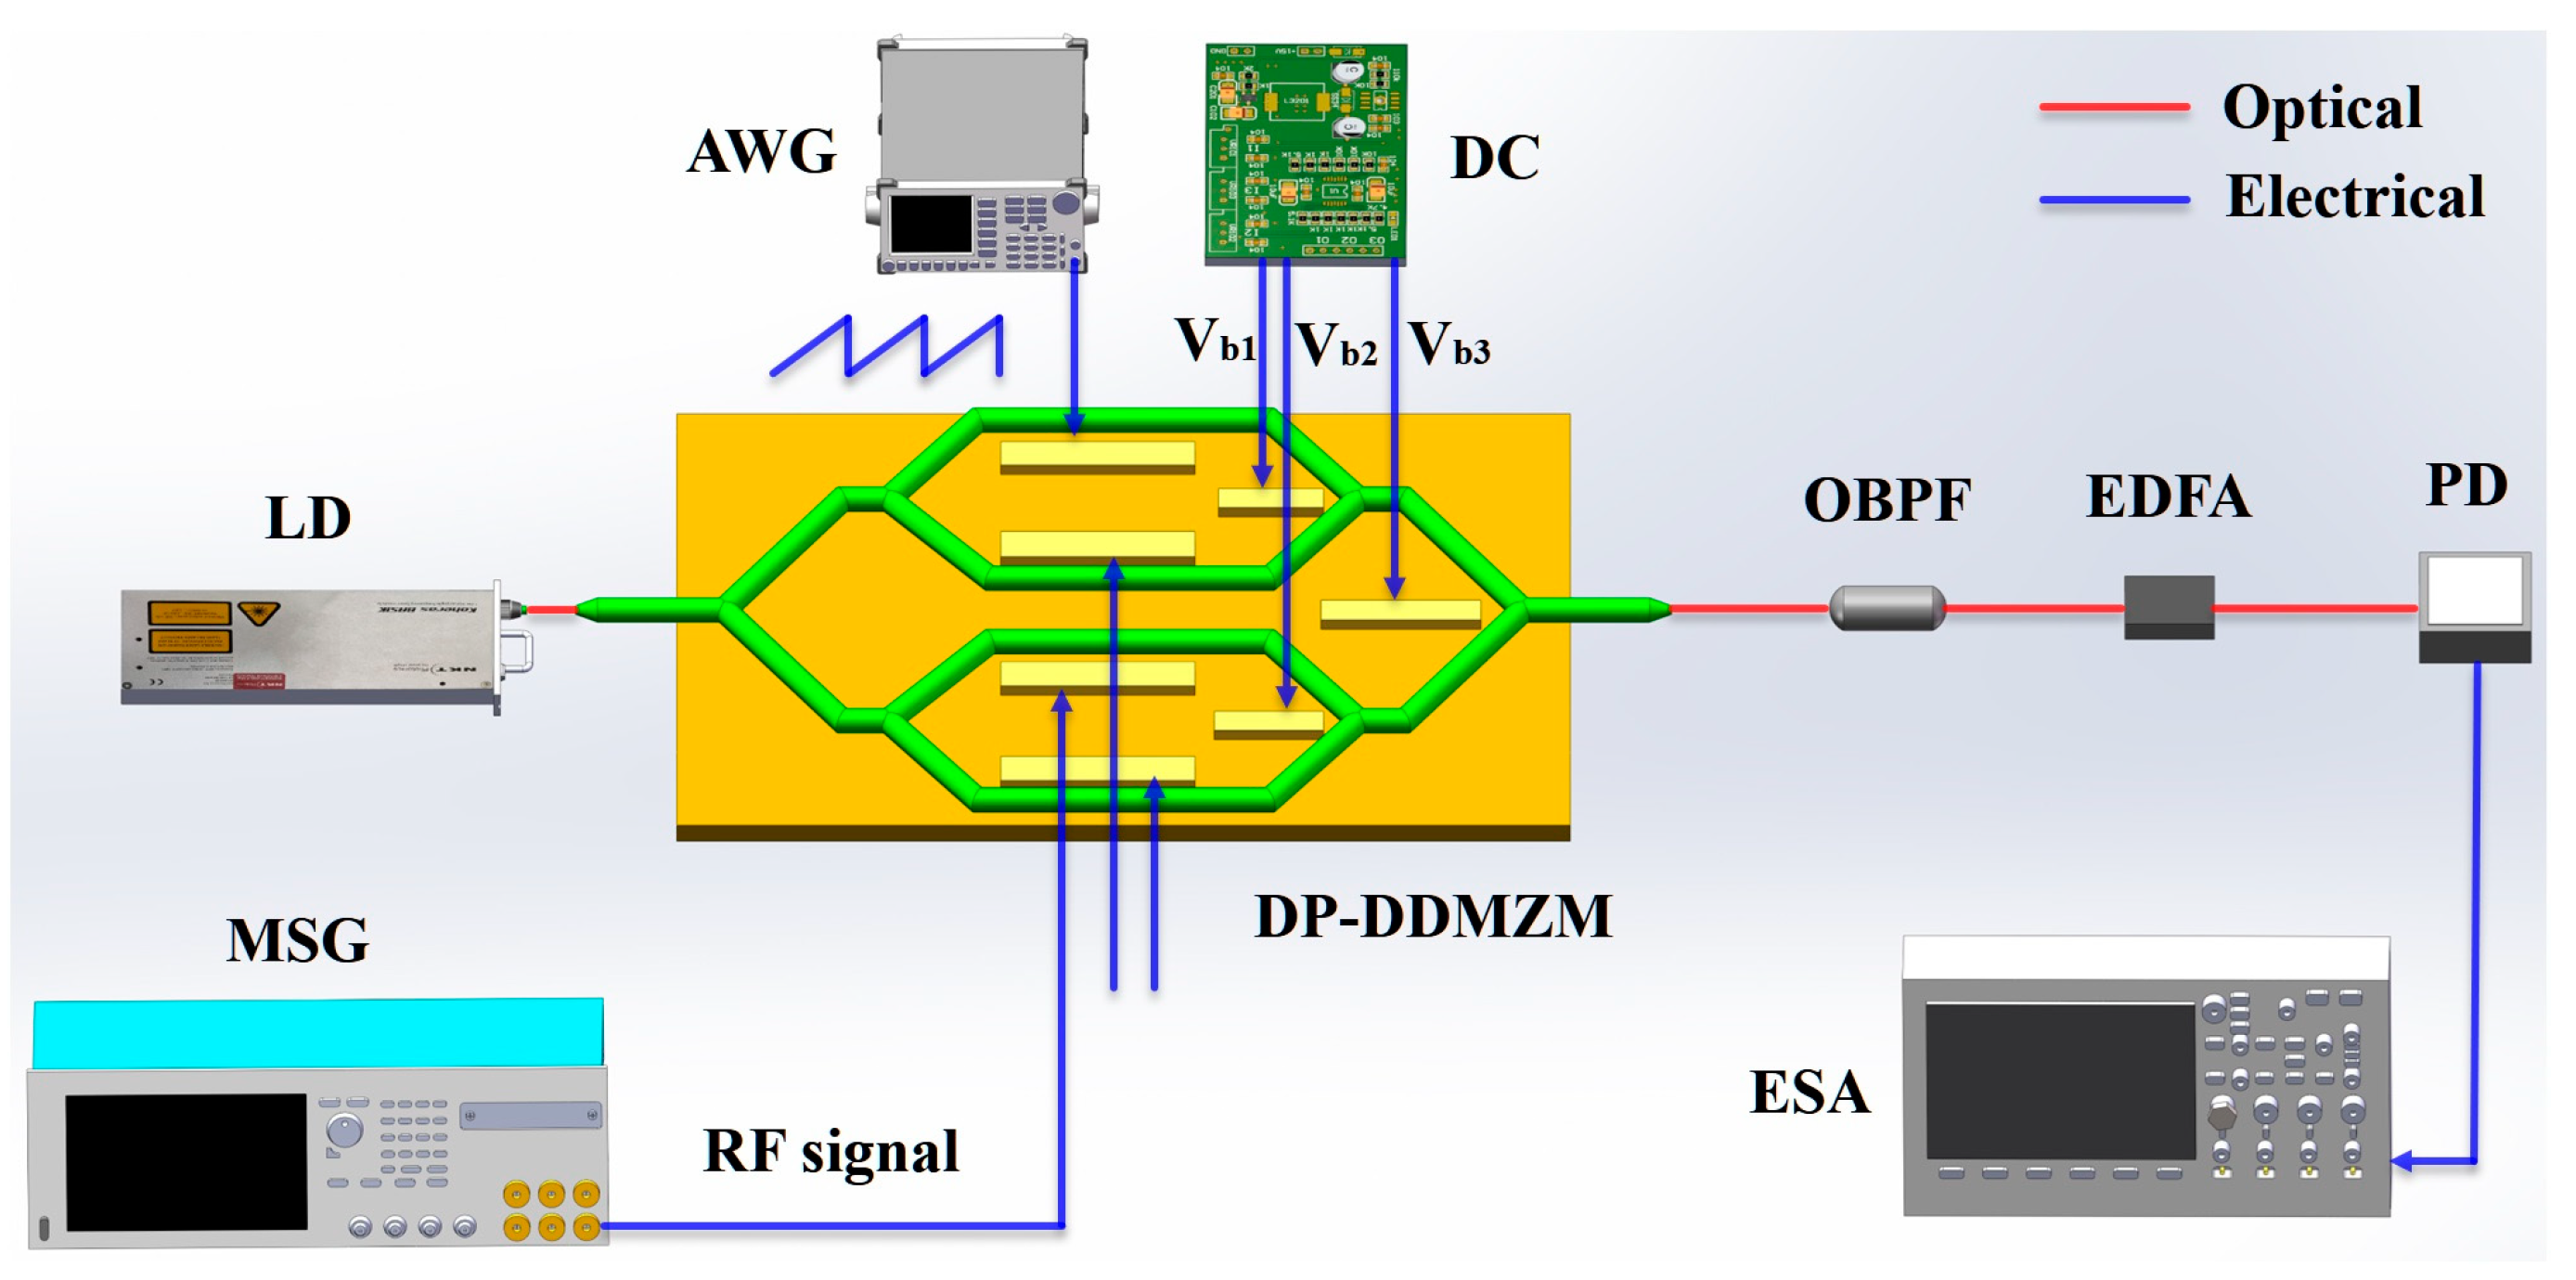
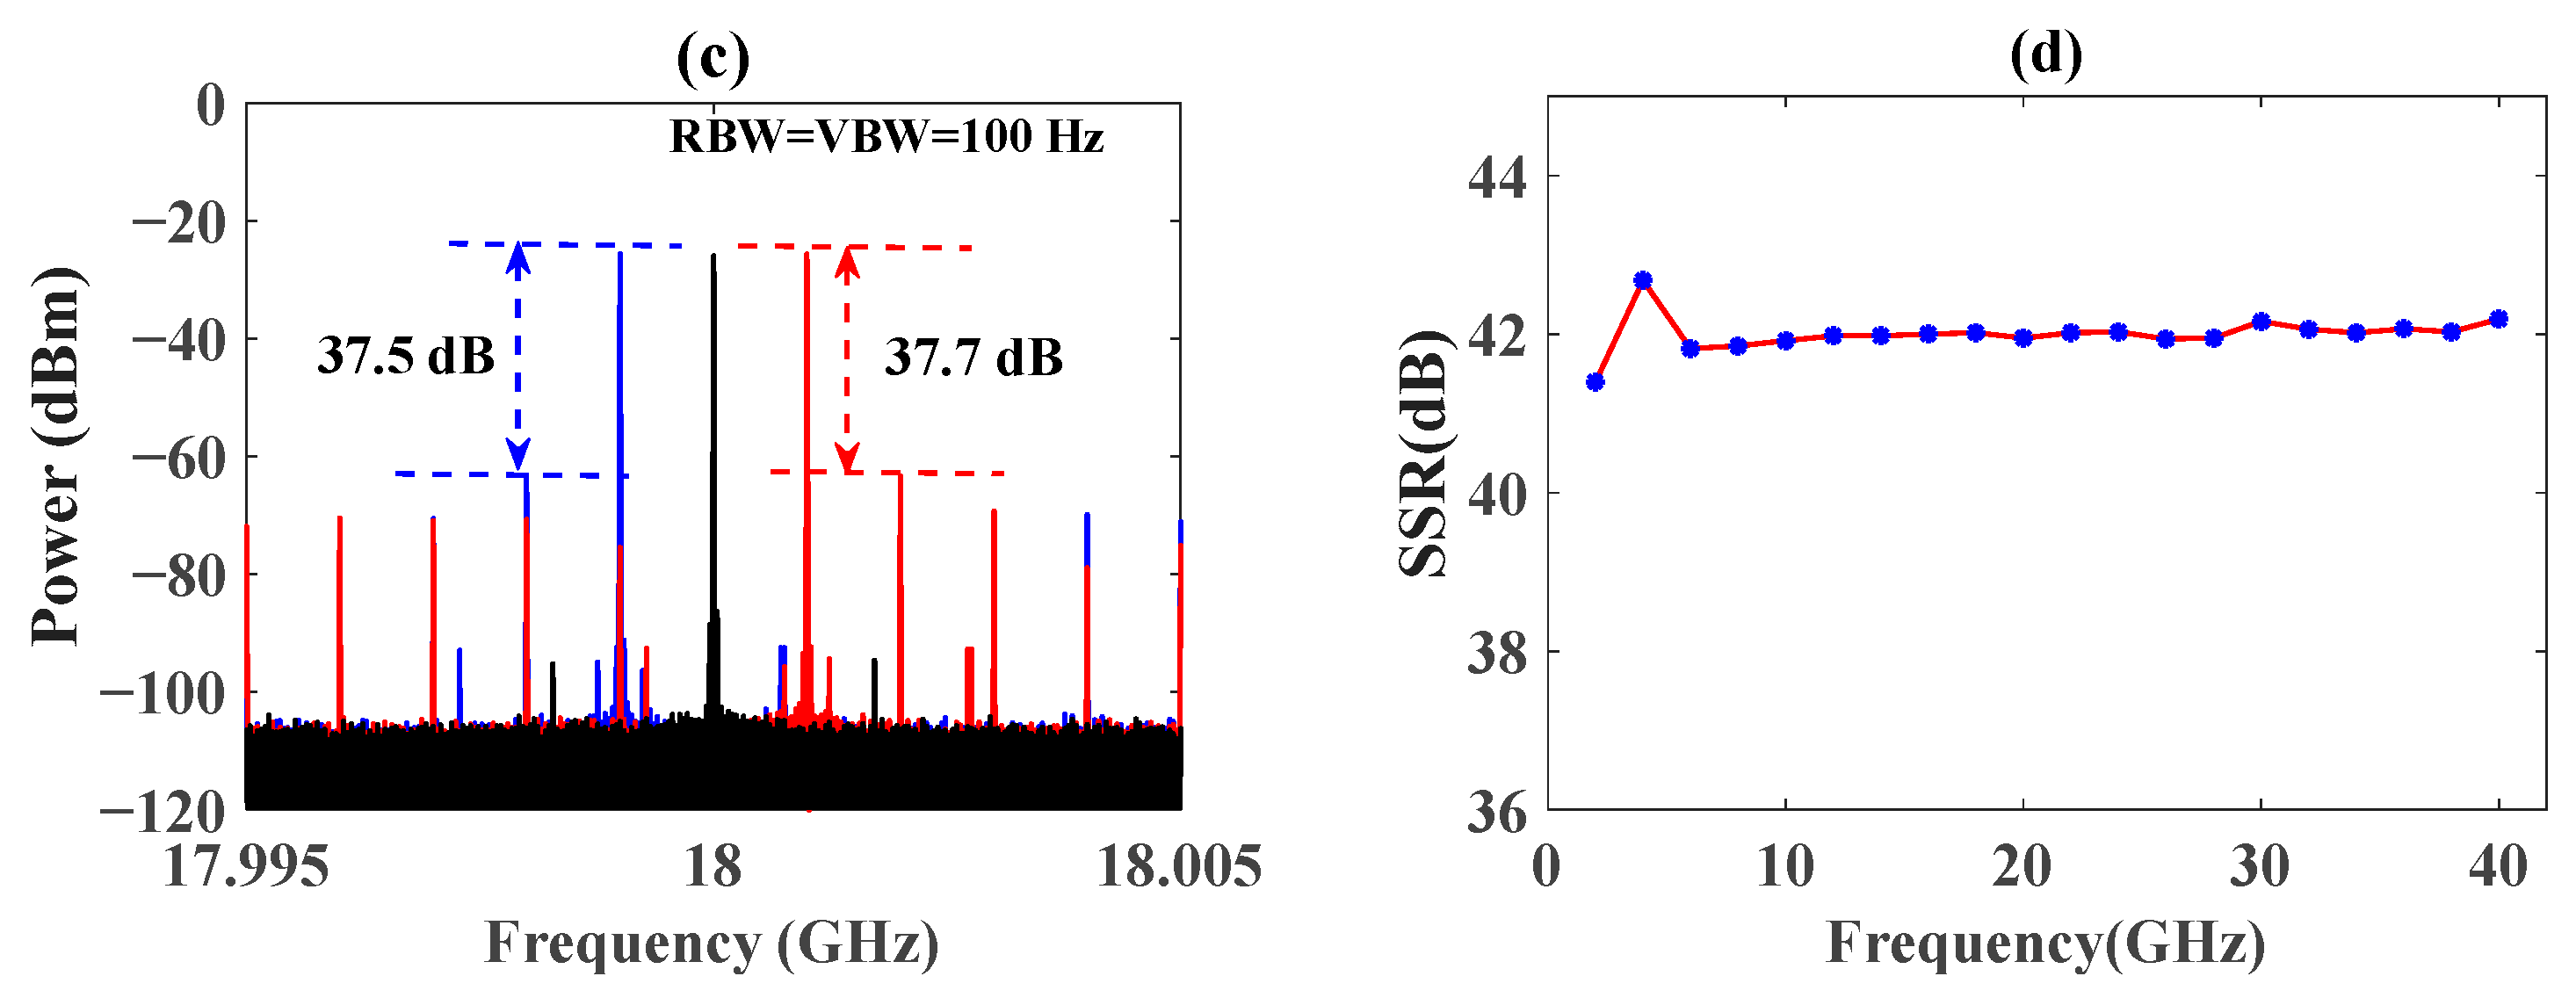
3.1. Doppler Frequency Shift and SSR Measurement

The half-wave voltage of the modulator decreases greatly on the scale of a hundred hertz, which results in a nonlinear distortion of the modulated signal. Accordingly, at frequency shifts below the kHz level, the modulator produces significant distortions in converting the sawtooth wave to the phase of an optical carrier. These distortions will substantially increase the power of the spurious sidebands, causing significant degradation of the SSR. To facilitate the measurement of the distortion of the serrodyne-modulated signal waveform at low frequency shifts, the RF signal is turned off, and the frequency of the sawtooth wave is set to 100 Hz. An oscilloscope (Keysight DSO7104B) is used to measure the waveform output from the PD, and the measurement result is shown in Figure 3a. In this case, the output of the PD is the beat frequency signal of the optical carrier and the serrodyne-modulated optical sideband, ideally outputting a cosine signal with the same frequency as the sawtooth wave. However, from the experimental results, we can see that the waveform has a serious distortion.
In order to improve the SSR at a low frequency shift, the half-wave voltage at the RF port of the modulator is measured by the method shown in Figure 2. AWG1 outputs a 100 kHz sawtooth wave signal with an amplitude of about 6.2 V, and AWG2 generates a cosine signal at the frequency to be measured with a power of 0 dBm. These two signals are coupled through a power divider and loaded to the modulator RF port. The frequency of the test signal is varied from 100 Hz to 10 kHz in the step of 0.1 kHz, and then the power at ω s + ω r and ω s is detected with the ESA. The sweep range of the ESA is set from 80 kHz to 120 kHz. Substituting the power values at the two frequency points into Equations (10) and (11), the half-wave voltages are calculated as shown in Figure 3c. It can be seen that the half-wave voltage at 10 kHz is 3.16 V, and it rapidly decreases to 2.07 V at 100 Hz.
The measured half-wave voltage curves are normalized as the system response function. Then, the Fourier expansion of the sawtooth wave is corrected, and the compensated sawtooth wave is obtained via the inverse Fourier transform. The compensated sawtooth waveform data are stored into the AWG, and then they are loaded to the modulator. The output signal of the PD is measured as shown in Figure 3b, which is quite similar to the cosine waveform. The MSG outputs a 24 GHz RF signal, and the spectrum of the compensated frequency-shifted signal is shown as the blue curve in Figure 3d, and the SSR reaches 35.5 dB. Then, the frequency of the sawtooth wave is changed to 200 Hz. The output spectrum is indicated in Figure 3e, and the SSR is 35.9 dB. Meanwhile, the uncompensated frequency-shifted signals are also detected, and the results are shown as the red curves of Figure 3d,e. The SSRs are only 10.6 dB and 12.0 dB when the frequency shifts are 100 Hz or 200 Hz. We can see that the improvements are 24.9 dB and 23.9 dB, respectively.
Furthermore, the system SSRs are measured for frequency shifts higher than kHz. The frequency and power of the RF signal are set to 18 GHz and 0 dBm, respectively. The slope direction of the sawtooth wave is changed to measure the spectra of positive and negative frequency shifts, respectively. The sawtooth wave frequency is set to 10 kHz, 100 kHz, and 1 MHz, respectively. The spectra of the three frequency-shifted signals are shown in Figure 4a–c, respectively, where the red curve, blue curve, and black curve are the spectra at positive frequency shift, negative frequency shift, and no frequency shift, respectively. The experimental results show that the SSRs are 41.6 dB, 40.0 dB, and 37.7 dB at positive frequency shifts and 42.0 dB, 40.0 dB, and 37.5 dB at negative frequency shifts, respectively. From the experimental results, it can be seen that the spectra of the positive and negative frequency-shifted signals have a high symmetry, and the difference between the two SSRs is small. The frequency response of the half-wave voltage is flatter, resulting in less sawtooth wave distortion, so high SSRs greater than 40dB are achieved at frequency shifts of 10 kHz and 100 kHz. Due to the limitation of the AWG bandwidth, the attenuation of the high frequency component of the sawtooth wave increases; thus, the fall time or rise time of the sawtooth waveform will be increased. Accordingly, a slight SSR drop exists at 1 MHz. The frequency shift can be further improved by selecting a higher bandwidth sawtooth wave source and amplifiers.
In the spectrum of the frequency shift signal, the residual RF carrier is generated by the frequency beating between the optical carrier and the RF optical sideband, so the suppression ability of the optical carrier determines the suppression ratio of the RF carrier. In addition, since the suppression of the optical carrier in the system is realized by adjusting the DC bias voltage of the DP-DDMZM, the drift of the DC bias voltage increases the power of the residual RF carrier and reduces the SSR of the frequency-shifted signal. Fortunately, the beating between the optical carrier and the serrodyne frequency-shifted optical sideband produces a signal at the same frequency as the sawtooth wave, and the amplitude of this signal is related to the suppression ratio of the optical carrier. Therefore, a low-frequency PD can be added to the system, and the low-frequency signal can be obtained via the frequency beating. This signal can be used as a feedback to compensate for the drift of the DC bias voltage in real time.
Then, the effect of RF frequency variation on the SSR of the frequency shift signal is investigated. The frequency shift is kept at 10 kHz, and the variation of SSRs are measured from 2 GHz to 40 GHz with an RF frequency step of 2 GHz. The results are shown in Figure 4d. The SSR has a minimum value of 41.4 dB and a maximum value of 42.7 dB, with a variation less than 1.3 dB. The fluctuations in SSRs are mainly in the lower frequency band of 2–4 GHz, which is caused by the left and right RF optical sidebands entering the OBPF transition band. It can be observed that the frequency-shifting performance maintains a high stability over a large bandwidth.

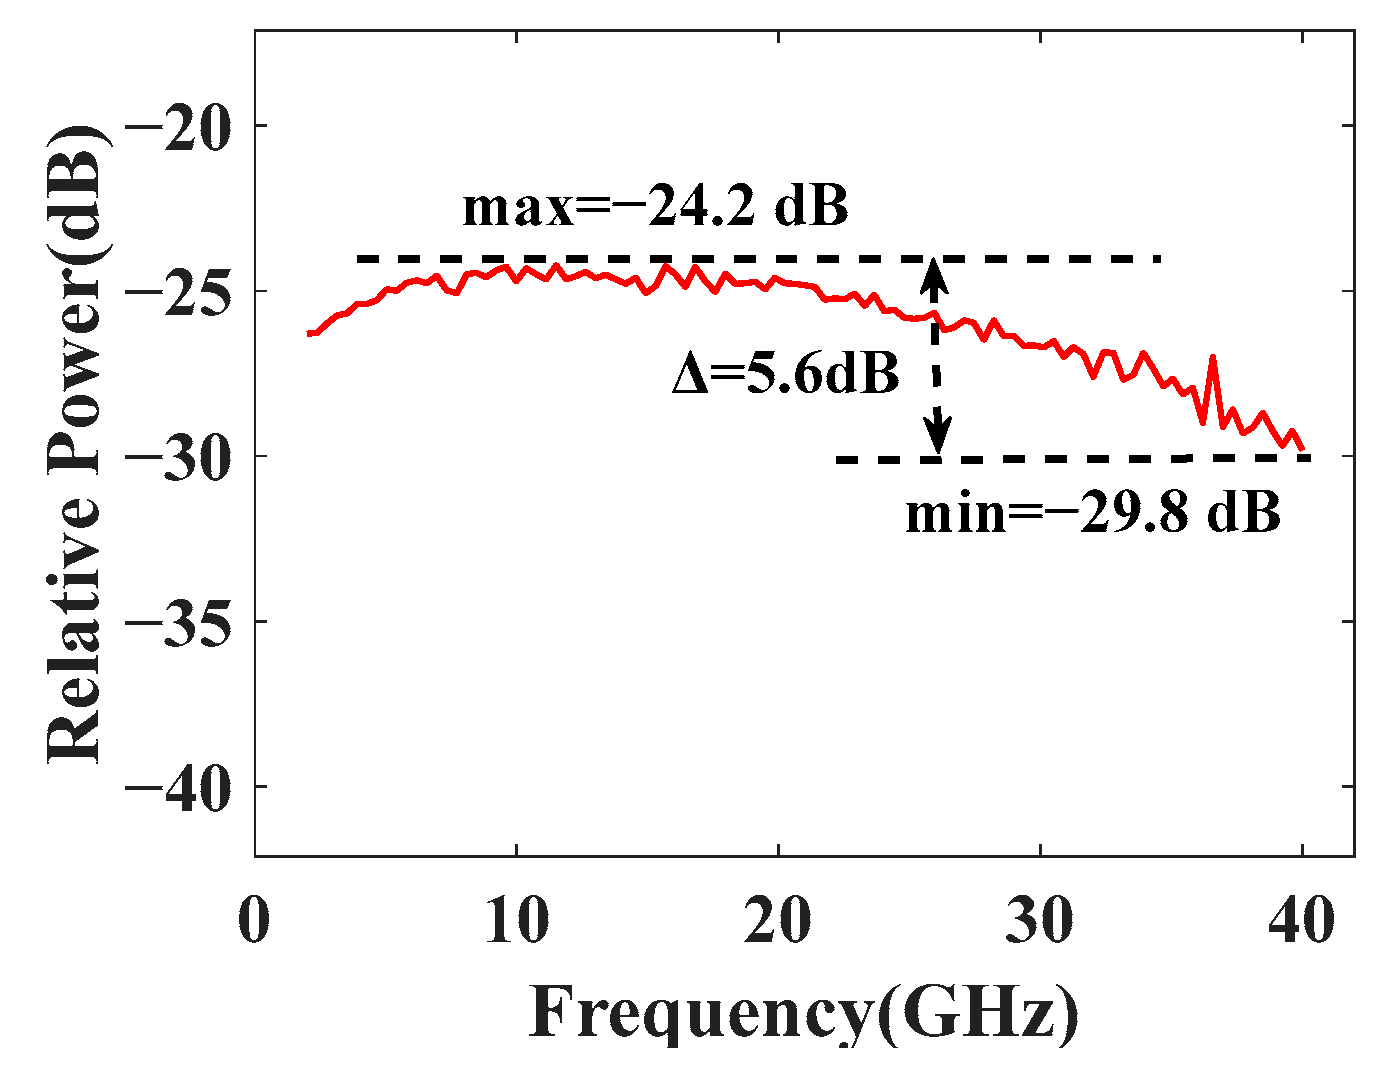
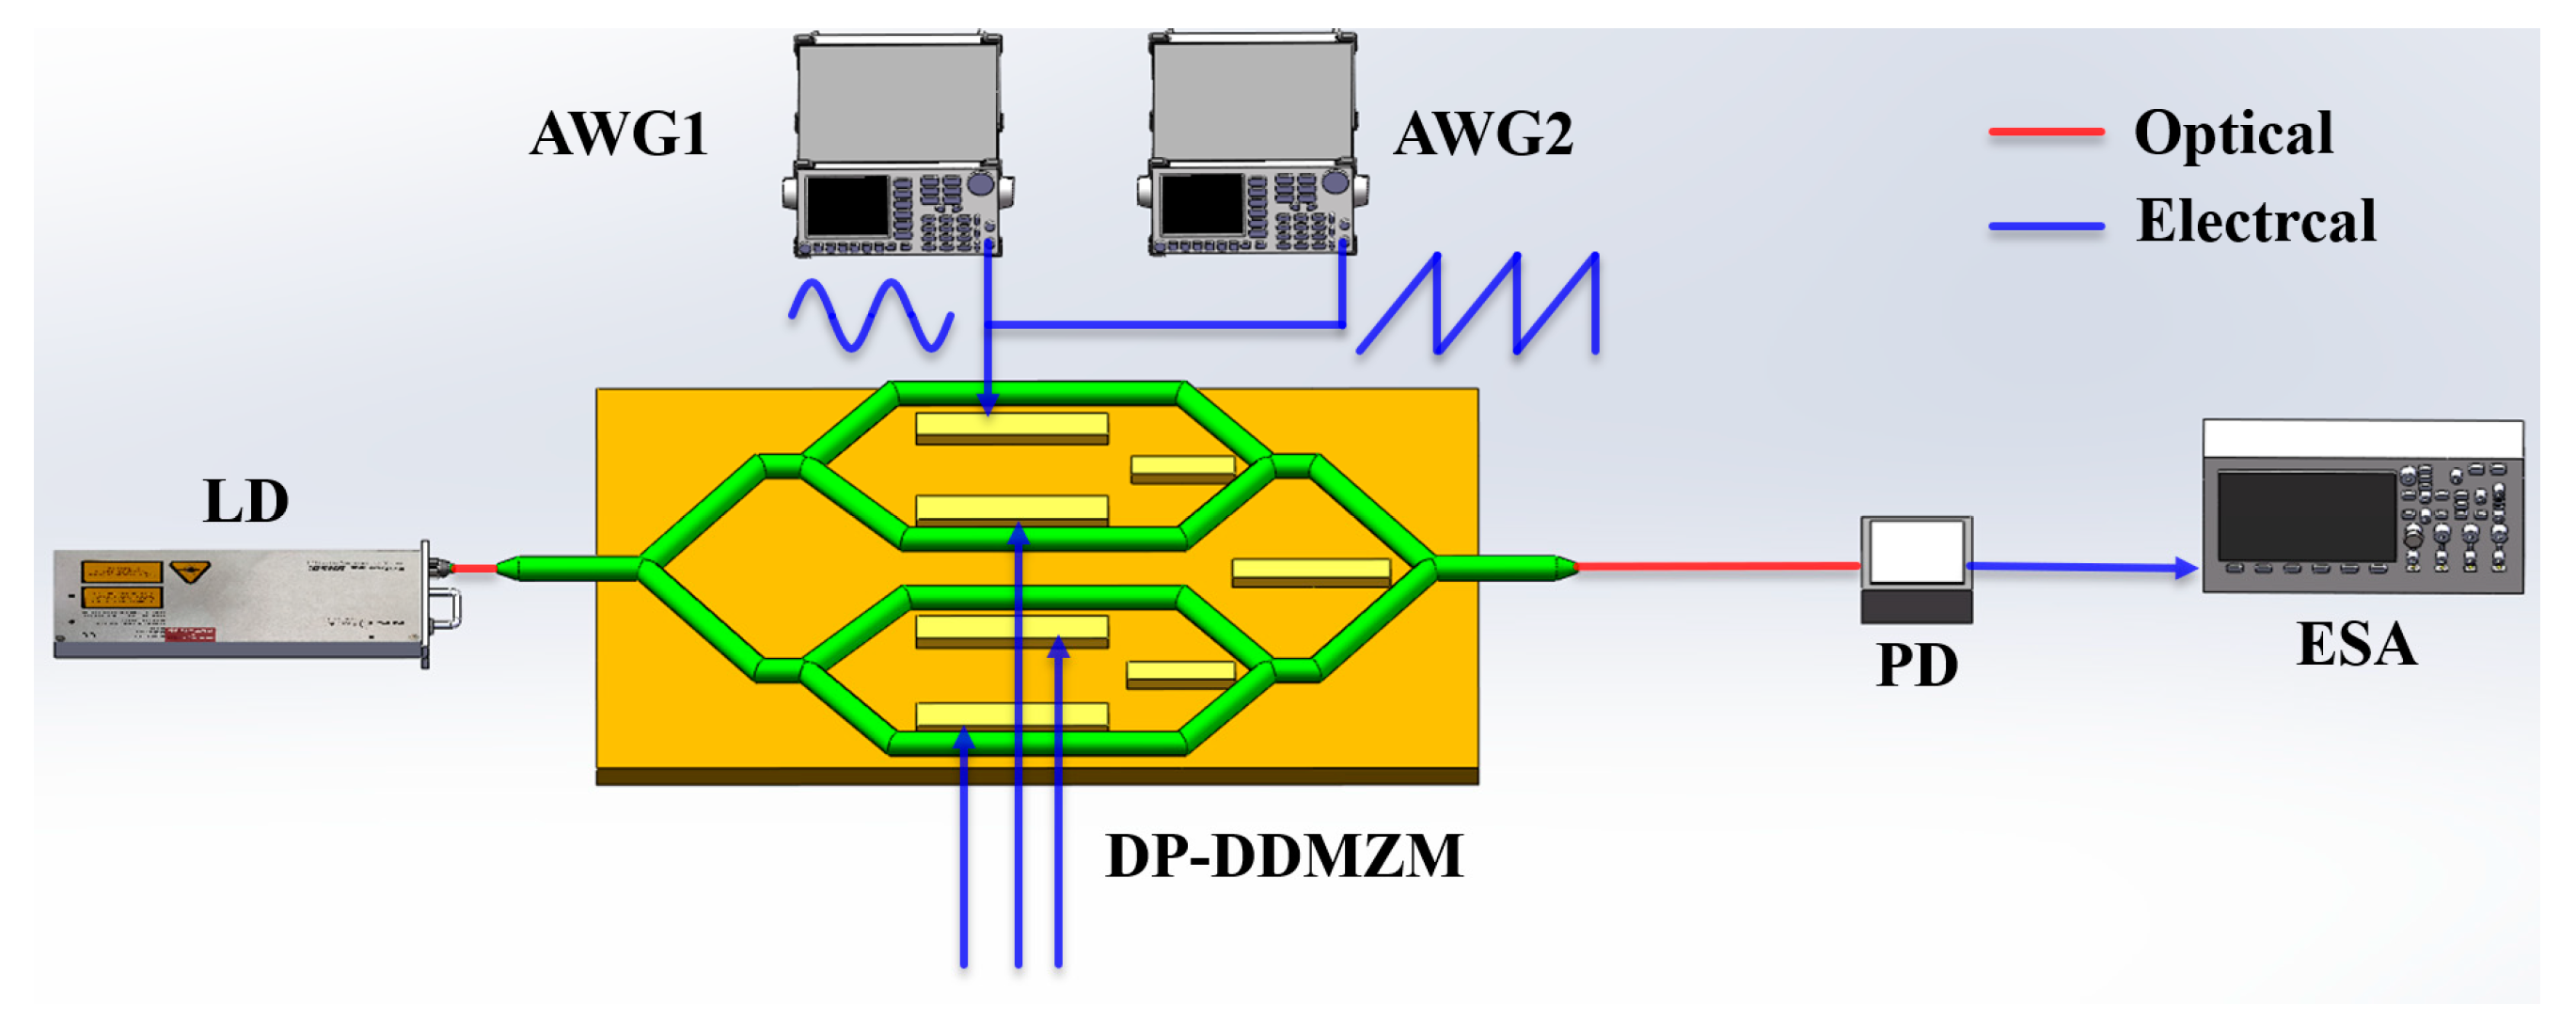
3.2. Operational Bandwidth Measurement

The operating bandwidth is an important indicator of the system’s large bandwidth characteristics. The RF operation bandwidth of the system is measured using a vector network analyzer (VNA, Rohde&Schwarz ZNB40, Beijing, China). Before measuring the operating bandwidth, the AWG is set to generate a 10 kHz sawtooth wave, and by adjusting the sawtooth wave amplitude and the modulator DC bias voltage, the frequency-shifted signal reaches the maximum spurious suppression ratio to ensure that the system is tuned to the optimal operating condition. Since VNAs cannot measure systems with frequency shifts, the sawtooth wave signal needs to be turned off. The VNA used in the experiment has two ports with a maximum scanning range of 10 MHz–40 GHz and a frequency resolution of 1 Hz. The output RF power of the VNA is set to 0 dBm. One port of the VNA is connected to the RF input port of the system, and the output of the PD is connected to another port of the VNA. The frequency sweep range of the VNA is from 2 to 40 GHz and the measurement results are shown in Figure 5. The 3dB bandwidth of the system is 30 GHz and the 6dB bandwidth is no less than 38 GHz. Optical filters have a large transition bandwidth relative to RF signals, so the minimum operating frequency of the system is limited to about 2 GHz. In the high-frequency band of 32–40 GHz, although the gain attenuation of the system is more than 3 dB, it can be seen from Figure 4d that the SSR of the frequency-shifted signal at this time is not decreased, and it still has a high frequency-shifting performance. Since the received signal is directly coupled to the RF port of the modulator, the broadband advantage of the modulator can be maintained.

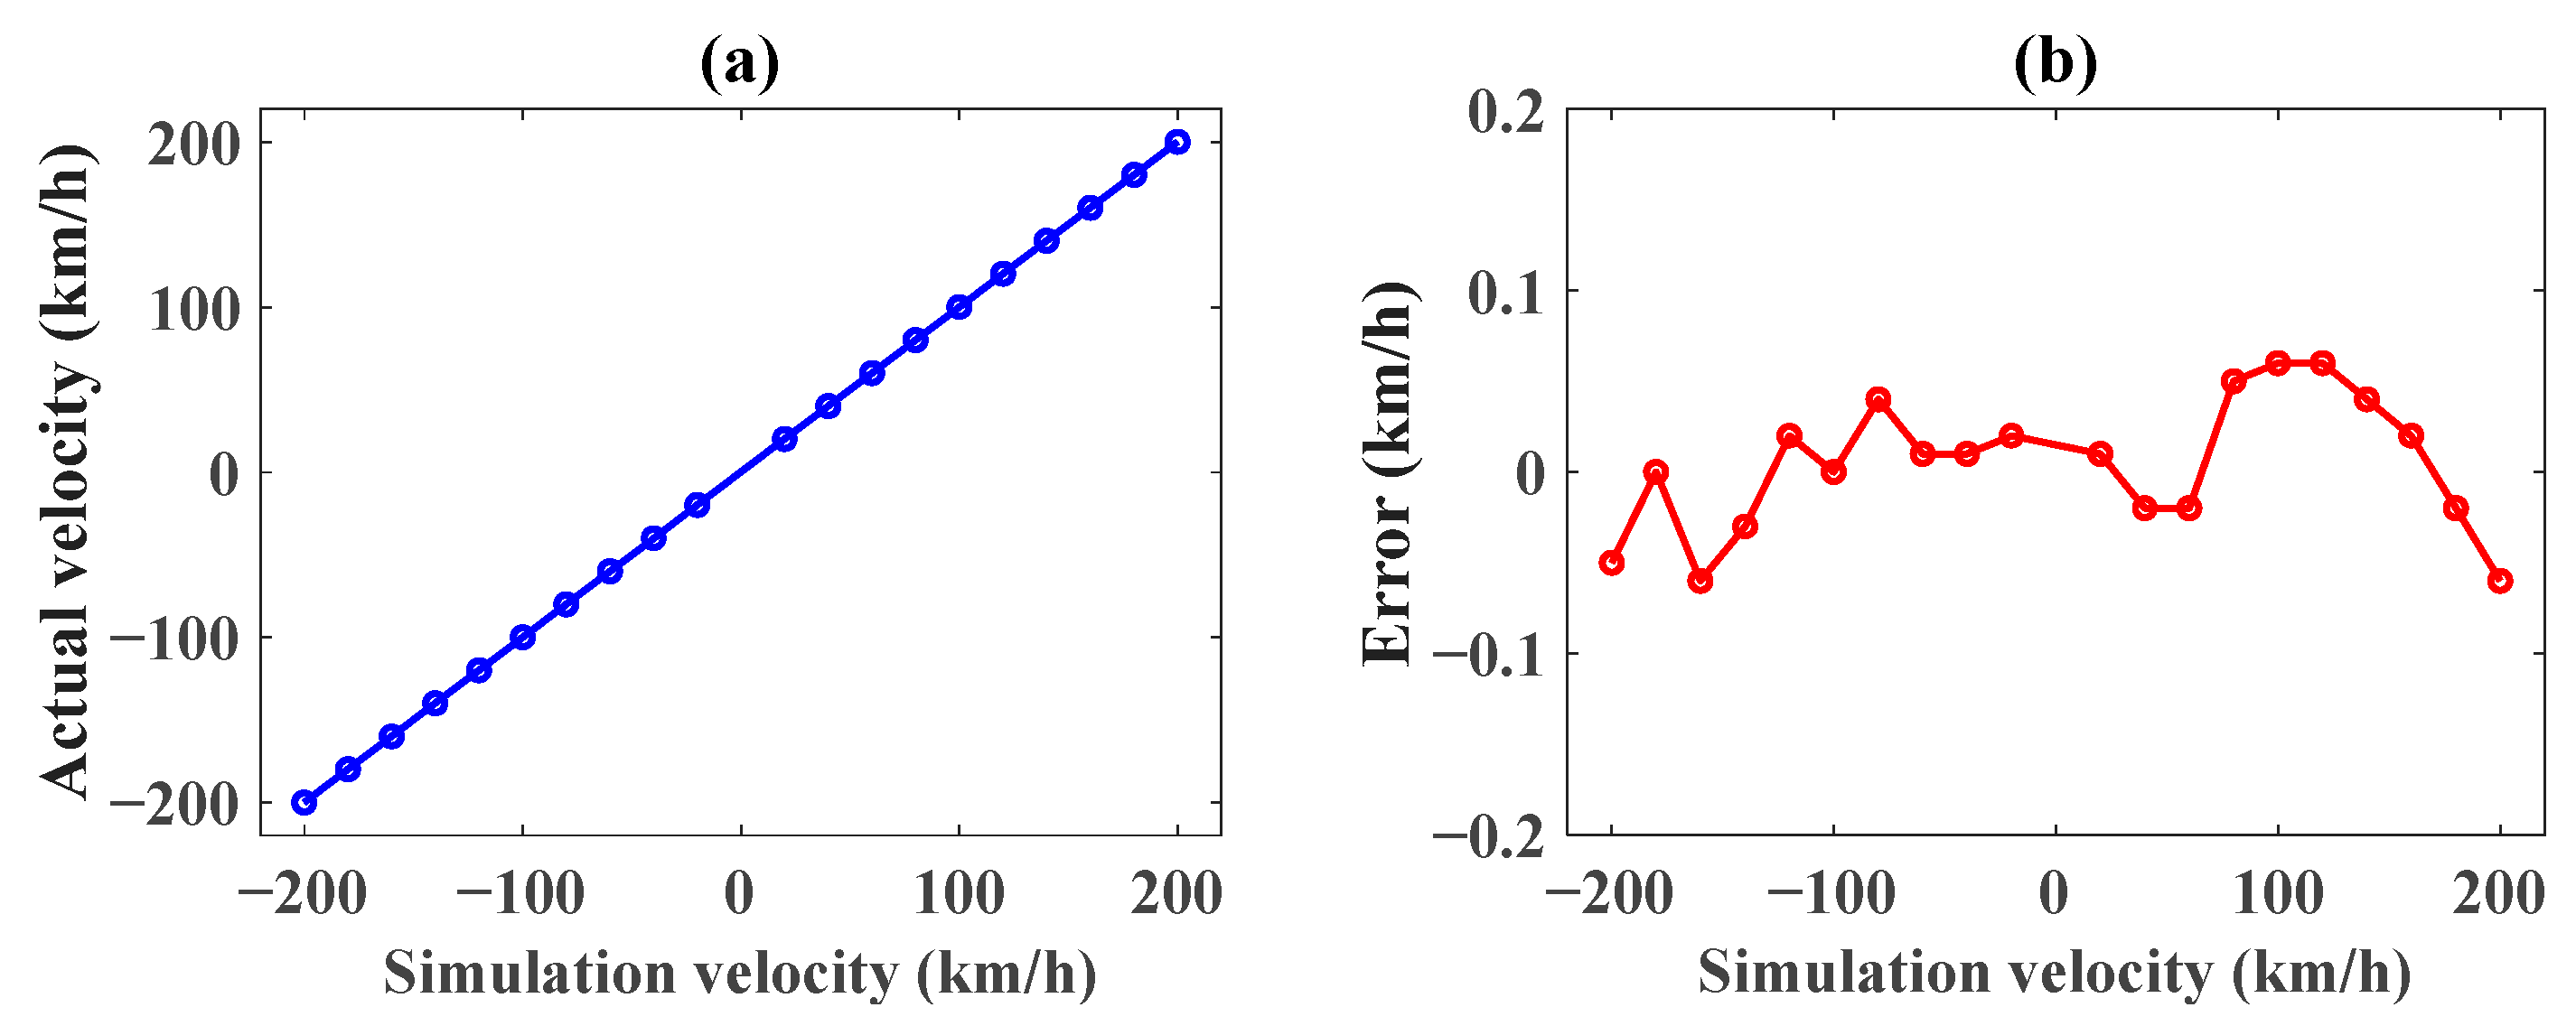
3.3. Doppler Velocity Simulation Errors

A Doppler velocity simulator is constructed based on the proposed method, and the velocity simulation performance of the system is verified. The simulator is measured using a traffic speed radar as an auxiliary device in the experiment. The simulator receives the radar transmitting signal of a traffic speed radar and loads it to the DP-DDMZM modulator in the proposed Doppler velocity simulator. After the Doppler shifting introduced by the sawtooth wave, the frequency-shifted RF is sent back to the traffic speed radar, so the frequency shift can be detected. The transmitting and receiving antennas of the simulator operate at 17.6–26.7 GHz with a gain of 15 dB. The carrier frequency of the traffic speed radar is measured to be 24.155 GHz by a microwave frequency meter (SUIN SS7200A, Shijiazhuang, China). The relation between the velocity of target and Doppler shift is
f d = 2 f R F v / c
where f d is Doppler shift, f R F is RF frequency, and c is the speed of light.
In experiments, the sawtooth wave frequencies are set from 0.895 kHz to 8.950 kHz in steps of 0.895 kHz, and the slope is also changed from positive to negative directions. According to Equation (12), the corresponding simulated velocities are from 20.0 km/h to 200.0 km/h (positive slope), and from −200.0 km/h to −20.0 km/h (negative slope). After being received by the traffic speed radar, a general-purpose frequency counter (SP3386) is used to measure the Doppler frequency signal. The measurement results are shown in Figure 6a. The simulated velocity error is shown in Figure 6b. According to the error analysis method [23], the velocity simulation error is less than 0.06 km/h, corresponding to a frequency error of 2.7 Hz.

4. Conclusions

A microwave photonics Doppler velocity simulation method is proposed based on serrodyne modulation. One sub-PM of the DP-DDMZM loads a sawtooth wave for the frequency shifting of the optical carrier, while the other three phase modulators realize the CS-DSB modulation of the RF signal. The direction of the simulated speed can be controlled by changing the slope direction of the sawtooth wave. The modulator’s half-wave voltages at low frequencies are measured, and digital pre-distortion compensation assists to improve the SSRs. The RF signal is directly coupled from the receiving antenna to the modulator RF port without any electrical device like hybrids, which guarantees a high operating bandwidth. Experimental results show that SSRs are larger than 35 dB with a frequency shift of 0.1 kHz–1 MHz, and the RF operating bandwidth covers 2–40 GHz. The Doppler velocity simulation accuracy is evaluated, and the simulation velocity error is less than 0.06 km/h. The proposed method has a wide range of application potential in the field of metrology and electronic warfare.

Author Contributions

Conceptualization, Z.L. and Y.W.; methodology, Z.L.; software, Z.L.; validation, Z.L., Y.Z. and J.Y.; formal analysis, Z.L. and J.Z.; investigation, Z.L. and J.Z.; resources, D.W., W.Z. and Y.W.; data curation, Z.L. and J.Z.; writing—original draft preparation, Z.L.; writing—review and editing, Z.L. and Y.W.; visualization, Z.L., Y.Z. and J.Y.; supervision, D.W., W.Z. and Y.W.; project administration, D.W. and Y.W.; funding acquisition, Y.W. and D.W. All authors have read and agreed to the published version of the manuscript.

Funding

This research was supported in part by the National Natural Science Foundation of China under Grants 62275008 and 62220106005.

Institutional Review Board Statement

Not applicable.

Informed Consent Statement

Not applicable.

Data Availability Statement

Data are not publicly available due to restriction access.

Conflicts of Interest

The authors declare no conflicts of interest.

References

  1. Du, L.; Sun, Q.; Bai, J.; Wang, X.; Xu, T. Speed calibration and traceability for train-borne 24 GHz continuous-wave Doppler radar sensor. Sensors 2020, 20, 1230. [Google Scholar] [CrossRef] [PubMed]
  2. Shao, J.; Chen, W.; Shen, X.; Pan, J.; Zhao, C.; Zhao, C. Development of Verification Device for Multitarget Radar Development of Verification Device for Multitarget Radar. J. Sens. 2022, 2022, 7365881. [Google Scholar]
  3. Du, L.; Sun, Q.; Cai, C.; Bai, J.; Fan, Z.; Zhang, Y. A vehicular mobile standard instrument for field verification of traffic speed meters based on dual-antenna doppler radar sensor. Sensors 2018, 18, 1099. [Google Scholar] [CrossRef] [PubMed]
  4. Cumming, R.C. The serrodyne frequency translator. Proc. IRE 1957, 45, 175–186. [Google Scholar] [CrossRef]
  5. Guan, Z.; Chen, Y.; Lei, P.; Li, D.; Zhao, Y. Application of hash function on fmcw based millimeter-wave radar against DRFM jamming. IEEE Access 2019, 7, 92285–92295. [Google Scholar] [CrossRef]
  6. Wang, C.; Hu, W.; Geng, Z.; Zhang, J.; Zhu, D. Parameter estimation for interrupted sampling repeater jamming based on ADMM. Sensors 2021, 21, 8277. [Google Scholar] [CrossRef] [PubMed]
  7. Wu, Z.; Grbic, A. Serrodyne Frequency Translation Using Serrodyne Frequency Translation Using. IEEE Trans. Antennas Propag. 2020, 68, 1599–1606. [Google Scholar] [CrossRef]
  8. Liu, W.; Meng, J.; Zhou, L. Impact analysis of DRFM-based active jamming to radar detection efficiency. J. Eng. 2019, 2019, 6856–6858. [Google Scholar] [CrossRef]
  9. Mehdizadeh, F.; Soroosh, M.; Alipour-Banaei, H.; Farshidi, E. A novel proposal for all optical analog-to-digital converter based on photonic crystal structures. IEEE Photonics J. 2017, 9, 4700311. [Google Scholar] [CrossRef]
  10. Xu, Y.; Li, S.; Xue, X.; Xiao, X.; Zheng, X.; Zhou, B. An interleaved broadband photonic adc immune to channel mismatches capable for high-speed radar imaging. IEEE Photonics J. 2019, 11, 5502009. [Google Scholar] [CrossRef]
  11. Yao, J. Microwave photonic systems. J. Lightw. Technol. 2022, 40, 6595–6607. [Google Scholar] [CrossRef]
  12. Pan, S.; Ye, X.; Zhang, Y.; Zhang, F. Microwave photonic array radars. IEEE J. Microw. 2021, 1, 176–190. [Google Scholar] [CrossRef]
  13. Nguimdo, R.M.; Saleh, K.; Coillet, A.; Lin, G.; Martinenghi, R.; Chembo, Y.K. Phase Noise Performance of Optoelectronic Oscillators Based on Whispering-Gallery Mode Resonators. IEEE J. Quantum Electron. 2015, 51, 6500308. [Google Scholar] [CrossRef]
  14. Lu, Z.H.; Charrett, T.; Ford, H.; Tatam, R. Mach–Zehnder interferometric filter based planar Doppler velocimetry (MZI-PDV). J. Opt. A Pure Appl. Opt. 2007, 9, 1002. [Google Scholar] [CrossRef]
  15. Huang, L.; Li, R.; Chen, D.; Xiang, P.; Wang, P.; Pu, T.; Chen, X. Photonic downconversion of RF signals with improved conversion efficiency and SFDR. IEEE Photonics Technol. Lett. 2016, 28, 880–883. [Google Scholar] [CrossRef]
  16. Wang, Y.; Li, J.; Zhou, T.; Wang, D.; Xu, J.; Zhong, X.; Yang, D.; Rong, L. All-optical microwave photonic downconverter with tunable phase shift. IEEE Photonics J. 2017, 9, 5503408. [Google Scholar] [CrossRef]
  17. Yang, F.; Wang, D.; Wang, Y.; Chen, Z.; Zhou, T.; Yang, D.; Zhong, X.; Zhang, H. Photonics-assisted frequency up/down conversion with tunable OEO and phase shift. J. Lightw. Technol. 2020, 38, 6446–6457. [Google Scholar] [CrossRef]
  18. Tang, Z.; Pan, S. A filter-free photonic microwave single sideband mixer. IEEE Microw. Wirel. Compon. Lett. 2016, 26, 67–69. [Google Scholar] [CrossRef]
  19. Winnall, S.T.; Lindsay, A.C.; Knight, G.A. A wide-band microwave photonic phase and frequency shifter. IEEE Trans. Microw. Theory Tech. 1997, 45, 1003–1006. [Google Scholar] [CrossRef]
  20. McDermitt, C.S.; Bucholtz, F. RF frequency shifting via optically switched dual-channel PZT fiber stretchers. IEEE Trans. Microw. Theory Tech. 2005, 53, 3782–3787. [Google Scholar] [CrossRef]
  21. Chen, Z.; Zhong, X.; Liu, J.; Li, W.; He, Z.; Wang, M.; Chen, J.; Zhou, T. A serrodyne frequency translator with wide-band and high precision based on paralleled PM and DP-MZM. Proc. SPIE 2019, 11068, 1106813. [Google Scholar]
  22. Huang, C.; Chan, E.H.W. Photonics-based serrodyne microwave frequency translator with large spurious suppression and phase shifting capability. J. Lightw. Technol. 2021, 39, 2052–2058. [Google Scholar] [CrossRef]
  23. Salzenstein, P.; Pavlyuchenko, E. Uncertainty Evaluation on a 10.52 GHz (5 dBm) Optoelectronic Oscillator Phase Noise Performance. Micromachines 2021, 12, 474. [Google Scholar] [CrossRef] [PubMed]
Figure 1. Diagram of the proposed microwave photonics Doppler velocity simulator.
Photonics 11 00357 g001
Figure 2. Half-wave voltage measurement method.
Photonics 11 00357 g002
Figure 3. (a) Uncorrected waveform, (b) corrected waveform, (c) half-wave voltage frequency response curve, spectra with a frequency shift of (d) 100 Hz and (e) 200 Hz.
Photonics 11 00357 g003
Figure 4. Spectra with frequency shifts of (a) 10 kHz, (b) 100 kHz, and (c) 1 MHz. (d) Variation of SSRs with RF frequency at 10 kHz frequency shift.
Photonics 11 00357 g004aPhotonics 11 00357 g004b
Figure 5. Frequency response of the system at 2–40 GHz.
Photonics 11 00357 g005
Figure 6. (a) Radar velocity measurement results; (b) radar velocity measurement errors.
Photonics 11 00357 g006
Disclaimer/Publisher’s Note: The statements, opinions and data contained in all publications are solely those of the individual author(s) and contributor(s) and not of MDPI and/or the editor(s). MDPI and/or the editor(s) disclaim responsibility for any injury to people or property resulting from any ideas, methods, instructions or products referred to in the content.

