Abstract
In the fringe projection profilometry (FPP), the traditional phase-shifting (TPS) algorithm and the Fourier transform (FT) algorithm are beset with a conundrum where measurement efficiency and conflicts with measurement accuracy, thereby limiting their application in dynamic three-dimensional (3D) measurements. Here, we propose a phase shift generation (PSG) method, which acquires the sinusoidal fringes by sparse sampling and reconstructs the complete phase-shifting sequence by generating the missing fringes with superimposed coupling of adjacent fringes. According to our proposed PSG method in which the sinusoidal fringe sequence size is about half of the TPS method, meaning that the PSG method will be timesaving in the phase-shifting sequence sampling process. Moreover, because of the utilization of multiframe fringes, our PSG method allows for a more accurate measurement than the FT method. Both simulation and experimental results demonstrate that our proposed PSG method can well balance the measurement accuracy and efficiency with a lower sampling rate, bearing a great potential to be applied in both scientific and industrial areas.
1. Introduction
Fringe projection profilometry (FPP) is widely used in the area of reverse engineering [1,2], 3D surface topography [3,4], biological medicine [3], etc., due to its advantages of noncontact, efficiency, and high precision. However, with the increasing demand for dynamic 3D measurements [5,6,7,8], FPP technology is also encountering some new challenges.
The single-shot coding methods such as Bruijn sequences [9], M-arrays [10], and color speckle patterns [11,12] just need one single frame for surface reconstruction and are suitable for dynamic measurement. However, these methods require a well-designed pattern to encode each pixel using its surrounding pixels, which will lead to a decreasing resolution. The multiframe methods [13,14,15] project a series of fringe patterns onto the tested surface for phase calculation, which can obtain high precision and robustness due to the fusion of multiframe information and the independent solution for each pixel. Among the multiframe methods, the traditional phase-shifting (TPS) [1,3,16] algorithm is most widely used, which requires at least three fringe patterns for phase calculation. Nevertheless, these methods are more appropriate for static scenes due to the large size of fringe sequences.
In contrast, the transform-based methods [17,18,19,20,21,22] (e.g., FT, window Fourier transform, and wavelet transform) just need one single fringe for phase calculation by spatial or frequency domain analysis. The FT [17,18] method is the most representative transform method, which is well-suited for high-speed 3D measurement. Nevertheless, the FT method has the inherent problem of spectrum leakage that will influence its precision in dynamic scenes. So, the discrepancy between TPS and FT methods makes it difficult to measure the dynamic 3D object with high precision and high efficiency simultaneously. To resolve this problem, related research has been conducted and many improvements have been made.
Zhang [23] and Liu [24] realized the accurate and real-time dynamic 3D measurement by utilizing the high-speed projection system. Wang [25] proposed a period-coded phase-shifting strategy to assist phase unwrapping, in which no additional fringe sequence is needed and the efficiency of the TPS method is improved. Zhang [26] used color CCD to capture the phase-shifting sequence coded with different colors, improving the measurement efficiency. In addition, the projector defocusing technique [27] was also applied in the high-speed projection system, such as the laser eavesdropping system, to improve the measurement efficiency. However, these methods usually required expensive devices, which significantly increased measurement costs.
The improvements in algorithms are also important for dynamic 3D measurement. Kemao [19] et al. introduced the window Fourier transform (WFT) method to enhance the measurement robustness for FPP. However, it was difficult to accurately measure some complicated surfaces using this method, due to the interference of spectrum noise related to the complex surface characteristics. Guo and Huang [28] et al. proposed an improved FT method, which removed the noise signal by subtracting the background image from the original fringe pattern, and enhanced the measurement robustness for the FT method. Nevertheless, this method reduced the measurement efficiency and was also influenced by the inherent problem of spectrum leakage for the FT method. Zuo Chao [5] et al. proposed a micro FT (μFT) method with 10,000 fps speed but it was also difficult to measure the surface with a sharp edge and local spike characteristics due to the restriction of a band-pass filter. Furthermore, the hybrid method of FT and TPS is proposed to process fast-motion and slow-motion regions, respectively, which, however, requires a segmentation of such fast and slow regions [29,30]. In addition, all the transform methods must carefully design the parameters for the filtering window or the scale of the wavelet to ensure measurement accuracy. Thus, it is hard to realize automatic processing in complex dynamic scenes.
Recently, deep learning technique was introduced into FPP due to its excellent performance in image processing. Zhong [31] et al. proposed a structured-light 3D measurement method based on machine learning, which only needed one single fringe pattern for phase solution and was potentially applied for real-time measurement. Zhang [32] et al. designed a special convolutional neural network (CNN) to enable fast 3D reconstruction from saturated or dark images, which could extract phase information in both the low signal-to-noise ratio (SNR) and saturation situations. Yu [33] et al. utilized an image-transformed neural network to generate the phase-shifting fringe sequence from a single fringe pattern, which omitted the phase-shifting sampling process with the advantage of reducing measurement error related to motion [34,35]. Feng [36] et al. proposed a micro deep learning method, which predicted the wrapped phase from a single fringe pattern and performed time-domain phase unwrapping according to micro change of the fringe frequency, with the highest efficiency of 20,000 fps. Qian [37] et al. applied the deep learning method to color FPP, which realized the accurate phase forecast and phase unwrapping according to the RGB fringes from a single pattern. Although deep learning methods have the advantage of high efficiency in the phase solution process for FPP, they could not provide a rigorous theory to assure accuracy when compared with the TPS method. Thus, the TPS method still kept an accuracy advantage in the calculation of some complex surfaces.
In this paper, a phase shift generation (PSG) method, which combines the advantages of high accuracy of TPS and high efficiency of image acquisition, is proposed for dynamic 3D measurement based on FPP. This method acquires the abridged fringe sequence by sparse sampling and reconstructs the complete fringe sequence through PSG with a detailed description in Section 2. The proposed method can obtain almost double sampling efficiency in terms of phase-shifting sequence when compared with the TPS method and the measurement accuracy is also better than the FT method. Both simulation and experiments are carried out to demonstrate that the proposed PSG method can make a trade-off between measurement accuracy and efficiency and improve the dynamic measurement characteristic for TPS method.
2. Basic Theory
2.1. PSG Method
For a complete phase-shifting fringe sequence of length N, the signal model of corresponding sparse sampling sequence can be expressed as
where denotes the signal intensity of odd image series n at point denotes the background signal, denotes the modulation, denotes the frequency of projected sinusoidal gratings, and denotes the phase information related to the measured surface. One-dimension grating is considered here for simplified analysis. Compared to the TPS sequence, the sparse sampling fringes just contain the odd sequence, in which the length is about half of the complete phase-shifting fringe sequence.
In the static or high-speed scenes, the background signal and modulation keep constant or vary slowly, both of which can be assumed as constants:
To generate the missing even phase-shifting sequence, a superimposed coupling method is applied to the adjacent images of sparse-sampling sequence as follows:
Here, m denotes the even PSG fringe series number. Obviously, the PSG sequence and sparse-sampling sequence complement with each other and make it possible to reconstruct the complete phase-shifting sequence.
Subtracting from Equations (1) and (3) and eliminating the factor for Equation (3), we can obtain the sinusoidal frequency components with modulation
Here, the background signal can be obtained by extra sampling of black and white projection [38] and can be determined by the sequence length N.
Next, a normalization procedure is performed for Equation (4) and the sinusoidal frequency components can be acquired as follows:
where denote the function of minimum and maximum extraction, respectively. Finally, we apply the phase shift algorithm [39] to the reconstructed sequence and the surface can be calculated as follows:
where denotes the wrapped phase with phase ambiguity, requiring the phase unwrapping process to obtain the surface [40].
2.2. Simulation Analysis
Considering the typical peaks function [used in Matlab] as a prototype, the simulation phase map is defined as follows:
where the fringe period is set as 20 pixels, the ratio factor , and the image size is set as 512 × 512. Figure 1a displays the five-step phase-shifting fringe sequence, with a background intensity and modulating amplitude as defined in Equation (8).
where , , , and . To simulate the practical sampling conditions, the fringe sequence in Figure 1a has been augmented with Guassian white noise at a SNR of 30 dB.
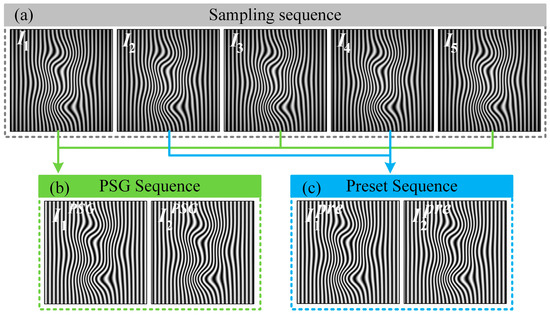
Figure 1.
Simulation for PSG process. (a) Complete phase-shifting fringe sequence; (b) PSG sequence with background removing and modulation normalization; and (c) Preset fringes corresponding to a PSG sequence with background removing and modulation normalization.
As described in Section 2.1, taking the fringe number 1, 3, and 5 in Figure 1a as the sparse-sampling sequence, whose phase-step is , the PSG sequence can be calculated, as shown in Figure 1b. In comparison, Figure 1c presents the preset sequence of PSG with background restriction and modulation normalization. Visually, these two sequences are consistent with each other. Figure 2 reveals the difference between Figure 1b,c and the root-mean-square (RMS) of the error is 0.042 and 0.043. Obviously, the PSG sequence behaves in a highly consistent manner with the preset sequence, proving the validity of PSG method for fringe sequence reconstruction.
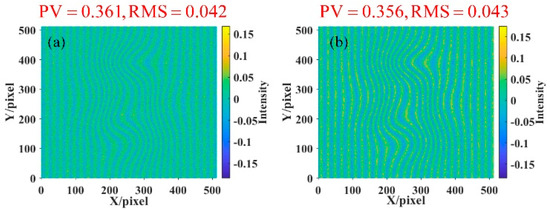
Figure 2.
Fringe errors between PSG and preset sequences. (a) for the first PSG fringe and (b) for the second PSG fringe.
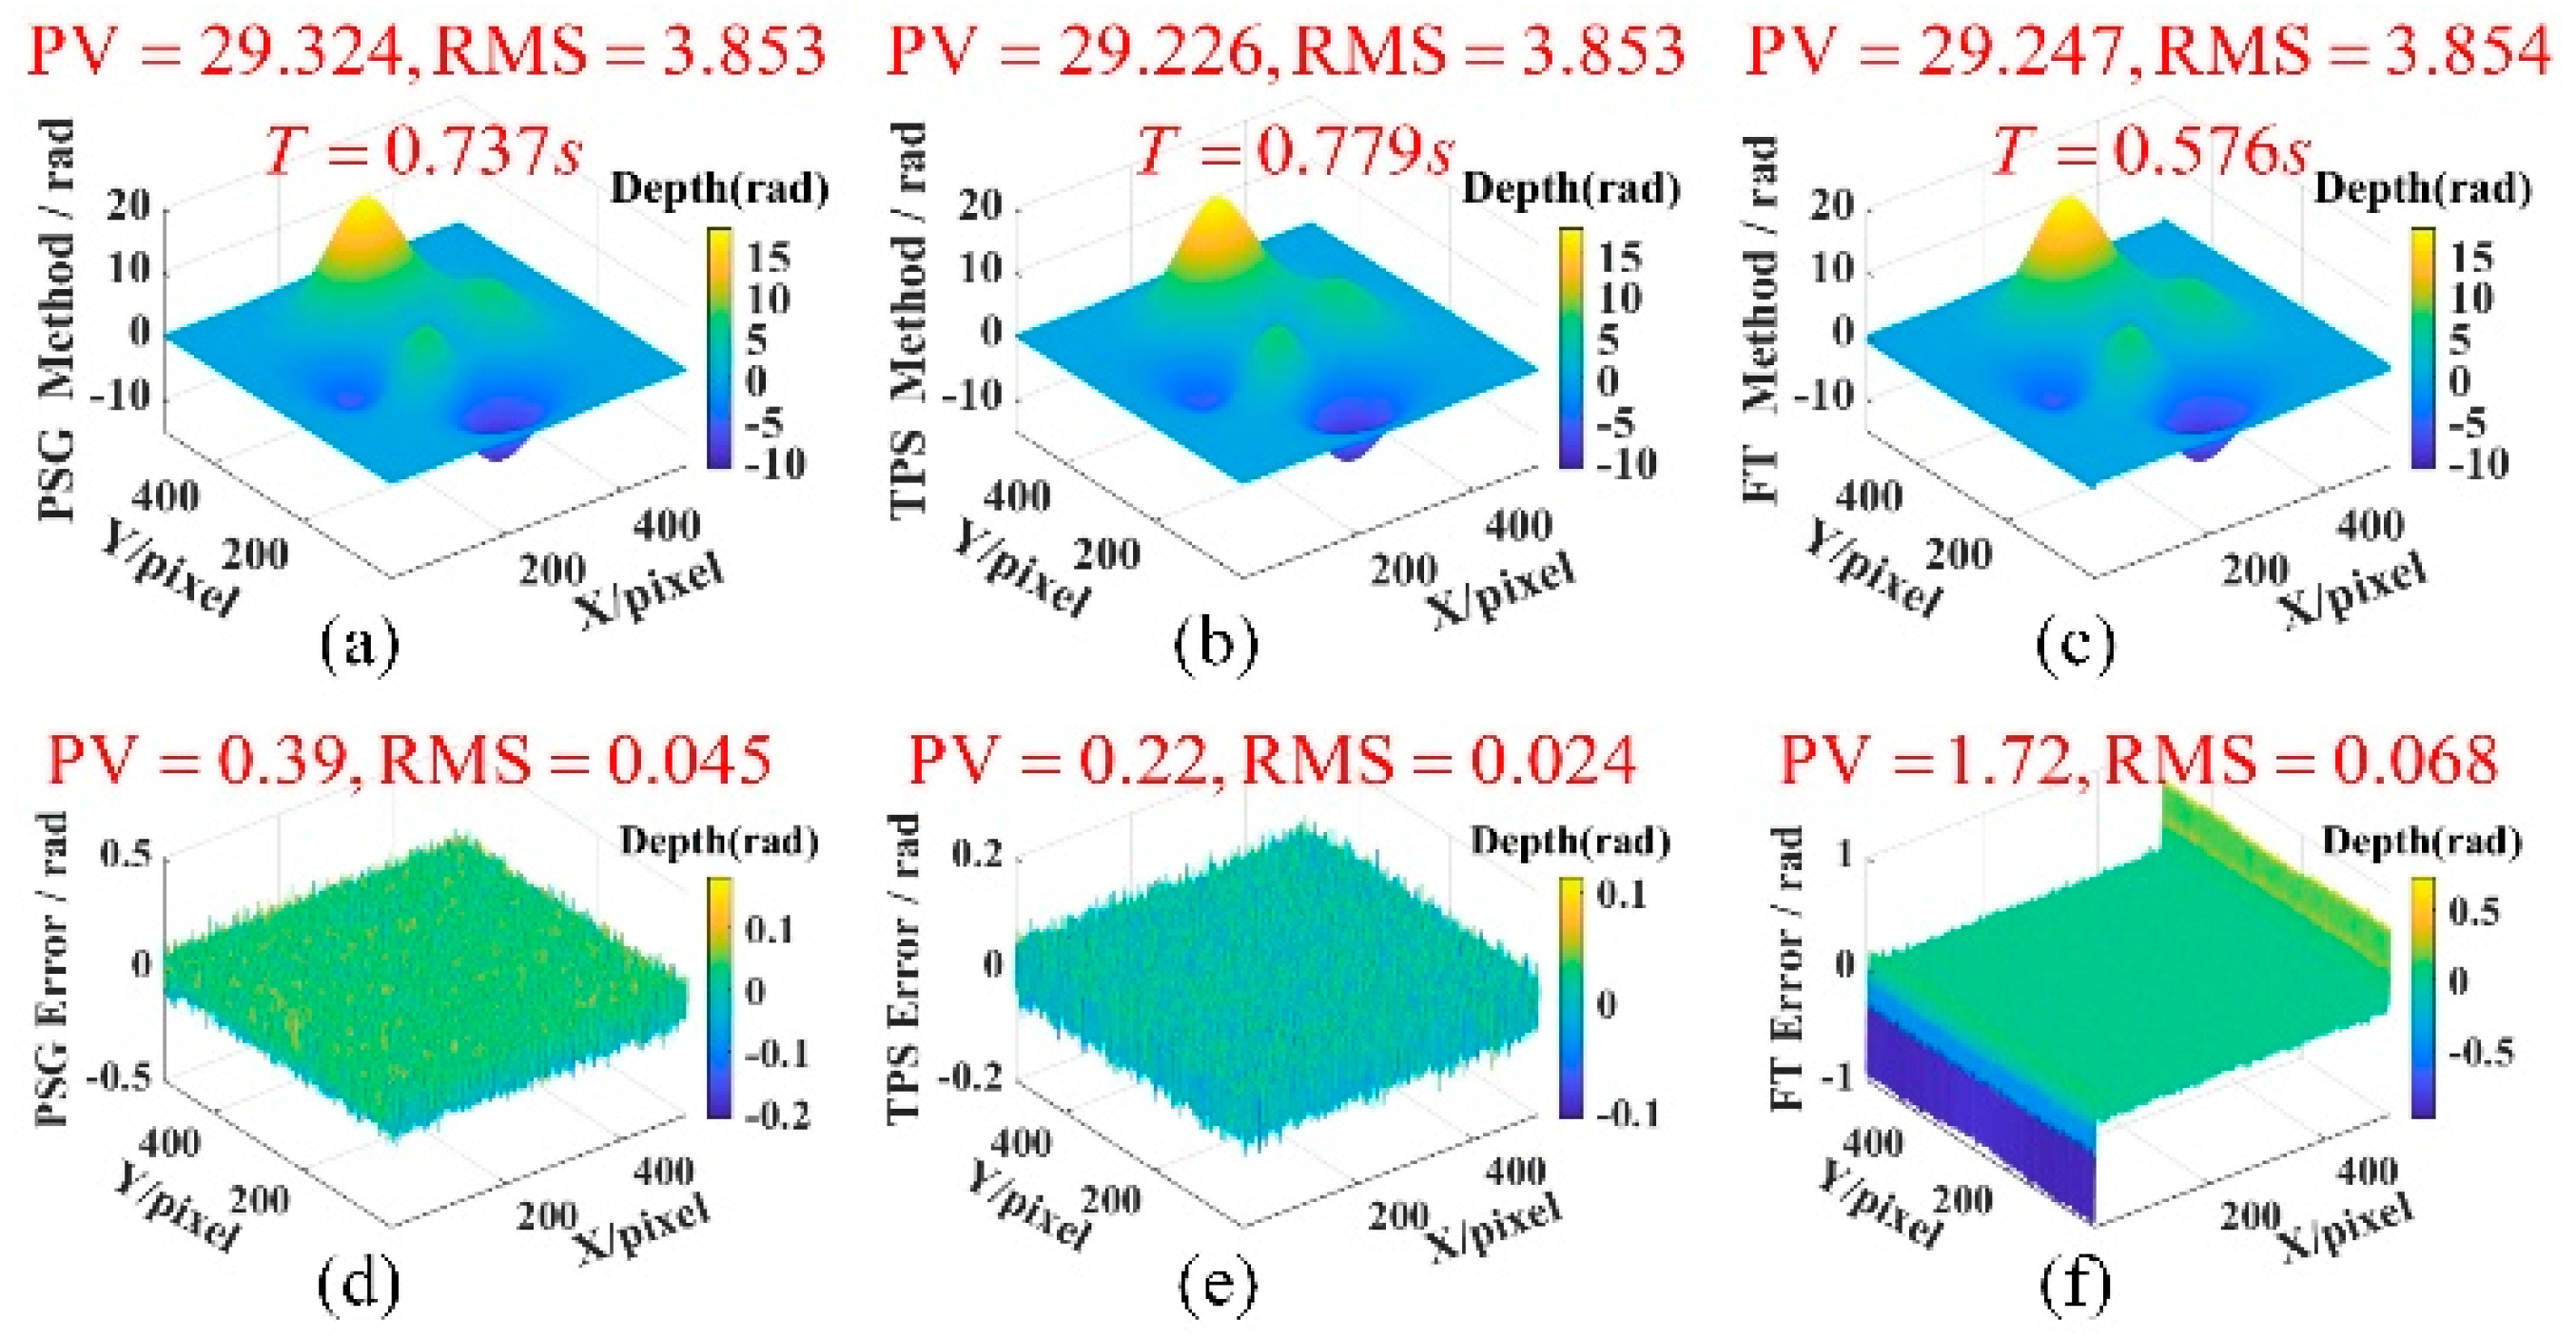
Figure 3a displays the surface measurement result of the PSG method. Here, we apply two extra white and black images to remove the background signal and utilize the gray code pattern sequence of six images for reliable phase unwrapping. As a comparison, the surfaces measured by the TPS and FT methods are also presented in Figure 3b,c, respectively. The quantitative analysis results indicate that the TPS method owns the highest measurement accuracy in which the measurement error approaches 0 and the FT method presents a large error at the edge region, in which peak-to-valley (PV) and root-mean-square (RMS) values reach 1.72 rad and 0.068 rad and the PSG method obtains an intermediate-level measurement error, in which PV and RMS are 0.39 rad and 0.045 rad. In terms of measurement efficiency, assuming a sampling frequency of 20 Hz, the time required for each frame result by the PSG, TPS, and FT methods are 0.737 s, 0.779 s, and 0.576 s, respectively. We can note that the proposed PSG method can take a shorter time than the TPS method due to the less sampling time for the phase-shifting sequence. Thus, when considering the time cost of fringes sampling, the PSG can achieve the balance between measurement accuracy and efficiency, which will also be verified in the following experiment section.

Figure 3.
Simulation results for three methods. (a–c) are the surfaces measured by PSG, TPS, and FT methods, respectively, and (d–f) correspond to the measurement errors of (a–c), respectively.
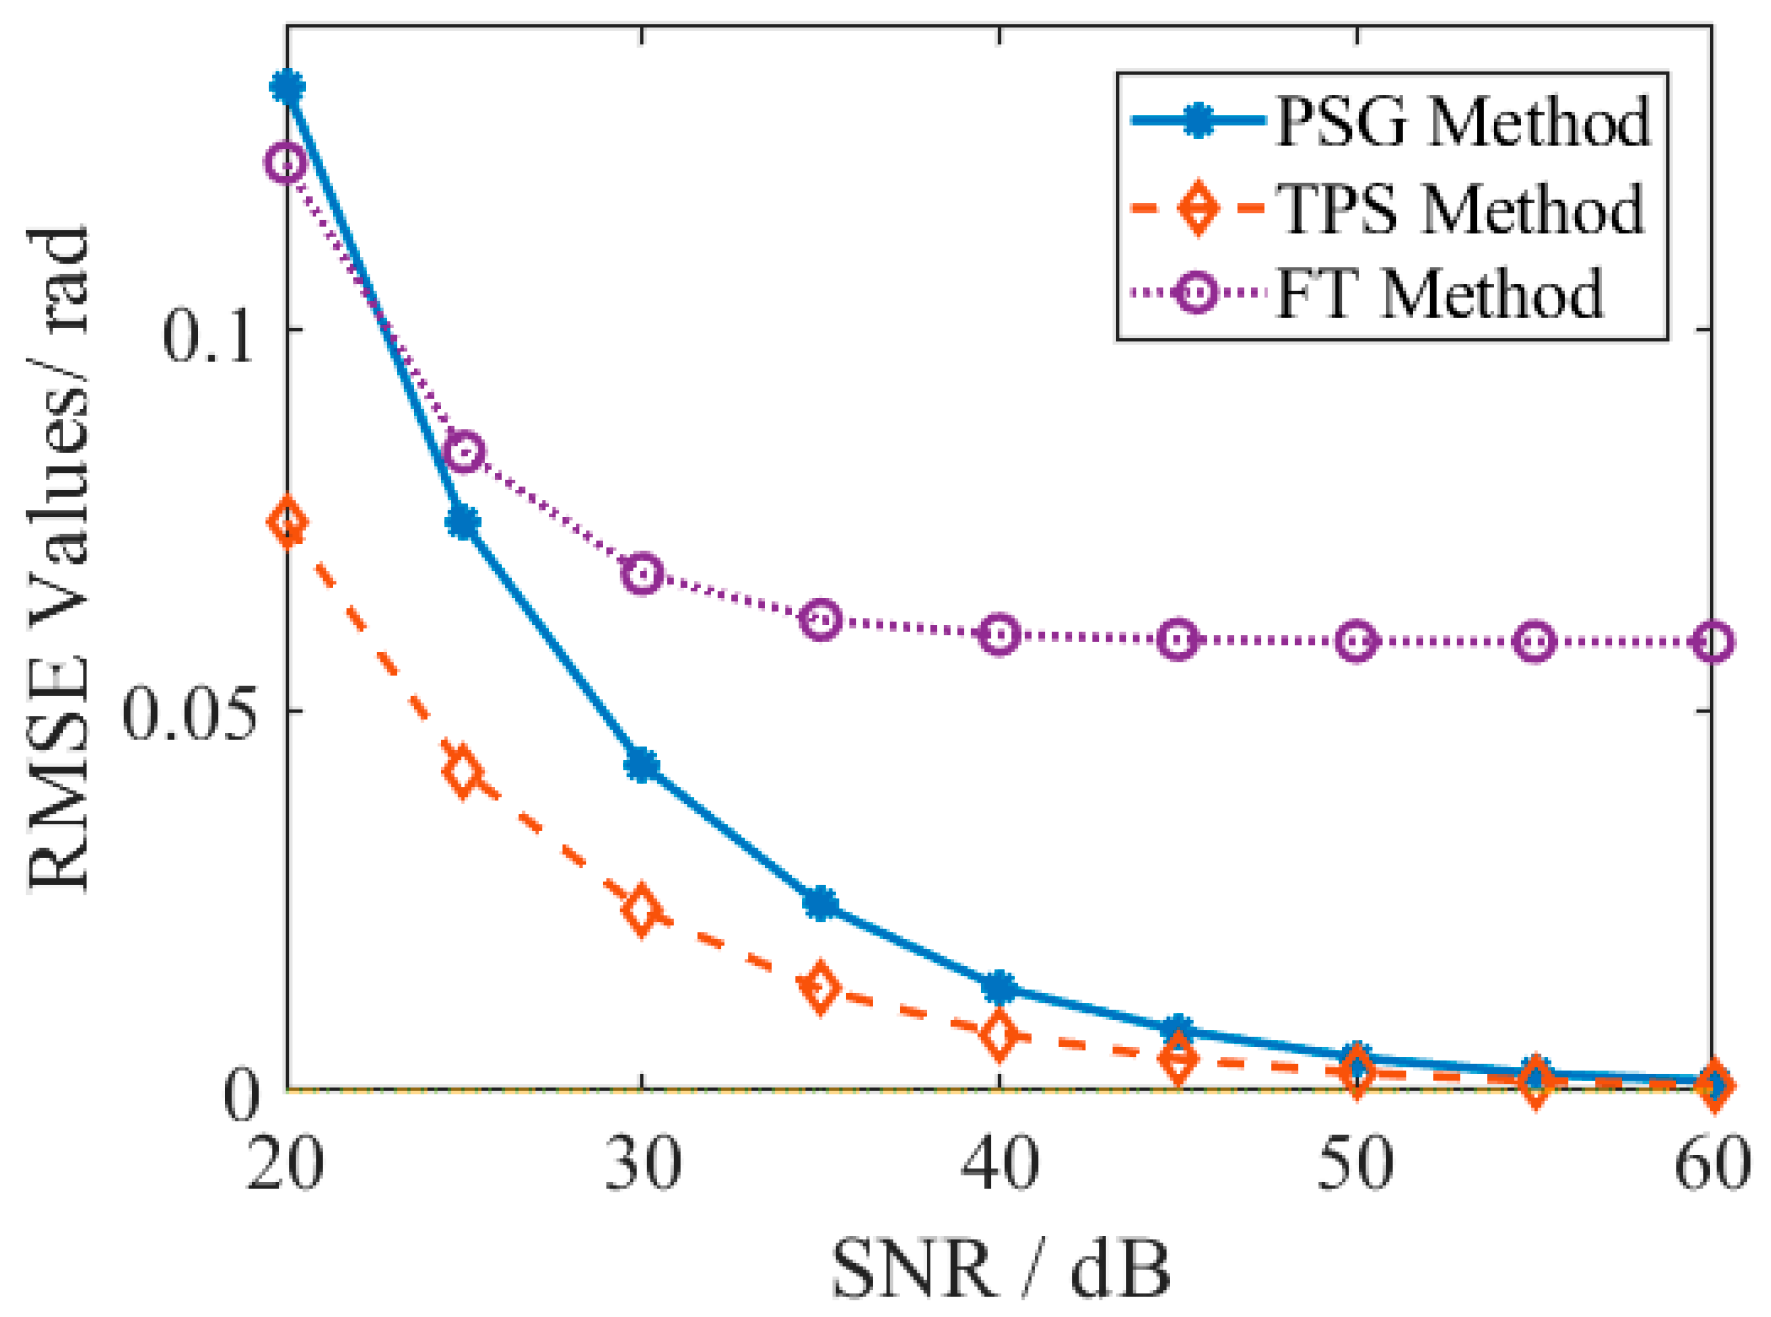
Next, the impact of noise is tested through simulation, where the SNR levels range from 20 dB to 60 dB. Figure 4 illustrates the trend in root-mean-square error (RMSE) values as the SNR increases. Notably, even at a high SNR level, the RMSE of the FT method remains significantly higher than that of both the PSG and the TPS methods, thus affirming that the measurement precision of the FT method is limited by the inherent problem of spectral leakage. In addition, under a high noise level (SNR of 20 dB), the RMSE for the PSG method is slightly elevated compared to the FT method, suggesting that a substantial noise level disrupts the phase-shift generation process, thereby reducing measurement precision. As the SNR level rises, however, the RMSE of the PSG method decreases rapidly, gradually approaching that of the TPS method. These simulation results indicate that our proposed PSG method can attain a commendable measurement precision closely approximating that of the TPS method when operating under high SNR conditions.
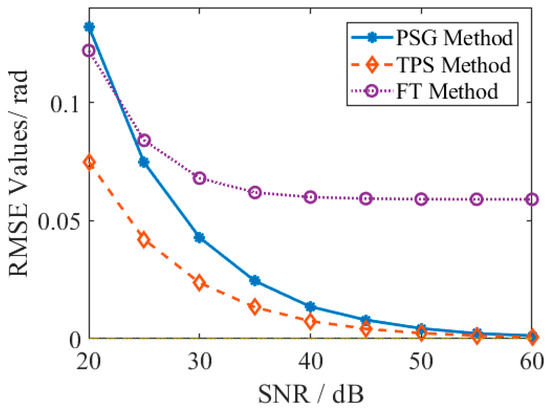
Figure 4.
Simulation analysis about measurement errors under different SNR levels.
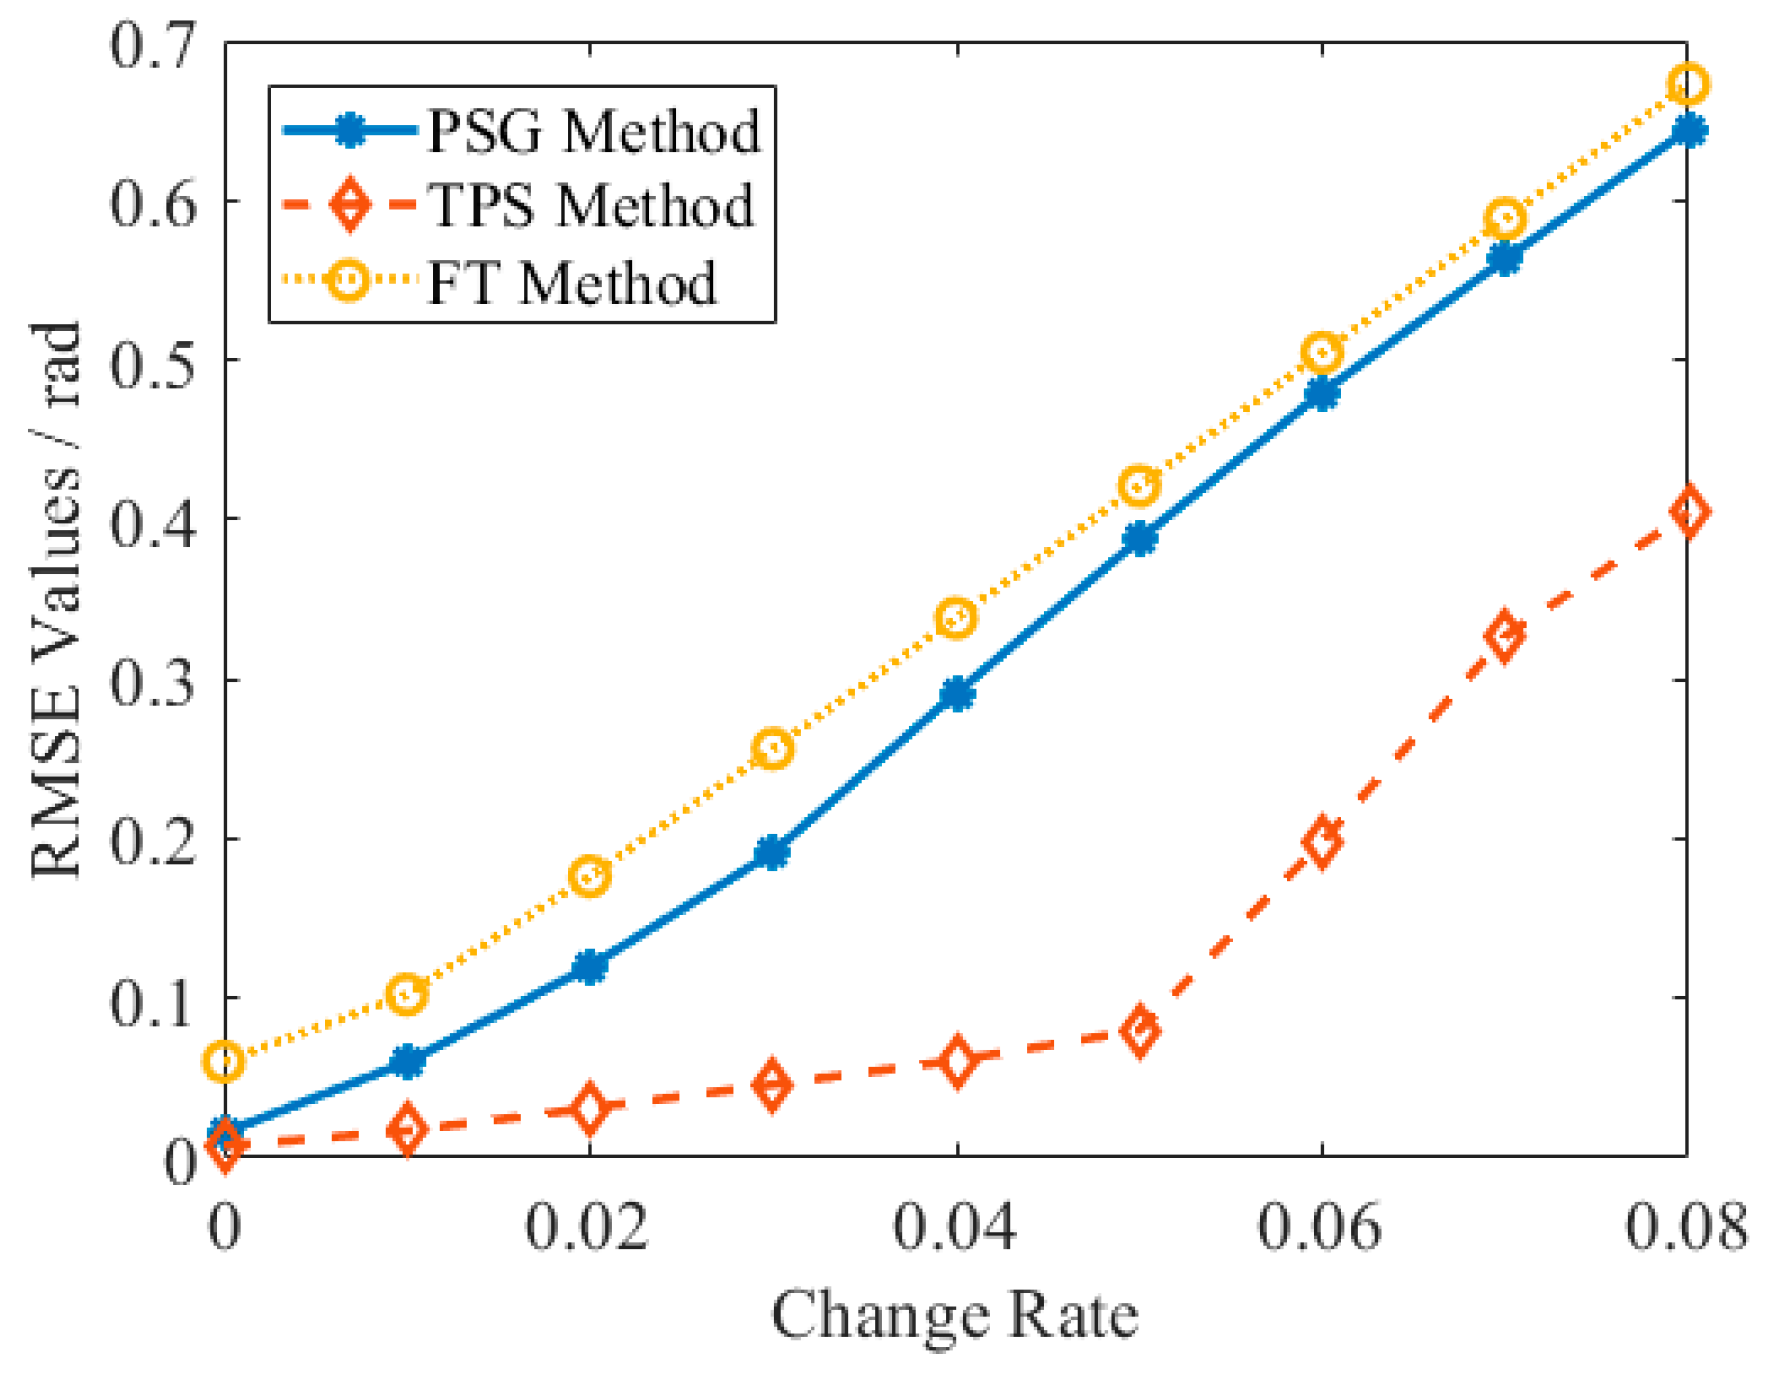
Moreover, a dynamic simulation is conducted under the SNR level of 40 dB, as depicted in Figure 5. This simulation realizes dynamic surface changes by incorporating a change rate factor into Equation (7), as expressed below
where represents the change rate, which is varied from 0 to 0.08. The RMSE curves for the three methods demonstrate that the measurement precision decreases as the dynamic change rate increases. Especially when the dynamic change rate reaches higher levels, the RMSE of the TPS method escalates rapidly and the RMSE of the PSG method also converges toward that of the FT method. These results indicate that the high-speed movement will lead to substantial motion-induced errors for the PSG and TPS methods. Overall, as the dynamic change rate increases, the RMSE values for the PSG method consistently remain between those of the FT and TPS methods. Thereby, the dynamic simulation results suggest that the proposed PSG method effectively balances measurement precision and efficiency.
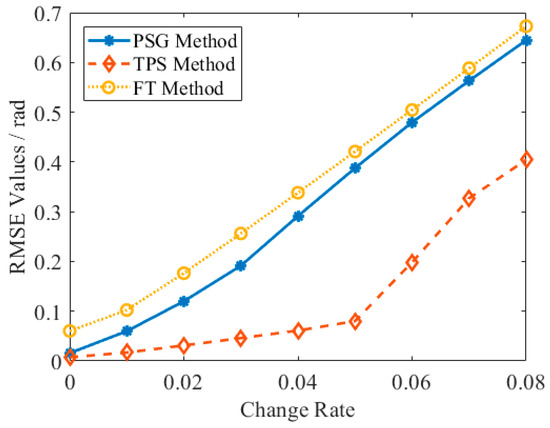
Figure 5.
RMSE analysis for dynamic simulation with the SNR of 40 dB.
3. Experiment Results
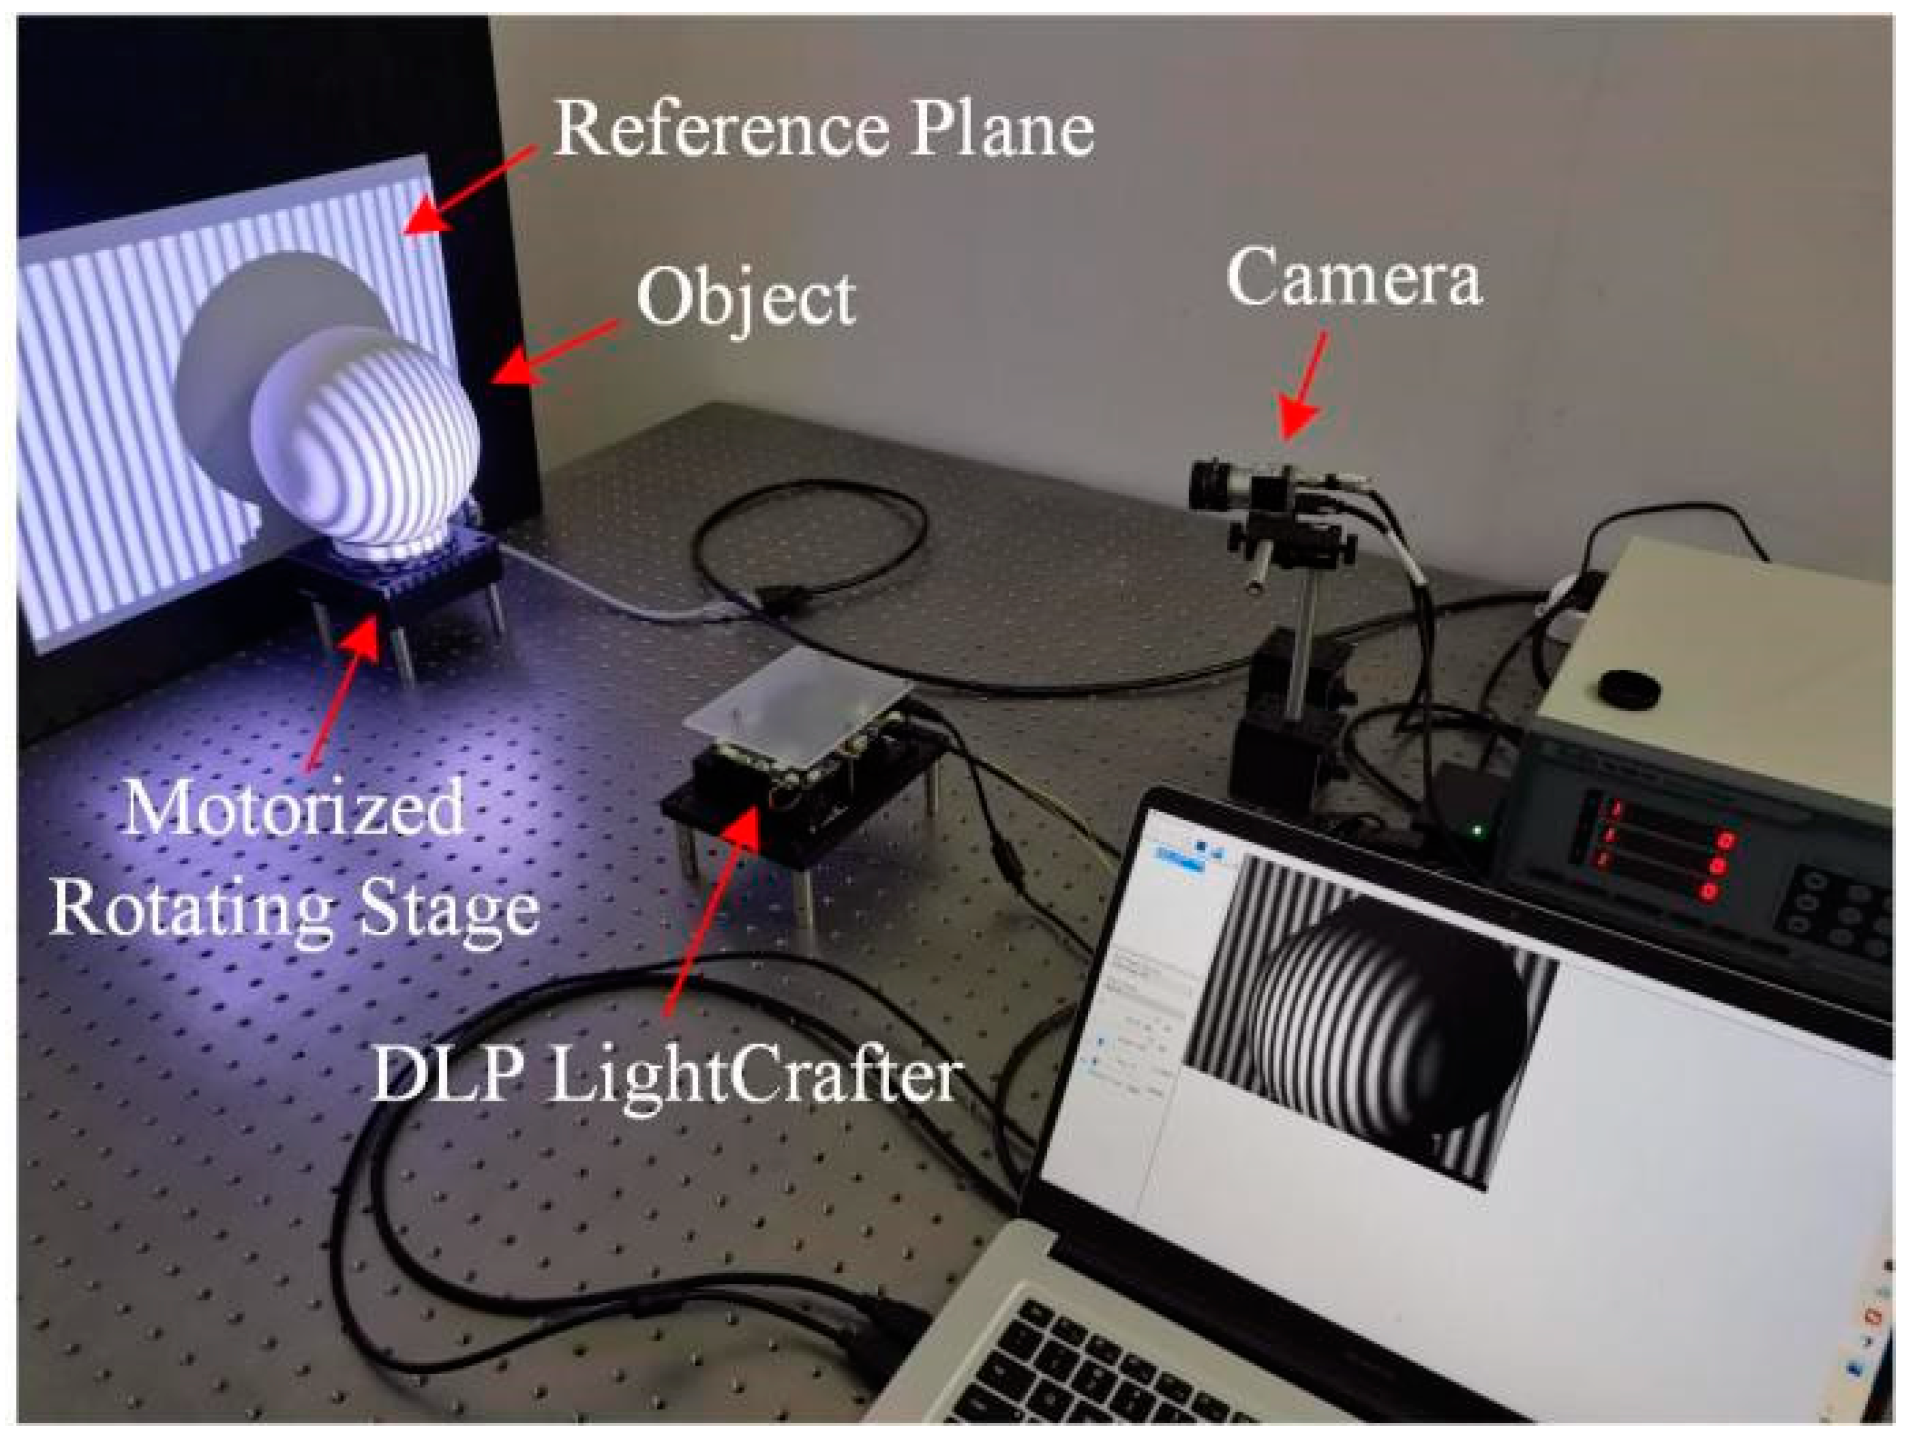
Experiments in different scenes have been conducted to test the performance of our proposed method. The measurement system includes a DLP projector (LightCrafter4500), a high-speed camera (acA640-750 μm), an objective (M0814-MP2), and a motorized rotating stage (TBR100), as exhibited in Figure 6. The projector resolution is 912 × 1140 pixels, which is used to generate sinusoidal fringes with a period of 29 pixels, corresponding to the period number of 32. The camera is set with a resolution of 640 × 480 pixels and is synchronized by an external trigger signal from the projector.
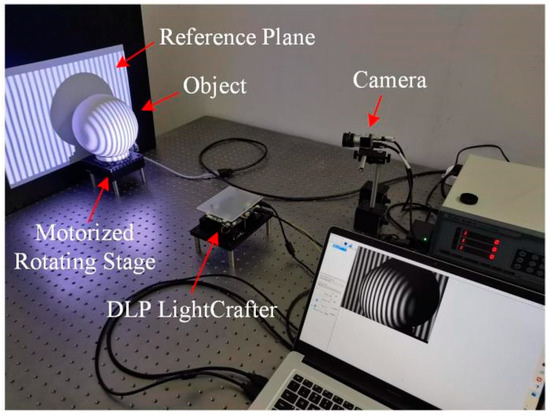
Figure 6.
Experimental system.
3.1. Static Scene Test
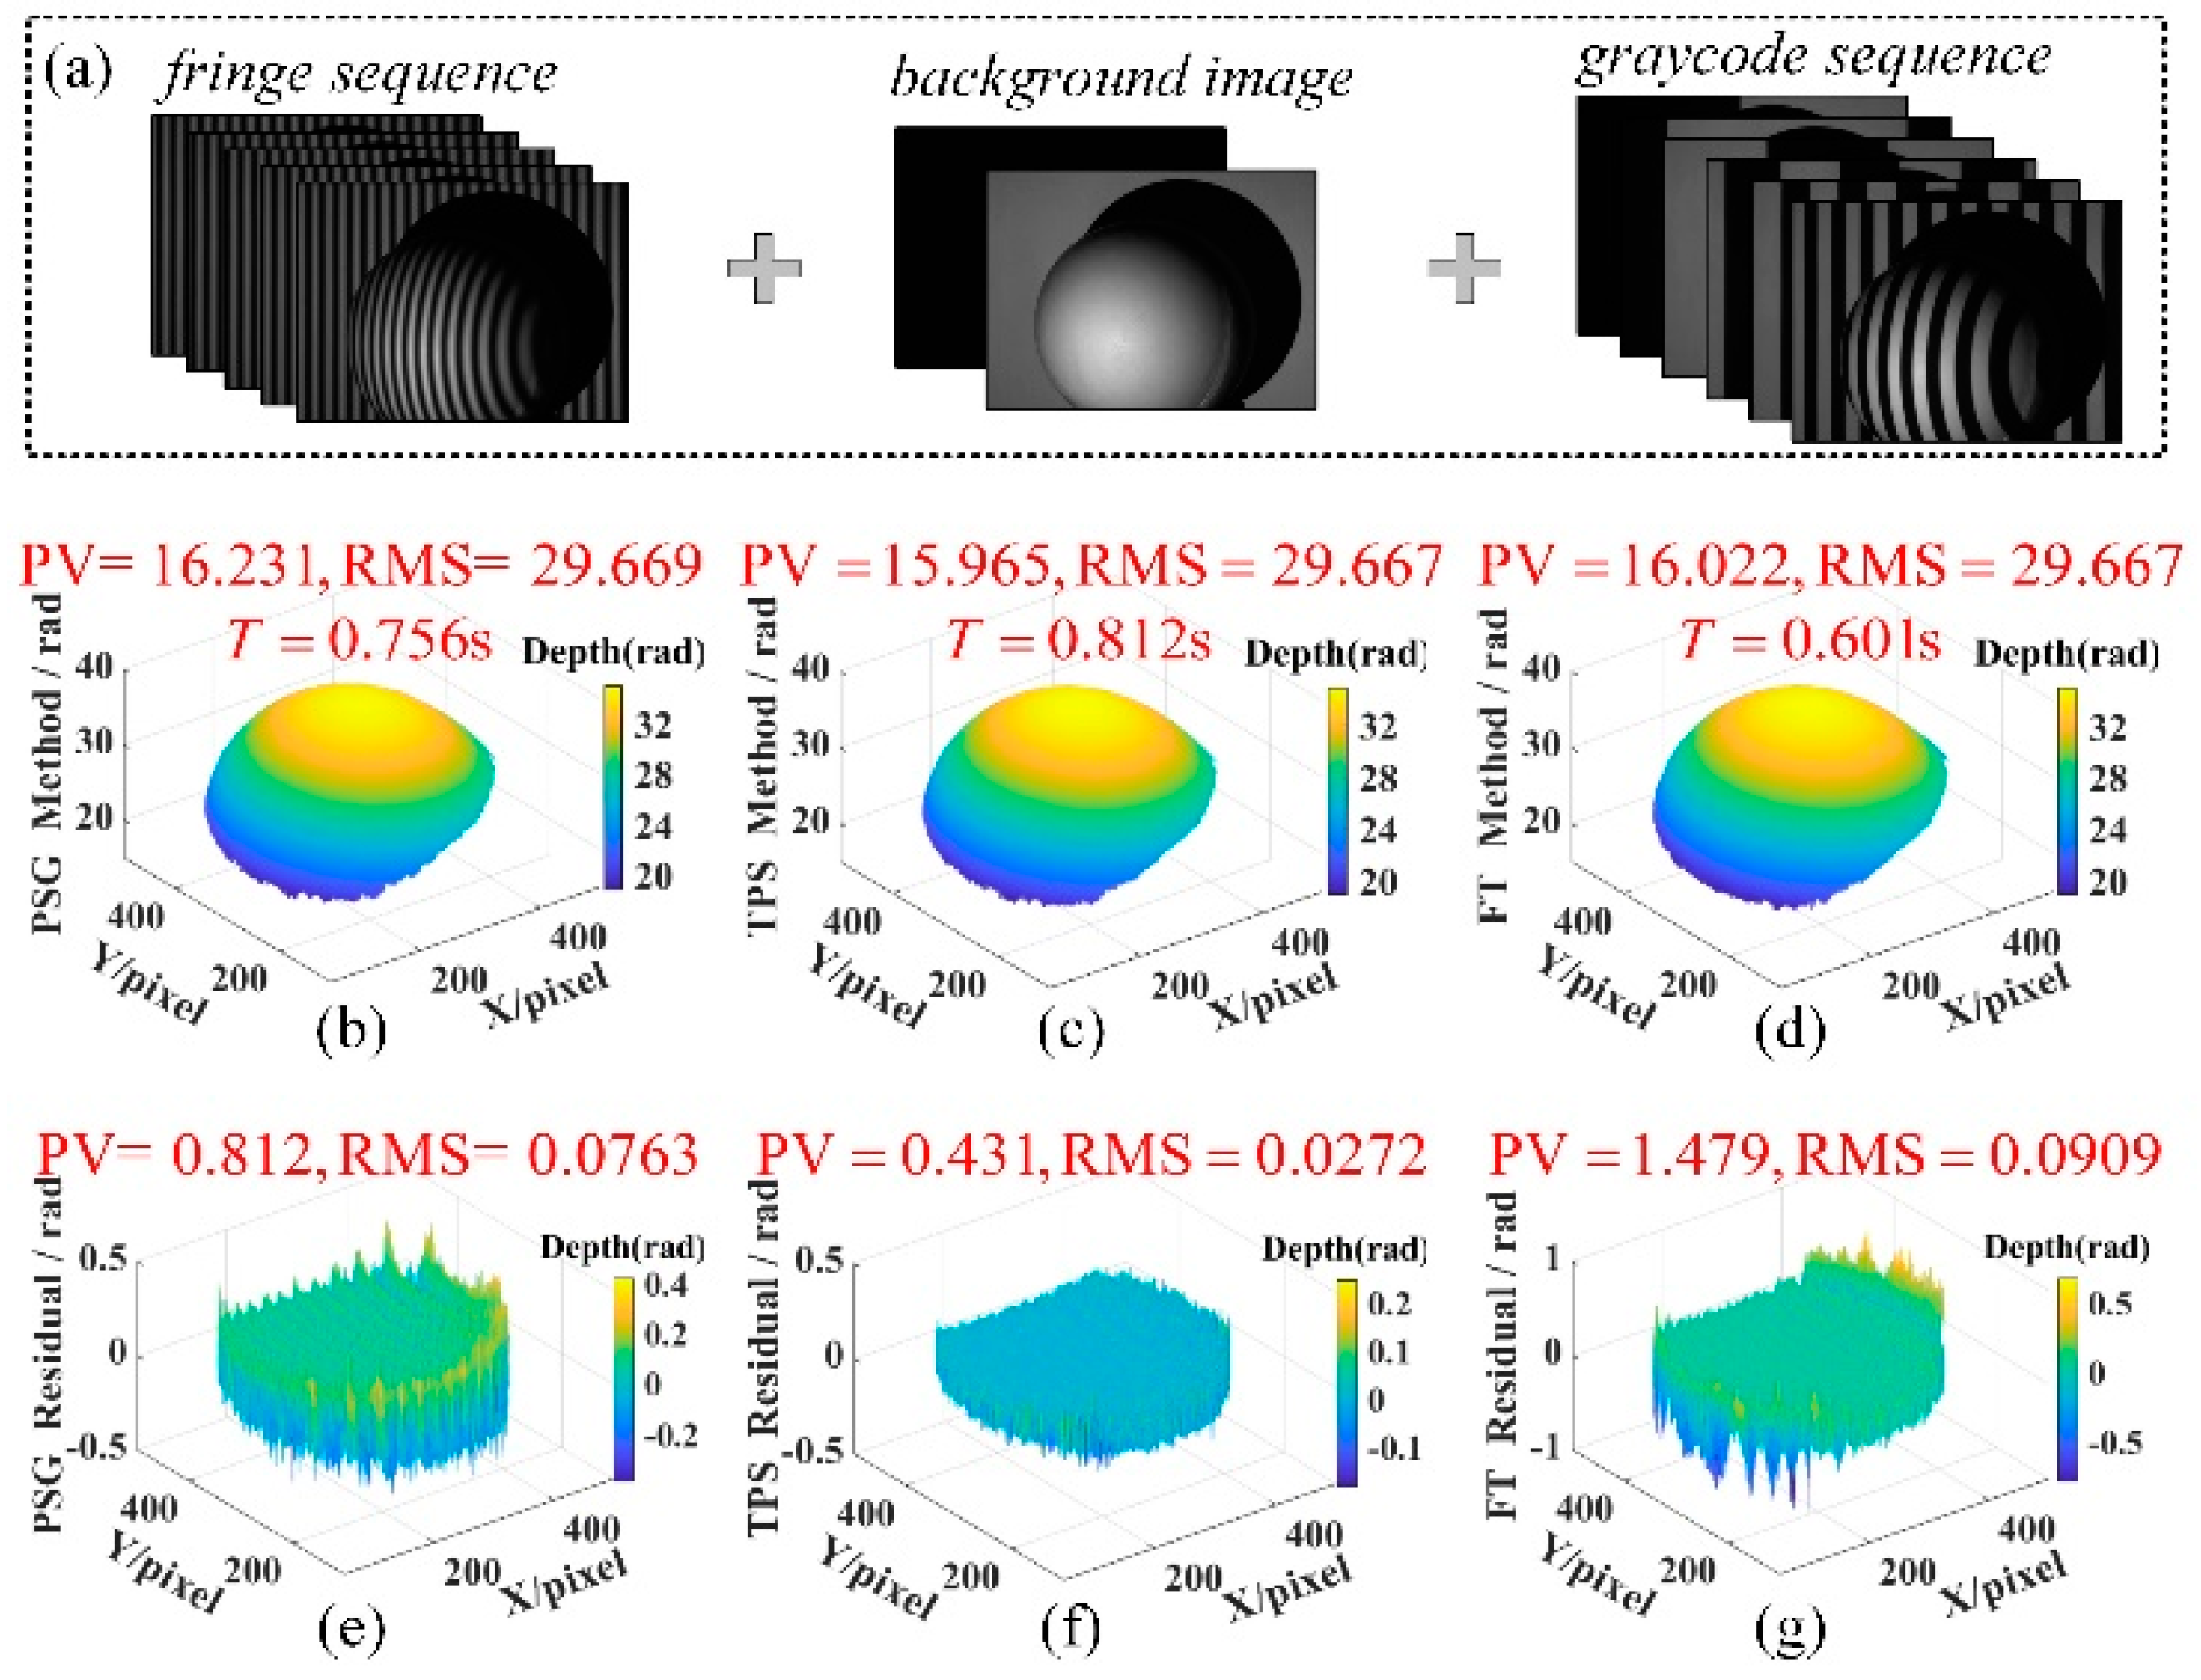
The static scene experiments adopted the projection scheme of “5-step fringe sequence + background image + gray code sequence” (as shown in Figure 7a), where the fringe sequence was used for wrapped phase calculation, the background image was applied for background restriction in Equation (4), and gray code sequence was applied for reliable phase unwrapping. The image refresh rate was set as 20 Hz. In the PSG method, fringes 1, 3, and 5 were taken as the sparse-sampling sequence to reconstruct the complete fringe sequence, which was applied for surface calculation according to Equation (6), as described in Section 2.1. In comparison, the TPS and FT methods took fringes 1 to 5 and fringe 1, respectively, to calculate the surface. In addition, these measurement results were compared with the 12-step phase-shifting algorithm results to estimate the residual errors.

Figure 7.
Experiment results for the simple spherical model. (a) is the sampled images; (b–d) are the surfaces measured by the PSG, TPS, and FT methods and (e–g) are the residual errors of (b–d), respectively.
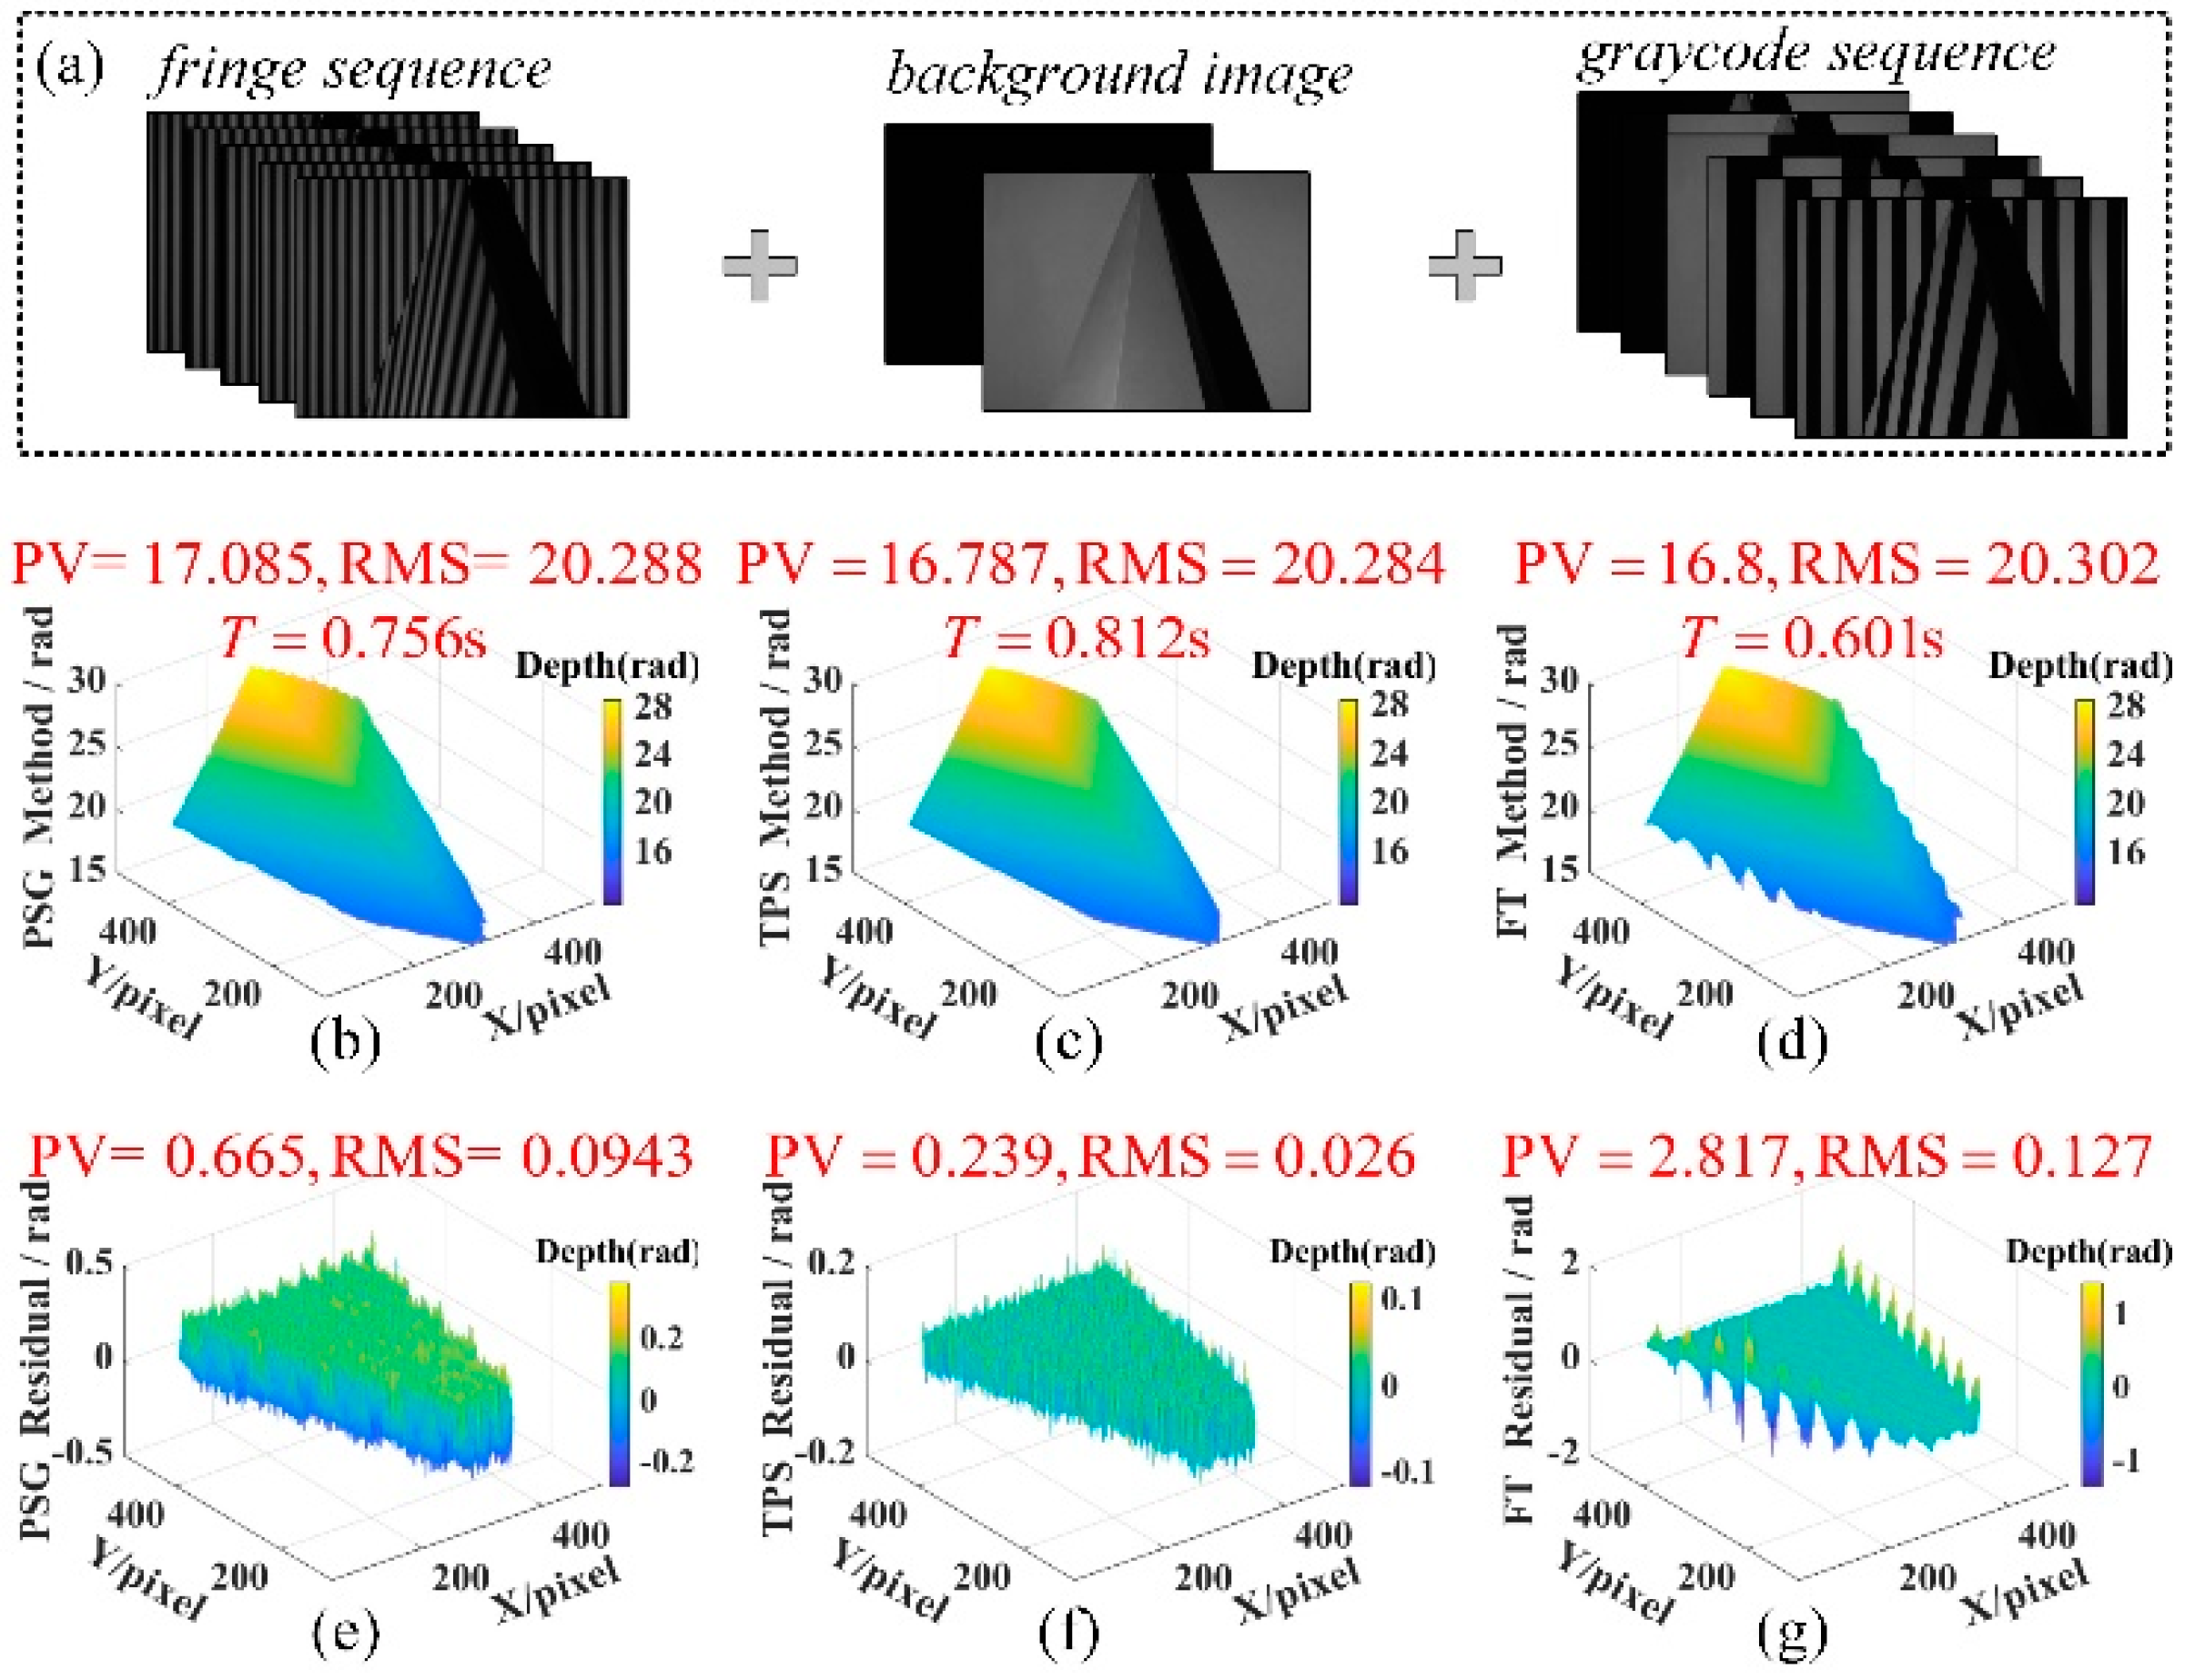
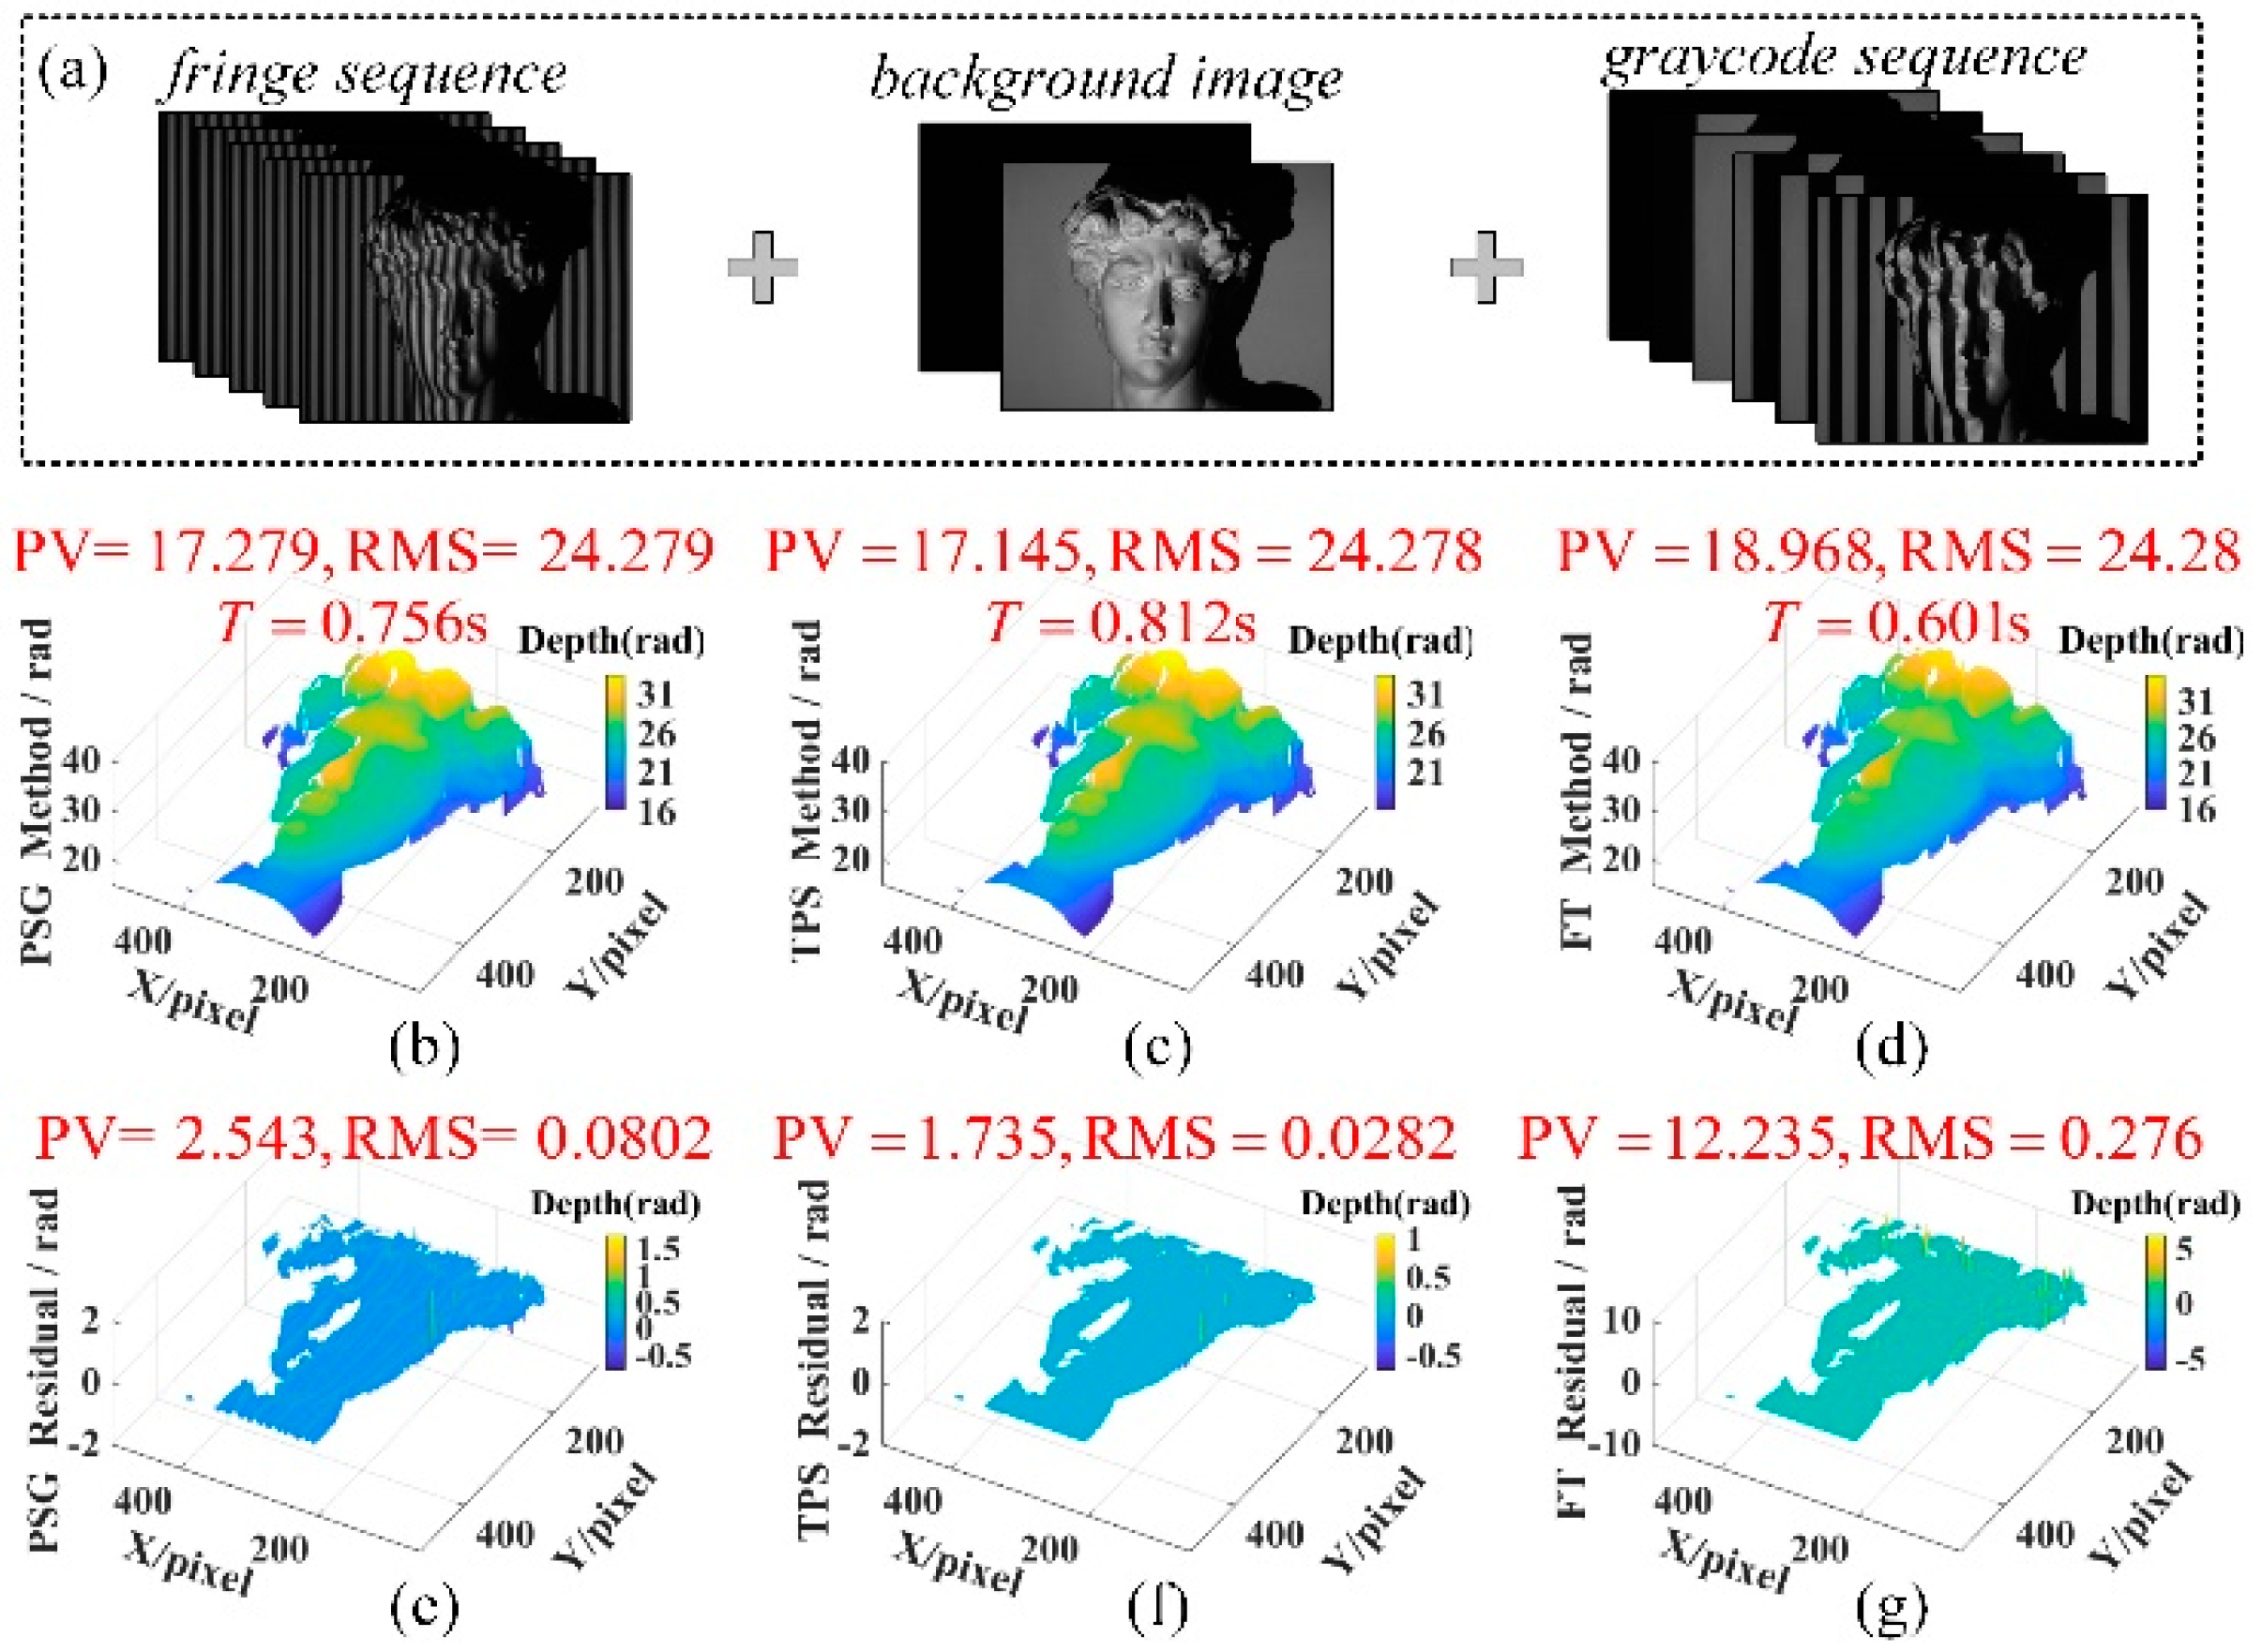
Figure 7, Figure 8 and Figure 9 exhibited the measurement results of three methods for spherical, cone, and David models, respectively, which presented an increasing complexity and were conducive to verifying the performance of the proposed method in different environments. Obviously, the measurement precision of the proposed PSG method was close to the five-step TPS method and was also better than the FT method in the edge and local complicated area, according to the presentation of residual errors.

Figure 8.
Experiment results for the cone model. (a) is the sampled images; (b–d) are the surfaces measured by PSG, TPS, and FT methods and (e–g) are the residual errors of (b–d), respectively.
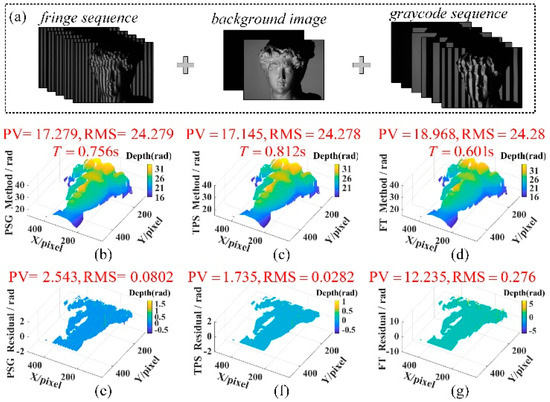
Figure 9.
Experiment results for the complex David model. (a) is the sampled images; (b–d) are the surfaces measured by the PSG, TPS, and FT methods and (e–g) are the residual errors of (b–d), respectively.
3.2. Accuracy and Efficiency Analysis
Next, the PV value and RMS value of residual errors for the different methods were calculated and the computation times for the three methods were also displayed in Figure 7, Figure 8 and Figure 9. According to the measurement results, the average PV values of residual errors of the three models were 1.3402 rad, 0.8015 rad, and 5.5102 rad, for PSG, TPS, and FT methods, respectively. The average RMS value of residual errors of the three models were 0.0836 rad, 0.0271 rad, and 0.1645 rad, for the PSG, TPS, and FT methods, respectively. Both the PV and RMS values of residual errors of the PSG method were between that of the TPS and FT methods, which was consistent with the tendency described in the simulation results. Thereby, the residual error data indicate that the proposed PSG method could achieve a measurement accuracy between the TPS and FT methods.
Then, the measurement efficiency was evaluated. According to Figure 7, Figure 8 and Figure 9, the average computation times of the three methods were 0.756 s, 0.812 s, and 0.601 s. We can see that the proposed PSG method can take a shorter time to complete the measurement than the TPS method due to the lower sampling rate. Consequently, the proposed PSG method can lead to a faster 3D measurement compared with the TPS method. Although the FT method has the highest measurement speed, it faced the problem of precision decreasing in the edge and local complexity areas. Thus, the proposed PSG method could achieve a satisfying balance between measurement accuracy and efficiency. With the increase in fringe steps, the PSG method will save more time than the TPS method and its accuracy will be also higher than the FT method.
3.3. Dynamic Scene Test
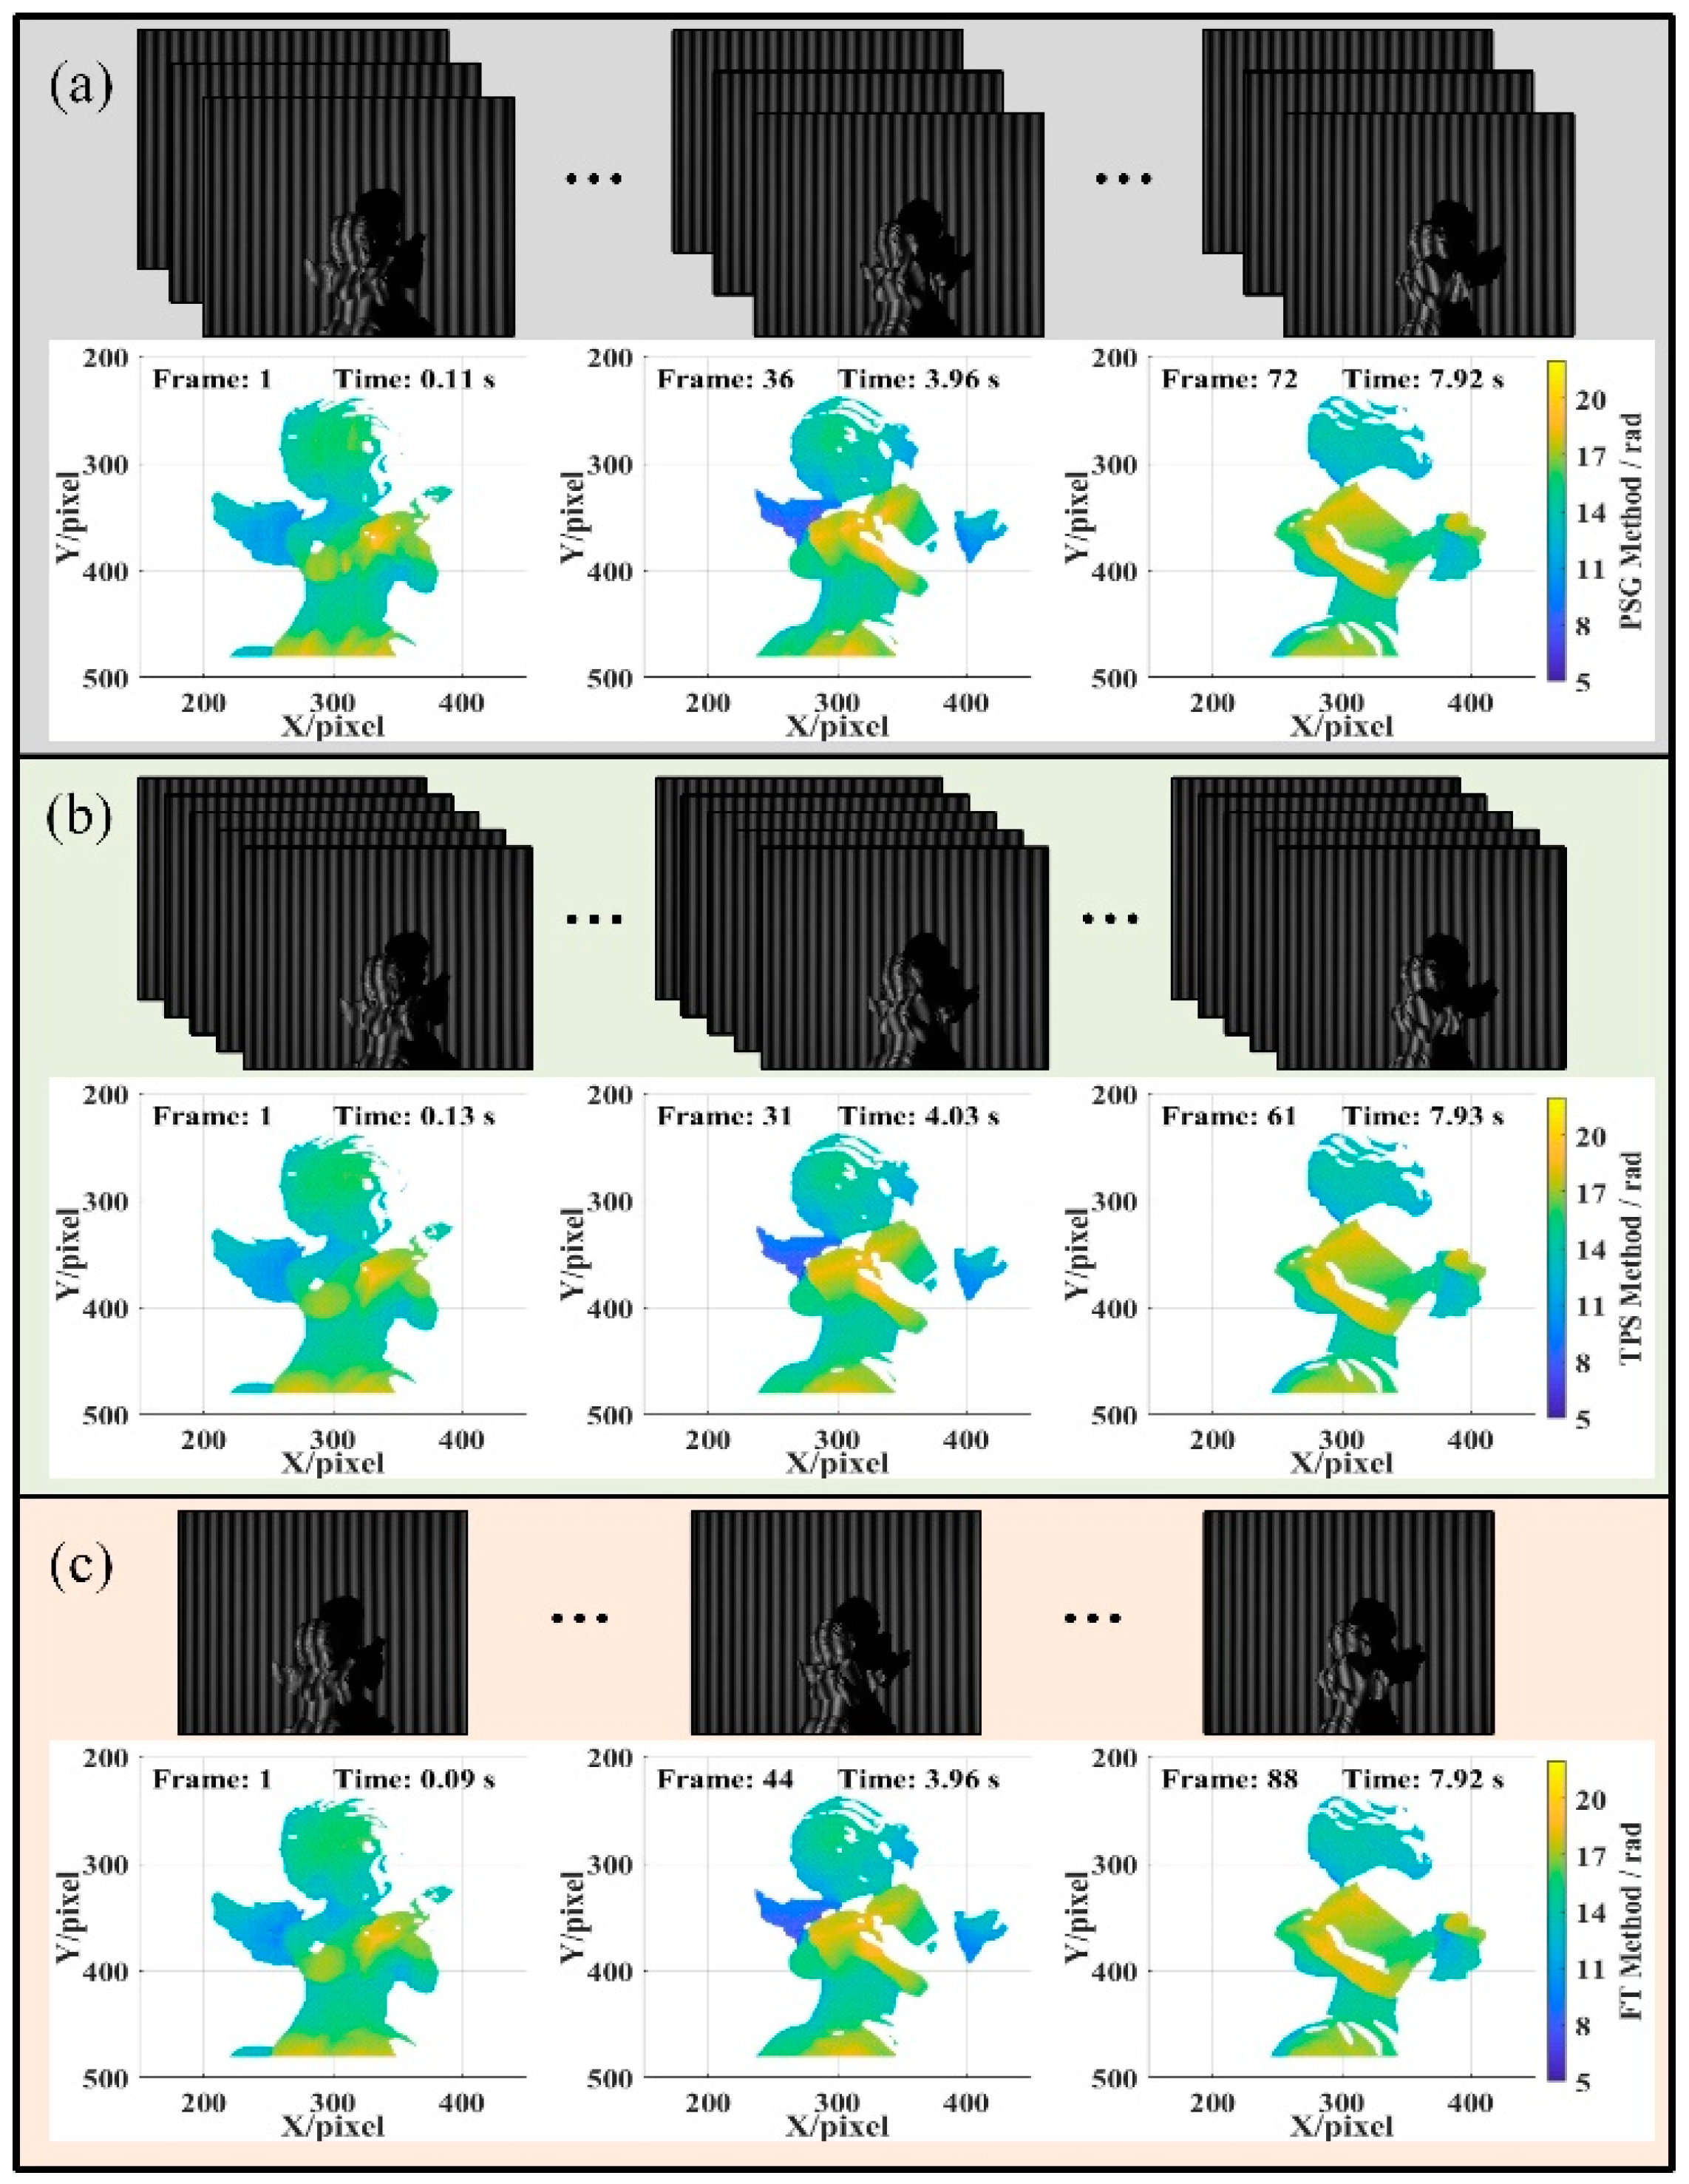
A dynamic 3D measurement experiment was also carried out to verify the proposed PSG method, as illustrated in Figure 10. In this test, a motorized rotating stage (TBR100) was utilized to drive the measured cherub model. The motorized rotating stage was set to rotate 60,000 pulses at a speed of 8000 pulses/s (with a resolution of 0.00125°/pulse). The sampling rate was set as 100 fps and the total sampling images for each method were set to 800. The sampling process adopted the scheme of “fringes + background + gray code”, wherein for each frame measurement result, the PSG method acquired three fringes with the phase step of 4π/5, the TPS acquired five fringes with the phase step of 2π/5, and the FT method acquired only one fringe, as shown in Figure 10a–c.
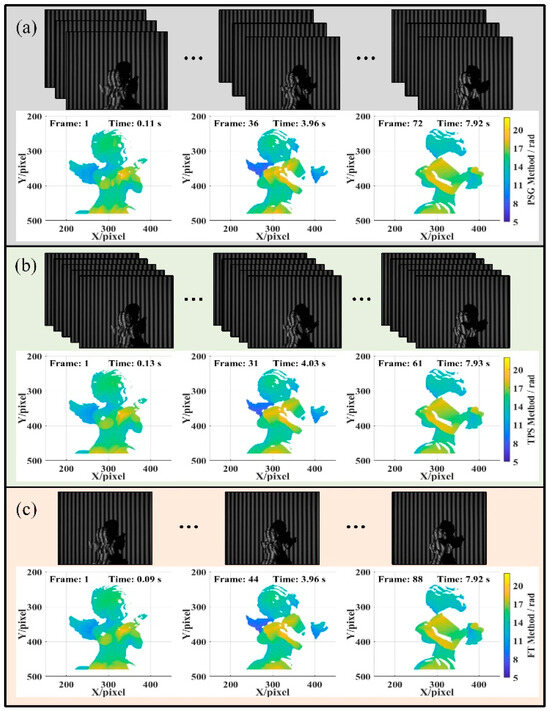
Figure 10.
Dynamic rotational measurement results for the (a) PSG method, (b) TPS method, and (c) FT method. (Visualization in the Supplementary Material presented the whole dynamic measurement process for a detailed exhibition).
Figure 10 displays the sampling time and the corresponding surface measurement frame for three methods. Over an 8-s sampling interval, the PSG method, TPS method, and FT method each computed a surface count of 72 frames, 61 frames, and 88 frames, respectively. It is obvious that the PSG method could achieve a higher measurement frame rate than the TPS method. Although the measurement speed of the PSG method is lower than the FT method, it could achieve better accuracy in the complicated scene, as demonstrated before. Thus, the proposed PSG could realize a satisfying balance between the dynamic characteristic and measurement precision, when compared with the TPS and FT methods. This means the proposed PSG method could be potentially applied in measurement scenarios that require both measurement efficiency and accuracy.
4. Discussion
According to the simulation and experimental results, the proposed PSG method integrates multi-frame image information, thereby demonstrating a superior measurement accuracy compared to the single-shot FT algorithms [28]. The FT algorithm inherently suffers from spectral leakage issues, which result in significantly lower measurement precision even under low noise conditions. However, the measurement accuracy of the PSG method is still outperformed by that of the TPS method [39] due to the impact of the phase-shift generation process. This inferiority primarily stems from background noise and motion-induced errors [34,35] that lead to inaccuracies in the generated fringe images, consequently reducing the measurement precision. According to simulation analyses, if background noise effects can be effectively suppressed during the measurement process, the measurement accuracy of the PSG method could potentially approach that of the TPS method. Thus, maintaining a low noise level is identified as one of the critical factors for enhancing the measurement precision of the PSG method.
Although the phase-steps of the sparse sampling sequence in the PSG method are nonuniform, we can still directly reconstruct the 3D surface by utilizing the nonuniform phase-steps algorithm (nPSA) based on the principle component analysis (PCA) [41,42]. According to the sparse sampling fringes data , , and in Figure 1a, we recover the 3D surface by the PCA-nPSA method, as presented in Figure 11. Comparing Figure 11 with Figure 3a,d, we find that the PCA-nPSA method is virtually equivalent to the proposed PSG method, given that they both employ the same phase-shifting fringe data for surface measurement. However, although the PCA-nPSA method owns the same sampling efficiency as the PSG method, the required time for one frame result by the PCA-nPSA method is 0.849 s, which is longer than that of the PSG method and will lead to a decreased measurement efficiency. Next, the frequency transformation functions (FTF) [42] are compared to evaluate the performance of the proposed method. Figure 12a presents the three phase-steps and the FTF for the PCA-nPSA method, Figure 12b presents the five phase-steps and the FTF for the PSG method, and Figure 12c presents the five phase-steps and the FTF for the TPS method. The PCA-nPSA’s FTF has zeros at . In contrast, the PSG’s FTF has zeros at and the TPS’s FTF has zeros at in the same range. These results indicate that the nonuniform phase steps in the sparse sampling process reduce the harmonic rejection capacity of the PCA-nPSA method and the PSG method and lead to a decreased measurement accuracy than the TPS method. In addition, the SNR-gain for the PCA-nPSA, the PSG, and the TPS are 2.09, 4.99, and 5.0, respectively. Obviously, the SNR gain of the proposed method is higher than that of the three-step PCA-nPSA method and is close to the TPS method. That is, the proposed PSG method is more insensitive to noise than the three-step PCA-nPSA.
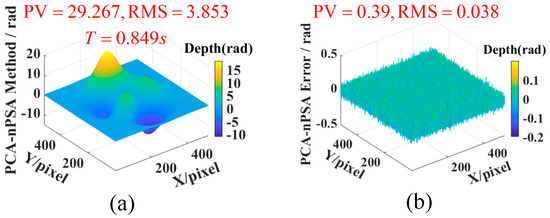
Figure 11.
Simulation results for the PCA-nPSA method. (a) Three-dimensional surface. (b) Measurement error.
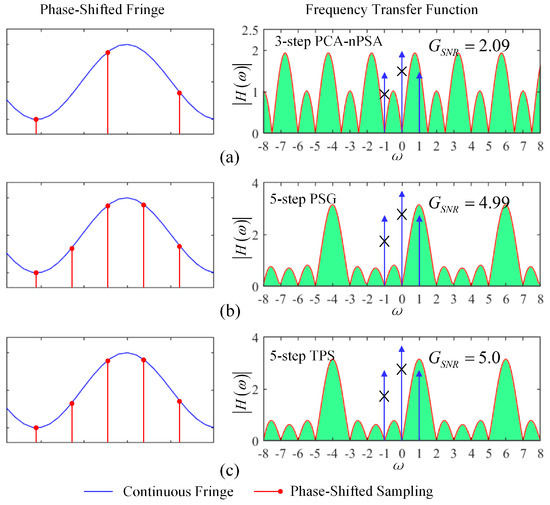
Figure 12.
FTFs analysis. (a) Three-step fringe data and the FTF for the PCA-nPSA method. (b) Five-step reconstructed fringe data and the FTF for the PSG method. (c) Five-step fringe data and the FTF for the TPS method.
Moreover, regarding sampling efficiency, the PSG method requires only three phase-shifting frames under a comparable five-step phase-shifting algorithm scheme, whereas the TPS method necessitates five frames. This implies that the PSG method offers higher efficiency in dynamic measurements. It is noteworthy that as the object’s movement velocity increases, both the PSG and TPS methods experience a decline in measurement accuracy, indicating that motion-induced errors have a significant influence on the precision of the PSG method. Consequently, future research will focus on developing motion error compensation techniques to further improve the performance of the PSG method in dynamic 3D measurement.
5. Conclusions
In summary, this study proposed a PSG method to reconstruct the complete phase-shifting fringe sequence by sparse sampling, in which sampling efficiency is almost double compared with the TPS method in terms of the phase-shifting sequence. According to the simulation and static scene measurement results, the PSG method achieves an accuracy between that of the TPS and FT methods and retains more detailed information in the edge and local complicated area than the FT method. In terms of measurement efficiency, the proposed PSG method takes a shorter time to complete the measurement than the TPS method due to the higher sampling efficiency. When compared with the PCA-nPSA method having the same sampling efficiency, the PSG method proposed in this paper still exhibits higher computational efficiency and stronger resistance to noise interference. Moreover, the dynamic experiment results also indicate that the PSG method achieves a higher measurement frame rate, which is about 1.2 times than that of the TPS method. Both the simulation and experiment results indicate that the proposed PSG method effectively balances the measurement efficiency and accuracy for the TPS and FT methods, showing potential for applications in dynamic 3D measurement research, such as deformation measurement, vibration performance, and motion process monitoring.
Supplementary Materials
The following supporting information can be downloaded at: https://www.mdpi.com/article/10.3390/photonics11040364/s1, Video S1: The animation version of Figure 10c.
Author Contributions
Conceptualization, Q.D. and Y.L.; methodology and validation, Q.D., Y.L., F.Z. and J.H.; formal analysis, F.X.; resources, Y.Z.; data curation, F.Z.; writing—original draft preparation, Q.D.; writing—review and editing, Y.L.. All authors have read and agreed to the published version of the manuscript.
Funding
The research was supported by the Science and Technology Research Program of Chongqing Municipal Education Commission (Grant Nos. KJQN201900642 and KJQN202000611), Sichuan Science and Technology Program (Grant No. 2022YFQ0011), and Intelligent Policing Key Laboratory of Sichuan Province, No. ZNJW2022ZZQN003.
Institutional Review Board Statement
Not applicable.
Informed Consent Statement
Not applicable.
Data Availability Statement
Simulation and experimental data presented in this paper are available from the corresponding authors.
Conflicts of Interest
The authors declare that they have no known competing financial interests or personal relationships that could have appeared to influence the work reported in this paper.
References
- Zuo, C.; Feng, S.J.; Huang, L.; Tao, T.Y.; Yin, W.; Chen, Q. Phase shifting algorithms for fringe projection profilometry: A review. Opt. Laser Eng. 2018, 109, 23–59. [Google Scholar] [CrossRef]
- Geng, J. Structured-light 3D surface imaging: A tutorial. Adv. Opt. Photonics 2011, 3, 128–160. [Google Scholar] [CrossRef]
- Lyu, N.Q.; Yu, H.T.; Han, J.; Zheng, D.L. Structured light-based underwater 3-d reconstruction techniques: A comparative study. Opt. Laser Eng. 2023, 161, 107344. [Google Scholar] [CrossRef]
- Lv, S.Z.; Kemao, Q. Modeling the measurement precision of fringe projection profilometry. Light-Sci. Appl. 2023, 12, 257. [Google Scholar] [CrossRef] [PubMed]
- Zuo, C.; Tao, T.Y.; Feng, S.J.; Huang, L.; Asundi, A.; Chen, Q. Micro fourier transform profilometry (μFTP): 3D shape measurement at 10,000 frames per second. Opt. Laser Eng. 2018, 102, 70–91. [Google Scholar] [CrossRef]
- Feng, S.; Zuo, C.; Chen, Q. High-speed 3D measurements at 20,000 Hz with deep convolutional neural networks. In Optical Metrology and Inspection for Industrial Applications VI; Han, S., Yoshizawa, T., Zhang, S., Chen, B., Eds.; SPIE: Bellingham, WA, USA, 2019; Volume 11189. [Google Scholar]
- Xu, J.; Zhang, S. Status, challenges, and future perspectives of fringe projection profilometry. Opt. Laser Eng. 2020, 135, 106193. [Google Scholar] [CrossRef]
- Flores, J.L.; Stronik, M.; Muñoz, A.; Garcia-Torales, G.; Ordoñes, S.; Cruz, A. Dynamic 3D shape measurement by iterative phase shifting algorithms and colored fringe patterns. Opt. Express 2018, 26, 12403–12414. [Google Scholar] [CrossRef] [PubMed]
- Pagès, J.; Salvi, J.; Collewet, C.; Forest, J. Optimised de bruijn patterns for one-shot shape acquisition. Image Vis. Comput. 2005, 23, 707–720. [Google Scholar] [CrossRef]
- Morita, H.; Yajima, K.; Sakata, S. Reconstruction of Surfaces of 3-D Objects by M-Array Pattern Projection Method. In International Conference on Computer Vision; IEEE Computer Society: Washington, DC, USA, 1998. [Google Scholar]
- Zhou, P.; Zhu, J.P.; Jing, H.L. Optical 3-D surface reconstruction with color binary speckle pattern encoding. Opt. Express 2018, 26, 3452–3465. [Google Scholar] [CrossRef]
- Zhong, F.Q.; Kumar, R.; Quan, C.G. RGB laser speckles based 3D profilometry. Appl. Phys. Lett. 2019, 114, 201104. [Google Scholar] [CrossRef]
- Zhang, G.Y.; Xu, B.; Lau, D.L.; Zhu, C.; Liu, K. Correcting projector lens distortion in real time with a scale-offset model for structured light illumination. Opt. Express 2022, 30, 24507–24522. [Google Scholar] [CrossRef] [PubMed]
- Zhang, S.; Yau, S.T. High-resolution, real-time 3d absolute coordinate measurement based on a phase-shifting method. Opt. Express 2006, 14, 2644–2649. [Google Scholar] [CrossRef] [PubMed]
- Guo, B.J.; Xu, Y.P.; Zhang, C.L.; Tang, J.F.; Tang, D.; Kong, C.; Jin, J. An optimized error compensation method for phase measurement profilometry. Photonics 2023, 10, 1036. [Google Scholar] [CrossRef]
- Zheng, D.L.; Da, F.P.; Kemao, Q.; Seah, H.S. Phase-shifting profilometry combined with gray-code patterns projection: Unwrapping error removal by an adaptive median filter. Opt. Express 2017, 25, 4700–4713. [Google Scholar] [CrossRef] [PubMed]
- Lv, S.Z.; Tang, D.W.; Zhang, X.J.; Yang, D.Y.; Deng, W.J.; Qian, K.M. Fringe projection profilometry method with high efficiency, precision, and convenience: Theoretical analysis and development. Opt. Express 2022, 30, 33515–33537. [Google Scholar] [CrossRef]
- Zappa, E.; Busca, G. Static and dynamic features of fourier transform profilometry: A review. Opt. Laser Eng. 2012, 50, 1140–1151. [Google Scholar] [CrossRef]
- Kemao, Q. Two-dimensional windowed fourier transform for fringe pattern analysis: Principles, applications and implementations. Opt. Laser Eng. 2007, 45, 304–317. [Google Scholar] [CrossRef]
- Gao, W.J.; Huyen, N.T.T.; Loi, H.S.; Kemao, Q. Real-time 2d parallel windowed fourier transform for fringe pattern analysis using graphics processing unit. Opt. Express 2009, 17, 23147–23152. [Google Scholar] [CrossRef] [PubMed]
- Ming, Z.; Qian, K.M. Multicore implementation of the windowed fourier transform algorithms for fringe pattern analysis. Appl. Opt. 2015, 54, 587–594. [Google Scholar]
- Xu, Y.J.; Gao, F.; Jiang, X.Q. A brief review of the technological advancements of phase measuring deflectometry. Photonix 2020, 1, 14. [Google Scholar] [CrossRef]
- Zhang, S.; Huang, P.S. High-resolution, real-time three-dimensional shape measurement. Opt. Eng. 2006, 45, 123601. [Google Scholar]
- Liu, K.; Wang, Y.C.; Lau, D.L.; Hao, Q.; Hassebrook, L.G. Dual-frequency pattern scheme for high-speed 3-D shape measurement. Opt. Express 2010, 18, 5229–5244. [Google Scholar] [CrossRef] [PubMed]
- Wang, Y.C.; Liu, K.; Hao, Q.; Lau, D.L.; Hassebrook, L.G. Period coded phase shifting strategy for real-time 3-D structured light illumination. IEEE Trans. Image Process. 2011, 20, 3001–3013. [Google Scholar] [CrossRef]
- Zhang, Z.H.; Towers, C.E.; Towers, D.P. Time efficient color fringe projection system for 3D shape and color using optimum 3-frequency selection. Opt. Express 2006, 14, 6444–6455. [Google Scholar] [CrossRef] [PubMed]
- Ayubi, G.A.; Ayubi, J.A.; Di Martino, J.M.; Ferrari, J.A. Pulse-width modulation in defocused three-dimensional fringe projection. Opt. Lett. 2010, 35, 3682–3684. [Google Scholar] [CrossRef]
- Guo, H.; Huang, P.S. Absolute phase technique for the fourier transform method. Opt. Eng. 2009, 48, 043609. [Google Scholar] [CrossRef]
- Qian, J.M.; Tao, T.Y.; Feng, S.J.; Chen, Q.; Zuo, C. Motion-artifact-free dynamic 3D shape measurement with hybrid fourier-transform phase-shifting profilometry. Opt. Express 2019, 27, 2713–2731. [Google Scholar] [CrossRef] [PubMed]
- Guo, W.B.; Wu, Z.J.; Li, Y.Y.; Liu, Y.H.; Zhang, Q.C. Real-time 3d shape measurement with dual-frequency composite grating and motion-induced error reduction. Opt. Express 2020, 28, 26882–26897. [Google Scholar] [CrossRef]
- Zhong, C.; Gao, Z.; Wang, X.; Shao, S.; Gao, C. Structured light three-dimensional measurement based on machine learning. Sensors 2019, 19, 3229. [Google Scholar] [CrossRef]
- Zhang, L.; Chen, Q.; Zuo, C.; Feng, S. High-speed high dynamic range 3D shape measurement based on deep learning. Opt. Laser Eng. 2020, 134, 106245. [Google Scholar] [CrossRef]
- Yu, H.T.; Chen, X.Y.; Zhang, Z.; Zuo, C.; Zhang, Y.; Zheng, D.L.; Han, J. Dynamic 3-D measurement based on fringe-to-fringe transformation using deep learning. Opt. Express 2020, 28, 9405–9418. [Google Scholar] [CrossRef] [PubMed]
- Feng, S.J.; Zuo, C.; Tao, T.Y.; Hu, Y.; Zhang, M.L.; Chen, Q.; Gu, G.H. Robust dynamic 3-D measurements with motion-compensated phase-shifting profilometry. Opt. Laser Eng. 2018, 103, 127–138. [Google Scholar] [CrossRef]
- Lu, L.; Jia, Z.Y.; Luan, Y.S.; Xi, J.T. Reconstruction of isolated moving objects with high 3d frame rate based on phase shifting profilometry. Opt. Commun. 2019, 438, 61–66. [Google Scholar] [CrossRef]
- Feng, S.; Zuo, C.; Yin, W.; Gu, G.; Chen, Q. Micro deep learning profilometry for high-speed 3D surface imaging. Opt. Laser Eng. 2019, 121, 416–427. [Google Scholar] [CrossRef]
- Qian, J.M.; Feng, S.J.; Li, Y.X.; Tao, T.Y.; Han, J.; Chen, Q.; Zuo, C. Single-shot absolute 3D shape measurement with deep-learning-based color fringe projection profilometry. Opt. Lett. 2020, 45, 1842–1845. [Google Scholar] [CrossRef] [PubMed]
- Wu, Z.; Guo, W.; Zhang, Q. High-speed three-dimensional shape measurement based on shifting gray-code light. Opt. Express 2019, 27, 22631–22644. [Google Scholar] [CrossRef]
- Zhang, S. High-speed 3d shape measurement with structured light methods: A review. Opt. Laser Eng. 2018, 106, 119–131. [Google Scholar] [CrossRef]
- Wu, Z.J.; Zuo, C.; Guo, W.B.; Tao, T.Y.; Zhang, Q.C. High-speed three-dimensional shape measurement based on cyclic complementary gray-code light. Opt. Express 2019, 27, 1283–1297. [Google Scholar] [CrossRef]
- Servin, M.; Padilla, M.; Garnica, G.; Paez, G. Design of nonlinearly spaced phase-shifting algorithms using their frequency transfer function. Appl. Opt. 2019, 58, 1134–1138. [Google Scholar] [CrossRef]
- Servin, M.; Padilla, M.; Garnica, G.; Paez, G. Fourier spectra for nonuniform phase-shifting algorithms based on principal component analysis. Opt. Express 2019, 27, 25861–25871. [Google Scholar] [CrossRef]


Disclaimer/Publisher’s Note: The statements, opinions and data contained in all publications are solely those of the individual author(s) and contributor(s) and not of MDPI and/or the editor(s). MDPI and/or the editor(s) disclaim responsibility for any injury to people or property resulting from any ideas, methods, instructions or products referred to in the content. |
© 2024 by the authors. Licensee MDPI, Basel, Switzerland. This article is an open access article distributed under the terms and conditions of the Creative Commons Attribution (CC BY) license (https://creativecommons.org/licenses/by/4.0/).