Article

Training a Dataset Simulated Using RGB Images for an End-to-End Event-Based DoLP Recovery Network

Key Laboratory of Photoelectronic Imaging Technology and System, Ministry of Education of China, Beijing Institute of Technology, Beijing 100081, China
*
Author to whom correspondence should be addressed.
Photonics 2024, 11(5), 481; https://doi.org/10.3390/photonics11050481
Submission received: 19 April 2024 / Revised: 15 May 2024 / Accepted: 18 May 2024 / Published: 20 May 2024

Abstract

:
Event cameras are bio-inspired neuromorphic sensors that have emerged in recent years, with advantages such as high temporal resolutions, high dynamic ranges, low latency, and low power consumption. Event cameras can be used to build event-based imaging polarimeters, overcoming the limited frame rates and low dynamic ranges of existing systems. Since events cannot provide absolute brightness intensity in different angles of polarization (AoPs), degree of linear polarization (DoLP) recovery in non-division-of-time (non-DoT) event-based imaging polarimeters is an ill-posed problem. Thus, we need a data-driven deep learning approach. Deep learning requires large amounts of data for training, and constructing a dataset for event-based non-DoT imaging polarimeters requires significant resources, scenarios, and time. We propose a method for generating datasets using simulated polarization distributions from existing red–green–blue images. Combined with event simulator V2E, the proposed method can easily construct large datasets for network training. We also propose an end-to-end event-based DoLP recovery network to solve the problem of DoLP recovery using event-based non-DoT imaging polarimeters. Finally, we construct a division-of-time event-based imaging polarimeter simulating an event-based four-channel non-DoT imaging polarimeter. Using real-world polarization events and DoLP ground truths, we demonstrate the effectiveness of the proposed simulation method and network.

1. Introduction

In recent years, various bio-inspired neuromorphic sensors have emerged, including event cameras, which have been widely studied. Compared with traditional frame-based cameras, event cameras do not have fixed frame rates or integration times and output asynchronous event stream information. Their advantages include high temporal resolutions, high dynamic ranges, low latency, and low power consumption [1]. As a new form of optical sensors, they are widely used in many research fields, such as visual navigation [2,3,4], image reconstruction [5,6,7,8], optical flow [9,10,11], and some optical applications [12,13,14]. However, optical information is not only about intensity; it also concerns polarization. Traditionally, imaging polarimeters are used for such purposes as target detection [15,16,17], 3D reconstruction [18,19,20], underwater image recovery [21,22], and remote sensing [23,24,25,26]. However, traditional frame-based imaging polarimeters have limited frame rates and dynamic ranges [27].
Therefore, researchers have developed division-of-time (DoT) and division-of-focal-plane (DoFP) event-based imaging polarimeters [27,28,29,30]. Theoretical models and methods are used to calculate polarization information based on event-based DoT imaging polarimeters. However, since an event only represents a relative change in the brightness intensity and does not include the absolute brightness intensity, recovering the degree of linear polarization (DoLP) of event-based non-DoT imaging polarimeters is an ill-posed problem [30].
Due to this lack of intensity information, deep learning methods are used in event processing for the DoLP recovery of non-DoT polarization events. Data-driven neural networks require large amounts of data to train network models for better results and generalization ability. However, due to the limited development of event cameras, significant amounts of resources are needed to construct event-based non-DoT imaging polarimeters. Moreover, collecting thousands of event sequences in different scenes with DoLP ground truths for training requires considerable resources and time. Thus, for the training of a DoLP recovery network, we propose a simulation method for generating polarization event datasets. Using a single red–green–blue (RGB) image combined with an existing event simulator, we simulate a sequence of polarization events and DoLP ground truths for training. This approach can greatly reduce the time and resource consumption of building a training dataset and can convert existing RGB image datasets into polarization event training sets. Finally, we build an event-based DoT imaging polarimeter to verify the proposed simulated dataset and DoLP recovery network. We obtain real non-DoT polarization events and intensities by sampling the same motion of the same target at different angles of polarization (AoPs) and offline calibrating times. The experiment under real conditions demonstrates the effectiveness of the proposed simulated dataset and DoLP recovery network.
In summary, (1) we propose a dataset simulation method for event-based DoLP recovery networks. This approach can construct large-scale polarization event datasets using existing RGB images, thus reducing time consumption, cost, and research barriers and promoting the development of polarization event processing. (2) We propose an end-to-end event-based DoLP recovery network model that can effectively restore the DoLPs of targets from polarization events at four AoPs. (3) We build an event-based DoT imaging polarimeter and provide a time calibration method to obtain non-DoT polarization events and DoLP ground truths under real-world conditions.

2. Background and Related Work

This section provides an overview of event cameras and polarization imaging and presents recent research and development efforts related to polarization events.

2.1. Event Camera

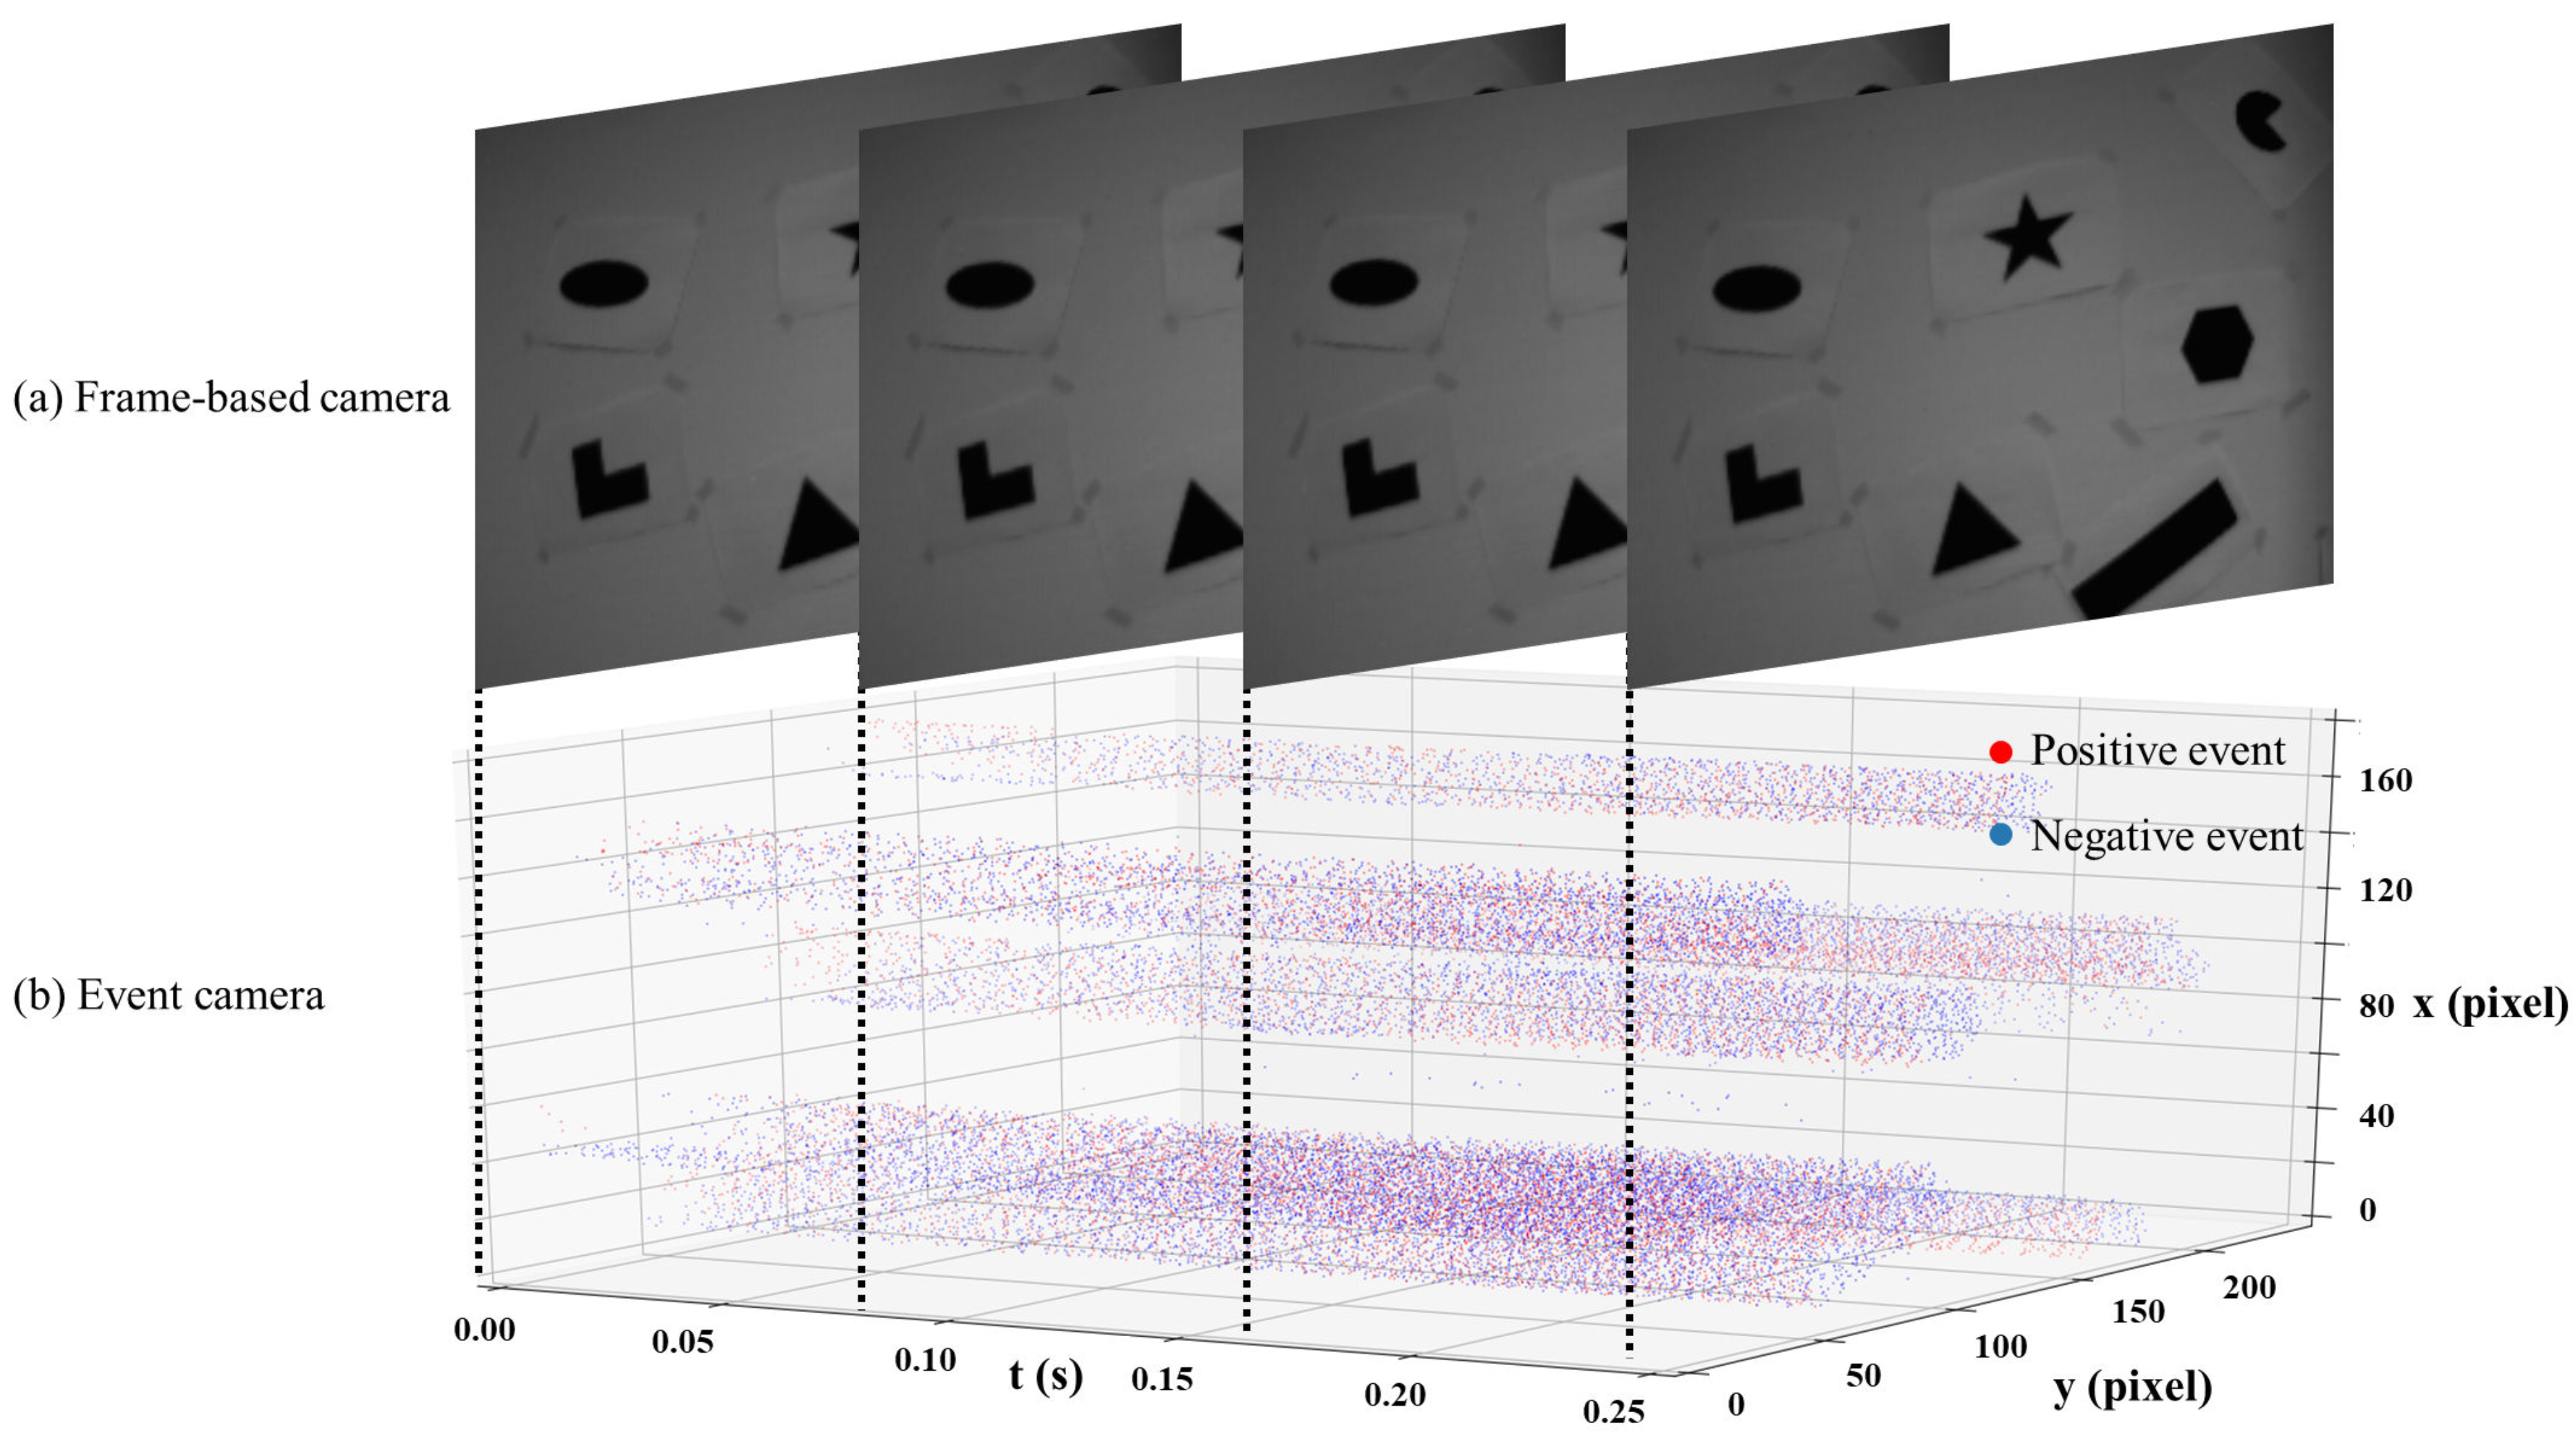
Event cameras are bio-inspired neuromorphic sensors that are also called dynamic vision sensors (DVSs). Each pixel passively detects the change of log brightness intensity and outputs an event when it exceeds a threshold, as shown in Figure 1. Each event contains coordinates, a timestamp, and polarity (positive or negative). Thus, the asynchronous event stream does not have a fixed frame rate or integration time. The outputs of traditional frame-based cameras and event cameras are shown in Figure 2. The red and blue points correspond to positive and negative events, respectively. In most cases, events are caused by the movement of the target or the camera. The difference in reflectivity between the target and the background causes a change in the brightness intensity received by a certain pixel during motion, which then triggers an event. An individual pixel of an event camera can detect and output brightness intensity changes at the microsecond level. Compared with traditional frame-based cameras, event cameras have high temporal resolutions, low latency, and low power consumption. In addition, because the differential detector used by event cameras for event triggering detects changes in the log brightness intensity, event cameras have higher dynamic ranges than traditional frame-based cameras.
Event cameras originated from the study of Mahowald and Mead at the California Institute of Technology from 1986 to 1992 [31]. Since the first commercial event camera appeared in 2008 [32], these devices have gradually become a widely researched area of computer vision and visual navigation. Early event cameras, such as DVSs [33,34], only output events, whereas subsequent devices, such as asynchronous time-based image sensors [35,36] and dynamic and active-pixel vision sensors [37,38], can output both events and intensities through different circuits. After more than a decade of development, the resolution of event cameras has improved (reaching mainstream levels for frame-based cameras) [39,40,41], providing further possibilities for related applications.
Figure 2. Comparison of output between a frame-based camera and an event camera. Data come from [42].
Photonics 11 00481 g002

2.2. Polarization

Polarization is a fundamental parameter in optics. Polarization imaging systems can be mainly divided into DoT systems [43,44] and non-DoT systems. A DoT system mainly consists of a rotatable polarizer and an imaging sensor. Through the rotation of the polarizer, the sensor can obtain the brightness intensities at various AoPs at different times. A non-DoT system mainly uses methods such as the division of amplitude (DoAm) [45,46], division of aperture (DoAp) [47,48], and DoFP [49,50] for the simultaneous acquisition of multiple sets of brightness intensities at different AoPs for the same scene. The polarization of the scene can be calculated using a Stokes vector ( S 0 , S 1 , S 2 , and S 3 , where S 3 represents circular polarization states; this element is approximately equal to 0 in natural scenes and is, therefore, not discussed in our work). For instance, commonly used DoFP cameras generally obtain brightness intensities at AoPs of 0°, 45°, 90°, and 135°. In this scenario, the DoLP and AoP of the scene are calculated using Equations (1)–(3), where I 0 , I 45 , I 90 , and I 135 are the brightness intensities at four different AoPs and S 0 , S 1 , and S 2 are the first three components of the Stokes vector [51]:
S 0 = I 0 + I 90 S 1 = I 0 I 90 S 2 = I 45 I 135
DoLP = S 1 2 + S 2 2 S 0
AoP = 1 2 arctan S 2 S 1

2.3. Polarization Events

Event-based imaging polarimeters can also be divided into DoT systems and non-DoT systems. Lu et al. [28,29] and Hawks and Dexter [27] established event-based DoT imaging polarimeters in 2021 and 2022, respectively. For stationary scenes, the events caused by the rotating polarizer, which changes the intensity of the passing brightness, can be obtained. For an event-based DoT imaging polarimeter, the DoLP and AoP can be calculated directly through the event rate. Muglikar et al. [52] used such systems for 3D reconstruction and verified the feasibility of using event-based systems for polarization applications. Haessig et al. [30] have developed a polarization event camera that couples a micropolarization array to the image plane of the event camera, enabling the simultaneous acquisition of events at four AoPs. This realizes the application of polarization events in dynamic scenes such as polarized target detection.
The literature on polarization events remains limited. First, due to the short history of event cameras, they are expensive, and building an event-based imaging polarimeter requires substantial resources, especially for non-DoT systems, which may require multiple event cameras. Second, for DoT systems, the DoLP and AoP of a scene can be directly calculated using the events. However, for non-DoT systems, the DoLP cannot be directly calculated without the reconstruction of intensity images at four AoPs. The application scenarios of various systems are summarized and compared in Table 1.

3. Method

This section presents the dataset simulation method and the network structure, loss function, and training method of the end-to-end DoLP recovery network.

3.1. Simulated Dataset

Training an event-based DoLP recovery network requires a large dataset. As building an event-based non-DoT imaging polarimeter needs large amounts of resources, setting up and shooting the dataset scenes are time consuming. Inspired by studies on event-based image reconstruction, we propose a method for generating simulated datasets. Two requirements should be fulfilled to simulate polarization events and DoLP ground truths. First, there must be a large number of scenes or targets with different polarization distributions. Second, there must be brightness intensity changes that can trigger events (for an event-based non-DoT imaging polarimeter, such changes are mainly caused by the motion of the target). We obtain simulated scene polarization distributions from existing RGB image datasets as ground truths and then generate events at multiple AoPs using the simulated motion. This method can acquire adequate training data while saving resources and time.
We are inspired by the visualization method commonly used in polarization image displays. In Figure 3b, shows the raw data captured by a DoFP camera (intensities at four AoPs) and Figure 3c shows the DoLP and AoP of the scene. By mapping the raw data to the hue–saturation–value (HSV) color space, as shown in Figure 3a, we obtain an image similar to that in Figure 3c.
We can also convert color images from the HSV color space into corresponding polarization values, as shown in Figure 4. This does not represent the true polarization characteristics of the scene, but we can obtain a large number of false polarization characteristic distributions that can be used for network training. Using Equation (4), we obtain simulated polarized images at different θ , such as 0°, 45°, 90°, and 135°:
I θ = 1 2 S 0 ( 1 DoLP ) + S 0 DoLP cos 2 ( θ AoP ) .
To visualize the polarization images, we only need to determine the DoLP and AoP. Therefore, only two HSV channels are used, and the S channel can be set to a constant value of 1. In the simulation process, as indicated by Equation (4), we need to input three variables, namely, S 0 , AoP, and DoLP, which correspond exactly to the three HSV channels. The overall structure of the simulation is shown in Figure 5. By converting an RGB image to the HSV color space and mapping the three HSV channels to AoP, DoLP, and S 0 , we obtain the polarization distribution of a scene. Then, by simulating motion, we obtain four image sequences with continuous changes in brightness intensities at the four AoPs. Finally, we can simulate the events at these AoPs from these sequences using existing event simulators [53,54,55] (we use V2E [54] in our experiments), and pairs of ground truths and polarization events are obtained for supervised network training.
The network can correctly learn to recover DoLPs from polarization events using the dataset simulated using RGB images. For an event-based non-DoT imaging polarimeter, the network should learn to recover the DoLPs of scenes from events at different AoPs. We initially reconstruct intensity images at various AoPs and then calculate the DoLPs from these intensity images using Equations (1) and (2). We use an end-to-end network to fit these two processes. In the dataset simulation, we reverse this process. We map RGB images to HSV space and then to AoP, DoLP, and S 0 . This process is used solely to generate a large number of random initial scene polarization spatial distributions and does not imply that we obtain real-world physical polarization distributions. Through this large set of generated polarization spatial distributions, we can obtain intensity spatial distributions at different AoPs. All in all, simulating the intensity images at different AoPs is consistent with the DoLP formula, and simulating the motion and events is consistent with the event camera model. Therefore, for the network, whether the original source of data is real or simulated polarization distributions is irrelevant; the abovementioned consistency of the simulations with the DoLP formula and the event camera model is the only requirement.

3.2. Input and Output of the Network

The input and output of the end-to-end DoLP recovery network are the four channels of polarization events and DoLP ground truths, respectively. However, the event camera outputs asynchronous sparse 3D spatiotemporal data, which we need to compress into a 2D representation, such as a time surface, to make them correspond to the ground truths for supervised training. We gather events within a time window and assign different values to them based on their timestamps. The formula is as follows:
Event tensor = i = 1 n p i t i t 0 Δ t ,
where n is the total number of events within the time window, Δ t is the time window, p i is the polarity of event i, t i is the timestamp of event i, and t 0 is the timestamp of the first event in time window. The four-channel event tensor input to the network and the single-channel DoLP output are shown in Figure 6.

3.3. Network Architecture

Our network model uses a U-Net [56]-like architecture combined with a residual block [57], a swin transformer block [58], and a ConvGRU [59]. The overall network structure is shown in Figure 6. C1 expands the input four-channel event tensor to 32 channels. In S1 and S2, the downscaling factor is 2 and the hidden dimensions are 64 and 128, respectively. The input dimensions of G1 and G2 are 64 and 128, respectively. R1 and R2 use 128 input and output channels, stride-1 3 × 3 convolutions, and ReLU activation. P1 is the final prediction layer (with a 1 × 1 convolution), and the output channel is 1.

3.4. Loss

The total loss function of our network is a combination of three loss functions. First, it includes the mean square error (MSE) loss, which is commonly used to evaluate the pixel-level error between a prediction and the ground truth. The use of this loss function ensures that the DoLP trained by the network is close to the ground truth, as shown in Equation (6):
L 2 = ( y f ( x ) ) 2 ,
where L 2 is the MSE loss, y is the ground truth, and f ( x ) is the network prediction. Second, we use structural similarity (SSIM), which includes a similarity comparison of three dimensions: image brightness, contrast, and SSIM. This loss function is commonly used to ensure SSIM between predictions and true values. As a larger SSIM indicates closer images, we implement some adjustments when using it as a loss function, as shown in Equation (7):
L S = 1 S S I M ( y , f ( x ) ) ,
where L S is the SSIM loss and S S I M is the SSIM loss function. The SSIM parameters are set to default values. Considering that the abovementioned pixel-level loss may lead to blurry reconstruction results [60], we add the perceptual loss function LPIPS [61]. By feeding the network prediction and ground truth into a VGG network pretrained on ImageNet, we calculate their feature distance in the VGG’s feature layers. By minimizing this loss function, we make the network prediction and ground truth closer to natural statistics, as shown in Equation (8).
L L = L P I P S ( y , f ( x ) ) ,
where L L is the LPIPS loss and L P I P S is the LPIPS distance. Thus, our total loss function is as follows:
L = λ 1 i = 1 n L 2 + λ 2 i = 1 n L S + λ 3 i = 1 n L L ,
where n is the number of samples in training dataset and λ 1 , λ 2 , and λ 3 are the weighting coefficients of the three loss function terms and are used to balance the value range of each loss function.

3.5. Training

Using the simulation method described in Section 3.1, we simulate 1000 sequences of 1 s (30 Hz) from an existing RGB dataset (MIT-Adobe 5K [62]). Each sequence includes events at four AoPs and the DoLP ground truths. The original size of the images is 400 pixels × 600 pixels, and the window size we select for motion simulation is 120 pixels × 180 pixels. In the event simulator, the trigger threshold for positive and negative events is set to 0.2, and all other items are set to their default values. Using an Intel Xeon Gold 6226R CPU (@2.90GHz) and a NVIDIA GeForce RTX 3090 GPU, we can generate 1000 sequences in two hours and fifteen minutes, by running five simulation programs in parallel.
We implement our network using PyTorch [63] and use ADAM [64] with a learning rate of 0.0001. The batch size is 2. We train for a total of 250 epochs. In the loss function, λ 1 , λ 2 , and λ 3 are set to 1, 1, and 10, respectively.

4. Experiment Setup

To validate the dataset simulation approach and end-to-end DoLP recovery network, we collect polarization events and DoLPs from actual scenes. Due to our current experimental conditions, we cannot construct a real event-based non-DoT imaging polarimeter system. Therefore, we use a DoT system as a substitute and obtain events and intensity images at four AoPs by rotating the polarizer multiple times. By controlling the target to perform the same motion each time and using markers for time calibration, we align the events and intensity images obtained from multiple acquisitions using their timestamps, achieving the same effect as that of a non-DoT system for experimental validation. The experimental setup is shown in Figure 7.
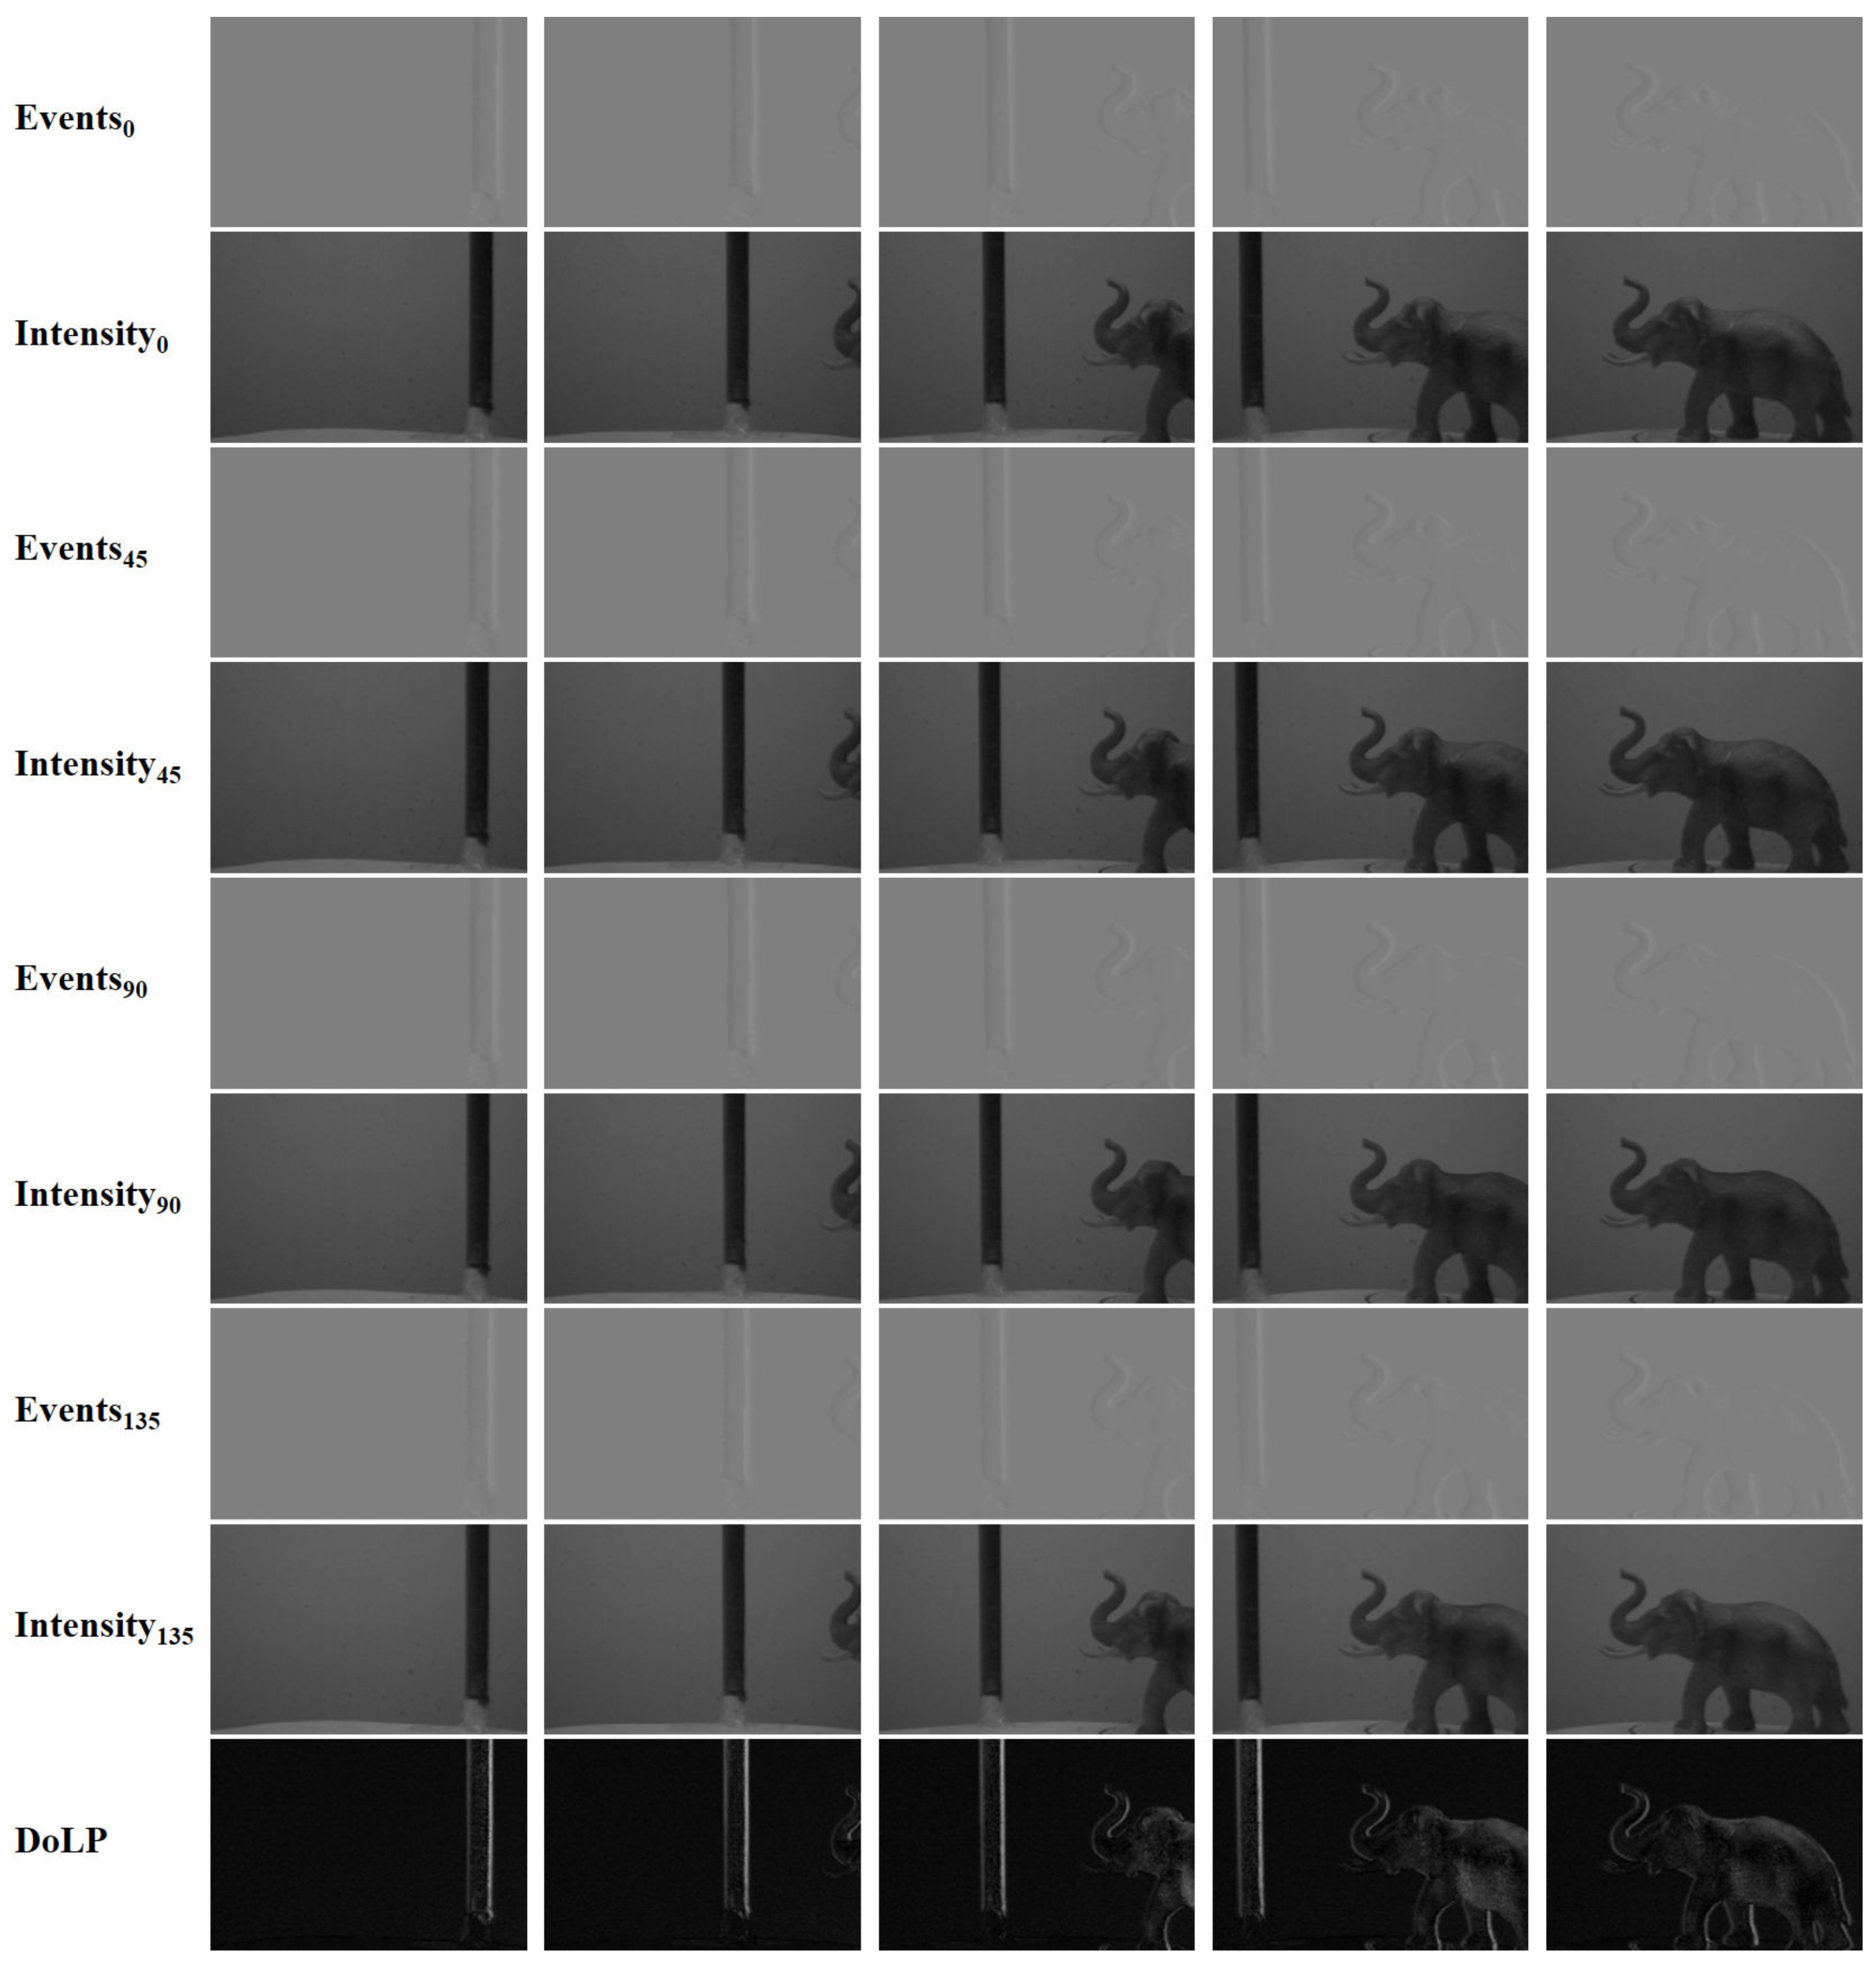
In the experiment, we use a CeleX5 event camera, which can switch output modes (intensity frames or events). Due to the camera’s resolution (800 pixels × 1280 pixels), we crop the central area to 480 pixels × 720 pixels and resize it to 120 pixels × 180 pixels for the subsequent calculations. We collect a total of 32 sets of targets, with each set being captured eight times (four sets for events and four sets for intensities). By detecting the appearance time of the landmark in the images and events, we determine the starting time points of multiple sets of data for the same scene. Therefore, we select an area in the upper right corner of the pixel plane for detection. The area size is 45 pixels × 2 pixels. For intensity sets, when the average value in the region is less than 30, we determine that timestamp as the time starting point of the set. For event sets, when 45 negative events accumulate in the area, we record that timestamp as the time starting point of the set. In most of the collected data, calibration can be successfully completed, but there are a few scenes that require further manual fine-tuning of the time starting point. The consistent rotation speed of the turntable ensures one-to-one correspondence between subsequent moments. An example set after calibration is shown in Figure 8. The DoLPs in Figure 8 are calculated using the intensity images obtained at the four AoPs.

5. Results and Discussion

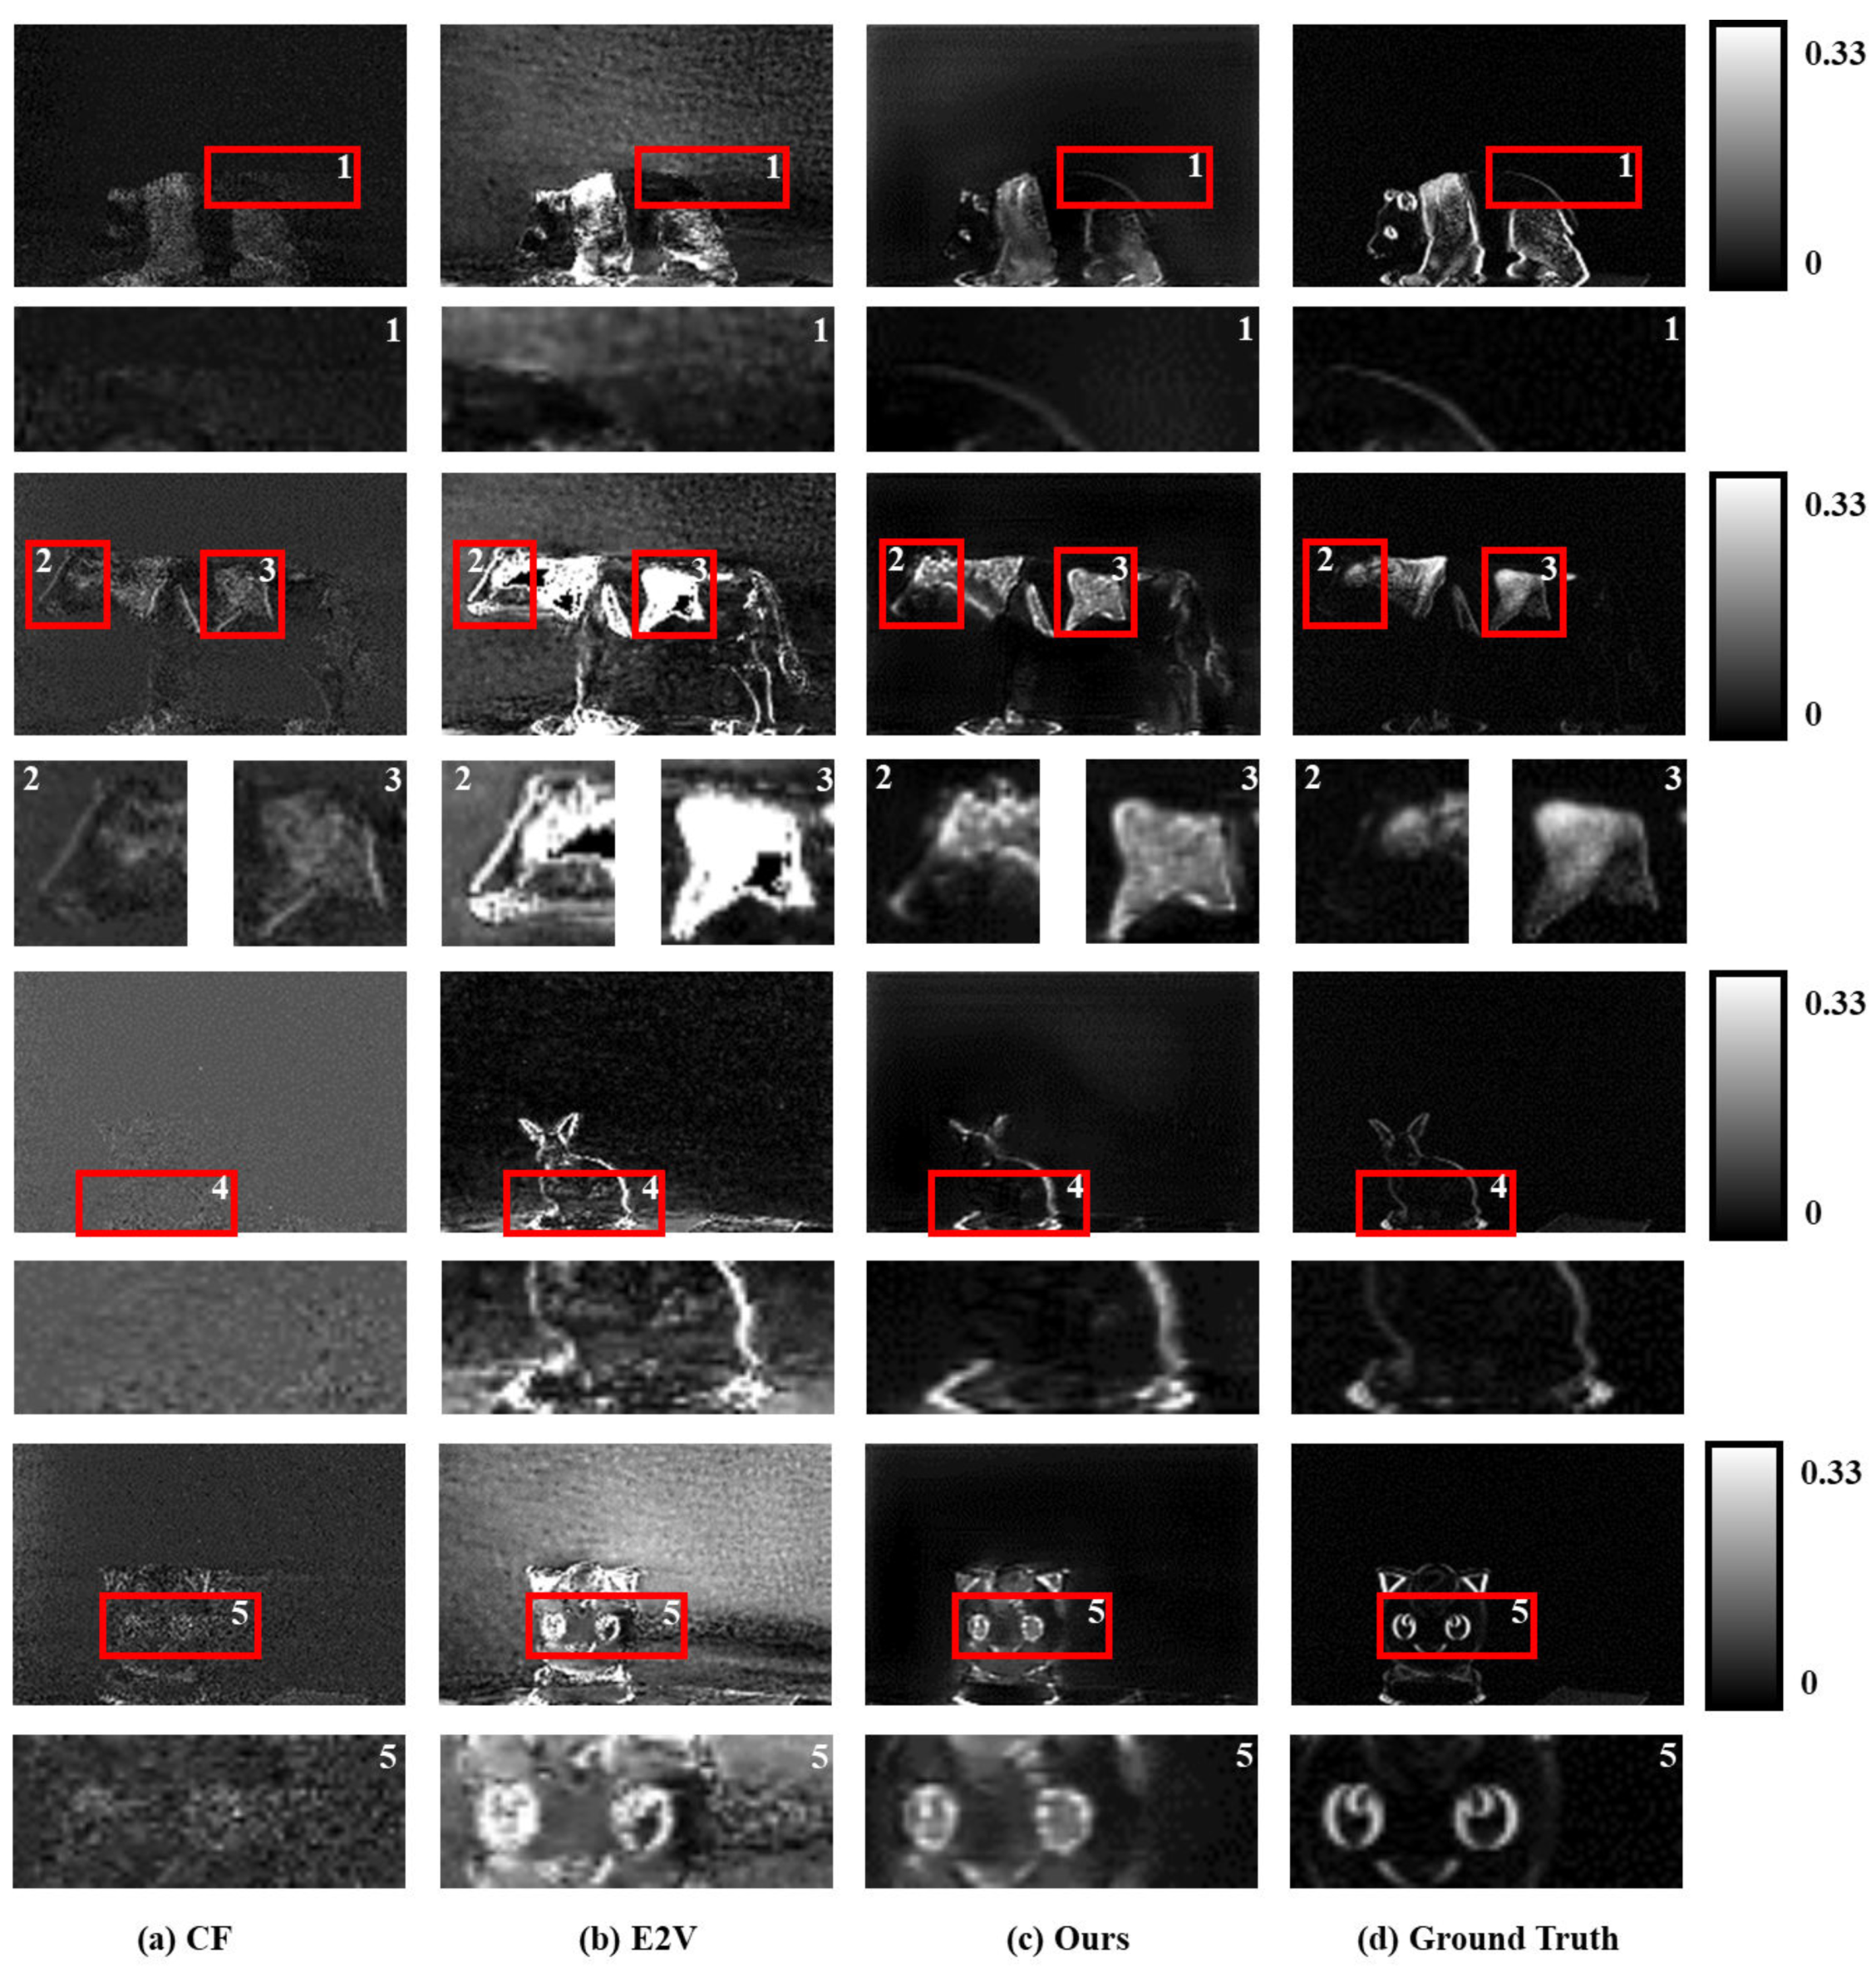
We compare the effectiveness of the proposed dataset simulation approach and end-to-end DoLP recovery network model with that of existing methods. As non-DoT polarization event systems cannot directly calculate DoLPs, existing methods first need to recover the intensity distributions at the four AoPs and then use the Stokes formula for DoLP calculation. We select two classic recovery algorithms for event stream intensities: Complementary Filter (CF) [5] is a traditional event stream intensity recovery algorithm, and Events to Video (E2V) [6] is a classic deep learning algorithm. Both algorithms input only events to reconstruct intensity at the four AoPs. In the experiment, both are set to their default parameters and intensity images are recovered at four AoPs to calculate DoLPs using the Stokes formula Equations (1) and (2).
The experimental results indicate that the network model trained on the simulated datasets can accurately recover polarization in real-world scenarios. This verifies the effectiveness of the dataset simulated using RGB data. As shown in Figure 9, DoLP recovery using CF and E2V is limited by the image reconstruction results and a noticeable trailing phenomenon occurs in the motion direction of the target, as shown by the red boxes numbered 1 and 5. The DoLP image estimated by the E2V method is affected by background noise events, resulting in errors in the background. CF is also affected by noise events, resulting in errors in the target, as shown in the red box numbered 5 in Figure 9a. The proposed method has clearer outlines, has a clean background, and is not affected by event trailing. As shown in the red boxes numbered 2 and 3, the DoLP estimated by CF is low, and the DoLP estimated by E2V is high but contains nonsmooth mutations. The red boxes numbered 4 suggest that when the target DoLP is low, CF cannot easily calculate the edge of the polarized target correctly; E2V can calculate it, but the edges are blurred. By contrast, our method can complete the edge well.
In summary, the real-scene experiments indicate that the results of CF and E2V estimation are affected by the quality of the reconstructed intensity image. Moreover, the DoLP of the target is difficult to estimate correctly, and it is affected by noise events, whether in the background or the target area. The proposed method, trained using the RGB simulation dataset, can work in real scenes and achieve better results than existing approaches.
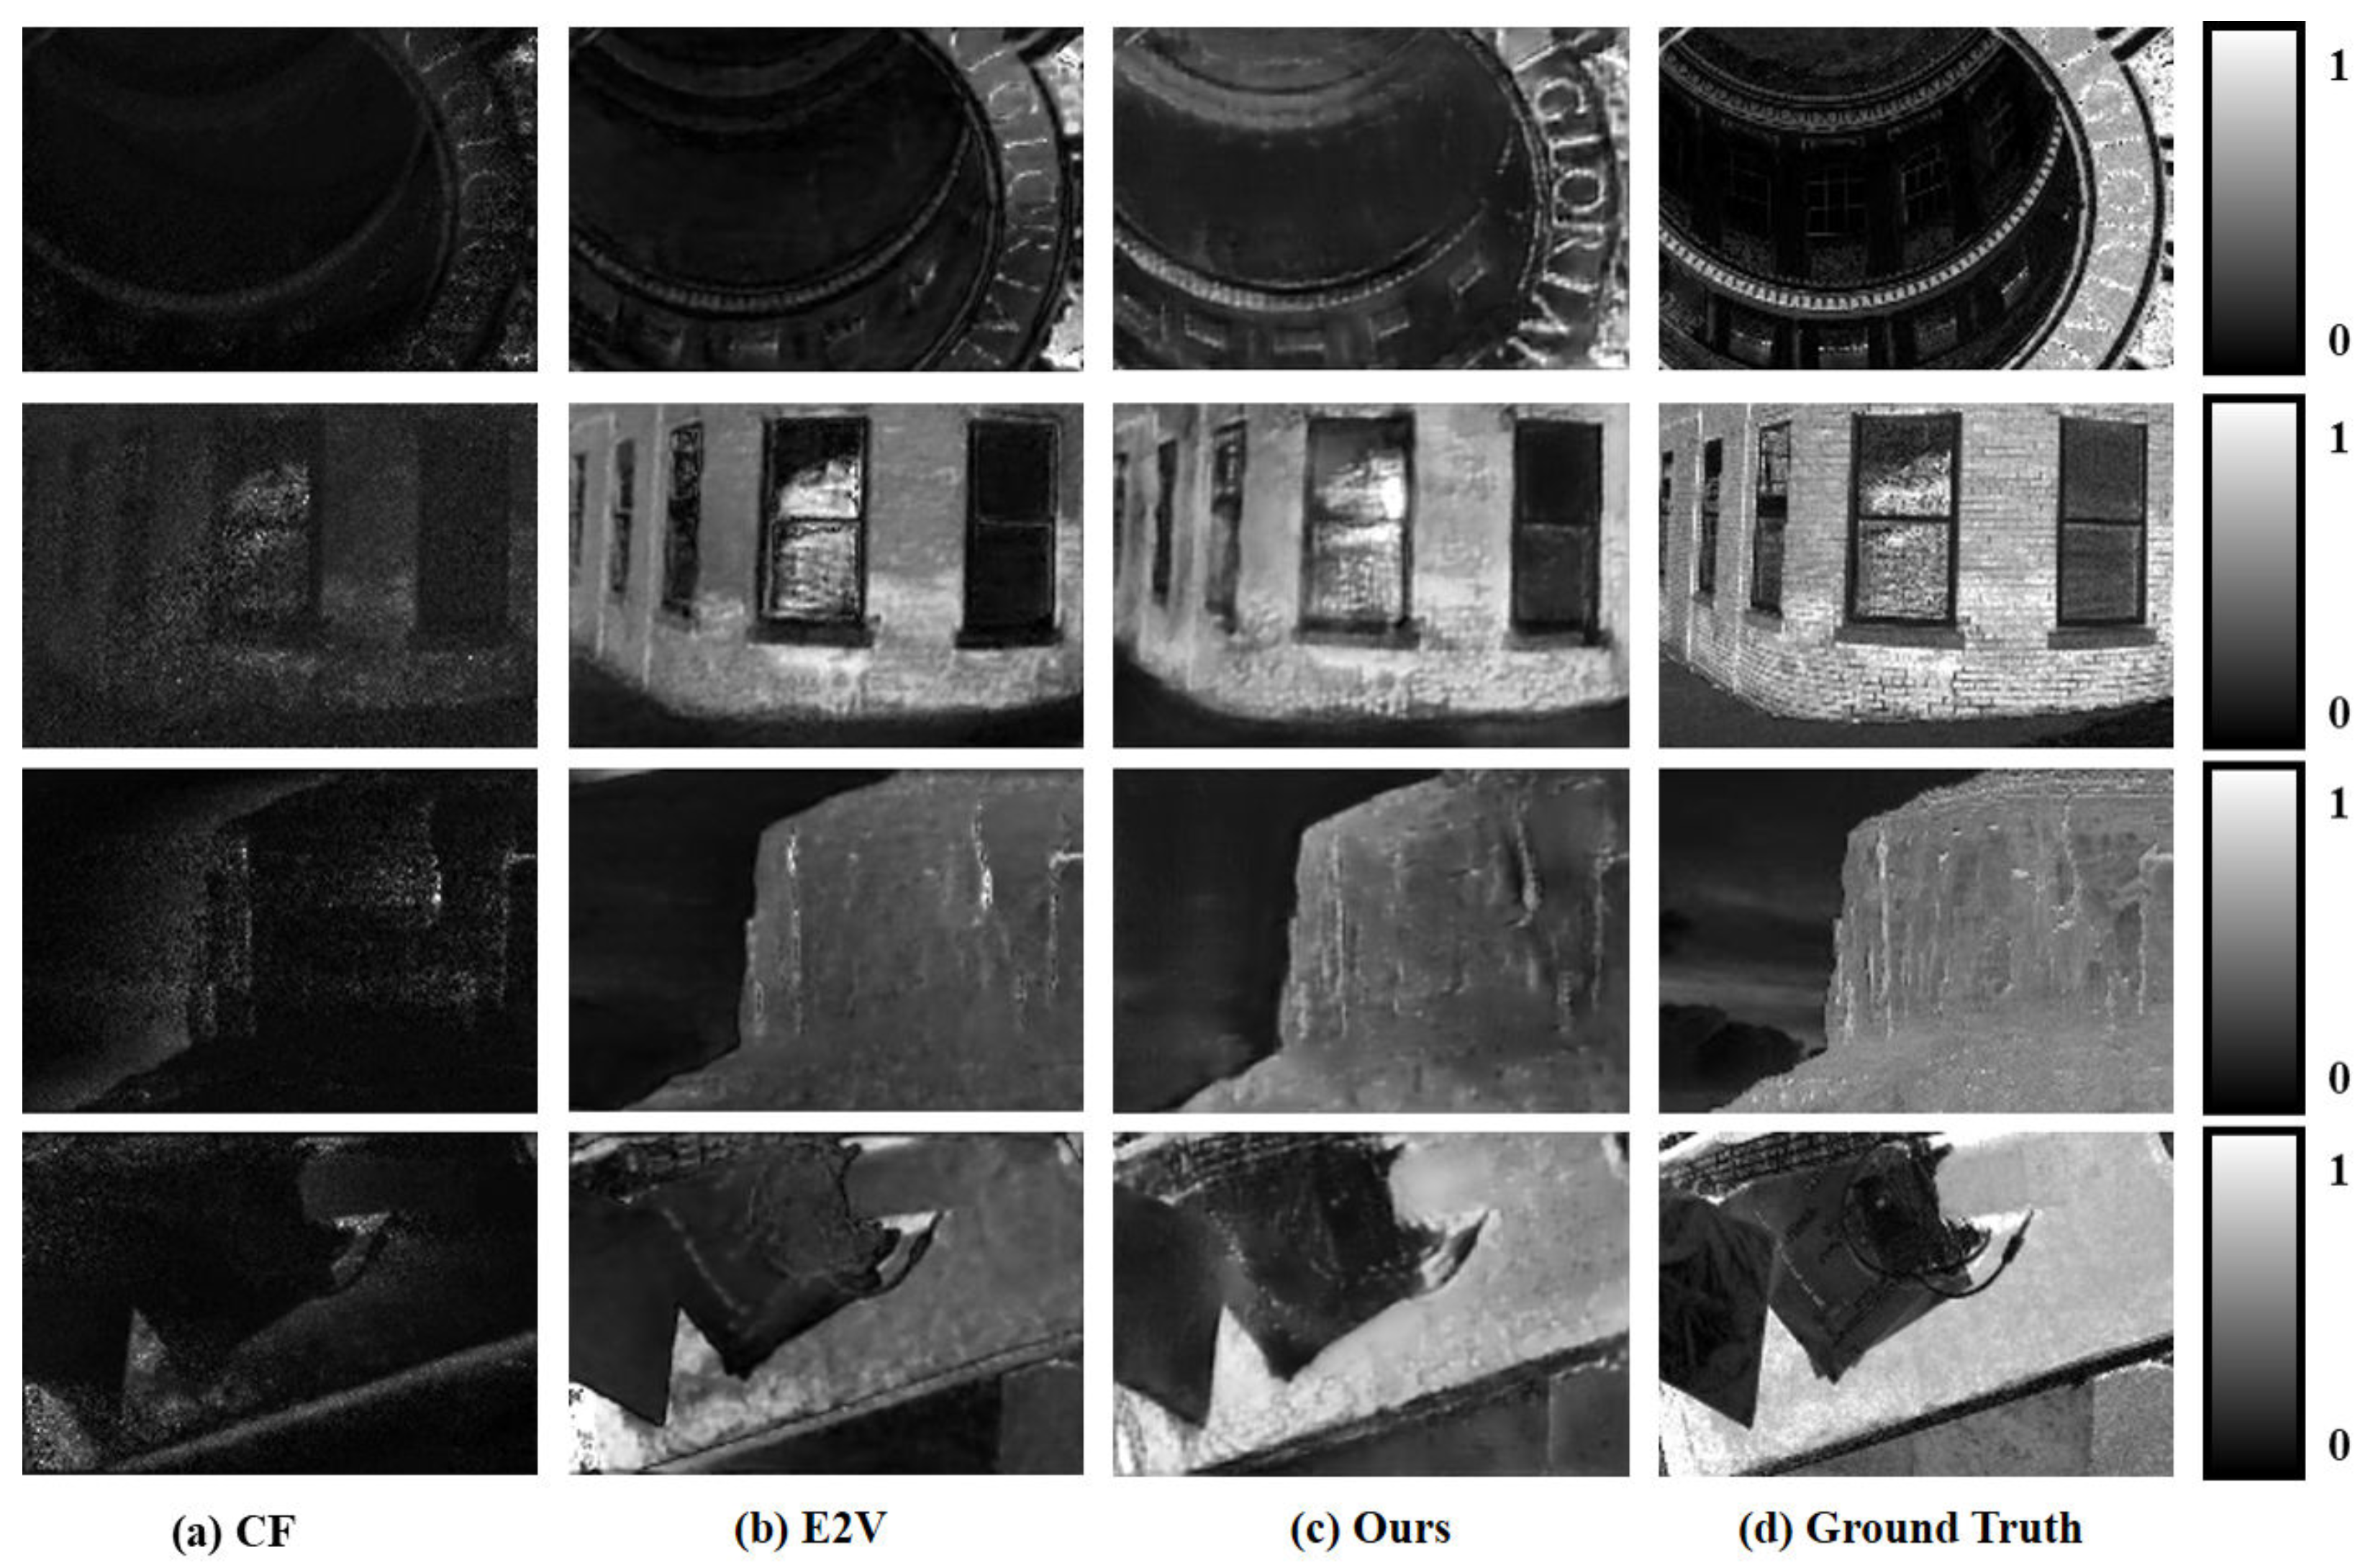
Due to the limitations of the constructed DoT system, only simple object movements can be performed. For further evaluation of the DoLP recovery effect under complex motion, we use simulated polarization events for comparison. We use the same parameter settings as those for the simulation training set and select 50 sets of images that are not in the training set for simulation experiments. As shown in Figure 10, correctly recovering the DoLP distribution of the scene using CF in complex scenes and movements is difficult. Compared with the proposed method, although E2V can also recover the DoLP of the scene, its error is larger. Overall, the proposed network model can better recover the DoLP of the scene and exhibits better performance in complex scenes and motions. To evaluate DoLP recovery objectively, we use the MSE, peak signal-to-noise ratio (PSNR), SSIM, and LPIPS for metric comparison, as shown in Table 2. Our method outperforms the existing approaches in both the real and simulated scenes.
To further assess how many events are needed for a non-DoT event-based imaging polarimeters to work effectively, we conducted additional experiments. As shown in Figure 11, t refers to the timestamp of the last event in the input event tensor, and n refers to the total number of events contained in the input event tensor (average number of events at the four AoPs). For example, In Figure 11a, when t = 24 ms and n = 79,191, it means that the input event tensors at the four AoPs contain 79,191 events on average within the time range of 0–24 ms. In Figure 11b, when t = 35 ms and n = 100,000, it means that the input event tensor at each AoP contains 100,000 events with the last timestamp less than 35 ms.
From Figure 11a, it can be observed that at the beginning of the motion, there are very few events, which are insufficient to effectively recover the target’s DoLP. As the motion continues, the number of input events increases, and the recovery effect of the DoLP gradually improves, eventually stabilizing. In our experiment, we find that when the number of input events reaches about 100,000, the recovery of DoLP can achieve good results. Considering that the target occupies approximately a 240 pixels × 400 pixels area (before resizing), the event occurrence rate is 1.04 (events per pixel). In Figure 11b, it shows that it is possible to recover DoLP with a very high temporal resolution, by overlapping some events during continuous motion as input. At this point, it can be considered that the time resolution of DoLP is close to the event camera itself, at the sub-millisecond level.

6. Conclusions

We propose a training dataset simulation method and an end-to-end DoLP recovery network. We simulate events and DoLP ground truths at multiple AoPs from existing RGB image datasets for network training. This effectively reduces the resources and time required for system setup and training set collection. Since the DoLP is difficult to calculate directly for event-based non-DoT polarimeters, we propose the end-to-end U-Net-like network structure combining a swin transformer block, a residual block, and a ConvGRU. This can directly recover DoLPs from polarization events. Finally, we build an event-based DoT imaging polarimeter by controlling the motion of the target in the scene to collect events at different AoPs multiple times and achieve the effect of a non-DoT system. Multiple sets of data are collected to verify the effectiveness of the proposed array training set and end-to-end network. In future studies, we will build a non-DoT polarization event system to experiment with the advantages and application effects of using an event camera in polarimetric imaging systems.

Author Contributions

Conceptualization, C.Y.; Data curation, C.Y., X.Z. and C.W.; Formal analysis, C.Y. and X.Z.; Funding acquisition, X.W.; Investigation, C.Y.; Methodology, C.Y. and X.Z.; Project administration, C.Y. and X.W.; Resources, C.Y.; Software, C.Y. and Q.S.; Supervision, C.Y. and X.W.; Validation, C.Y. and Q.S.; Visualization, C.Y. and Y.Z.; Writing—original draft, C.Y.; Writing—review and editing, C.Y., X.W. and X.Z. All authors have read and agreed to the published version of the manuscript.

Funding

This research was funded by the National Natural Science Foundation of China, grant number 62031018.

Data Availability Statement

The datasets presented in this paper are available from authors.

Acknowledgments

The authors wish to thank the editors and the reviewers for their valuable suggestions.

Conflicts of Interest

The authors declare no conflicts of interest.

References

  1. Gallego, G.; Delbrück, T.; Orchard, G.; Bartolozzi, C.; Taba, B.; Censi, A.; Leutenegger, S.; Davison, A.J.; Conradt, J.; Daniilidis, K.; et al. Event-based vision: A survey. IEEE Trans. Pattern Anal. Mach. Intell. 2020, 44, 154–180. [Google Scholar] [CrossRef] [PubMed]
  2. Gallego, G.; Lund, J.E.; Mueggler, E.; Rebecq, H.; Delbruck, T.; Scaramuzza, D. Event-based, 6-DOF camera tracking from photometric depth maps. IEEE Trans. Pattern Anal. Mach. Intell. 2017, 40, 2402–2412. [Google Scholar] [CrossRef] [PubMed]
  3. Vidal, A.R.; Rebecq, H.; Horstschaefer, T.; Scaramuzza, D. Ultimate SLAM? Combining events, images, and IMU for robust visual SLAM in HDR and high-speed scenarios. IEEE Robot. Autom. Lett. 2018, 3, 994–1001. [Google Scholar] [CrossRef]
  4. Hidalgo-Carrió, J.; Gallego, G.; Scaramuzza, D. Event-aided direct sparse odometry. In Proceedings of the IEEE/CVF Conference on Computer Vision and Pattern Recognition, New Orleans, LA, USA, 18–24 June 2022; pp. 5781–5790. [Google Scholar]
  5. Scheerlinck, C.; Barnes, N.; Mahony, R. Continuous-time intensity estimation using event cameras. In Proceedings of the Computer Vision–ACCV 2018: 14th Asian Conference on Computer Vision, Perth, Australia, 2–6 December 2018; Revised Selected Papers, Part V. Springer: Berlin/Heidelberg, Germany, 2019; pp. 308–324. [Google Scholar]
  6. Rebecq, H.; Ranftl, R.; Koltun, V.; Scaramuzza, D. High speed and high dynamic range video with an event camera. IEEE Trans. Pattern Anal. Mach. Intell. 2019, 43, 1964–1980. [Google Scholar] [CrossRef]
  7. Zou, Y.; Zheng, Y.; Takatani, T.; Fu, Y. Learning to reconstruct high speed and high dynamic range videos from events. In Proceedings of the IEEE/CVF Conference on Computer Vision and Pattern Recognition, Virtual, 19–25 June 2021; pp. 2024–2033. [Google Scholar]
  8. Zhu, L.; Wang, X.; Chang, Y.; Li, J.; Huang, T.; Tian, Y. Event-based video reconstruction via potential-assisted spiking neural network. In Proceedings of the IEEE/CVF Conference on Computer Vision and Pattern Recognition, New Orleans, LA, USA, 18–24 June 2022; pp. 3594–3604. [Google Scholar]
  9. Zhu, A.Z.; Yuan, L.; Chaney, K.; Daniilidis, K. Unsupervised event-based learning of optical flow, depth, and egomotion. In Proceedings of the IEEE/CVF Conference on Computer Vision and Pattern Recognition, Long Beach, CA, USA, 15–20 June 2019; pp. 989–997. [Google Scholar]
  10. Zheng, Y.; Yu, Z.; Wang, S.; Huang, T. Spike-Based Motion Estimation for Object Tracking Through Bio-Inspired Unsupervised Learning. IEEE Trans. Image Process. 2022, 32, 335–349. [Google Scholar] [CrossRef] [PubMed]
  11. Liu, M.; Delbruck, T. EDFLOW: Event driven optical flow camera with keypoint detection and adaptive block matching. IEEE Trans. Circuits Syst. Video Technol. 2022, 32, 5776–5789. [Google Scholar] [CrossRef]
  12. Ge, Z.; Meng, N.; Song, L.; Lam, E.Y. Dynamic laser speckle analysis using the event sensor. Appl. Opt. 2021, 60, 172–178. [Google Scholar] [CrossRef] [PubMed]
  13. Ge, Z.; Zhang, P.; Gao, Y.; So, H.K.H.; Lam, E.Y. Lens-free motion analysis via neuromorphic laser speckle imaging. Opt. Express 2022, 30, 2206–2218. [Google Scholar] [CrossRef] [PubMed]
  14. Schober, C.; Pruss, C.; Faulhaber, A.; Herkommer, A. Event based coherence scanning interferometry. Opt. Lett. 2021, 46, 4332–4335. [Google Scholar] [CrossRef]
  15. Tang, F.; Gui, L.; Liu, J.; Chen, K.; Lang, L.; Cheng, Y. Metal target detection method using passive millimeter-wave polarimetric imagery. Opt. Express 2020, 28, 13336–13351. [Google Scholar] [CrossRef]
  16. Meng, L.; Kerekes, J.P. Adaptive target detection with a polarization-sensitive optical system. Appl. Opt. 2011, 50, 1925–1932. [Google Scholar] [CrossRef]
  17. Yang, M.; Xu, W.; Sun, Z.; Wu, H.; Tian, Y.; Li, L. Mid-wave infrared polarization imaging system for detecting moving scene. Opt. Lett. 2020, 45, 5884–5887. [Google Scholar] [CrossRef]
  18. Kadambi, A.; Taamazyan, V.; Shi, B.; Raskar, R. Polarized 3d: High-quality depth sensing with polarization cues. In Proceedings of the IEEE International Conference on Computer Vision, Santiago, Chile, 7–13 December 2015; pp. 3370–3378. [Google Scholar]
  19. Huang, X.; Bai, J.; Wang, K.; Liu, Q.; Luo, Y.; Yang, K.; Zhang, X. Target enhanced 3D reconstruction based on polarization-coded structured light. Opt. Express 2017, 25, 1173–1184. [Google Scholar] [CrossRef] [PubMed]
  20. Zhao, Y.; Wang, X.; Zhang, Y.; Fang, Y.; Su, B. Polarization-based approach for multipath interference mitigation in time-of-flight imaging. Appl. Opt. 2022, 61, 7206–7217. [Google Scholar] [CrossRef] [PubMed]
  21. Huang, B.; Liu, T.; Hu, H.; Han, J.; Yu, M. Underwater image recovery considering polarization effects of objects. Opt. Express 2016, 24, 9826–9838. [Google Scholar] [CrossRef]
  22. Dubreuil, M.; Delrot, P.; Leonard, I.; Alfalou, A.; Brosseau, C.; Dogariu, A. Exploring underwater target detection by imaging polarimetry and correlation techniques. Appl. Opt. 2013, 52, 997–1005. [Google Scholar] [CrossRef]
  23. Tyo, J.S.; Goldstein, D.L.; Chenault, D.B.; Shaw, J.A. Review of passive imaging polarimetry for remote sensing applications. Appl. Opt. 2006, 45, 5453–5469. [Google Scholar] [CrossRef]
  24. Zhou, G.; Wang, J.; Xu, W.; Zhang, K.; Ma, Z. Polarization Patterns of Transmitted Celestial Light under Wavy Water Surfaces. Remote Sens. 2017, 9, 324. [Google Scholar] [CrossRef]
  25. Yan, L.; Li, Y.; Chen, W.; Lin, Y.; Zhang, F.; Wu, T.; Peltoniemi, J.; Zhao, H.; Liu, S.; Zhang, Z. Temporal and Spatial Characteristics of the Global Skylight Polarization Vector Field. Remote Sens. 2022, 14, 2193. [Google Scholar] [CrossRef]
  26. Cheng, H.; Zhang, Q.; Wan, Z.; Zhang, Z.; Qin, J. Study on the Polarization Pattern Induced by Wavy Water Surfaces. Remote Sens. 2023, 15, 4565. [Google Scholar] [CrossRef]
  27. Hawks, M.; Dexter, M. Event-based imaging polarimeter. Opt. Eng. 2022, 61, 053101. [Google Scholar] [CrossRef]
  28. Lu, X.; Li, F.; Xiao, B.; Yang, X.; Xin, L.; Liu, Z. Polarization imaging detection method based on dynamic vision sensor. In Proceedings of the Seventh Symposium on Novel Photoelectronic Detection Technology and Applications, Kunming, China, 5–7 November 2020; SPIE: Bellingham, WA, USA, 2020; Volume 11763, pp. 242–251. [Google Scholar]
  29. Lu, X.; Li, F.; Yang, X.; Zhao, Z.; Hou, J. Rotary polarization detection imaging system based on dynamic vision sensor. Opt. Precis. Eng. 2021, 29, 2754–2762. (In Chinese) [Google Scholar] [CrossRef]
  30. Haessig, G.; Joubert, D.; Haque, J.; Chen, Y.; Milde, M.; Delbruck, T.; Gruev, V. Bio-inspired polarization event camera. arXiv 2021, arXiv:2112.01933. [Google Scholar]
  31. Mahowald, M. VLSI Analogs of Neuronal Visual Processing: A Synthesis of Form and Function. Ph.D. Dissertation, California Institute of Technology, Pasadena, CA, USA, 1992. [Google Scholar]
  32. Lichtsteiner, P.; Posch, C.; Delbruck, T. A 128 × 128 120 dB 15 µs latency asynchronous temporal contrast vision sensor. IEEE J. Solid-State Circuits 2008, 43, 566–576. [Google Scholar] [CrossRef]
  33. Liu, S.C.; Delbruck, T. Neuromorphic sensory systems. Curr. Opin. Neurobiol. 2010, 20, 288–295. [Google Scholar] [CrossRef] [PubMed]
  34. Delbrück, T.; Linares-Barranco, B.; Culurciello, E.; Posch, C. Activity-driven, event-based vision sensors. In Proceedings of the 2010 IEEE International Symposium on Circuits and Systems, Paris, France, 30 May–2 June 2010; IEEE: Piscataway, NJ, USA, 2010; pp. 2426–2429. [Google Scholar]
  35. Posch, C.; Matolin, D.; Wohlgenannt, R. A QVGA 143 dB dynamic range frame-free PWM image sensor with lossless pixel-level video compression and time-domain CDS. IEEE J. Solid-State Circuits 2010, 46, 259–275. [Google Scholar] [CrossRef]
  36. Posch, C.; Matolin, D.; Wohlgenannt, R. A QVGA 143dB dynamic range asynchronous address-event PWM dynamic image sensor with lossless pixel-level video compression. In Proceedings of the 2010 IEEE International Solid-State Circuits Conference-(ISSCC), San Francisco, CA, USA, 7–11 February 2010; IEEE: Piscataway, NJ, USA, 2010; pp. 400–401. [Google Scholar]
  37. Berner, R.; Brandli, C.; Yang, M.; Liu, S.; Delbruck, T. A 240 × 180 130 dB 3 s latency global shutter spatiotemporal vision sensor. IEEE J. Solid-State 2013, 49, 2333–2341. [Google Scholar]
  38. Berner, R.; Brandli, C.; Yang, M.; Liu, S.C.; Delbruck, T. A 240 × 180 10 mw 12 us latency sparse-output vision sensor for mobile applications. In Proceedings of the 2013 Symposium on VLSI Circuits, Kyoto, Japan, 12–14 June 2013; IEEE: Piscataway, NJ, USA, 2013; pp. C186–C187. [Google Scholar]
  39. Chen, S.; Guo, M. Live demonstration: CeleX-V: A 1M pixel multi-mode event-based sensor. In Proceedings of the 2019 IEEE/CVF Conference on Computer Vision and Pattern Recognition Workshops (CVPRW), Long Beach, CA, USA, 16–20 June 2019; IEEE: Piscataway, NJ, USA, 2019; pp. 1682–1683. [Google Scholar]
  40. Finateu, T.; Niwa, A.; Matolin, D.; Tsuchimoto, K.; Mascheroni, A.; Reynaud, E.; Mostafalu, P.; Brady, F.; Chotard, L.; LeGoff, F.; et al. 5.10 a 1280 × 720 back-illuminated stacked temporal contrast event-based vision sensor with 4.86 µm pixels, 1.066 GEPS readout, programmable event-rate controller and compressive data-formatting pipeline. In Proceedings of the 2020 IEEE International Solid-State Circuits Conference-(ISSCC), San Francisco, CA, USA, 16–20 February 2020; IEEE: Piscataway, NJ, USA, 2020; pp. 112–114. [Google Scholar]
  41. Suh, Y.; Choi, S.; Ito, M.; Kim, J.; Lee, Y.; Seo, J.; Jung, H.; Yeo, D.H.; Namgung, S.; Bong, J.; et al. A 1280 × 960 dynamic vision sensor with a 4.95-µm pixel pitch and motion artifact minimization. In Proceedings of the 2020 IEEE International Symposium on Circuits and Systems (ISCAS), Virtual, 10–21 October 2020; IEEE: Piscataway, NJ, USA, 2020; pp. 1–5. [Google Scholar]
  42. Rebecq, H.; Ranftl, R.; Koltun, V.; Scaramuzza, D. Events-to-video: Bringing modern computer vision to event cameras. In Proceedings of the IEEE/CVF Conference on Computer Vision and Pattern Recognition, Long Beach, CA, USA, 5–20 June 2019; pp. 3857–3866. [Google Scholar]
  43. Walraven, R. Polarization imagery. Opt. Eng. 1981, 20, 14–18. [Google Scholar] [CrossRef]
  44. Gendre, L.; Foulonneau, A.; Bigué, L. Stokes imaging polarimetry using a single ferroelectric liquid crystal modulator. In Proceedings of the Polarization: Measurement, Analysis, and Remote Sensing IX, Orlando, FL, USA, 7–8 April 2010; SPIE: Bellingham, WA, USA, 2010; Volume 7672, pp. 106–117. [Google Scholar]
  45. Azzam, R. Arrangement of four photodetectors for measuring the state of polarization of light. Opt. Lett. 1985, 10, 309–311. [Google Scholar] [CrossRef]
  46. Pezzaniti, J.L.; Chenault, D.; Roche, M.; Reinhardt, J.; Schultz, H. Wave slope measurement using imaging polarimetry. In Proceedings of the Ocean Sensing and Monitoring, Orlando, FL, USA, 13–14 April 2009; SPIE: Bellingham, WA, USA, 2009; Volume 7317, pp. 60–72. [Google Scholar]
  47. Pezzaniti, J.L.; Chenault, D.B. A division of aperture MWIR imaging polarimeter. In Proceedings of the Polarization Science and Remote Sensing II, San Diego, CA, USA, 18 August 2005; SPIE: Bellingham, WA, USA, 2005; Volume 5888, pp. 239–250. [Google Scholar]
  48. Liu, J.; Jin, W.; Wang, Y.; Wang, X. Design of Simultaneous Imaging Polarimetry with double separate Wollaston prism. Acta Opt. Sin. 2015, 35, 511001. [Google Scholar] [CrossRef]
  49. Gruev, V.; Perkins, R.; York, T. CCD polarization imaging sensor with aluminum nanowire optical filters. Opt. Express 2010, 18, 19087–19094. [Google Scholar] [CrossRef] [PubMed]
  50. Li, P.; Kang, G.; Vartiainen, I.; Wang, F.; Liu, Y.; Tan, X. Investigation of achromatic micro polarizer array for polarization imaging in visible-infrared band. Optik 2018, 158, 1427–1435. [Google Scholar] [CrossRef]
  51. Schott, J.R. Fundamentals of Polarimetric Remote Sensing; SPIE Press: Bellingham, WA, USA, 2009; Volume 81. [Google Scholar]
  52. Muglikar, M.; Bauersfeld, L.; Moeys, D.P.; Scaramuzza, D. Event-based shape from polarization. In Proceedings of the IEEE/CVF Conference on Computer Vision and Pattern Recognition, Vancouver, BC, Canada, 17–24 June 2023; pp. 1547–1556. [Google Scholar]
  53. Rebecq, H.; Gehrig, D.; Scaramuzza, D. ESIM: An open event camera simulator. In Proceedings of the Conference on Robot Learning, PMLR, Zürich, Switzerland, 29–31 October 2018; pp. 969–982. [Google Scholar]
  54. Hu, Y.; Liu, S.C.; Delbruck, T. v2e: From video frames to realistic DVS events. In Proceedings of the IEEE/CVF Conference on Computer Vision and Pattern Recognition, Nashville, TN, USA, 20–25 June 2021; pp. 1312–1321. [Google Scholar]
  55. Joubert, D.; Marcireau, A.; Ralph, N.; Jolley, A.; van Schaik, A.; Cohen, G. Event camera simulator improvements via characterized parameters. Front. Neurosci. 2021, 15, 702765. [Google Scholar] [CrossRef] [PubMed]
  56. Ronneberger, O.; Fischer, P.; Brox, T. U-net: Convolutional networks for biomedical image segmentation. In Proceedings of the Medical Image Computing and Computer-Assisted Intervention–MICCAI 2015: 18th International Conference, Munich, Germany, 5–9 October 2015; Proceedings, Part III 18. Springer: Berlin/Heidelberg, Germany, 2015; pp. 234–241. [Google Scholar]
  57. He, K.; Zhang, X.; Ren, S.; Sun, J. Deep residual learning for image recognition. In Proceedings of the IEEE Conference on Computer Vision and Pattern Recognition, Las Vegas, NV, USA, 26 June–1 July 2016; pp. 770–778. [Google Scholar]
  58. Liu, Z.; Lin, Y.; Cao, Y.; Hu, H.; Wei, Y.; Zhang, Z.; Lin, S.; Guo, B. Swin transformer: Hierarchical vision transformer using shifted windows. In Proceedings of the IEEE/CVF International Conference on Computer Vision, Montreal, BC, Canada, 17 October 2021; pp. 10012–10022. [Google Scholar]
  59. Shi, X.; Chen, Z.; Wang, H.; Yeung, D.Y.; Wong, W.K.; Woo, W.c. Convolutional LSTM network: A machine learning approach for precipitation nowcasting. In Proceedings of the 28th International Conference on Neural Information Processing Systems, Montreal, QC, Canada, 7–12 December 2015; Volume 28. [Google Scholar]
  60. Johnson, J.; Alahi, A.; Fei-Fei, L. Perceptual losses for real-time style transfer and super-resolution. In Proceedings of the Computer Vision—ECCV 2016: 14th European Conference, Amsterdam, The Netherlands, 11–14 October 2016; Proceedings, Part II 14. Springer: Berlin/Heidelberg, Germany, 2016; pp. 694–711. [Google Scholar]
  61. Zhang, R.; Isola, P.; Efros, A.A.; Shechtman, E.; Wang, O. The unreasonable effectiveness of deep features as a perceptual metric. In Proceedings of the IEEE Conference on Computer Vision and Pattern Recognition, Salt Lake City, UT, USA, 18–22 June 2018; pp. 586–595. [Google Scholar]
  62. Bychkovsky, V.; Paris, S.; Chan, E.; Durand, F. Learning photographic global tonal adjustment with a database of input/output image pairs. In Proceedings of the CVPR, Washington, DC, USA, 20–25 June 2011; IEEE: Piscataway, NJ, USA, 2011; pp. 97–104. [Google Scholar]
  63. Paszke, A.; Gross, S.; Chintala, S.; Chanan, G.; Yang, E.; DeVito, Z.; Lin, Z.; Desmaison, A.; Antiga, L.; Lerer, A. Automatic differentiation in pytorch. In Proceedings of the NIPS 2017 Workshop, Long Beach, CA, USA, 7 December 2017. [Google Scholar]
  64. Kingma, D.P.; Ba, J. Adam: A method for stochastic optimization. arXiv 2014, arXiv:1412.6980. [Google Scholar]
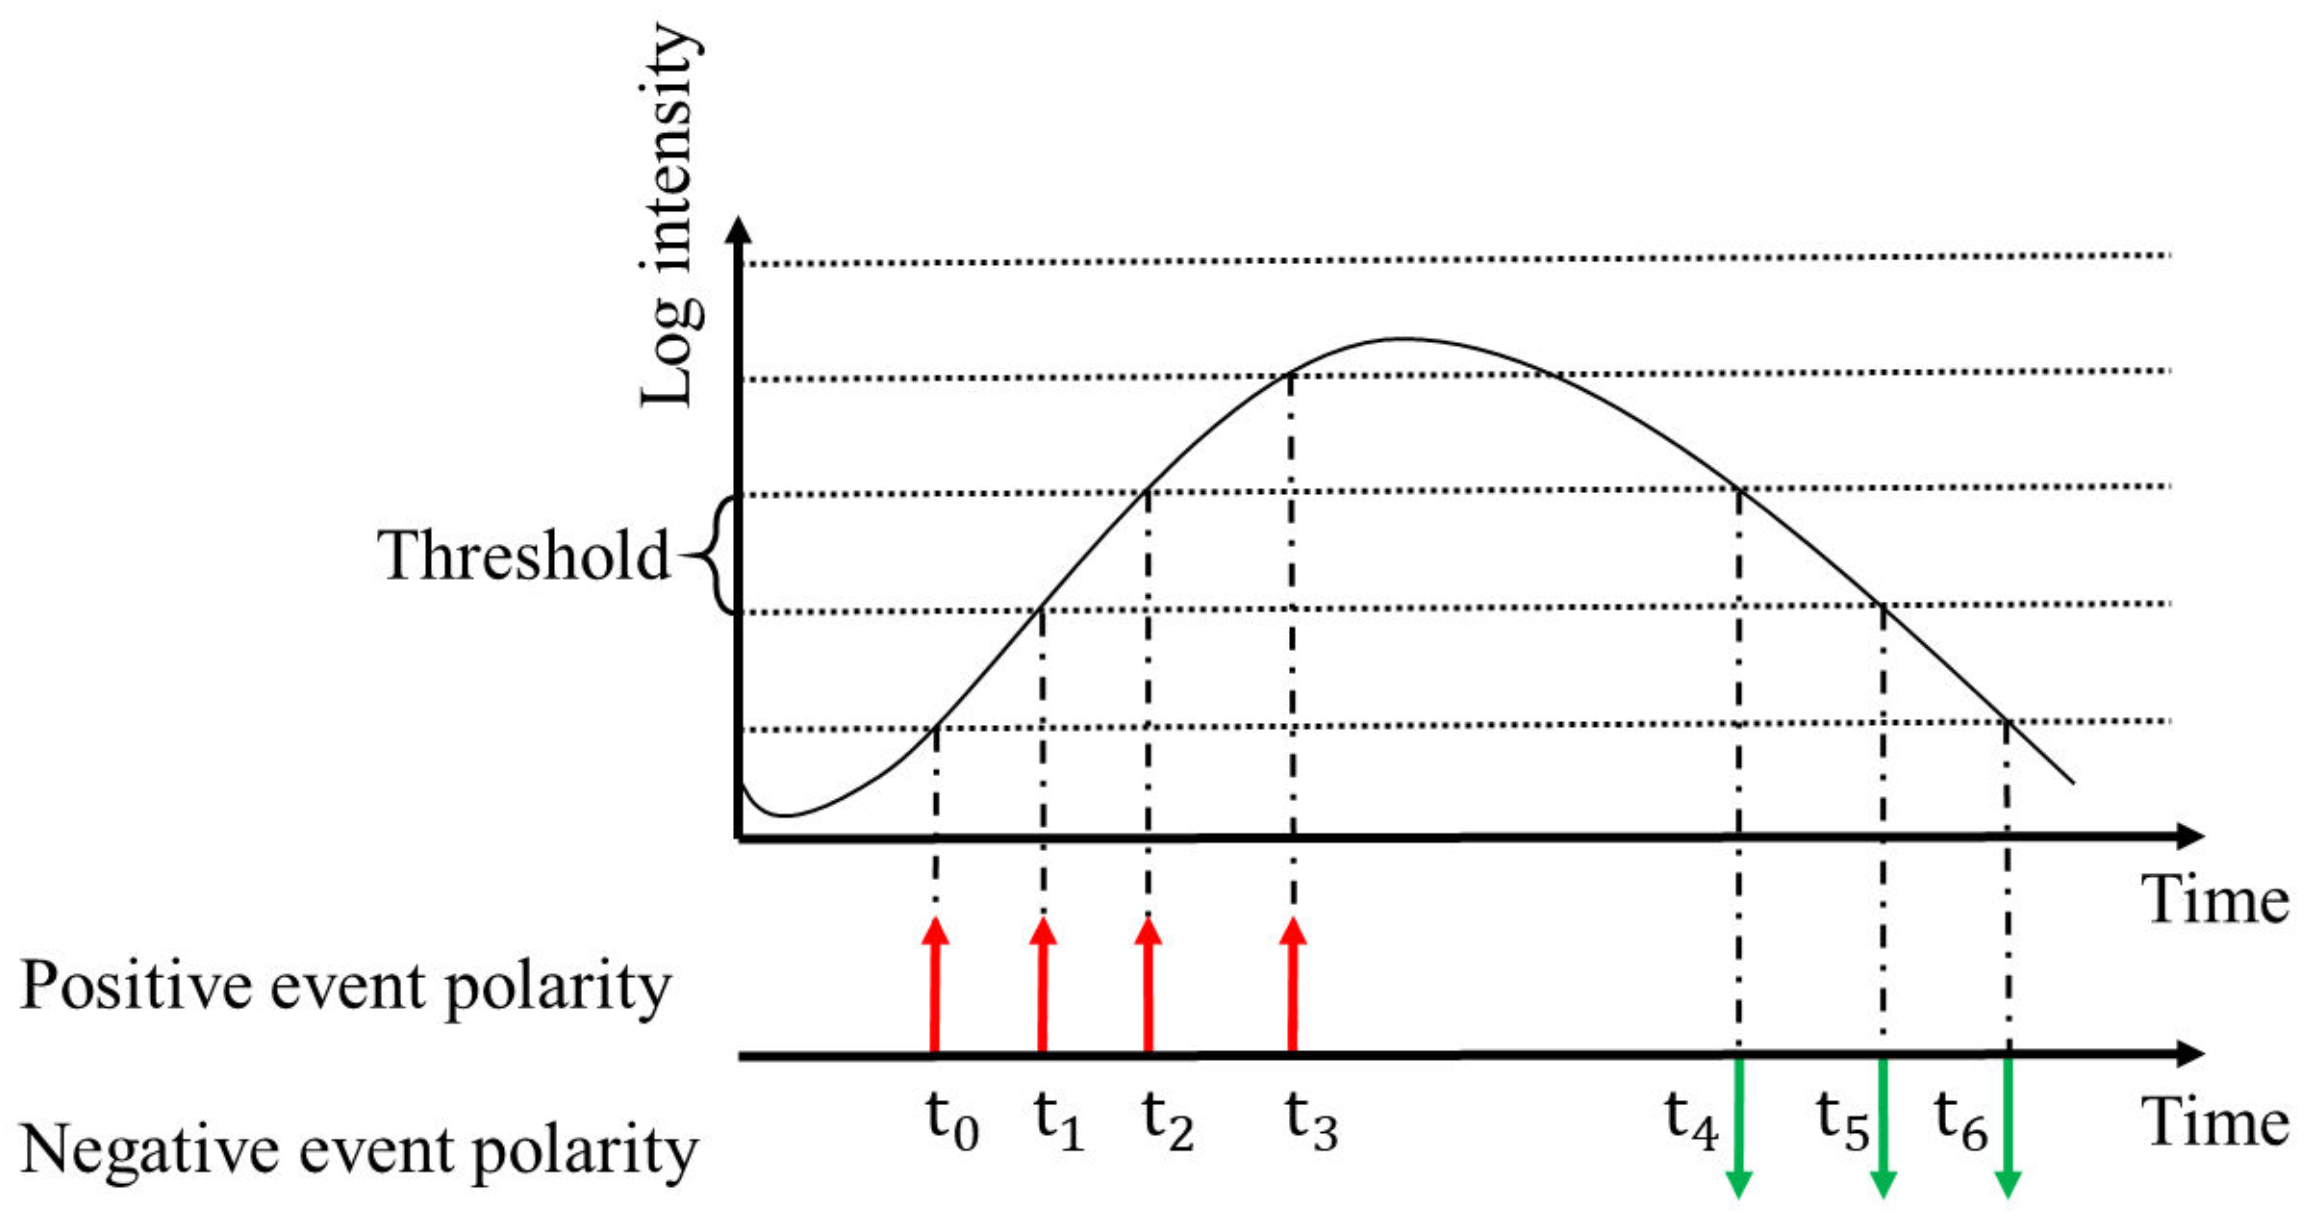
Figure 1. Single-pixel trigger for event cameras.
Photonics 11 00481 g001
Figure 3. Visualization of DoLP and AoP.
Photonics 11 00481 g003
Figure 4. Comparison of polarization visualization and simulation.
Photonics 11 00481 g004
Figure 5. Process of simulating event-based DoLP dataset from RGB images.
Photonics 11 00481 g005
Figure 6. End-to-end event-based DoLP recovery network model.
Photonics 11 00481 g006
Figure 7. Experimental system.
Photonics 11 00481 g007
Figure 8. A set of experimental data sequences.
Photonics 11 00481 g008
Figure 9. Comparison of real-world experimental results.
Photonics 11 00481 g009
Figure 10. Comparison of simulated experimental results.
Photonics 11 00481 g010
Figure 11. Experiment of event number and temporal resolution.
Photonics 11 00481 g011
Table 1. Comparison of imaging polarimeters.
TypeDoLPAoPApplication Scenarios
DoTStatic scene in standard dynamic range (SDR)
Non-DoTStatic scene and slow motion in SDR
Event-based DoTStatic scene in high dynamic range (HDR)
Event-based non-DoTFast and slow motion in HDR
Table 2. Experimental results.
MethodReal ExperimentSimulated Experiment
MSE ↓PSNR ↑SSIM ↑LPIPS ↓MSE ↓PSNR ↑SSIM ↑LPIPS ↓
CF0.008723.170.41160.33420.137110.600.16670.5890
E2V0.013420.020.38190.33500.077812.740.30680.4140
Ours0.0026 27.480.51890.13690.035515.560.39470.3295
Disclaimer/Publisher’s Note: The statements, opinions and data contained in all publications are solely those of the individual author(s) and contributor(s) and not of MDPI and/or the editor(s). MDPI and/or the editor(s) disclaim responsibility for any injury to people or property resulting from any ideas, methods, instructions or products referred to in the content.