Article

Illuminating Life Sciences: A Biophysical Guide to the Use of Chromatic and White Light Sources in Photobiology

by
Mira Mutschlechner
* and
Harald Schöbel
*
Department of Biotechnology & Food Engineering, MCI—The Entrepreneurial School, Maximilianstraße 2, 6020 Innsbruck, Austria
*
Authors to whom correspondence should be addressed.
Photonics 2024, 11(6), 487; https://doi.org/10.3390/photonics11060487
Submission received: 29 April 2024 / Revised: 15 May 2024 / Accepted: 20 May 2024 / Published: 21 May 2024
(This article belongs to the Special Issue Optical Technologies for Biomedical Science)

Abstract

:
With the increasing availability of LEDs, researchers in photobiology have easier access to customized light sources. However, the abundance of different light sources poses new challenges for the correct characterization of existing light conditions. The photobiological effect of a light source depends mainly on the number of photons involved and the spectral composition. However, light sources are mainly described by parameters such as radiant flux, dominant or peak wavelength, and correlated color temperature (CCT). Therefore, in this work, chromatic and white light sources were measured for their spectral composition, various characterization parameters were determined, and the resulting photon flux densities were calculated, focusing on dominant versus peak wavelength for chromatic LEDs and the CCT for white LEDs and fluorescent tubes. The use of the dominant wavelength is inappropriate as it is partly outside the actual spectral range. It was also shown that white light sources with the same CCT have significantly different spectral compositions and, therefore, may have different photobiological effects. The results of this work should serve as a basis for life scientists to better compare light sources, to correctly interpret existing parameters, and to describe light conditions in a standardized and comparable way.

1. Introduction

Photobiology delves into the multidisciplinary study of how light interacts with living organisms, examining its diverse biological effects, ranging from advantageous to detrimental. It covers a wide array of life sciences as light´s effects traverse the intricate nature of biological systems [1]. Amongst others, photobiology includes six major research domains comprising photophysics and photochemistry, photosynthesis, photoreception, photomedicine, ecological photobiology, and optogenetics and optical bioimaging. Additionally, the integration of photobiology into material science and engineering aims towards bio-inspired light harvesting and artificial photosynthesis systems [1]. Conventional lighting systems, such as fluorescent lamps and high-intensity discharge (HID) luminaires (e.g., high-pressure sodium (HPS) and metal halide lamps) are still frequently used in greenhouses and growth chambers [2]. As an increasing emphasis on energy conservation and sustainability, however, propels the adoption of energy-efficient lighting solutions across various sectors, traditional lighting sources are increasingly being replaced by light-emitting diodes (LEDs) and/or organic light-emitting diodes (OLEDs). Due to ongoing advancements in lighting technologies, LEDs offer significant advantages including their extended lifespan as well as a controllable light intensity [2] that render them particularly well suited for continuous year-round greenhouse applications [3]. LEDs’ superior efficiency, low operating temperature, and compact size further facilitate their use in pulsed lighting setups and for interlighting and intracanopy irradiation, thus further reflecting the ongoing trend of widespread adoption across various lighting applications [2]. In this context, both chromatic and broad-spectrum (white) LEDs are increasingly accessible, which can be merged to yield either high fluence, surpassing that of full sunlight if desired, or tailored wavelength characteristics owing to their narrow-bandwidth light spectrum [3]. Up to now, LEDs have been widely used to investigate plant photobiological responses to abiotic stress [4], chlorophyll fluorescence [5], and photosynthetic activity [6], granting the capacity to cater to the fluence and wavelength demands of plants, while simultaneously enabling the enrichment of specific wavelengths to deliver the requisite quantity and quality of light essential for various growth phases [2]. The rates of photosynthesis and growth of cyanobacteria are directly affected by light, which can vary in terms of both spectral quality (color) and intensity [7]. Moreover, light exposure duration (photoperiods) integrates light perception (adaptation to different light regimes) and the circadian clock output information that regulates various physiological, biochemical, and behavioral processes in plants, fungi, and prokaryotes [8]. Rhythmic genes involved in circadian photobiology have been considered to play significant roles in gene expression, cell division timing, taxes, and photosynthesis [9]. Research conducted by Nitschke et al. in 2016 [10] and 2017 [11] unveiled that an abrupt extension of the photoperiod induces a novel form of abiotic stress known as photoperiod stress. This stress condition leads to nightly accumulation of reactive oxygen species (ROS) that triggers a stress response akin to a pathogen infection, as demonstrated by Abuelsoud et al. in 2020 [12] and Cortleven et al. in 2022 [13]. Progress in analyzing bacterial genome sequences further revealed that non-photosynthetic as well as photosynthetic prokaryotes are capable of sensing and responding to multiple light colors [14]. Many of these species adjust their cellular metabolism, growth, and the composition of their phycobilisomes through a process called chromatic acclimation (CA). Originally, CA was thought to cover only species capable of sensing red and green light [7]; however, new forms have progressively been described, which include responses spanning from those to blue to far-red light (far-red light photoacclimation, FaRLiP, 700   n m < λ < 780   n m ) [15].
Above all technological benefits, the utilization of LEDs in the life sciences sector necessitates a more intricate lighting design [16], particularly regarding the maintenance of optical, mechanical, and spectral properties prior to application [3]. The photobiological impact of the light source depends mainly on the involved number of photons and the present spectral power distribution of the artificial light. Inconsistencies in spectral properties might lead to misinterpreted data and cause discrepancies between studies using the same reported light properties [3], which is particularly important regarding dynamic photoenvironments. Additionally, employing LEDs emitting multiple wavelengths, variability in the wavelength ratio, or their combination might cause misinterpretation of specific wavelength effects. In particular, white light sources with the same characteristics, such as correlated color temperature, have significant differences in spectral composition. The aim of this paper is to provide life scientists with a common understanding of light-based physical quantities and their dependence on spectral distribution. Some basic terms are explained, and possible pitfalls of interpretation are pointed out. The focus is on different chromatic and white light sources and the resulting photon flux density. For this purpose, different light sources were investigated, and the spectral power distribution as well as the photon flux density were determined and compared with each other.

2. Physical Perspective on Relevant Quantities

When discussing the interaction of light with a biological system, the “amount” of light involved is a key parameter. Two different approaches have evolved to describe the quantity of light, the energy-based approach and the photon-based approach [17]. Since light transports energy, it is obvious to describe the present light conditions in terms of the incident energy. The incident energy per time and area is also the main quantity measured by radiometers. The photon-based approach takes into account the particle nature of light and uses the number of photons involved. The number of photons per second (also known as photon flux) is a key quantity in photobiology to describe light-related processes such as photosynthesis or light stress [18]. Next to the light output, spectral information is crucial to characterize the used illumination setup. Depending on the type of light source, different quantities can be found in the literature or datasheets. For chromatic light sources (single color), the term dominant wavelength, λ d o m , or peak wavelength, λ p e a k , is used; the dominant wavelength takes the visual perception of the human eye into account, while the peak wavelength does not [19]. Chromaticity coordinates are used for chromatic light sources as well, where the resulting color is produced by color mixing or luminescent layers. For white light sources, the color temperature is a common quantity. Dominant wavelength and chromaticity coordinates are defined within the CIE color space and based on the tristimulus values. These values reflect the sensitivity of the human photoreceptor cells in the retina and can be attributed to the photometric system. The CIE color space is a quantitative way to connect the wavelengths of light with the color perception of the human eye [20]. In contrast, peak wavelength and color temperature are independent of the spectral sensitivity of the human eye and can be assigned to the radiometric system. A direct comparison of these different quantities is not always expedient and can lead to misinterpretations. The mechanism behind visual perception and all its relevant quantities and functions are beyond the scope of this work and are the topic of many publications. Fundamental definitions, values, and models are described in the framework of standards by the International Commission on Illumination (CIE) [21]. However, to understand specified characteristics in manufacturer datasheets, some basic quantities will be discussed.

2.1. Present Energy and Photons

The interaction between a biological system and light is very complex and depends on biotic and abiotic factors. In order to better understand and describe the influence of light, a precise characterization of the existing light conditions is necessary. Although it is not always easy to accurately describe the present light conditions, two different approaches can be used: (1) the energy to which the biological system is exposed (energy-based) or (2) the number of photons involved (photon-based). Furthermore, the existing spectral distribution of the light is crucial for both approaches.

2.1.1. Irradiance

In the energy-based approach, the energy input into the system is of interest. The incident light energy is usually measured with a radiometer, which determines the available energy per time (power) and per area. The corresponding physical quantity is irradiance, E , in watts per square meter ( W m 2 ) or milliwatts per square centimeter ( m W c m 2 ) and can be calculated according to Equation (1).
E = Q t · A = Φ A ,
where Q is the radiant energy in joule ( J ), t is the time in seconds ( s ), and A is the incident area in square meter ( m 2 ). Energy per time is often given as radiant flux, Φ , in watts (W) or joules per seconds ( J s 1 ). Irradiance is often referred to as intensity, I , which is in general the power per area [22].

2.1.2. Photon Flux Density

In life sciences, the photon flux density (PFD) in micromoles per second and per square meter ( μ m o l s 1 m 2 ) is a common quantity and refers to the photon-based approach. The PFD reflects the particle character of light, where light is described as light quanta or photons [23]. This quantity specifies the number of incident photons per second on a unit area as a multiple of the Avogadro constant. Sometimes the unit microeinstein, per second and per square meter ( μ E s 1 m 2 ), is used, which is not an SI unit but describes the same. From the spectral power distribution (irradiance per wavelength) E ( λ ) , the PFD can be calculated according to Equation (2).
P F D = 10 6 c · h · N A   λ 1 λ 2 E λ   d λ
where h = 6.626 · 10 34   J s is the Planck constant, c = 299,792,458   m s 1 is the speed of light, N A = 6.022 · 10 23   m o l 1 is the Avogadro constant, and 10 6 is a factor to convert the result in µ m o l . The bound of integration λ 1 is the lower wavelength and λ 2 is the upper wavelength of the relevant spectrum. For photosynthetically active radiation (PAR), these boundaries correspond to λ 1 = 400   n m and to λ 2 = 700   n m . A detailed description of the photon flux density can be found, for example, in the work of McCree [24]. To obtain the PFD, you either need a spectral radiometer (also known as a quantum meter) that measures irradiance as a function of wavelength and automatically determines the PFD, or you calculate it from the spectral data of the light source (e.g., from a measurement or datasheet) and the actual irradiance according to Equation (2). For chromatic light sources such as LEDs, a quick estimate can also be made from the peak wavelength and irradiance using Equation (3).
P F D a p p r o x = E · λ p e a k c · h · N A ,
where E is the present irradiance in W m 2 and λ p e a k is the peak wavelength of the light source. A detailed discussion of determining PFD for LEDs is given in the work of Walter et al. [25].

2.2. Present Spectral Power Distribution

In addition to the light energy or number of photons involved, the spectral distribution of the light source plays a key role in the interaction with the biological system. For this reason, biological weighting functions such as Photosynthetically Active Radiation (PAR) or average plant response (also known as the McCree curve or plant sensitivity curve) are used in photobiology [26]. The weighting functions take the spectral response of a biological system into account and, therefore, can only be used for specific applications. The spectral distribution is determined by the light source used. Depending on the type, the resulting light is composed of different spectral components. Especially for white light sources, the spectral distribution differs significantly between different types of sources. Depending on the light source available, there are different physical quantities to describe the spectral distribution. Therefore, datasheets for artificial light sources include different quantities such as dominant wavelength, peak wavelength, correlated color temperature, or chromaticity coordinates.

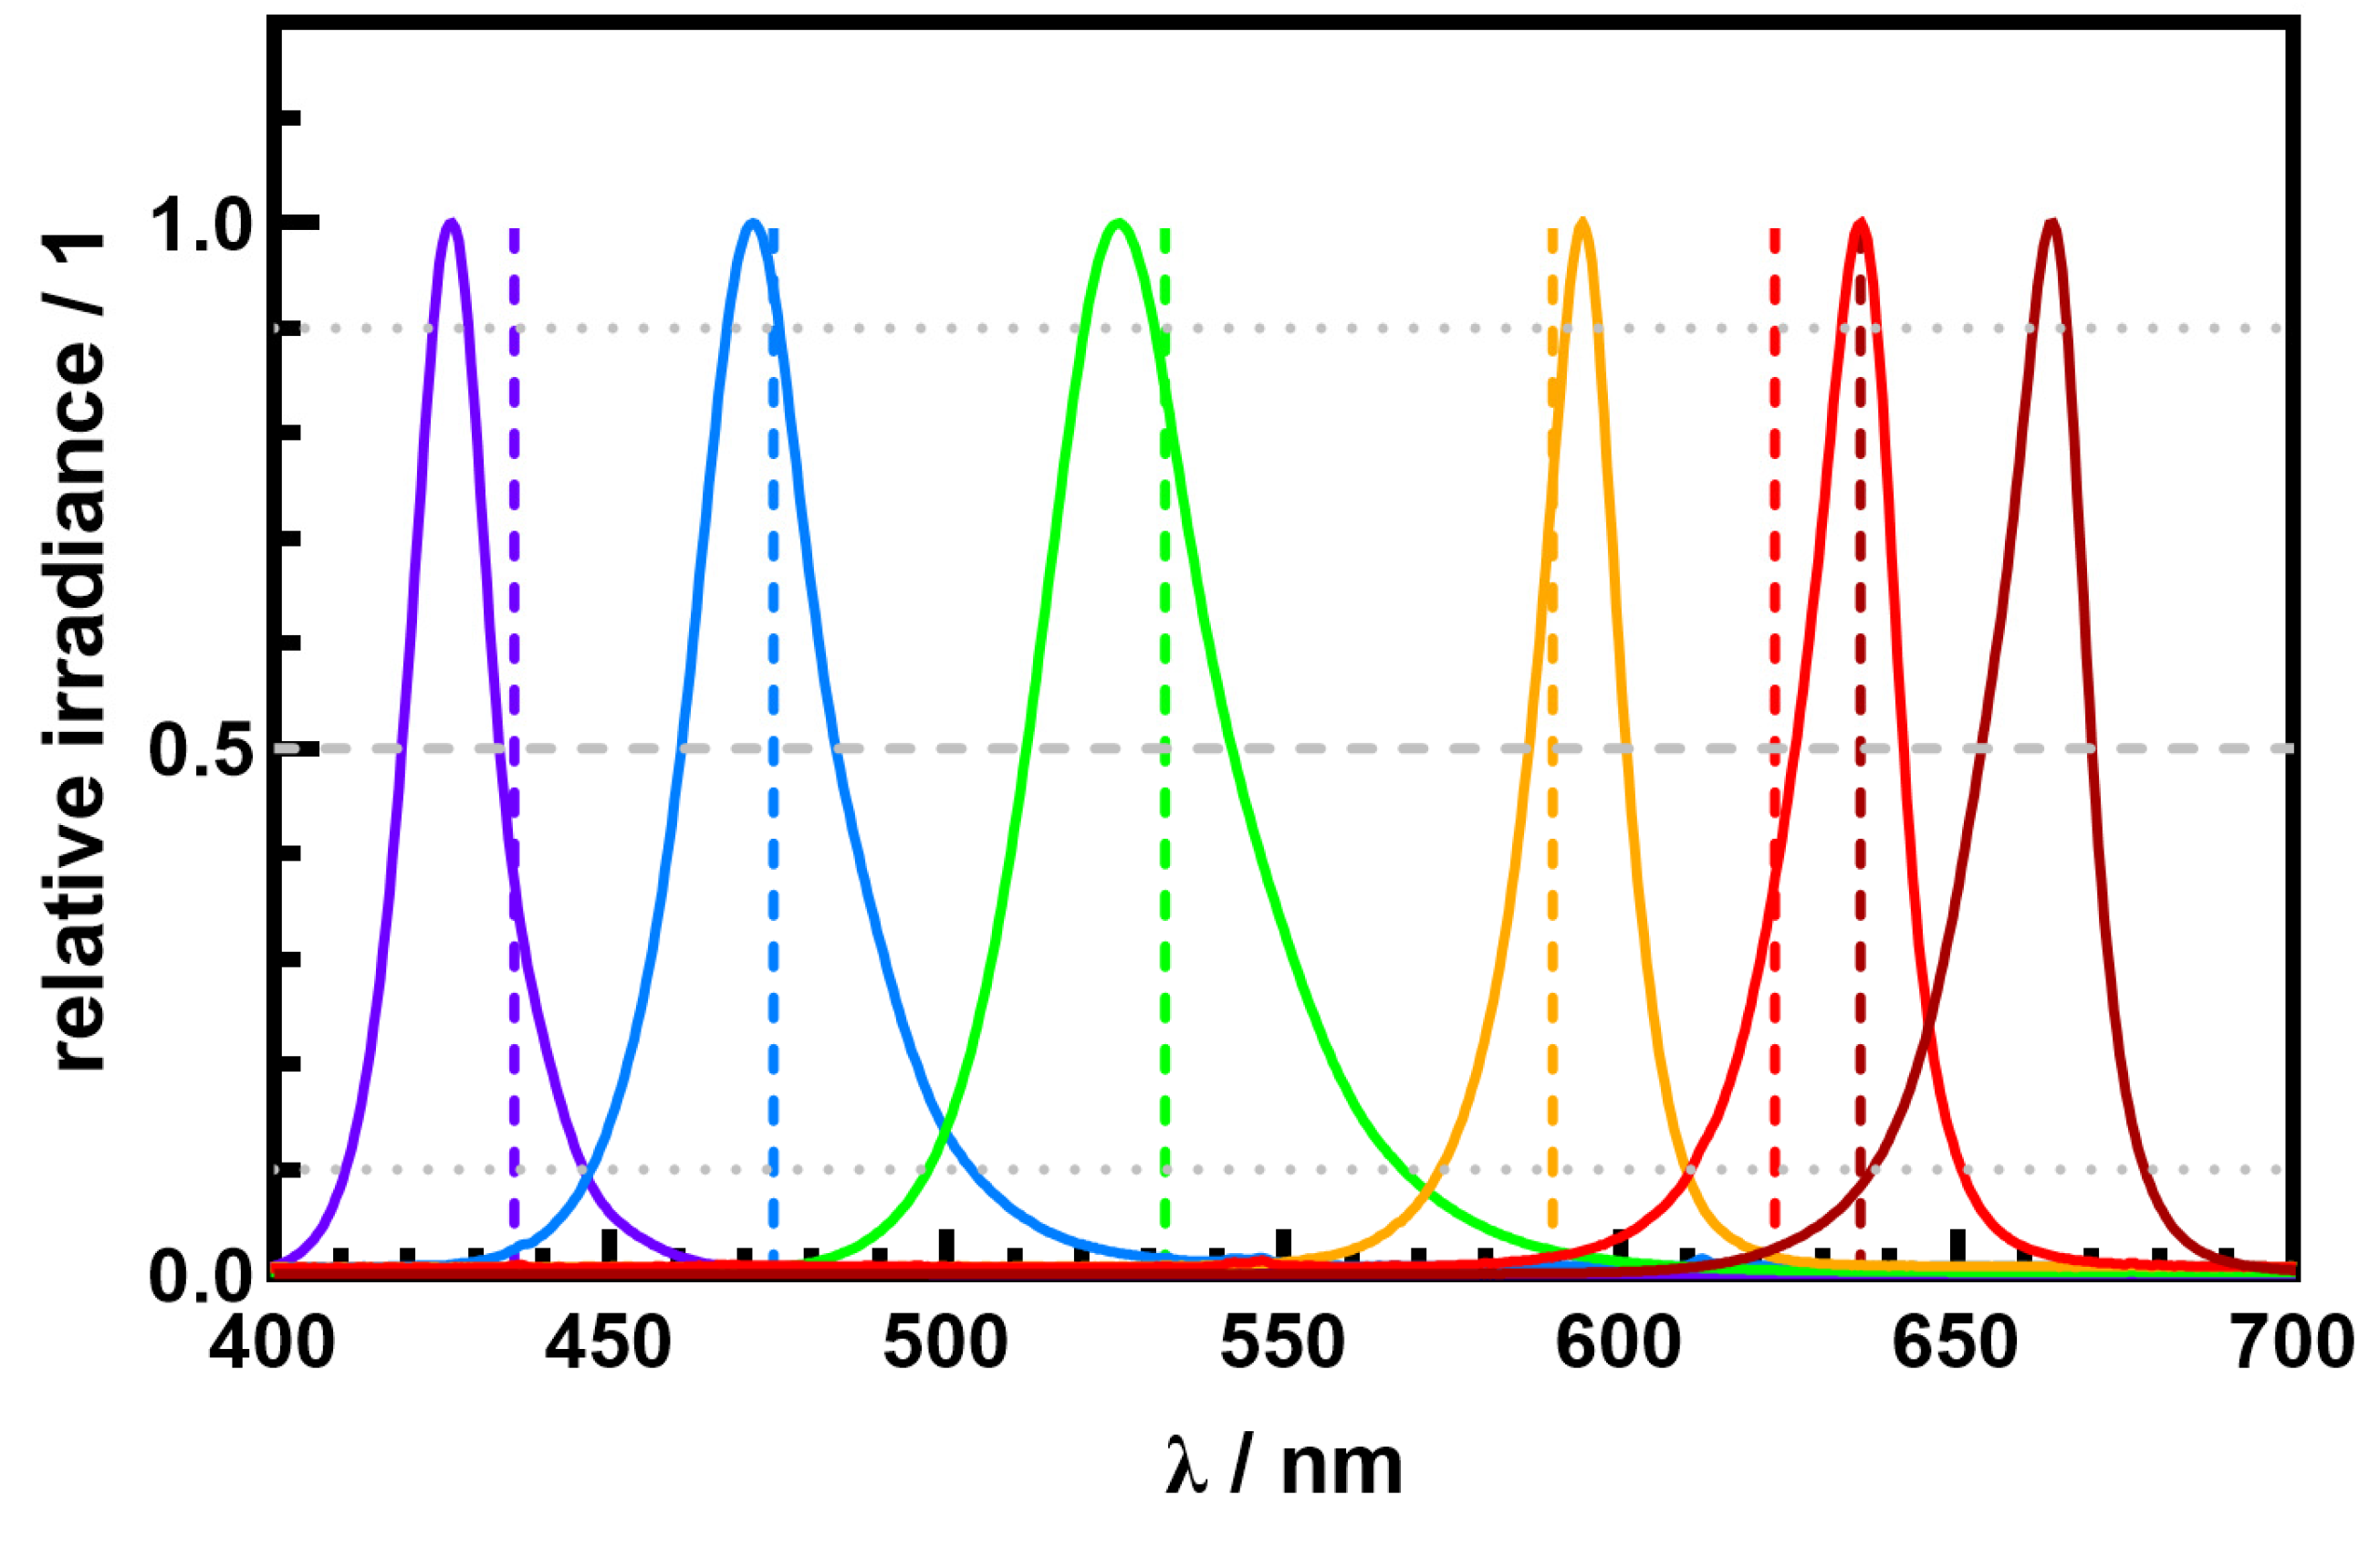
2.2.1. Chromatic Light Sources

There are two different characteristics of the wavelength of chromatic light sources: the dominant wavelength and the peak wavelength. Although the terms are quite similar, the meaning is not the same. The peak wavelength refers to the wavelength at which the maximum in the spectral power distribution occurs. The dominant wavelength, on the other hand, describes a color mixture within the CIE color space by a wavelength of monochromatic light. Because color is highly correlated to the human eye, most colors cannot be characterized by a single wavelength of the electromagnetic spectrum. This can be illustrated by the CIE color space (see Figure 1a) [27]. The boundary of the CIE color space represents monochromatic light with well-defined wavelengths, except for the line connecting the lower and upper limits of the visible spectrum from 380 nm to 780 nm, which is also called the line of purples. All spectral colors at the boundary, as well as all mixtures of colors within the CIE color space, can be described by two chromaticity coordinates, x and y [28]. Whether a light source is characterized by a single wavelength or by chromaticity coordinates depends on the spectral power distribution. For asymmetrical or broad distributions, chromaticity coordinates are appropriate, whereas for symmetrical and narrow distributions, peak wavelengths are appropriate. There are no strict physical limits for either characterization, so it is often a manufacturer’s choice. Since chromaticity coordinates are not as intuitive to most users as wavelengths, each chromaticity coordinate can be associated with a specific wavelength, the dominant wavelength. To do this, the corresponding chromaticity coordinates are projected from the white point E with the chromaticity coordinates x = 1 / 3 and y = 1 / 3 to the boundary of the color space [29]. This is illustrated in Figure 1a for a green LED. In addition, calculated chromaticity coordinates x , y (see Equation (4)) and projected dominant wavelengths λ d o m are shown. Chromaticity coordinates x and y can be calculated from the tristimulus values X , Y and Z :
x = X X + Y + Z ,     y = Y X + Y + Z
Tristimulus values X , Y and Z   can be calculated according to Equation (5) from the spectral power distribution Φ R   ( λ ) of the light source and the CIE color matching functions x ¯ ( λ ) , y ¯ ( λ ) and z ¯ ( λ ) [30]:
X = 380   n m 780   n m Φ R λ · x ¯ λ   d λ ,  
Y = 380   n m 780   n m Φ R λ · y ¯ λ   d λ ,  
Z = 380   n m 780   n m Φ R ( λ ) · z ¯ λ   d λ .
The color matching functions are defined by the CIE and can be found in [31].

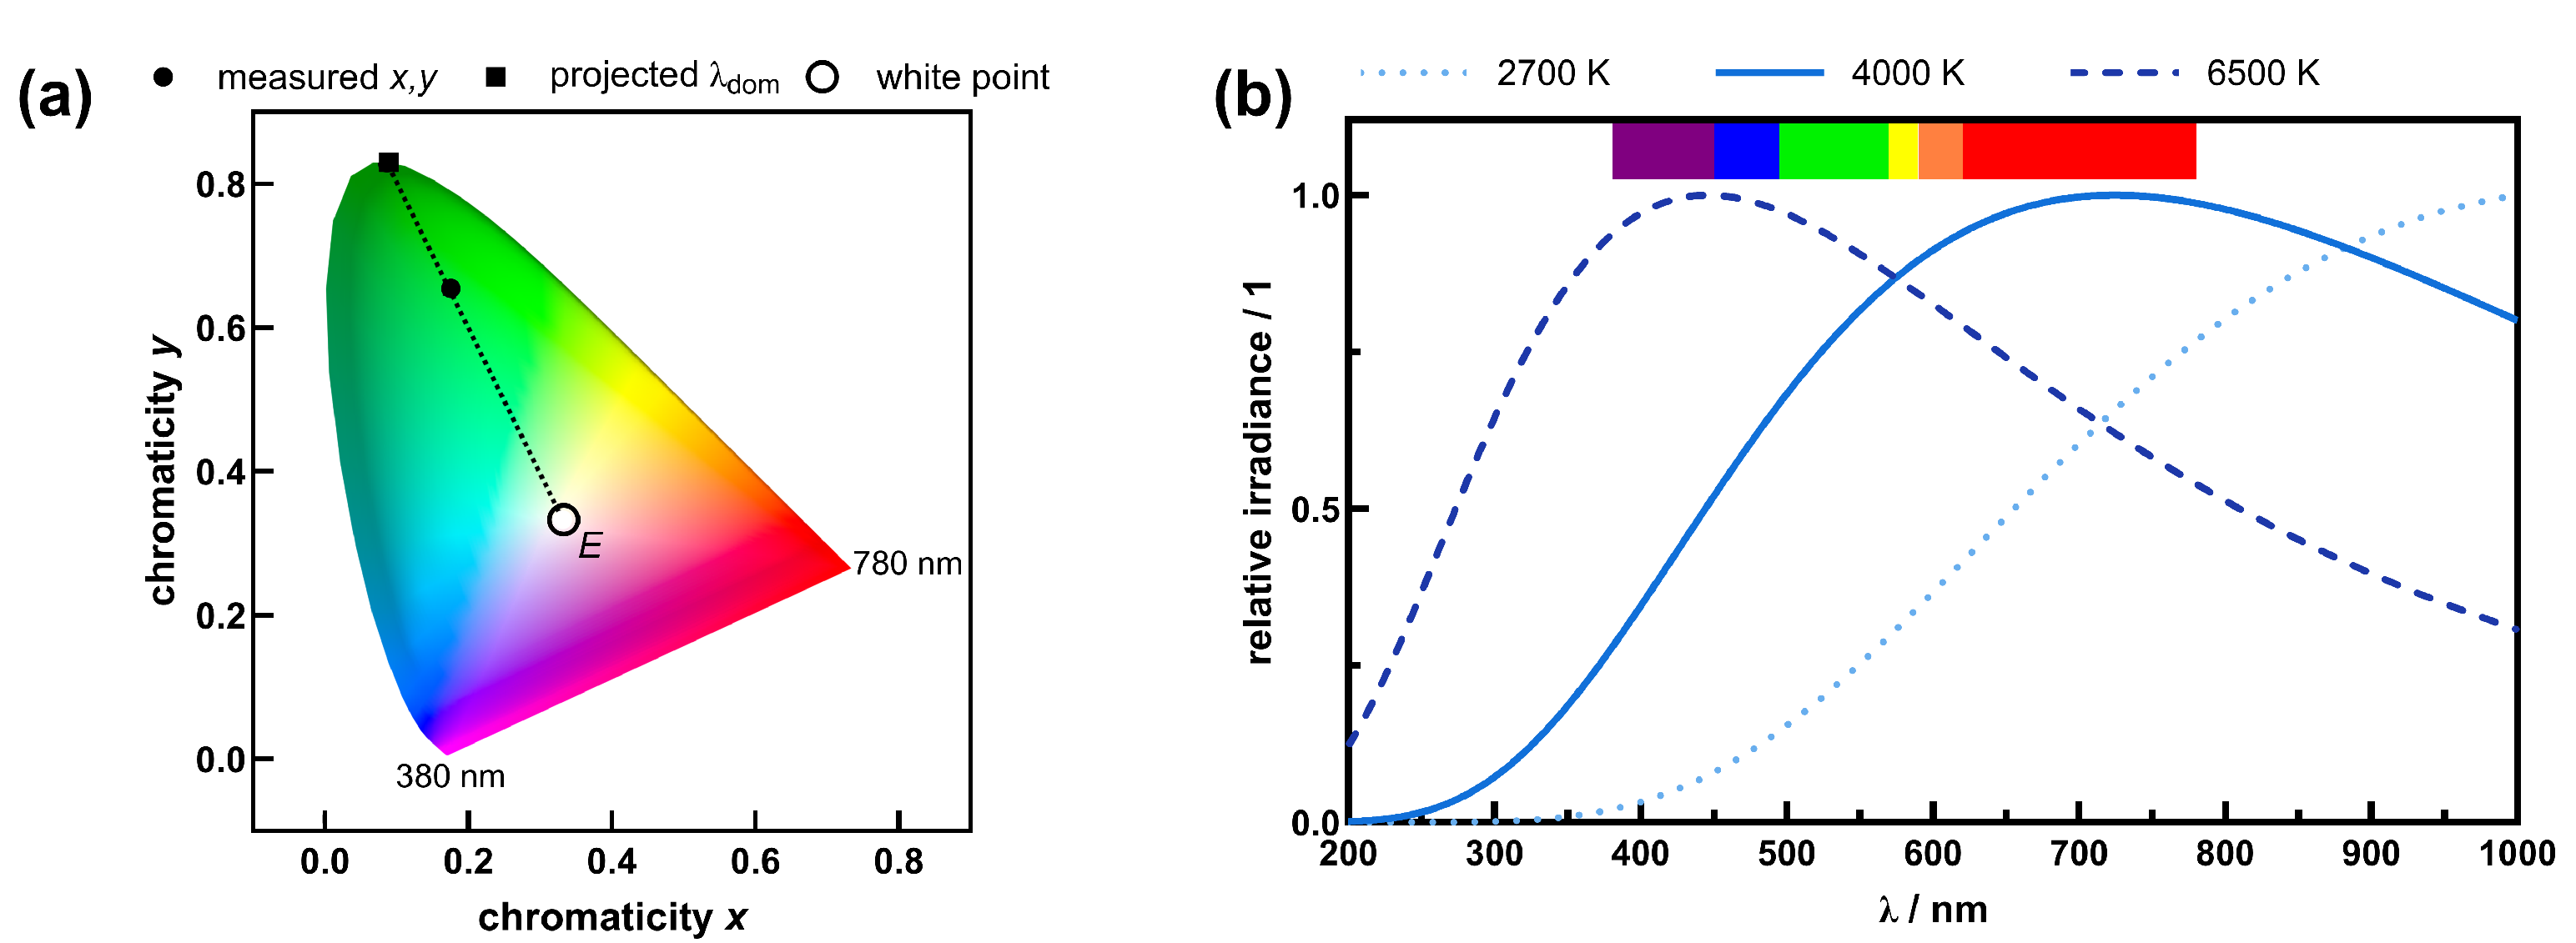
2.2.2. White Light Sources

Since white light is always a mixture of at least three monochromatic wavelengths, characterization by a single wavelength is not feasible. Chromaticity coordinates, as mentioned for chromatic light sources in Section 2.2.1, are one possible method of describing white light sources, although they are based on the sensitivity of the human eye. However, it is more common to specify white light in terms of color temperature, or more precisely, correlated color temperature (CCT) for artificial light sources. Color temperature refers to blackbody radiators, and their emission spectra can be modeled by Planck’s law as shown in Equation (6).
E λ = 8 π · c · h λ 5 · 1 e h · c λ · k B · T   1 ,
where E λ is the spectral energy density of light emitted from a blackbody at a temperature T into a vacuum at a certain wavelength λ [32]. For blackbody radiation, the spectral power distribution depends on the temperature of the blackbody, and the maximum of the distribution shifts to shorter wavelengths at higher temperatures. This is known as Wien’s displacement law. Simulated spectral power distribution of a blackbody radiator with temperatures of 2700 K, 4000 K, and 6500 K for a wavelength range from 200 nm to 1000 nm according to Equation (6) are shown in Figure 1b. Sunlight is a very good approximation of a blackbody radiator with a color temperature of T = 5777   K . Since sunlight is the natural white light on Earth and nature has adapted to it during evolution, it is used as a benchmark for many light-driven processes in life sciences, optics, or perception studies. Therefore, color temperature is an appropriate quantity to describe white light sources. Artificial white light sources deviate from an ideal blackbody, and the CCT is used for specifications [33]. It represents the closest approximation of the perception of an artificial light source to a perfect blackbody radiator of exactly that temperature.

3. Materials and Methods

Eight different chromatic LED light sources from different product families and eight different white light sources were investigated regarding spectral properties and resulting photon flux density. For the chromatic light sources, violet LEDs (L1CU-VLT1000000000, Luxeon CZ color line, Lumileds, Schiphol, The Netherlands), blue LEDs (L135-B475003500000, Luxeon 3535L color line, Lumileds, Schiphol, The Netherlands), green LEDs (L135-G525003500000, Luxeon 3535L color line, Lumileds, Schiphol, The Netherlands), amber LEDs (LY CPDP, Oslon SSL, ams OSRAM, Premstaetten, Austria), red LEDs (L135-R625003500000, Luxeon 3535L color line, Lumileds, Schiphol, The Netherlands), and hyper red LEDs (LH CPDP, Oslon SSL, ams OSRAM, Premstaetten, Austria) were measured. For white light sources, warm white LEDs (9290012340, Philips Lighting, Signify, Eindhoven, The Netherlands) and fluorescence tubes (L18W/827, Osram, Munich, Germany) with a CCT of 2700 K, warm white LEDs (9290019014, Philips Lighting, Signify, Eindhoven, the Netherlands) and fluorescence tubes ((L18W/830, Osram, Munich, Germany) with a CCT of 3000 K, neutral white LEDs (9290020293, Philips Lighting, Signify, Eindhoven, the Netherlands) and fluorescence tubes ((L18W/840, Osram, Munich, Germany) with a CCT of 4000 K, and cold white LEDs (LEDAnce AC44222, ams OSRAM, Premstaetten, Austria) and fluorescence tubes ((L18W/865, Osram, Munich, Germany) with a CCT of 6500 K (cold white) were investigated. Correlated color temperature, dominant wavelength, and chromaticity coordinates were measured using a BTS256-EF general lighting spectral luminance meter (Gigahertz-Optik, Munich, Germany) with a measurement uncertainty of ± 4 % for irradiance, ± 1 n m for wavelength, and ± 0.005 for chromaticity coordinates. Spectral power distributions were recorded using a MAYA 2000 Pro spectrometer (Ocean Insights, Orlando, FL, USA) equipped with a #HC-1 diffraction grating and a 5 µm entrance slit providing a spectral resolution of 0.66 nm FWHM, a QP600-1-SR-BX fiber optic (Ocean Insights, Orlando, FL, USA), and a CC-3-UV-S cosine corrector (Ocean Insights, Orlando, FL, USA). The spectrometer was calibrated with a radiometrically calibrated light source, DH-3P-CAL (Ocean Insights, Orlando, FL, USA). Calculations of photon flux density and blackbody radiation were performed with MATLAB 2024b [34] as described in Section 2. The spectral power distribution on a blackbody radiator was simulated for three different temperatures. Photon flux density was calculated from measured spectral data and a nominal irradiance of 100   W m 2 for better comparability. Absorption coefficients for pigments were taken from [35].

4. Results

To better assess the spectral impact of chromatic and white light sources, their spectral composition was measured and common light quantities such as dominant and peak wavelength, CCT, and chromaticity coordinates were determined. Furthermore, the resulting photon flux densities were calculated and compared.

4.1. Chromatic Light Sources

The measured dominant wavelength and the peak wavelength are shown in Figure 2 and summarized in Table 1. LEDs on the edge of the visible region show the largest delta λ = λ p e a k λ d o m between the dominant wavelength and peak wavelength of λ = 10   n m for violet, λ = 12   n m for red, and λ = 27   n m for hyper red. Blue, green, and amber LEDs exhibit a smaller λ between 3   n m and 6   n m . Due to the narrow and symmetric spectral distributions ( F W H M < 30   n m ) of the LED light sources, the deviation between the dominant wavelength and peak wavelength is about 1% to 4%. However, this must not be the case for other chromatic light sources. It should be noted that the dominant and peak wavelengths are not the same when describing light-related processes. Looking at the emission spectra ( λ p e a k ± F W H M ) of the violet and the red LEDs with peak wavelengths of λ p e a k = 426 ± 9   n m and λ p e a k = 635 ± 10   n m , the dominant wavelengths of λ d o m = 436   n m and λ d o m = 623   n m are outside the spectral range, where 50% of the total power is emitted (FWHM). For the hyper red LED with λ p e a k = 663 ± 10   n m , the dominant wavelength λ d o m = 636   n m is outside the spectral range, where 90% of the total power is emitted. Thus, the dominant wavelength is not the correct specification to describe and understand light-related processes and could lead to misinterpretation, as the dominant wavelength could be far outside the wavelength range where the relevant power is emitted.
An estimate of the PFD from the dominant and peak wavelengths according to Equation (3) with an assumed irradiance of 100   W m 2 for all eight measured chromatic LEDs is summarized in Table 1. Since the wavelength contributes linearly to the PFD, the deviations between the PFD from the dominant wavelength P F D ( λ d o m ) and the PFD from the peak wavelength P F D ( λ p e a k ) show the same trend as the λ = λ p e a k λ d o m described earlier. For LEDs emitting at the edge of the visible range (violet, hyper red), the deviations are larger than for LEDs emitting at blue, green, and amber. The differences between P F D ( λ d o m ) and P F D ( λ p e a k ) are between 0.5% and 4%, with deviations of less than 1.5% for blue, green, and amber LEDs, 2% for violet and red LEDs, and 4% for hyper red.

4.2. White Light Sources

Although the correlated color temperature is an appropriate quantity to describe white light, it can be misleading for interpreting the spectral effects on light-related processes, since different spectral compositions can result in the same CCT. Figure 3 shows the spectra of two different artificial light sources with a CCT of 4000 K and a simulated sunlight spectrum (perfect blackbody radiator) with a color temperature of 4000 K. To better understand and simplify the spectral composition, the visible region is divided into three parts. Based on the spectral color classification of the CRC Handbook of Fundamental Spectroscopic Correlation Charts [36], the visible range is divided into the following three regions to simplify the description of the spectral composition of light sources: the blue/violet region (380 nm to 495 nm), the green/yellow region (495 nm to 590 nm), and the orange/red region (590 nm to 780 nm). In a photobiological context, phototrophic organisms such as cyanobacteria and green algae adjust their use of light (quality and intensity) based on the types and quantities of pigments they possess, including chlorophylls, carotenoids, and phycobiliproteins, each absorbing light across distinct spectral regions. While phycobiliproteins and chlorophyll molecules absorb in the (violet/)blue and (orange/)red wavelengths, carotenoids absorb light primarily in the violet(/blue) and green(/yellow) region [37]. LEDs emit white light by generating blue light and partially converting the blue light to green, orange, and red light via a luminescent coating. This can be seen in Figure 3 as a sharper peak at around 450 nm (blue/violet portion) and a broader peak between 500 nm and 700 nm. Although fluorescent lamps also use a fluorescence-based conversion layer to produce white light, the spectral composition results from a series of sharper peaks in the violet/blue, green/yellow, and orange/red regions, as shown in Figure 3. For blackbody radiation, the spectrum is continuous, with no distinct, sharp peaks. Depending on the color temperature, the spectral maximum shifts from red to blue as the color temperature increases (see Figure 1b). Although all three spectra have a similar color perception to the human eye, the spectral composition is very different and the impact on light-related processes will be different. This should be kept in mind when using artificial white light for experimental studies with biological systems remote from visual perception.
To achieve different CCTs, the proportion of orange/red, green/yellow, and blue/violet in artificial light sources is varied using different conversion layers. This is shown in Figure 4 for white LEDs and fluorescent tubes with CCTs of 2700 K (warm white), 4000 K (neutral white), and 6500 K (cool white). As with the ideal blackbody, the violet/blue portion increases with higher CCTs. Regarding the investigated white LEDs, the fraction of the violet/blue peak is below 25% for 2700 K (Figure 4a) and around 75% for 4000 K (Figure 4b) compared to the broader orange/red proportion. For a CCT of 6500 K (Figure 4c), the violet/blue peak is the most prominent peak, and the orange/red proportion is around 70% compared to the violet/blue peak. Furthermore, the green/yellow portion also increases with a higher CCT, which can be seen in the form of a shoulder between 500 nm to 550 nm within the broad peak. A similar behavior can be seen in the spectrum of fluorescent lamps (Figure 4d,e). The proportion of the peak in the violet/blue region increases from less than 25% at 2700 K to just under 50% at 6500 K. As the CCT increases, the peak in the green/yellow region increases from about 25% to 75% as well.
The measured chromaticity coordinates and CCT for the eight white light sources studied are summarized in Table 2. The deviations between the specified nominal CCT and the measured CCT are less than 5% for all measured white light sources except for the fluorescent lamp, with a nominal CCT of 6500 K. At 6080 K, the actual CCT deviates from the nominal CCT by 6.5%. However, the measured 6080 K is still within the manufacturer’s chromaticity coordinate group for cool white light sources with a nominal CCT of 6500 K. A comparison of CCT between white LEDs and fluorescent lamps shows deviations of less than 4%. The chromaticity coordinates of the white light sources examined also show only slight deviations and are, therefore, easily comparable. Based on the measured spectral power distribution, the photon flux density was calculated for an assumed irradiance of 100   W m 2 . The resulting PFDs are shown in Table 2. The PFD decreases as the CCT increases. At a CCT of 2700 K, the PFD is 500   µ m o l s 1 m 2 , and at a CCT of 6500 K, the PFD is 461   µ m o l s 1 m 2 . The decrease in PFD with increasing CCT can be explained by the spectral composition. Since photons with shorter wavelengths have higher energy, fewer photons are required for white light with a higher violet/blue and green/yellow component to transport the same energy per time and area. Although the spectral compositions of white LEDs and fluorescent lamps are different, PFDs with the same CCTs are easily comparable. The deviations between certain PFDs of LEDs and fluorescent lamps are less than 1.5%.

5. Discussion

In this work, common spectral parameters such as dominant wavelength or correlated color temperature were determined for various chromatic and white artificial light sources and compared with the actual spectral composition. In addition, the photobiologically relevant photon flux density was estimated from the common parameters and compared with the PFD determined from the spectral power distribution. In terms of photon flux density, there are no significant differences between the investigated light sources at the same CCT and similar dominant and peak wavelengths. However, the PFD decreases with increasing CCT and shorter wavelengths at constant irradiance (Table 2). In terms of spectral composition, the dominant wavelength was found to be inappropriate for characterizing the spectral properties of chromatic light sources. This is because it is related to the spectral sensitivity of the human eye, and the values given are partly at the edge of the actual emission spectrum. For white light sources, it should be noted that different types of sources with the same CCT may have different spectral compositions, resulting in different photobiological effects. In addition, with white light sources, the violet/blue and green/yellow spectral components increase with increasing CCT relative to the orange/red component (Figure 4), which may also affect the photobiological effect.
As cross-disciplinary perspectives converge in photobiology, speaking the same language by sharing consistent metrics and ensuring comparability, reproducibility, and accuracy is indispensable. Despite the evident advancements in LED technology applications in various research sectors, the frequent question of whether to use peak or dominant wavelength still remains a subject of ongoing debate. In this work, we aimed to bridge this persistent gap by providing a detailed perspective when considering different lighting system applications in photobiology. We can decisively support the adoption of the peak wavelength, as the dominant wavelength can be regarded as somewhat artificial in the context of photobiology given its dependence on human visual perception. Since the use of the dominant wavelength as a metric can lead to erroneous conclusions regarding spectral compositions, it is rendered an inappropriate choice. We further compared different lighting sources with respect to CCT. Our results clearly demonstrated that light sources having identical nominal CCT might not have the same spectral composition. In this context, LEDs exhibit a broad spectrum when compared with fluorescent tubes, which reveal sharper peaks (Figure 3 and Figure 4). More importantly, increasing CCT is strongly correlated with violet/blue light-related consequences, while the orange/red proportions decrease (Figure 4). These findings can lead to profound effects spanning across various research disciplines. In this context, Luimstra et al. [38] reported that specific growth rates of cyanobacteria were similar in orange and red light, but much lower in blue light. Regarding green algae, oxygen production rates were found to be five-fold lower in blue than in orange or red light. Pagels et al. [39] found evidence that red light leads to an increase in both photosynthetic activity as well as cyanobacterial pigment content, including carotenoids and phycobiliproteins, which are economically valuable due to their broad range of biological and industrial applications. Contrarily, as blue light cannot be absorbed by phycobilisomes, it reduces the photosynthetic efficiency of cyanobacteria through an imbalance between photosystems I and II [38]. The effect of the spectral quality of the light source (color) can also be emphasized by comparing the absorption spectra of pigments. Chlorophyll a shows approximately 14 times higher absorption coefficients when exposed to LEDs emitting at 441 nm compared to LEDs emitting at 471 nm, even though both are characterized as blue LEDs. For chlorophyll b, red LED light at 635 nm results in approximately seven-fold higher absorption coefficients than red LED light at 661 nm. Beta-carotene shows approximately four times higher absorbance coefficients when exposed to green LED light at 520 nm compared to green LED light at 550 nm. Therefore, using solely color to describe the spectral characteristics of a light source is not sufficient and can lead to misinterpretation. Furthermore, if the dominant wavelength is used instead of the peak wavelength, the expected absorption coefficient for chlorophyll a would be an order of magnitude lower for red LEDs emitting at 661 nm. Few studies further revealed an impact of light color on biomass composition or the areal biomass productivity of cyanobacteria [40]. Notably, chromatic acclimation involves a variety of molecular mechanisms wherein cyanobacterial cells sense ambient light colors and utilize this information to enhance photosynthetic light absorption. These processes collectively respond to a significant portion of the photosynthetically relevant solar spectrum, indicating that CA confers fitness advantages across a wide array of light color conditions. Most photobiological studies thus far have emphasized the impacts of light colors on plants in greenhouses and other horticultural conditions. Red and blue light constitute the primary components of light utilized by plants. Each type of light plays a distinct role in supporting plant growth and development. Conventionally, red and blue light are thought to exhibit a greater quantum yield of CO2 assimilation (QY, measured in moles of CO2 assimilated per mole of photons) compared to green light; this understanding arose from the observation that green light is absorbed less efficiently. The interaction between the light spectrum and photosynthetic photon flux density (PPFD) exerted a discernible impact on leaf photosynthesis. Green light exhibited the lowest QYinc (quantum yield of CO2 assimilation on an incident light basis), whereas red light demonstrated the highest QYinc at low PPFD levels. Conversely, at high PPFD levels, both green and red light yielded similar QYinc values, surpassing those produced by blue light [41]. Previous studies often regarded green light as less photosynthetically efficient; however, recent investigations indicate that even supposedly inefficient light wavelengths can play significant roles, particularly in conjunction with red and blue light; thus, these inquiries are pivotal for optimizing artificial lighting systems in greenhouse environments to maximize plant productivity, quality, and resource efficiency [37].
Photobiology encompasses various domains including photosynthesis, photomedicine, and optical bioimaging, utilizing diverse light sources and involving optical phenomena such as polarization, resonances, multiphoton absorption, and nonlinear optical effects. Previous studies addressing those effects include those of polarized photobiomodulation on cellular viability, proliferation, and apoptosis [42], the direction of polarization on development and behavioral signaling [43], and nonlinear refraction and multiphoton absorption in polydiacetylenes; they have garnered considerable attention for applications in chemo- and bio-sensing [44]. However, these phenomena primarily pertain to laser sources. In contrast, LEDs and fluorescent lamps emit unpolarized light with lower optical power and broader emission spectra than lasers. Thus, this work does not delve into optical phenomena specifically associated with laser properties. When comparing the different lighting sources used in photobiology, conventional sources, such as fluorescent lights, boast relatively high fluence and efficiency in delivering photosynthetically active radiation [2]. Furthermore, their high luminous flux and fixture positioning enable them to cover larger areas than LEDs [37]. However, their spectrum and intensity tend to fluctuate over time, posing challenges for consistent plant growth. Moreover, the high operational temperatures of conventional lights restrict their placement close to the plant canopy [37], and their spectral distribution may shift depending on input power variations. On the other hand, LEDs operate at lower temperatures and are more compact in size, making them suitable for adjacent placement to plants without risk of heat damage. They achieve high lighting efficiency while generating minimal heat, contributing to longer lifespan processes. Emitting cold light, LEDs aid in maintaining optimal climate conditions for greenhouse cultivation, and their customizable wavelength selection allows for precise modulation of plant processes. By leveraging these benefits, LED lighting systems can significantly reduce artificial lighting costs by up to 25% and energy consumption by up to 70% (34). Moreover, LEDs operate in a steady state with high relative quantum efficiency, ensuring consistent and effective lighting for plant growth [45]. However, it is imperative to delve deeper into the physiological processes that govern photobiological responses. To do this, a more standardized way to describe light quantity and quality is crucial.

6. Conclusions

LED technology has reshaped greenhouse illumination by offering a customizable lighting solution. Several horticultural experiments have confirmed the successful growth of plants under LED illumination, with a high degree of physiological and morphological plasticity in their responses to changes in spectral quality [37]. Furthermore, the spectral composition of light interacts intricately with other environmental and cultivation conditions. Beyond merely supplying energy for photosynthesis, light serves as a key regulator of signals that govern growth, development, morphology, and metabolic processes [46]. This phenomenon, known as photomorphogenesis, is profoundly influenced by the different colors of light and, hence, the spectral composition. For the future, LEDs are considered the pioneering light source, with their ability to finely control spectral composition, thus enabling precise alignment of wavelengths depending on the specific requirements of different crops, plant development stages [46], and the targeted stimulation of the biosynthesis of valuable biologically active compounds [47]. Choosing the optimal lighting conditions is, however, not trivial, given the diverse spectral possibilities of LEDs and a partially inconsistent description. Furthermore, the interplay between a biological system and light is remarkably complex, with environmental factors exhibiting greater variability in a greenhouse setting compared with indoor environments. This poses challenges for researchers and users in maintaining consistent spectral performance, and without regular verification of light properties throughout different plant growth stages, collected data may not be dependable [3]. Therefore, not only further comprehensive investigations, but also technological advancements, are imperative to grasp the impact of varying spectra on plant physiology and devise an energy-efficient light source with a spectrum tailored to promote optimal plant growth in distinct plant species [37].
Establishing consensus on light-related physical parameters and their reliance on spectral distribution offers a valuable potential for application in greenhouse horticulture, opportunities to optimize production schedules and enhance both crop yield and quality, and ultimately paves the way for LED applications in cutting-edge research like refining the metabolic bioengineering of particular strains proficient in generating renewable bioenergy, biofuels, and commercially significant biomolecules such as pigments. As also emphasized by Rojer et al. [48], the constraints of the current standard chromaticity specification system underscore the necessity to advocate for the establishment of an enhanced standard system for chromaticity specification that holds promise in enhancing existing CIE standards and clarifying chromaticity discrepancies in nominally white light sources. Their recommendations include (i) new color matching functions (CMFs), (ii) the use of 2015 10° CMFs, and (iii) a new (s, t) uniform chromaticity scale (UCS) diagram facilitating calculations for st-based correlated color temperature (CCTst) applicable across the entire chromaticity spectrum, thereby supporting the engineering and specification processes of specialized lighting designs for widespread implementation [48]. Moreover, the utilization of advanced mathematical and physical tools such as fractional differential equations has opened up avenues to enhance precision and control photodamage, paving the way for myriad applications and challenging new frontiers in photobiology [49]. Hence, it is essential to use a uniform characterization of spectral conditions based on comparable parameters that are independent of the spectral sensitivity of the human eye. This work should, therefore, serve life scientists as a proxy for such a description of spectral conditions.

Author Contributions

Conceptualization, H.S.; methodology, H.S.; software, H.S.; validation, M.M. and H.S.; formal analysis, M.M. and H.S.; investigation, H.S.; data curation, H.S.; writing—original draft preparation, M.M. and H.S.; writing—review and editing, M.M. and H.S.; visualization, M.M. and H.S.; supervision, H.S. All authors have read and agreed to the published version of the manuscript.

Funding

This research received no external funding.

Institutional Review Board Statement

Not applicable.

Informed Consent Statement

Not applicable.

Data Availability Statement

The data that support the findings of this study are available from the corresponding author upon reasonable request.

Conflicts of Interest

The authors declare no conflicts of interest.

References

  1. Leister, D. Photobiology: Introduction, overview and challenges. Front. Photobiol. 2023, 1, 1253330. [Google Scholar] [CrossRef]
  2. Darko, E.; Heydarizadeh, P.; Schoefs, B.; Sabzalian, M.R. Photosynthesis under artificial light: The shift in primary and secondary metabolism. Philos. Trans. R. Soc. Lond. B Biol. Sci. 2014, 369, 20130243. [Google Scholar] [CrossRef] [PubMed]
  3. Wu, B.-S.; Hitti, Y.; MacPherson, S.; Orsat, V.; Lefsrud, M.G. Comparison and perspective of conventional and LED lighting for photobiology and industry applications. Environ. Exp. Bot. 2020, 171, 103953. [Google Scholar] [CrossRef]
  4. Parrine, D.; Wu, B.-S.; Muhammad, B.; Rivera, K.; Pappin, D.; Zhao, X.; Lefsrud, M. Proteome modifications on tomato under extreme high light induced-stress. Proteome Sci. 2018, 16, 20. [Google Scholar] [CrossRef]
  5. Meng, X.; Wang, Z.; He, S.; Shi, L.; Song, Y.; Lou, X.; He, D. LED-Supplied Red and Blue Light Alters the Growth, Antioxidant Status, and Photochemical Potential of in Vitro-Grown Gerbera jamesonii Plantlets. HST 2019, 37, 473–489. [Google Scholar] [CrossRef]
  6. Miyashita, K.; Tanakamaru, S.; Maitani, T.; Kimura, K. Recovery responses of photosynthesis, transpiration, and stomatal conductance in kidney bean following drought stress. Environ. Exp. Bot. 2005, 53, 205–214. [Google Scholar] [CrossRef]
  7. Gutu, A.; Kehoe, D.M. Emerging perspectives on the mechanisms, regulation, and distribution of light color acclimation in cyanobacteria. Mol. Plant 2012, 5, 1–13. [Google Scholar] [CrossRef] [PubMed]
  8. Osnato, M.; Cota, I.; Nebhnani, P.; Cereijo, U.; Pelaz, S. Photoperiod Control of Plant Growth: Flowering Time Genes Beyond Flowering. Front. Plant Sci. 2021, 12, 805635. [Google Scholar] [CrossRef]
  9. Hörnlein, C.; Confurius-Guns, V.; Stal, L.J.; Bolhuis, H. Daily rhythmicity in coastal microbial mats. npj Biofilms Microbiomes 2018, 4, 11. [Google Scholar] [CrossRef]
  10. Nitschke, S.; Cortleven, A.; Iven, T.; Feussner, I.; Havaux, M.; Riefler, M.; Schmülling, T. Circadian Stress Regimes Affect the Circadian Clock and Cause Jasmonic Acid-Dependent Cell Death in Cytokinin-Deficient Arabidopsis Plants. Plant Cell 2016, 28, 1616–1639. [Google Scholar] [CrossRef]
  11. Nitschke, S.; Cortleven, A.; Schmülling, T. Novel Stress in Plants by Altering the Photoperiod. Trends Plant Sci. 2017, 22, 913–916. [Google Scholar] [CrossRef] [PubMed]
  12. Abuelsoud, W.; Cortleven, A.; Schmülling, T. Photoperiod stress induces an oxidative burst-like response and is associated with increased apoplastic peroxidase and decreased catalase activities. J. Plant Physiol. 2020, 253, 153252. [Google Scholar] [CrossRef] [PubMed]
  13. Cortleven, A.; Roeber, V.M.; Frank, M.; Bertels, J.; Lortzing, V.; Beemster, G.T.S.; Schmülling, T. Photoperiod Stress in Arabidopsis thaliana Induces a Transcriptional Response Resembling That of Pathogen Infection. Front. Plant Sci. 2022, 13, 838284. [Google Scholar] [CrossRef]
  14. Kehoe, D.M. Chromatic adaptation and the evolution of light color sensing in cyanobacteria. Proc. Natl. Acad. Sci. USA 2010, 107, 9029–9030. [Google Scholar] [CrossRef] [PubMed]
  15. Montgomery, B.L. Seeing new light: Recent insights into the occurrence and regulation of chromatic acclimation in cyanobacteria. Curr. Opin. Plant Biol. 2017, 37, 18–23. [Google Scholar] [CrossRef] [PubMed]
  16. Colleselli, L.; Siewert, B.; Vrabl, P.; Schöbel, H. Optical simulations in life-sciences: Benefiting from ray-tracing in biotechnology and photobiology. Opt. Commun. 2024, 552, 130028. [Google Scholar] [CrossRef]
  17. Björn, L.O. Photobiology: The Science of Light and Life, 3rd ed.; Springer: New York, NY, USA, 2015; ISBN 978-1-4939-1467-8. [Google Scholar]
  18. Pearcy, R.W. Radiation and light measurements. In Plant Physiological Ecology: Field Methods and Instrumentation, 1st ed.; Pearcy, R.W., Ehleringer, J.R., Eds.; Chapman and Hall: London, UK, 1989; pp. 97–116. ISBN 978-0-412-40730-7. [Google Scholar]
  19. Arecchi, A. Field Guide to Illumination; SPIE: Bellingham, WA, USA, 2007; ISBN 9780819481221. [Google Scholar]
  20. Smith, T.; Guild, J. The C.I.E. colorimetric standards and their use. Trans. Opt. Soc. 1931, 33, 73–134. [Google Scholar] [CrossRef]
  21. CIE|International Commission on Illumination/Comission Internationale de l’Eclairage/Internationale Beleuchtungskommission. Available online: https://cie.co.at/ (accessed on 25 April 2024).
  22. Meyer-Arendt, J.R. Radiometry and photometry: Units and conversion factors. Appl. Opt. 1968, 7, 2081. [Google Scholar] [CrossRef] [PubMed]
  23. Einstein, A. Über einen die Erzeugung und Verwandlung des Lichtes betreffenden heuristischen Gesichtspunkt. Ann. Phys. 1905, 322, 132–148. [Google Scholar] [CrossRef]
  24. McCree, K.J. The measurement of photosynthetically active radiation. Sol. Energy 1973, 15, 83–87. [Google Scholar] [CrossRef]
  25. Walter, A.; Schöbel, H. Shed light on photosynthetic organisms: A physical perspective to correct light measurements. Photosynth. Res. 2023, 156, 325–336. [Google Scholar] [CrossRef] [PubMed]
  26. McCree, K.J. The action spectrum, absorptance and quantum yield of photosynthesis in crop plants. Agric. Meteorol. 1971, 9, 191–216. [Google Scholar] [CrossRef]
  27. Wyszecki, G.; Stiles, W.S. Color Science: Concepts and Methods, Quantitative Data and Formulae, 2nd ed.; Wiley Classics Library, Ed.; Wiley: New York, NY, USA; Weinheim, Germany, 2000; ISBN 9780471399186. [Google Scholar]
  28. Schanda, J. Colorimetry: Understanding the CIE System; CIE/Commission Internationale de l’Eclairage: Vienna, Austria, 2007; ISBN 9780470175620. [Google Scholar]
  29. Yao, Q.; Ju, J.; Liang, R.; Chen, D.; Zhao, H. Relationship between Peak Wavelength and Dominant Wavelength of Light Sources Based on Vector-Based Dominant Wavelength Calculation Method. LEUKOS 2014, 10, 11–18. [Google Scholar] [CrossRef]
  30. Billmeyer, F.W.; Fairman, H.S. CIE Method for Calculating Tristimulus Values. Color Res. Appl. 1987, 12, 27–36. [Google Scholar] [CrossRef]
  31. CIE. CIE 1931 Colour-Matching Functions, 2 Degree Observer; International Commission on Illumination (CIE): Vienna, Austria, 2019. [Google Scholar]
  32. Planck, M. Ueber das Gesetz der Energieverteilung im Normalspectrum. Ann. Der Phys. 1901, 309, 553–563. [Google Scholar] [CrossRef]
  33. Schanda, J.; Danyi, M. Correlated Color-Temperature Calculations in the CIE 1976 Chromaticity Diagram. Color Res. Appl. 1977, 2, 161–163. [Google Scholar] [CrossRef]
  34. The Mathworks, I. MATLAB R2024b; MathWorks: Natick, MA, USA, 2024. [Google Scholar]
  35. PhotochemCAD Chemicals. Available online: https://www.photochemcad.com/ (accessed on 15 May 2024).
  36. Bruno, T.J. CRC Handbook of Fundamental Spectroscopic Correlation Charts; CRC Press: Boca Raton, FL, USA, 2005; ISBN 9780429129780. [Google Scholar]
  37. Singh, D.; Basu, C.; Meinhardt-Wollweber, M.; Roth, B. LEDs for energy efficient greenhouse lighting. Renew. Sustain. Energy Rev. 2015, 49, 139–147. [Google Scholar] [CrossRef]
  38. Luimstra, V.M.; Schuurmans, J.M.; Verschoor, A.M.; Hellingwerf, K.J.; Huisman, J.; Matthijs, H.C.P. Blue light reduces photosynthetic efficiency of cyanobacteria through an imbalance between photosystems I and II. Photosynth. Res. 2018, 138, 177–189. [Google Scholar] [CrossRef]
  39. Pagels, F.; Lopes, G.; Vasconcelos, V.; Guedes, A.C. White and red LEDs as two-phase batch for cyanobacterial pigments production. Bioresour. Technol. 2020, 307, 123105. [Google Scholar] [CrossRef]
  40. Fuente, D.; Keller, J.; Conejero, J.A.; Rögner, M.; Rexroth, S.; Urchueguía, J.F. Light distribution and spectral composition within cultures of micro-algae: Quantitative modelling of the light field in photobioreactors. Algal Res. 2017, 23, 166–177. [Google Scholar] [CrossRef]
  41. Liu, J.; Van Iersel, M.W. Photosynthetic Physiology of Blue, Green, and Red Light: Light Intensity Effects and Underlying Mechanisms. Front. Plant Sci. 2021, 12, 619987. [Google Scholar] [CrossRef] [PubMed]
  42. Tripodi, N.; Sidiroglou, F.; Fraser, S.; Husaric, M.; Kiatos, D.; Apostolopoulos, V.; Feehan, J. The effects of polarized photobiomodulation on cellular viability, proliferation, mitochondrial membrane potential and apoptosis in human fibroblasts: Potential applications to wound healing. J. Photochem. Photobiol. B 2022, 236, 112574. [Google Scholar] [CrossRef]
  43. Volkov, V. Discovering electrophysiology in photobiology: A brief overview of several photobiological processes with an emphasis on electrophysiology. Commun. Integr. Biol. 2014, 7, e28423. [Google Scholar] [CrossRef]
  44. Polyakov, S.; Yoshino, F.; Liu, M.; Stegeman, G. Nonlinear refraction and multiphoton absorption in polydiacetylenes from 1200 to 2200 nm. Phys. Rev. B 2004, 69, 115421. [Google Scholar] [CrossRef]
  45. Stamford, J.D.; Stevens, J.; Mullineaux, P.M.; Lawson, T. LED Lighting: A Grower’s Guide to Light Spectra. HortScience 2023, 58, 180–196. [Google Scholar] [CrossRef]
  46. Paradiso, R.; Proietti, S. Light-Quality Manipulation to Control Plant Growth and Photomorphogenesis in Greenhouse Horticulture: The State of the Art and the Opportunities of Modern LED Systems. J. Plant Growth Regul. 2022, 41, 742–780. [Google Scholar] [CrossRef]
  47. Livadariu, O.; Maximilian, C.; Rahmanifar, B.; Cornea, C.P. LED Technology Applied to Plant Development for Promoting the Accumulation of Bioactive Compounds: A Review. Plants 2023, 12, 1075. [Google Scholar] [CrossRef] [PubMed]
  48. Royer, M.; Murdoch, M.J.; Smet, K.; Whitehead, L.; David, A.; Houser, K.; Esposito, T.; Livingston, J.; Ohno, Y. Improved Method for Evaluating and Specifying the Chromaticity of Light Sources. LEUKOS 2023, 19, 35–52. [Google Scholar] [CrossRef]
  49. Martines-Arano, H.; Valdivia-Flores, A.; Castillo-Cruz, J.; García-Pérez, B.E.; Torres-Torres, C. Spatially modulated ablation driven by chaotic attractors in human lung epithelial cancer cells. Biomed. Phys. Eng. Express 2024, 10, 35041. [Google Scholar] [CrossRef]
Figure 1. The basic idea of the dominant wavelength for chromatic light sources and color temperature for a white light source. (a) To determine the dominant wavelength, the perceived color of the light source, which can be described by the two chromaticity coordinates x and y in the CIE color space, will be projected to the boundary of the color space through the white point E . The boundary of the CIE color space represents actual spectral wavelengths from 380 nm to 780 nm. (b) Blackbody radiation simulated according to Equation (6) for three different blackbody temperatures. With increasing temperature, the maximum of the spectral power distribution is shifting within the visible region from red to blue (Wien’s displacement law).
Photonics 11 00487 g001
Figure 2. Comparison of dominant wavelength (dashed line) and spectral power distribution (solid line) for six different chromatic LEDs ranging from violet to red.
Photonics 11 00487 g002
Figure 3. Comparison of two different artificial light sources with a nominal correlated color temperature of 4000 K to a blackbody radiator with a color temperature of 4000 K. All three light sources have the same nominal CCT but a different spectral power distribution. The white color is produced by different spectral components. Depending on the proportion of blue, green, and red, the CCT can be adjusted.
Photonics 11 00487 g003
Figure 4. Comparison of spectral power distribution (SPD) for white LEDs (ac) and fluorescent tubes (df) with three nominal correlated color temperatures of 2700 K (a,d), 4000 K (b,e), and 6500 K (c,f). With increasing CCT, the proportion of violet/blue is increasing while the proportion of orange/red is decreasing. Furthermore, the green/yellow proportion is increasing with increasing CCT.
Photonics 11 00487 g004
Table 1. Measured dominant and peak wavelengths and calculated PFDs according to Equation (3) for an assumed irradiance of 100   W m 2 .
ColorLED Product Family λ peak / nm λ dom / nm P F D ( λ p e a k ) / µ mol s m 2 P F D ( λ d o m ) / µ mol s m 2
violetLuxeon CZ426436356364
blueOslon SSL441447369374
blueLuxeon 3535L471474384397
greenLuxeon 3535L521526435440
greenOslon SSL520525435439
amberOslon SSL594590496494
redLuxeon 3535L635623531521
hyper redOslon SSL663636554531
Table 2. Calculated PFDs for white LEDs and fluorescent tubes with different CCT values and chromaticity coordinates from measured spectral power distribution. For the PFD calculations, an irradiance of 100   W m 2 was assumed.
CCT
Nominal
ModelChromaticity CoordinatesCCT
Measured
P F D / µ mol s m 2
xy
2700 KLED0.4710.4192620 K500
2700 Kfluorescent tube0.4650.4222710 K505
3000 KLED0.4410.4052940 K494
3000 Kfluorescent tube0.4400.4022930 K495
4000 KLED0.3900.3873830 K481
4000 Kfluorescent tube0.3860.3853970 K481
6500 KLED0.3170.3376250 K461
6500 Kfluorescent tube0.3200.3456080 K466
Disclaimer/Publisher’s Note: The statements, opinions and data contained in all publications are solely those of the individual author(s) and contributor(s) and not of MDPI and/or the editor(s). MDPI and/or the editor(s) disclaim responsibility for any injury to people or property resulting from any ideas, methods, instructions or products referred to in the content.

