Article

Advanced Various Fault Detection Scheme for Long-Reach Mode Division Multiplexing Transmission

College of Electrical and Electronic Engineering, Wenzhou University, Wenzhou 325035, China
*
Author to whom correspondence should be addressed.
Photonics 2024, 11(6), 523; https://doi.org/10.3390/photonics11060523
Submission received: 29 April 2024 / Revised: 24 May 2024 / Accepted: 28 May 2024 / Published: 30 May 2024
(This article belongs to the Section Lasers, Light Sources and Sensors)

Abstract

:
This paper presents a few-mode fiber (FMF) various fault-detection method for long-reach mode division multiplexing (MDM) based on multi-mode transmission reflection analysis (MM-TRA). By injecting unmodulated continuous light into the FMF, and measuring and quantitatively analyzing the transmitted and reflected or Rayleigh backscattering power of different spatial modes, it is possible to accurately detect and locate reflective and non-reflective fault events. This paper discusses the localization accuracy of fault types such as FMF break, FMF link connector mismatch, and FMF bending. Theoretical analysis and simulation experimental results demonstrate that the proposed MM-TRA can provide an effective characterization of various faults and can achieve high fault localization accuracy. In addition, the influence of mode crosstalk of mode multiplexer/demultiplexer and mode coupling in FMF on the localization accuracy of various faults are considered. The results indicate that when using the combination of LP01 and LP21 modes, the localization errors for the FMF break, connector mismatch, and bending are 3.42 m, 1.97 m, and 3.29 m, respectively, demonstrating good fault localization performance.

1. Introduction

As people’s demand for the transmission capacity of communication systems increases, a variety of new technologies is emerging continuously. A new generation of mode division multiplexing (MDM) communication based on few-mode fiber (FMF) has become an effective method to solve the capacity problem. This technology utilizes the finite orthogonal modes within the FMF as independent channels for information transmission. This method can multiply the system transmission capacity and become the most competitive expansion scheme. In recent years, the rapid development of MDM technology has propelled fiber optical communication into a new era of ultra-high capacity, ultra-long distance [1,2,3,4,5,6]. Therefore, there is an urgent need for an effective and fast fault detection technology to minimize the interruption time and ensure the reliability and stability of FMF links.
Currently, the fault detection of FMF mainly continues the concept of single-mode fiber (SMF). It mainly includes optical time and frequency domain reflectometers (OTDR and OFDR). Among them, OTDR is one of the most commonly used technologies. It detects and locates the fault point by measuring the Rayleigh backscattered and Fresnel reflection signal of fundamental mode LP01, which has a high measurement dynamic range. The main technical means include chaotic OTDR technology [7], Multi-frequency Coherent OTDR [8], single-photon OTDR technology [9], pulse code modulation technology [10], linear optical sampling technology [11], coherent OTDR [12] and OTDR signal processing [13,14], synchronous multi-channel OTDR [15], etc. The second type of OFDR is realized by using continuous optical carrier frequency modulation and heterodyne interference technology, which has great advantages in ultra-high spatial resolution. Mudabbir Badar proposed a hardware configuration to correct nonlinear effects in OFDR, which can achieve an ultra-high spatial resolution of 41 μm [16]. Fan Xinyu proposed a phase-noise-compensated method by using the hardware-adaptive algorithm, which can realize a real-time OFDR system with a 37.5 km dynamic range and 7 cm spatial resolution [17]. In addition, many researchers have carried out multi-directional research on optical fiber link fault detection, such as machine-learning-based anomaly detection [18], transmission-reflection analysis method [19], etc. All the above methods detect faults by measuring the characteristics of the LP01 mode, which improves the accuracy and efficiency of SMF link fault detection and location to a certain extent. The current methods can be applied to FMF link fault detection, but there are still the following problems: (1) The current methods mainly only detect faults by measuring LP01 mode characteristics. For FMFs that support multiple modes, the fault loss of higher-order modes is different from those of the LP01 mode. Simply measuring the characteristics of the LP01 mode to detect faults is inaccurate and incomplete. Our previous work also confirmed this problem [20,21]. Compared with the LP01 mode, higher-order spatial modes show larger fault loss. Therefore, it is necessary to comprehensively consider the characteristics of different spatial modes to achieve an accurate characterization of FMF link faults. (2) Limited by the topological capability of existing optical fiber fault detection systems, high-order spatial mode measurement, dynamic spatial mode crosstalk, and other factors, the current implementation of FMF fiber fault detection schemes are relatively scarce. Therefore, it is necessary to break through the existing limitations and propose a novel fault detection technology for FMF links.
In this paper, we describe the architecture and theoretical system design of the proposed multi-mode transmission reflection analysis (MM-TRA). The various faults of MDM based on FMF are discussed and analyzed with the proposed method, including FMF break, connector mismatch, and fiber bending. In addition, the influence of mode crosstalk and mode coupling introduced into the model on the localization accuracy of various faults is analyzed.

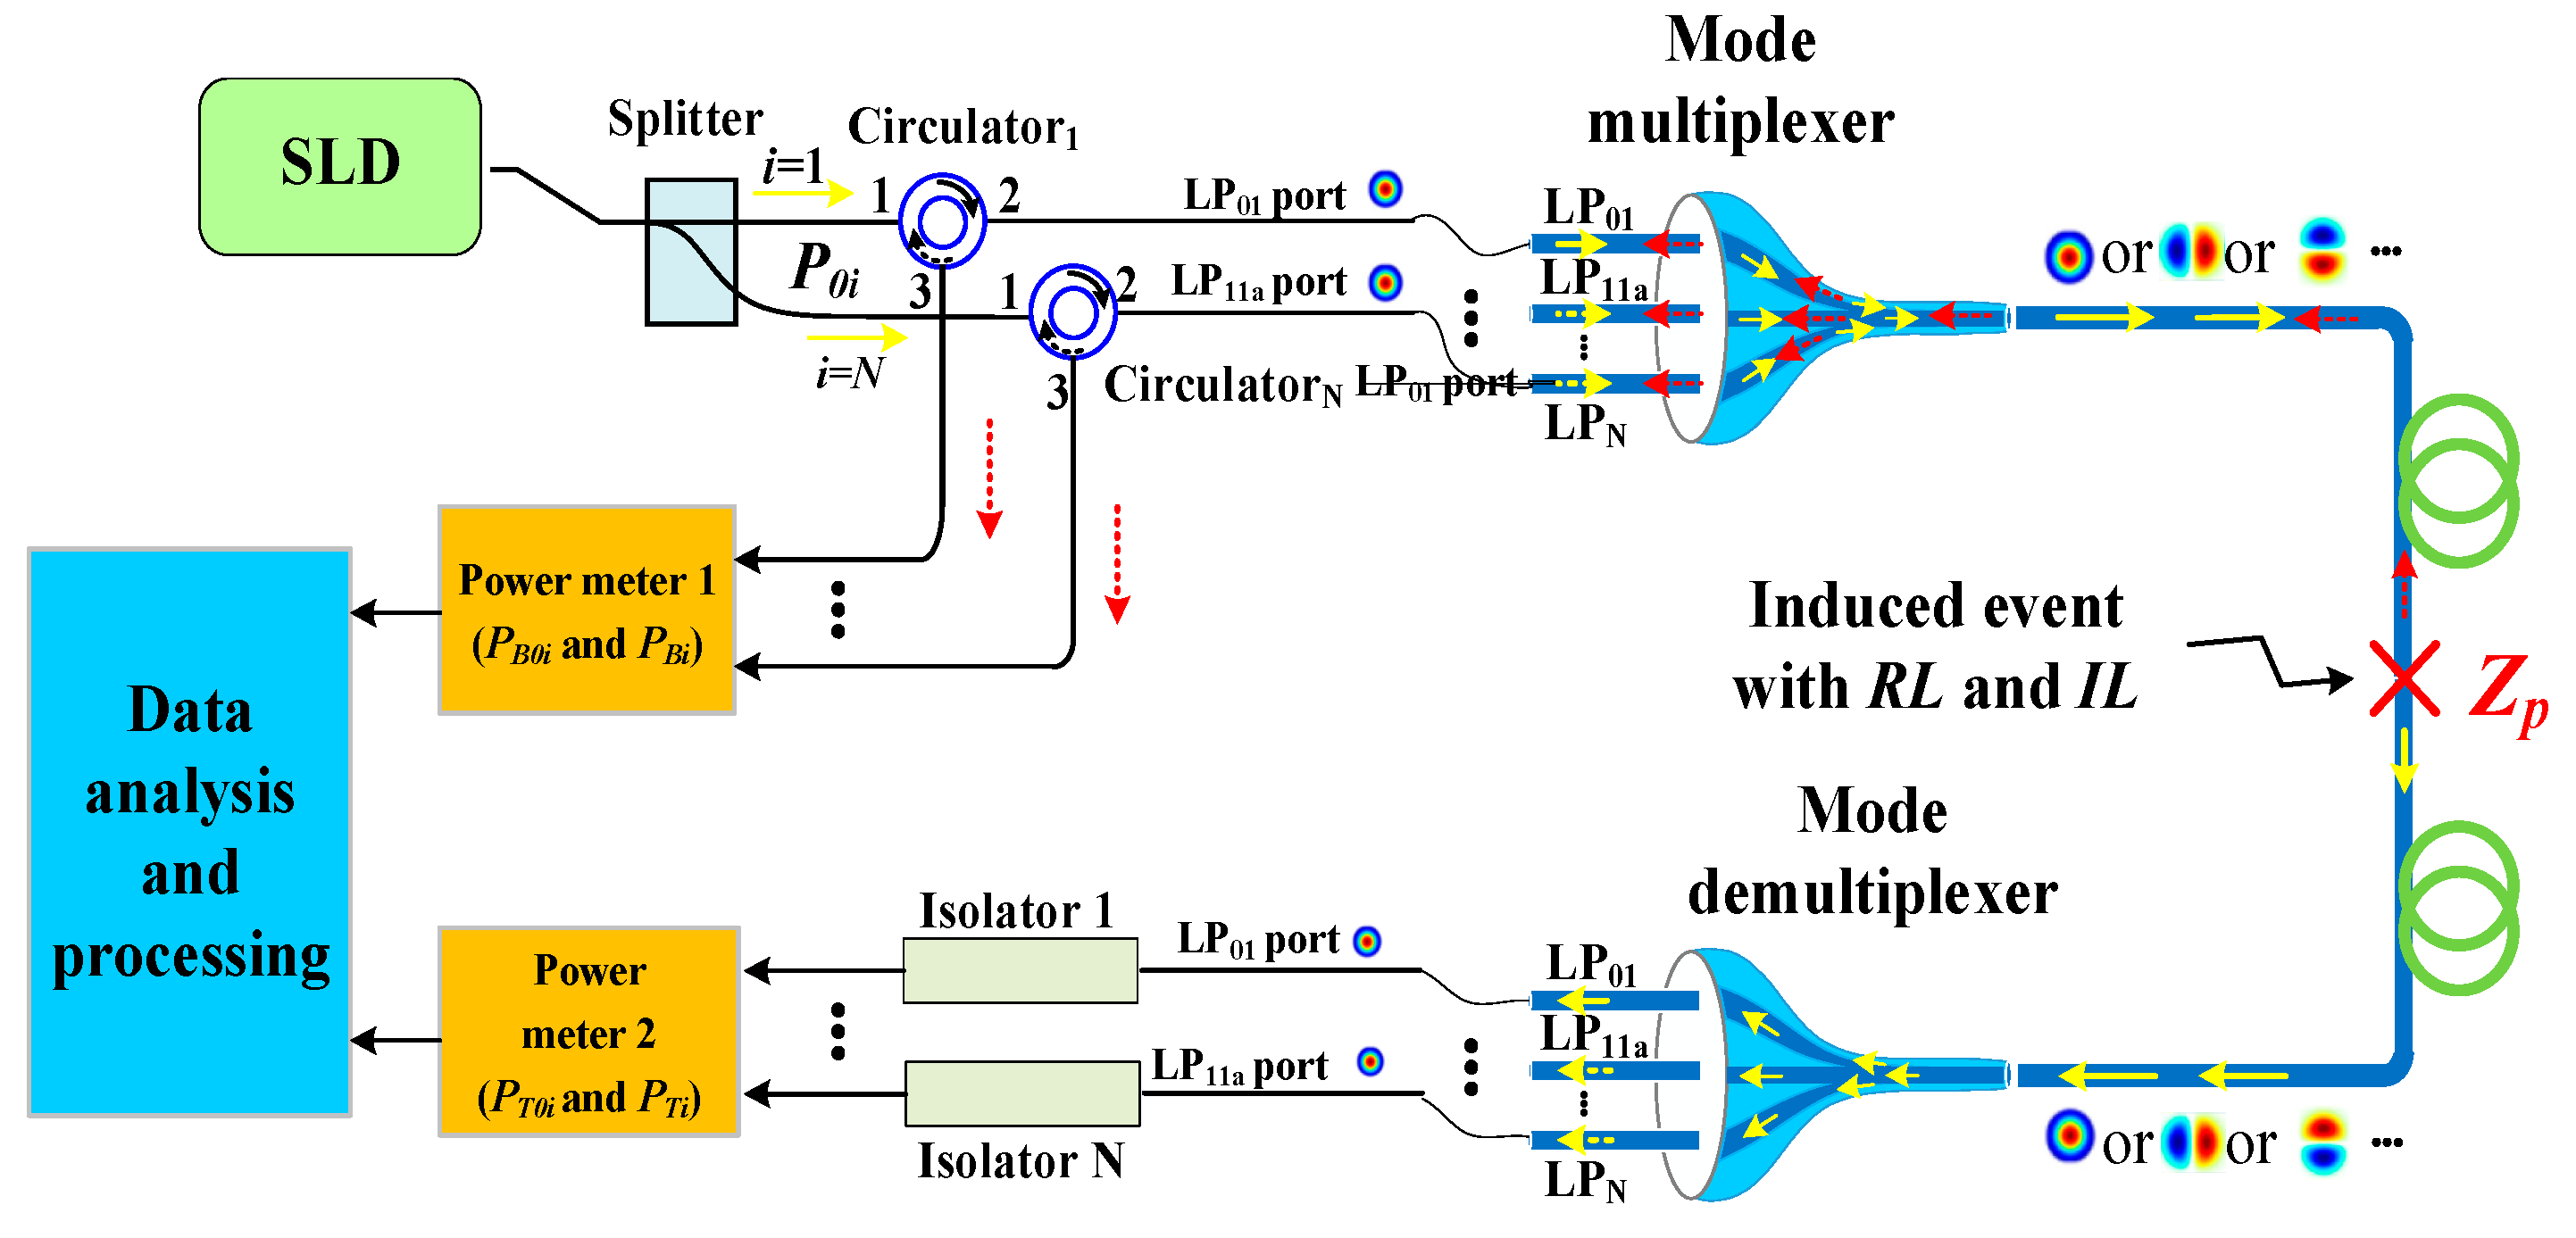
2. Operating Principle

The problem of fault detection and localization of FMF links can be transformed into a quantitative analysis problem of transmitted power P T and reflected or backscattered power P B in each spatial mode, as shown in Figure 1, taking the LP01 and LP11 modes as an example, when the continuous wave swith power P 0 are injected into the LP01 and LP11 modes, respectively. P T 1 and P T 2 are the transmitted powers transmitted through LP01 and LP11 modes, and P B 1 and P B 2 are the reflected or backscattered power carried by different modes. There is the loss in FMF mode during transmission. For a given FMF link, the reflective and non-reflective faults can be accurately detected and located by measuring P T and P B . In view of this, this paper constructs a quantitative analysis model to determine the intrinsic correlation between the fault location z p , P T , and P B , to realize the accurate characterization of the fault events.
The schematic diagram of the proposed method for MDM transmission based on FMF links using MM-TRA is shown in Figure 2. The continuous light generated by the superluminescent diode (SLD) is split into two paths through an optical splitter, entering from port 1 of the SMF circulator and outputting from port 2 to be injected into the MUX photonic lantern for spatial mode conversion and mode multiplexing, and then injected into the FMF link. After transmission through the FMF, the mixed modes are separated by the photonic lantern. The P T 0 i and P T i values are obtained by power meter 2. The i ( i = 1, 2, 3, …) represent different mode labels (01, 11, 21, …), respectively. During the transmission in the FMF link, the reflected or backscattering light generated in the FMF link or at the fault point returns to the DEMUX for mixed-mode separation. The separated modes are input into port 2 of the optical circulator and output from port 3. Then, the P B 0 i and P B i are measured by power meter 1. Finally, the fault location z p can be calculated by the P T 0 i , P T i , P B 0 i , and P B i .
As shown in Figure 2, when there is no fault event in an FMF link of length L, the P T 0 i can be defined as:
P T 0 i = P 0 i 10 I L c i r 12 i 10 I L M U X i 10 T i L 10 I L D M U X i 10 I L i s o i 10
where P 0 i is the input power, the T i ( x ) is the transmission coefficient of different modes, and T i ( x ) = e α i x , the α i is transmission loss coefficient. The I L c i r ( 12 i ) [dB] and I L i s o ( i ) [dB] are the insertion loss of the optical circulator (i.e., the power transmits from port 1 to port 2) and the optical isolator, respectively; the I L M U X ( i ) [dB] and I L D M U X ( i ) [dB] are the IL of the LPi ports of the MUX and DEMUX, respectively.
Meanwhile, the Rayleigh backscattering/reflected power measured by optical power meter 1 can be written as:
P B 0 i = P 0 i 10 D I R i 10 + P 0 i 10 I L c i r 12 i 10 + I L M U X i 10 + I L D E M U X i 10 + I L c i r 23 i 10 × R A Y i L + 10 R L M U X i 10                 + T i 2 L 10 R L i s o i 10 + R L D E M U X i 10  
where the D I R i [dB] is the power transmitted directly from port 1 to port 3. The R L i s o ( i ) [dB], R L M U X ( i ) [dB], and R L D E M U X ( i ) [dB] are the return loss of the optical isolator, MUX, and DEMUX, respectively. The return loss R L is defined as 10 log 10 ( η ) , and the η is the ratio of input power to reflected power. The I L c i r ( 23 i ) [dB] is the insertion loss from port 2 to port 3 in the circulator. The R A Y i ( x ) is the backscattering coefficient:
R A Y i x = B i i α s i 2 α i 1 e 2 α i x
where the α s i is the scattering coefficient, and B i i is the capture factor of mode i . When the fault occurs at z p , the corresponding fault insertion loss I L i [dB] and fault return loss R L [dB] are generated due to the fault. The theoretical formula of transmitted power obtained by power meter 2 can be written as:
P T i = P T 0 i 10 ( I L i 10 )
By measuring the P T i and P T 0 i , the IL of the FMF link fault event can be calculated by Equation (4). At this time, the backscattering/reflection power P B i can be expressed as:
P B i = P 0 i 10 D I R i 10 + P 0 i 10 I L c i r 12 i 10 + I L M U X i 10 + I L D E M U X i 10 + I L c i r 23 i 10 × R A Y i z p + 10 R L M U X i 10               + T i 2 z p 10 R L 10   + R A Y i L   R A Y i z p 10 I L i 5 + T i 2 L 10 I L i 5 10 R L i s o i 10 + R L D E M U X i 10
Then, according to Equations (2) and (5), the normalized power reflection coefficient R i can be calculated.
R i = P B i P B 0 i
where c i r i = 10 ^ ( I L c i r ( 12 i ) + I L c i r ( 23 i ) + I L M U X ( i ) + I L D E M U X ( i ) ) / 10 , since D I R i , IL cir 12 23 i , I L M U X ( D E M U X ) i , R L iso ( i ) , R L M U X , and R L DE M U X are known parameters. The α i , L , IL i , P B 0 i , and P B i can be measured, and α s i B i i can be obtained by Equation (3). So, the problem of fault localization in the FMF link has been transformed into solving a set of equations with two unknown z p and R L parameters, as indicated by Equation (6). The R i can be calculated by measuring P B i and P B 0 i before and after the fault occurs. Then the fault localization with high precision for long-reach MDM based on FMF can be realized. On this basis, it can be extended to multi-mode measurement, that is, selecting multiple appropriate spatial modes as the object of transmission reflection analysis. Then the least square numerical optimal solution is realized, and the accurate calculation of the fault location z p is realized. It should be noted that the analysis object needs to be selected with high fault sensitivity according to the loss characteristic of each spatial mode.

3. Theoretical Analysis of Localization Accuracy of Various Faults

In this section, the localization accuracy of the MM-TRA method is deeply analyzed for different fault types, including reflective faults (fiber break, connector mismatch) and non-reflective faults (fiber bending). The measurement error of the power meter is the main factor that limits the positioning accuracy of the MM-TRA [19]. Taking into account the measurement errors and noise effects of the power meters, two uncertainty coefficients ς 1 and ς 2 are introduced, corresponding to the measurement errors of power meters 1 and 2, respectively. The values of ς 1 and ς 2 are set to 0.001. The transmitted and backscattering/reflecting measuring range of the power meter are P T i ± P T i ς 2 , and P B i ± P B i ς 1 , respectively. The Rayleigh backscattering power of higher-order spatial models can be improved by using an SLD, which makes the P B i ± P B i ζ 1 fluctuation small, and the normalized power reflection coefficient R i is less affected, so as to ensure the sensitivity of fault detection. The simulation experiment is conducted using 10,000 samples, which are uniformly distributed within the aforementioned range for measured power. By substituting the R i into Equation (6), the value of R L and z p can be calculated. Note that return loss at the fault point is treated as constant regardless of the order of the LP mode of the probe signal [22].

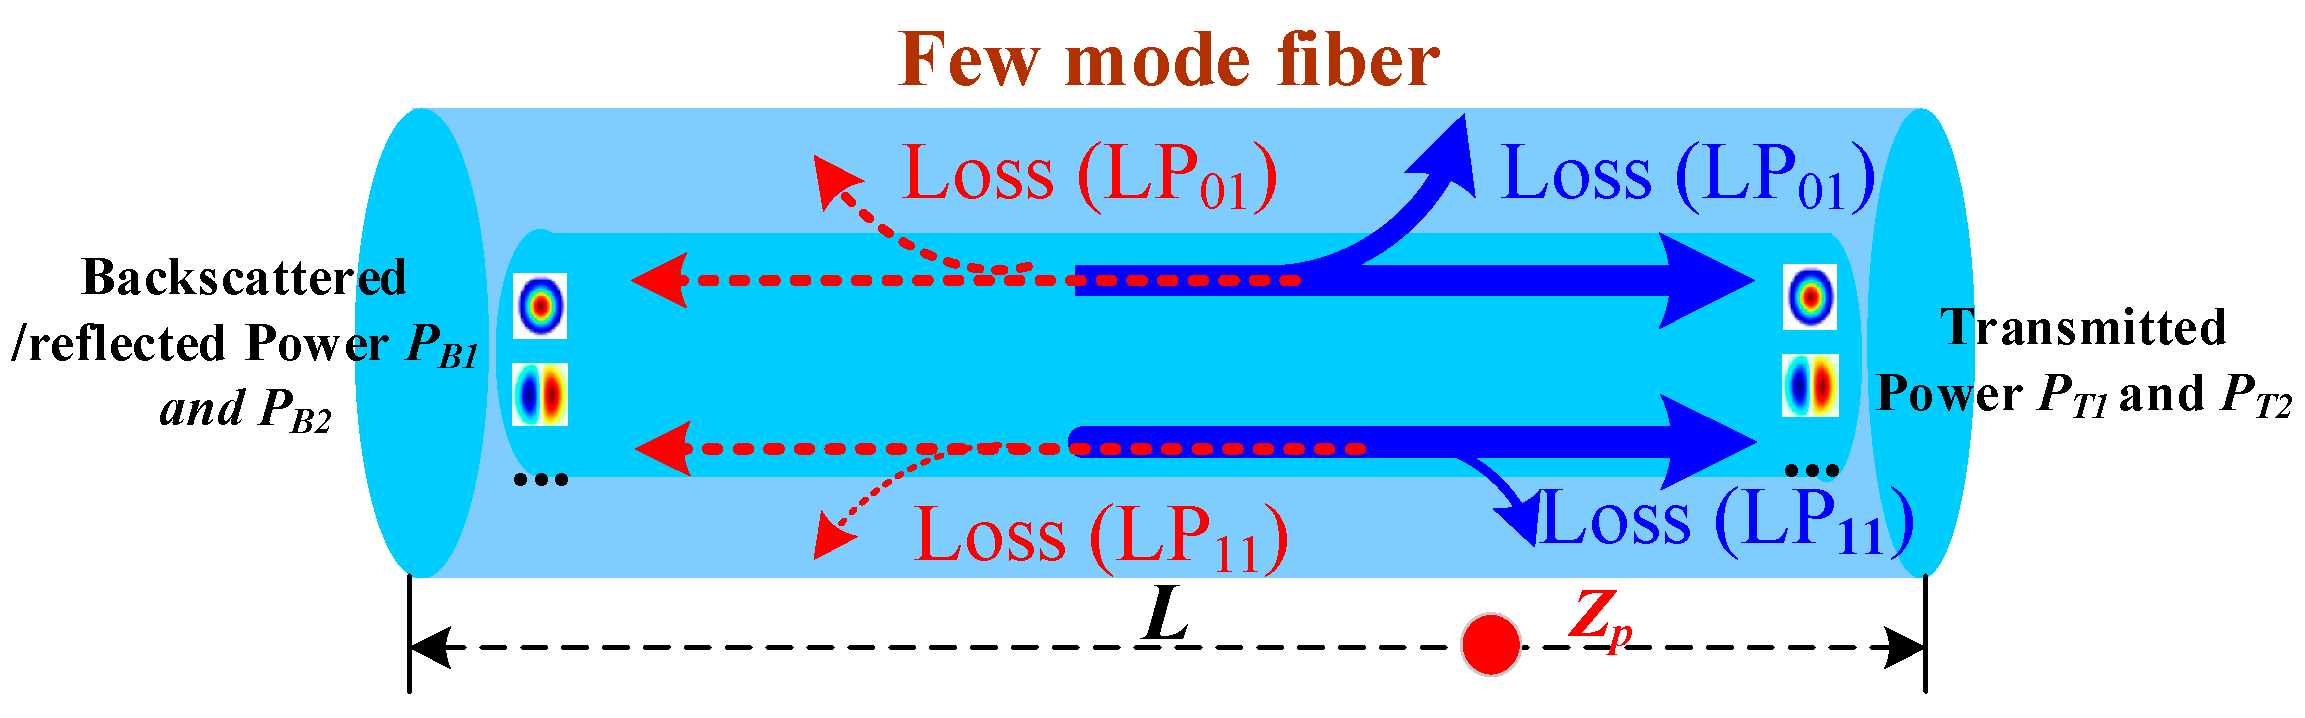
3.1. Few Mode Fiber Break

At 1550 nm, the return loss R L of fiber break and insertion loss I L measured by OTDR are 46.5 dB and infinite, respectively. For communication applications, the total length of the optical fiber link can be long or short, so the length of the optical fiber here is analyzed by taking 50 km as an example, and the FMF can support LP01, LP11, LP21, and LP02 spatial modes. Table 1 lists the parameters used in the analytical model. The attenuation coefficients of LP01, LP11, LP21, and LP02 are 0.192, 0.205, 0.233, and 0.365 dB/km, respectively [23]. The wavelength of SLD used in the simulation experiment is 1550 nm. The output power is 10 mW.
Meanwhile, in this paper, the mode MUX and DEMUX are implemented using photonic lanterns, respectively, and the insertion loss of each mode is shown in Table 2. The return loss value of photonic lantern is set to 60 dB.
When the FMF break occurs at different locations, the distribution of expected localization errors is shown in Figure 3. Through the analysis of the location results of FMF break occurring at different positions of the FMF link with six cases, it can be seen that localization accuracy will produce some degree of error at far end of FMF link, and the higher-order mode combinations have larger localization errors than lower-order mode combinations. When z p = 0 km, the expected localization errors are all approaching 0 km. When z p = 32 km, the localization errors of combinations 1, 2, and 4 are small, while combinations 3, 5, and 6 show a rising trend. The localization errors approach about 30 m. Where the combinations 1, 2, 3, 4, 5, and 6 represent the use of mode combinations for fault localization accuracy analysis, specifically LP01 with LP11, LP01 with LP21, LP01 with LP02, LP11 with LP21, and LP21 with LP02. When z p = 49 km, the combination 1 is less than 20 m, the combinations 2 and 4 are increased to 40 m, and the combinations 3, 5 and 6 are about 4.1 km. Through the above simulation analysis and discussion, we can conclude that, compared with other mode combinations, the LP01 and LP11 combination provides better fault localization accuracy.
The total length L of fiber optic links in MDM communication applications is not fixed. Therefore, its ability to detect link faults of different lengths needs to be analyzed. The length L varies from 0 to 80 km, and the break position z p is set at L / 2 . When the FMF break occurs at different positions, the distribution of expected localization errors is shown in Figure 4. When the L is small, the localization errors of all mode combinations are about 0 km. With the increase of L , combinations 1, 2, and 4 are lower than 11 m, and combinations 3, 5, and 6 show an increasing trend, reaching 0.6 km at L = 80 km. The maximum and minimum errors are 0.615 km and 4.65 m with combination modes LP21 and LP02, LP01, and LP11, respectively.

3.2. Few Mode Fiber Link Connector Mismatch

For the FMF connector mismatch, the parametric analysis shown in Table 1 is used. Here, the I L of the connector mismatch is set to 14 dB measured by the OTDR. The return loss R L changes from 14 to 60 dB, which can cover different connectors (such as FC/PC, FC/APC). We consider that the length of the FMF to be analyzed is 50 km, and the connector mismatch occurs at 10 km (i.e., zp = 10 km).
In Figure 5, the errors for different mode combinations are plotted separately as a function of return loss R L . For the mode combination LP01 and LP11, the expected localization error peaks at 31 dB return loss. When the return losses are 31 dB and 33 dB, respectively, the expected localization error reaches a peak by using the LP01 and LP21 or LP11 and LP02 mode combination, respectively. For the mode combination LP01 and LP02, LP11 and LP21, LP11 and LP02, when the return loss is 31 dB and 34 dB, the expected localization error reaches a peak. For the mode combination LP21 and LP02, when the RL is 34 dB, the expected localization error reaches a peak. All the above mode combinations exhibit poor localization accuracy at the expected error peak.
By analyzing the relationship of R i under different RL, the reasons for the peaks of the localization errors of each spatial mode combination can be obtained. As shown in Figure 6, each curve represents the dependence (the z p varying from 0 to 50 km in each curve) when a connector mismatch event is introduced at different locations. For example, in Figure 6a, the blue curve in the lower left corner represents the relationship between R 1 and R 2 when R L is equal to 25 dB. When R L is close to 31 dB, the corresponding R i curves of different fault locations are greatly squeezed, so a large localization error can be observed in Figure 5a. Similarly, in Figure 6b–f, when the R L is 31 dB and 33 dB, 31 dB and 34 dB, 31 dB and 34 dB, 31 dB and 33 dB, 34 dB, the corresponding R i curves are squeezed, leading to appear large localization errors in Figure 5, respectively.
The RL of the FC/PC connector is usually around 40 dB for a good connection. When FC/PC connector mismatch occurs, strong Fresnel reflection occurs on the mismatch surface, resulting in lower return loss. Return loss is typically greater than 50 dB when FC/APC connectors are mismatched, which is the main event to monitor for connector mismatch. The localization errors at 31 dB, 33 dB, and 34 dB-RL (peak values) will not affect the corresponding fault detection. Therefore, the proposed method is suitable for the detection and localization of the above two connector mismatch faults.

3.3. Few Mode Fiber Bending

For the FMF bending, the R L is set to infinity, because of the R L change with the bending radius. The I L is set to 20 dB. Similar to the FMF break, Figure 7 shows the analysis of the location results of the bending event occurring at different positions using different combinations. It can also be obtained that the localization accuracy will produce a certain degree of error at the far end of the FMF link. The higher-order mode combinations have larger localization errors than lower-order mode combinations. When z p = 0 km, the localization errors of all mode combinations are about 0 km. When z p = 30 km, the combinations 1, 2, and 4 have less error, while the combinations 3, 5, and 6 show an increasing trend. When z p = 49 km, the error of combination 1, 2, and 4 is approximately 10, 20, and 30 m, respectively, and the combination 3, 5, and 6 is about 4 km. According to the above analysis, we can conclude that the LP01 and LP11 combination has better localization accuracy.
For the proposed MM-TRA method, its ability to detect fiber bending of different lengths needs to be analyzed. The L varies from 0 to 80 km to, and the z p is set at L / 2 . The distribution of expected localization errors is shown in Figure 8 when fiber bending occurs at different positions. When the L is small, the errors of mode combinations 1, 2, 3, 4, 5, and 6 are about 0 km. With the increase of L , combinations 1, 2, and 4 have errors less than 7.5 m, and the combinations 3, 5, and 6 show an increasing trend. The maximum and minimum errors are 0.514 km and 5.8 m by using the combinations LP21 and LP02, LP01, and LP11, respectively.
Although the localization error will deteriorate with the increase of the length L . However, according to the analysis of Figure 4 and Figure 8, we can conclude that selecting the appropriate combination for quantification analysis can achieve good positioning accuracy. From the above analysis of the FMF break, FMF link connector mismatch, and FMF bending, the proposed method can detect, identify, and locate various faults in the FMF link with good spatial localization accuracy. The combination of LP01 and LP11 is suitable for fault detection.
In the actual application scenario of FMF, the FMF link may have different degrees of bending loss. In order to analyze different bending loss conditions better, the expected localization error of MM-TRA fault detection as a function of the bending event IL (10 to 50 dB) is analyzed. The length of the FMF link is 50 km, and the fiber bending event occurs at 25 km. As shown in Figure 9, within an insertion loss range (10 to 50 dB), the localization error remains at a low level (i.e., less than 6 m). So, using MM-TRA technology, it can be expected that bending events with both weak IL and large IL can be localized with high accuracy.

4. Analysis of the Localization Accuracy

As discussed in the previous section on localization errors, for FMF break, connector mismatch, and fiber bending, the MM-TRA scheme can realize location. Regarding which mode combination is selected to obtain high localization accuracy, without considering mode crosstalk and mode coupling, we obtain that the mode combination LP01 and LP11 can achieve higher positioning accuracy than other mode combinations. The fault location z p can be calculated by measuring P B i 0 , P B i , P T i 0 , and P T i in two different spatial modes and bringing the corresponding values into Equation (6). However, the crosstalk in the photonic lanterns and fiber intrinsic mode coupling involved in the fault detection system will affect the fault localization accuracy. Therefore, it is also necessary to analyze the influence of mode crosstalk and mode coupling on detection performance [24]. The corresponding Rayleigh backscattering power is optimized as Equations (7) and (8).
P B 0 i = P 0 i 10 D I R i 10 + P 0 i c i r i R A Y i L + 10 R L M U X i 10 + e ( α j α i ) 2 L 10 CR M U X i j 10 + T i 2 L 10 R L i s o i 10 + R L D E M U X i 10                 e ( α j α i ) L 10 CR D E M U X i j 10 e ( α j α i ) L 10 MC i j 10 L
P B i = P 0 i 10 D I R i 10 + P 0 i c i r i R A Y i z p + 10 R L M U X i 10     + e ( α j α i ) 2 L 10 CR M U X i j 10 + T i 2 z p 10 R L 10 + R A Y i L R A Y i z p 10 I L i 5                             + T i 2 L 10 I L i 5 + R L i s o i 10 + R L D E M U X i 10 e ( α j α i ) L 10 CR D E M U X i j 10 e ( α j α i ) L 10 MC i j 10 L                      
where the CR M U X ( i j ) and CR D E M U X ( i j ) are the crosstalk between i and j modes in the photonics lantern, and there are exp [ ( α j α i ) 2 L ] 10 ^ CR M U X ( i j ) / 10 and exp [ ( α j α i ) L ] 10 ^ CR D E M U X ( i j ) / 10 , respectively. The MC i j is the MC between i and j modes in FMF, and it is exp [ ( α j α i ) L ] 10 ^ MC i j / 10 L . The value of MC and mode crosstalk are shown in Table 3.
The influence of crosstalk and coupling on localization accuracy when FMF break, FMF link connector mismatch, and FMF bending faults are analyzed and discussed, respectively, is shown. For the FMF break, a return loss of 46.5 dB is used, the insertion loss is infinite, the FMF is 50 km long, and the FMF break occurred at L / 4 from the front end (i.e., z p = 12.5 km). For the connector mismatch, R L = 55 dB and I L = 14 dB are selected for analysis. The length of FMF is 50 km, and the connector mismatch occurs at a distance of 10 km (i.e., z p = 10 km). For the FMF bending, the R L and I L are infinite and 20 dB, respectively, and the FMF length is 50 km. The fiber bending occurs at the L / 4 (i.e., z p = 12.5 km). The discussions are carried out under the same conditions as the previous analysis of fault localization accuracy, and the results are shown below.

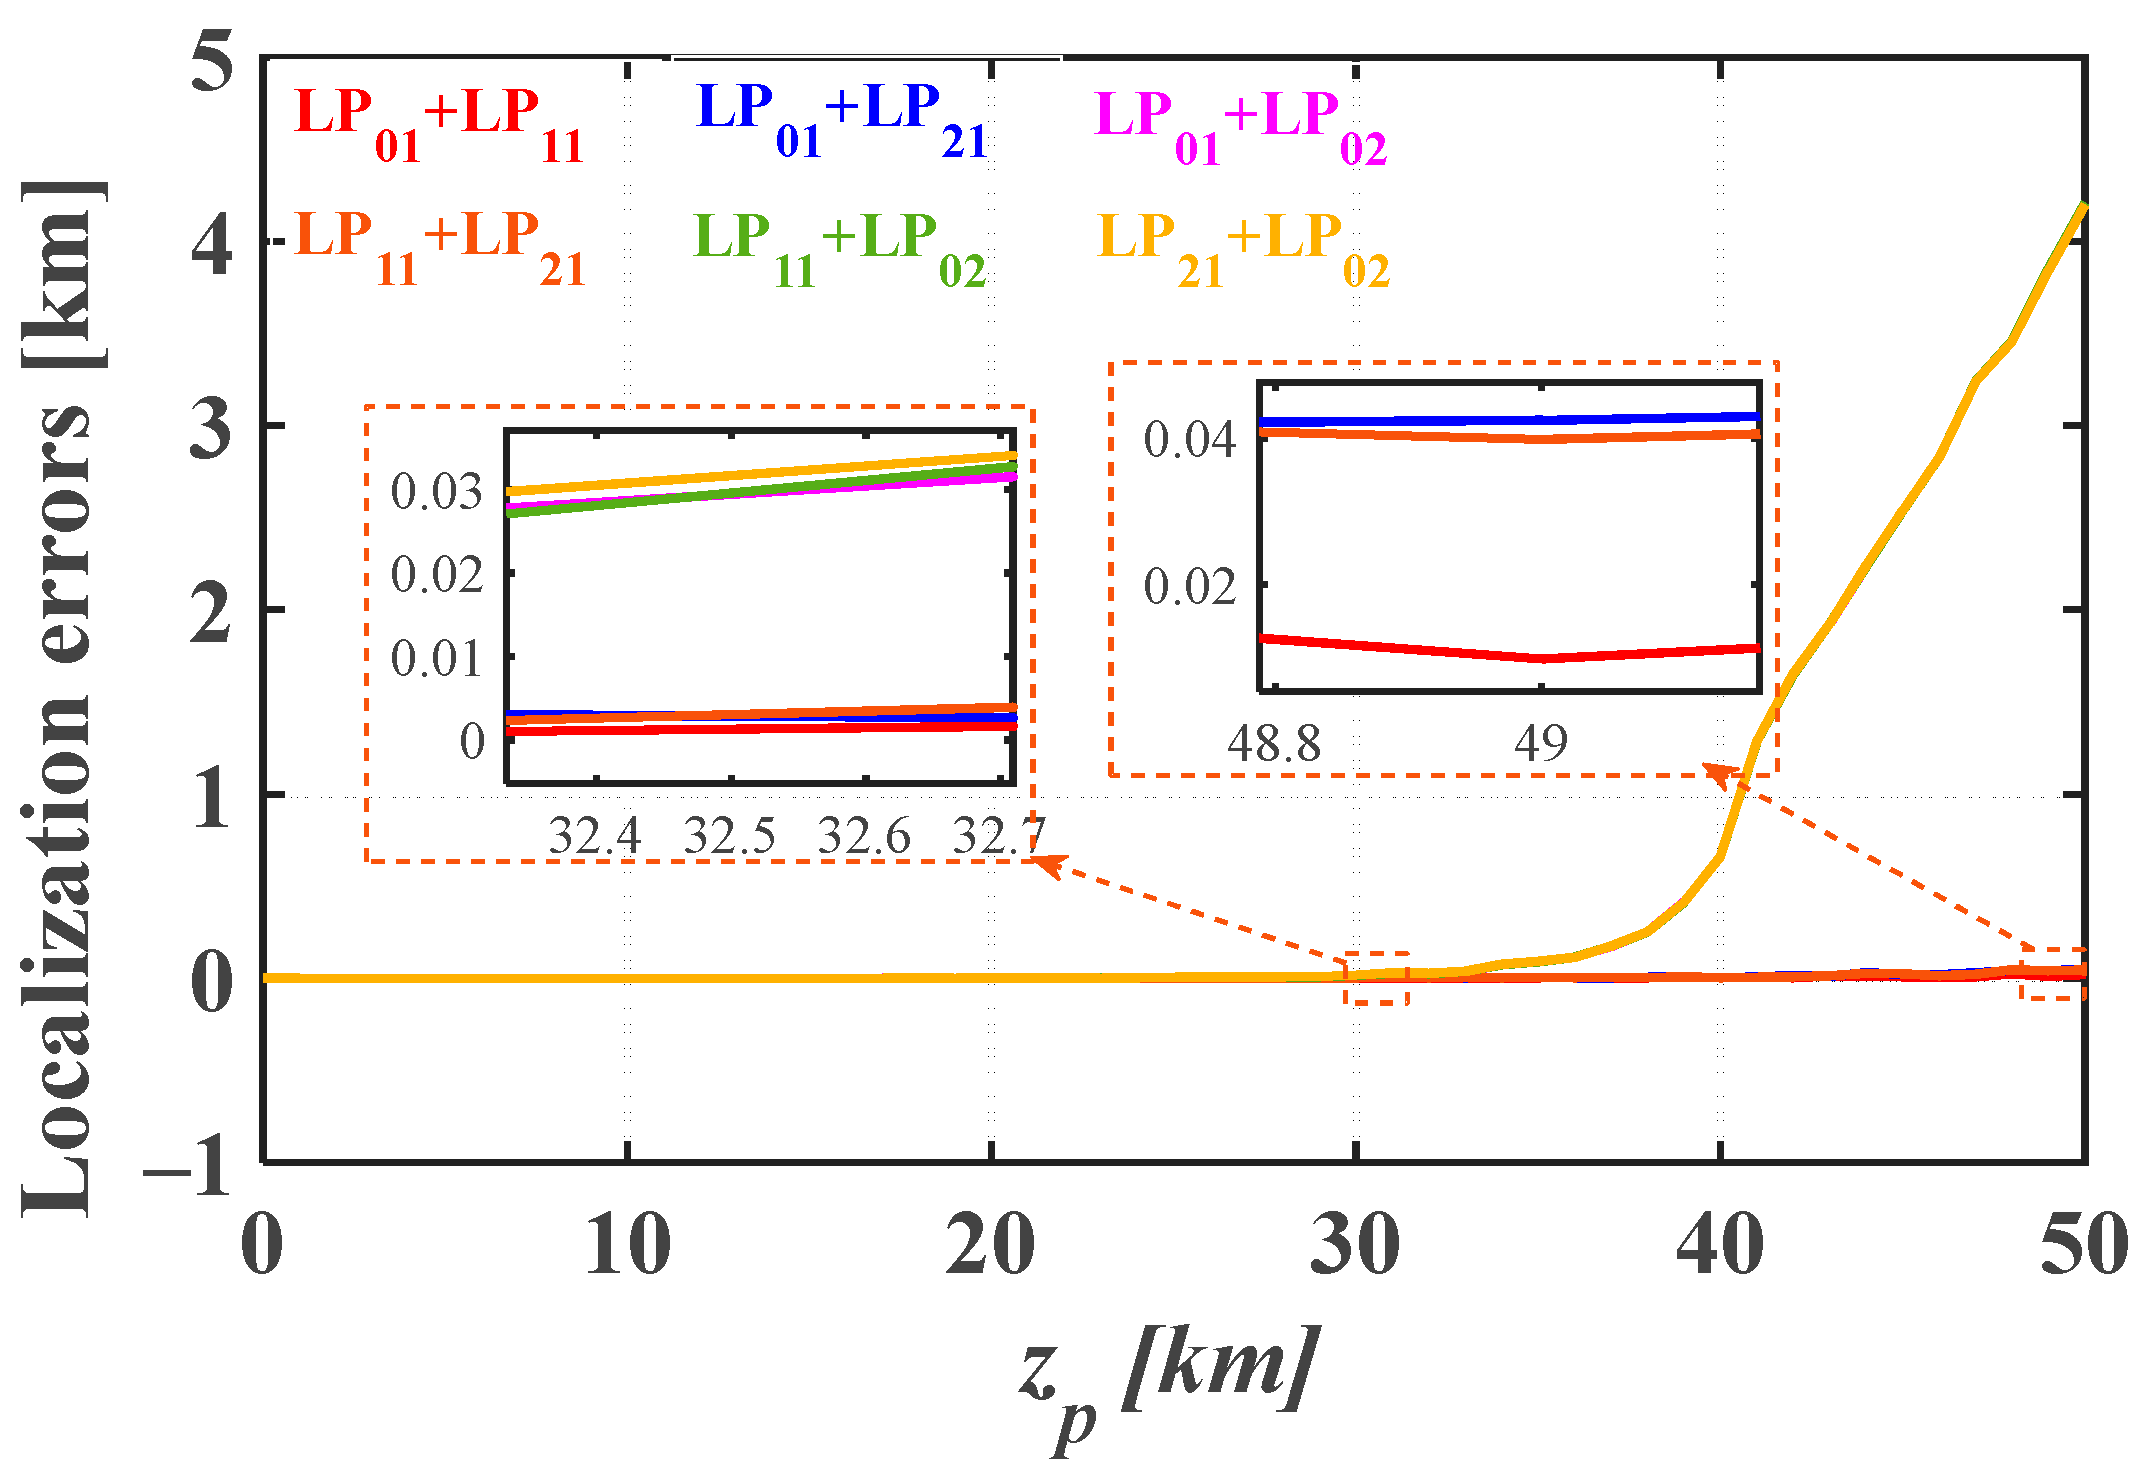
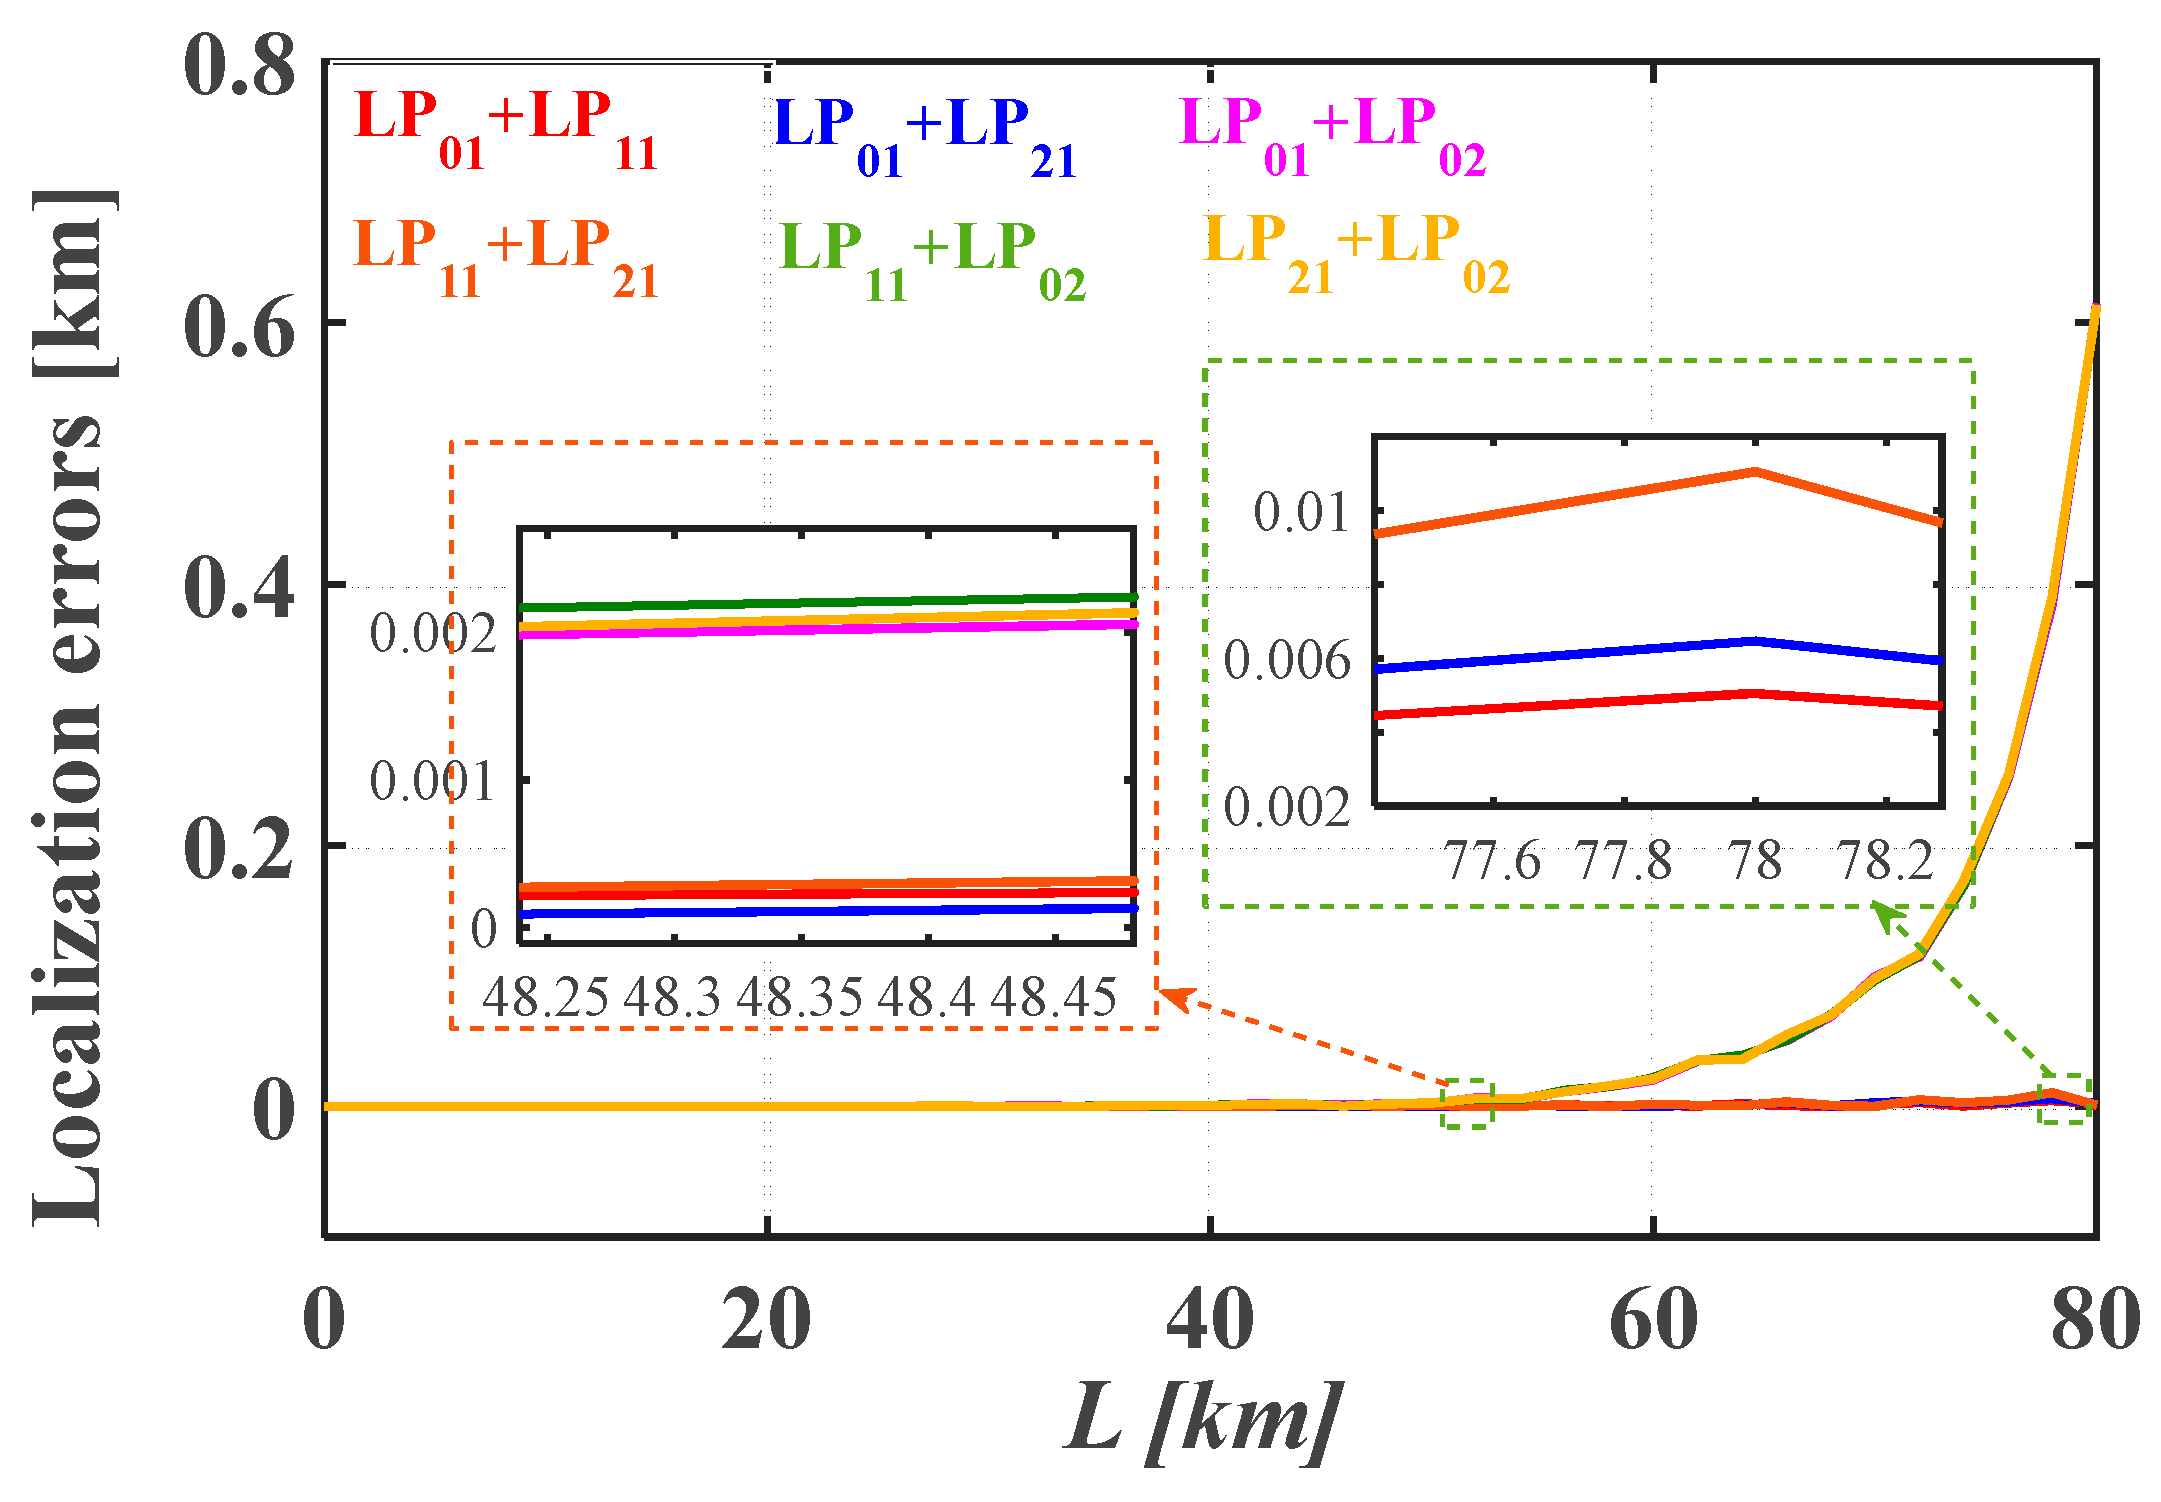
4.1. Error Analysis of Few-Mode Fiber Break

As shown in Figure 3 and Figure 4, as the fiber length increases, the localization accuracy also gradually deteriorates. When the fault location is located at 12.5 km, the localization errors of different mode combinations are all less than 0.2 m. When mode crosstalk is introduced into the system according to the Equations (7) and (8), as shown in Figure 10, the localization errors of FMF break are 23.60 m, 3.42 m, 2941.99 m, 73.06 m, 10298.35 m, and 7336.26 m, respectively. It can be clearly observed that the larger crosstalk of the mode combination, the lower the localization accuracy, and vice versa. The mode combination LP01 and LP21 has minimal mode crosstalk and the lowest localization error. Similarly, when mode coupling between modes is introduced into the system with FMF break, the expected localization errors for mode combinations are 16.68 m, 2.37 m, 1168.07 m, 54.97 m, 9011.72 m, and 6428.82 m, respectively. The mode coupling between LP01 and LP21 is minimal, also showing high localization accuracy. Therefore, for FMF break, high-precision localization can be achieved by using the mode combination LP01 and LP21.
Meanwhile, according to the above analysis, whether it is the MC in FMF or the mode crosstalk of mode multiplexer/demultiplexer will have a certain impact on the fault detection sensitivity, and the larger the mode crosstalk is, the greater the error is. Therefore, for weakly coupled FMF and low crosstalk photonic lantern, the proposed scheme can achieve higher fault detection sensitivity. For strongly coupled optical fibers or large crosstalk, selecting a reasonable mode combination is necessary.
The above is the analysis of MM-TRA fault detection error under the conditions of fixed mode crosstalk and mode coupling. In order to further analyze the mechanism of influence, we give more attention and discuss more in detail the impact of the modal crosstalk and coupling. Here, the combination of LP01 and LP21 modes is taken as an example for analysis. For the FMF break, the RL is 46.5 dB, and the IL is infinite. The length of the FMF is 50 km, and the fiber break occurs at 12.5 km. The influence of mode crosstalk (−15~−30 dB) of MUX/DEMUX and mode coupling (−30, −25, −20, −15 dB/km) in FMF on break fault detection accuracy is analyzed in detail. Shown in Figure 11 is the effect of mode crosstalk and MC on the fault location accuracy. We can conclude that the fault detection error fluctuates less when the mode coupling changes with −30, −25, −20, and −15 dB/km. Therefore, the inherent mode coupling of FMF has little influence on the fault detection accuracy. With the increase of the inherent mode crosstalk of MUX/DEMUX devices (−30 dB to −15 dB), the fault detection accuracy is affected to some extent, mainly because when the crosstalk reaches a certain degree, the optical power at both ends of the system is greatly affected.

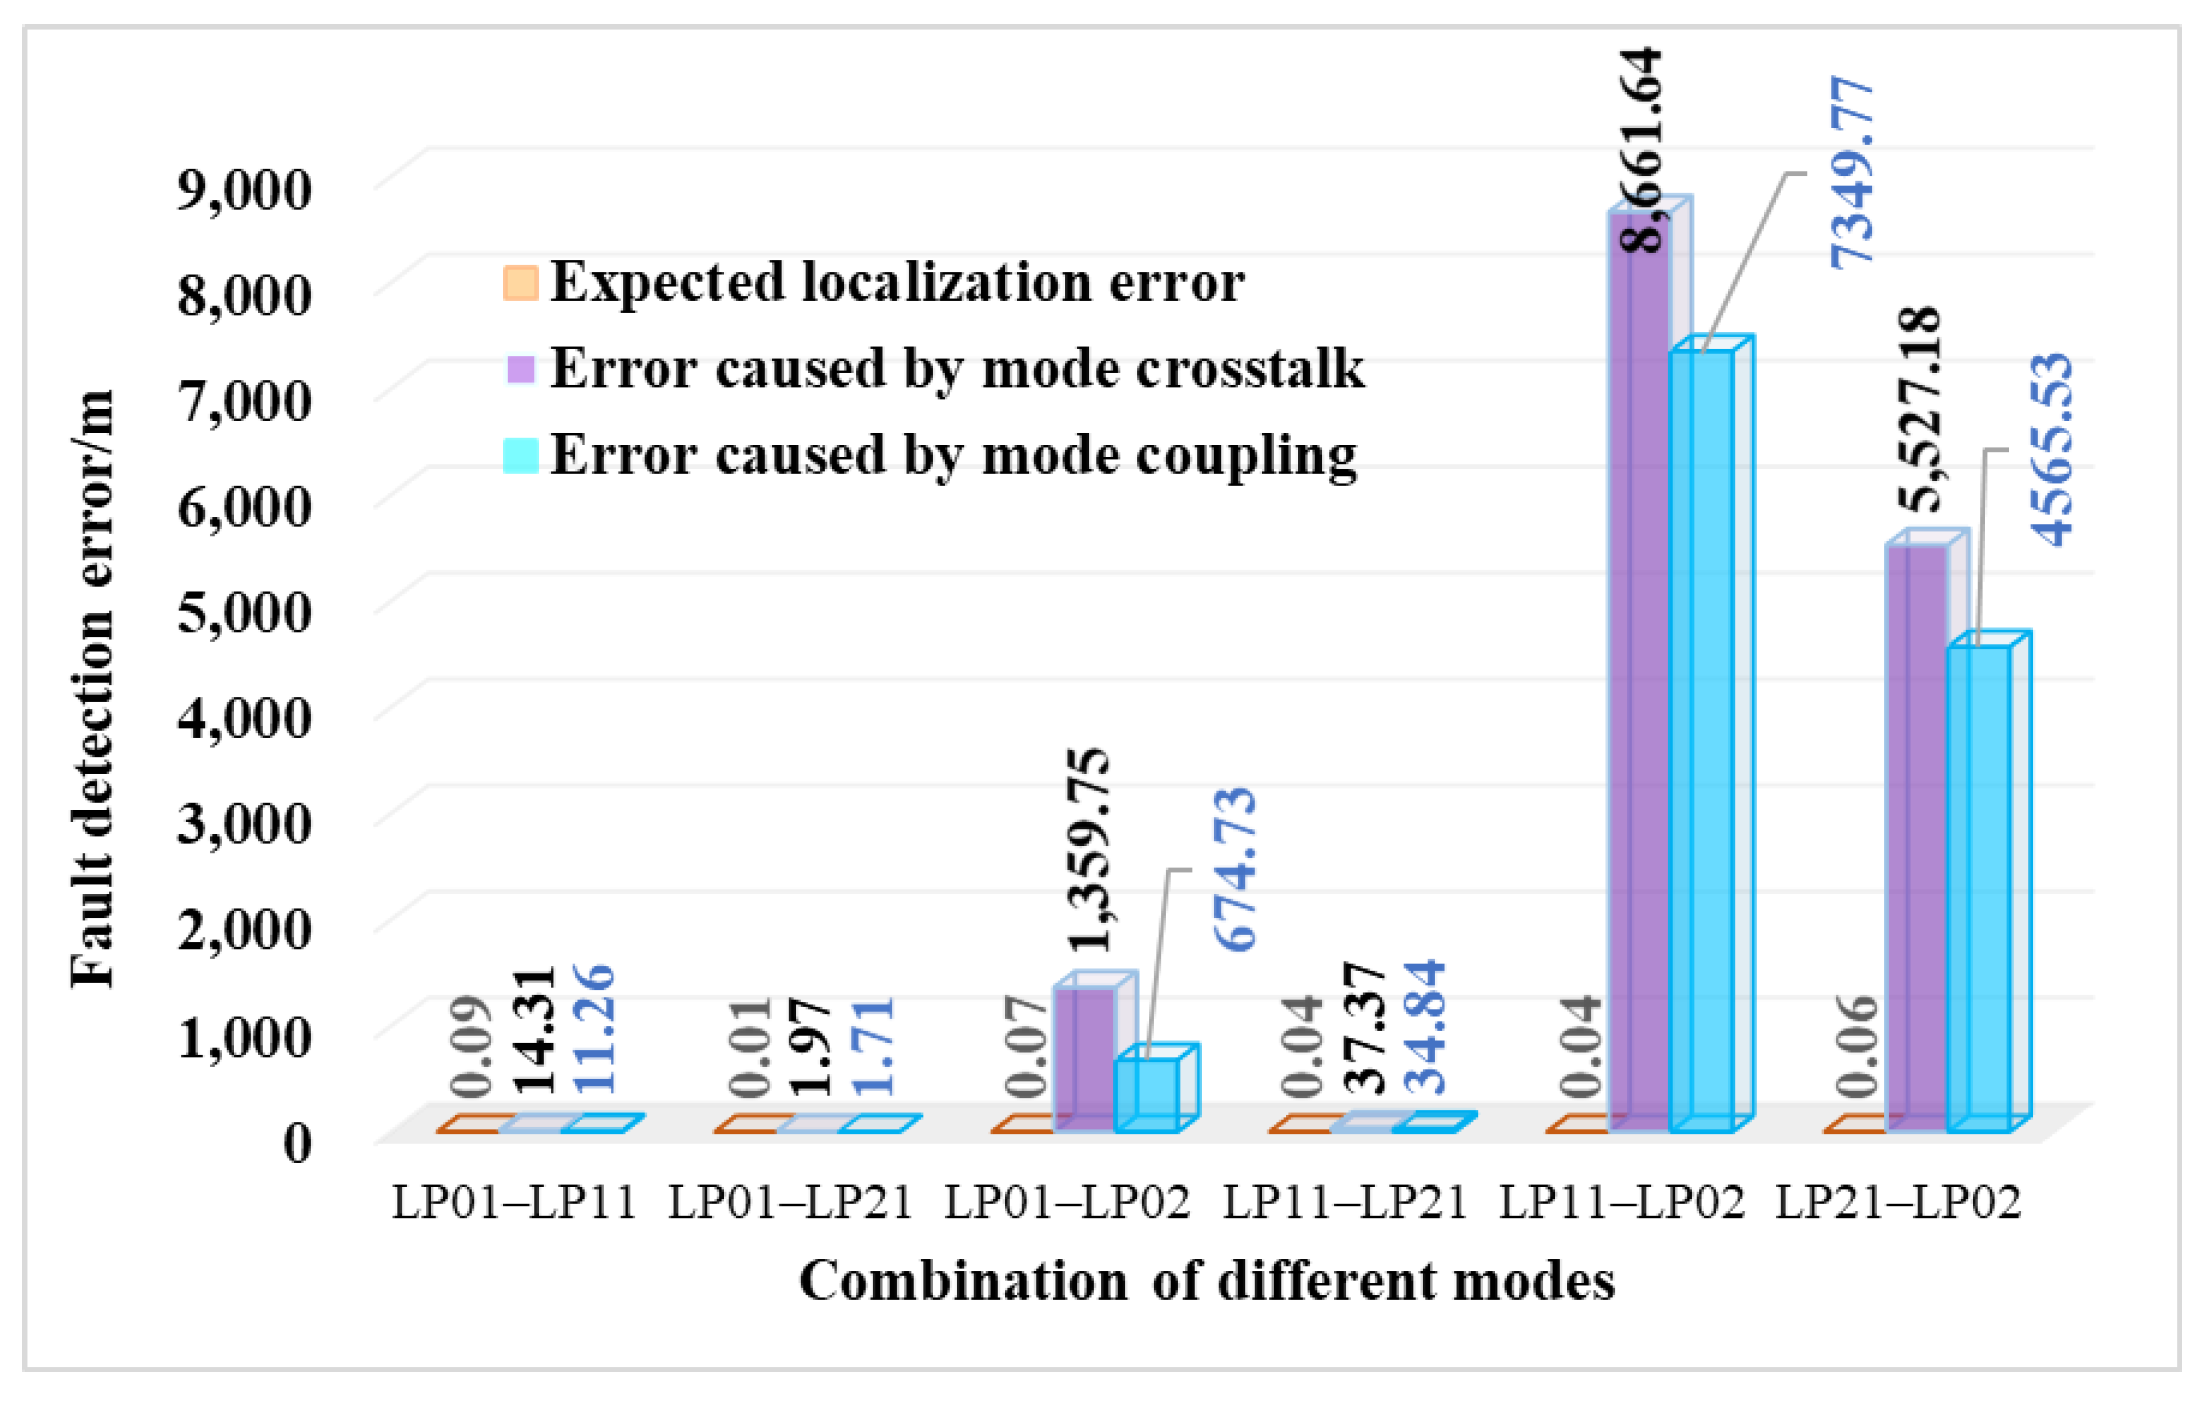
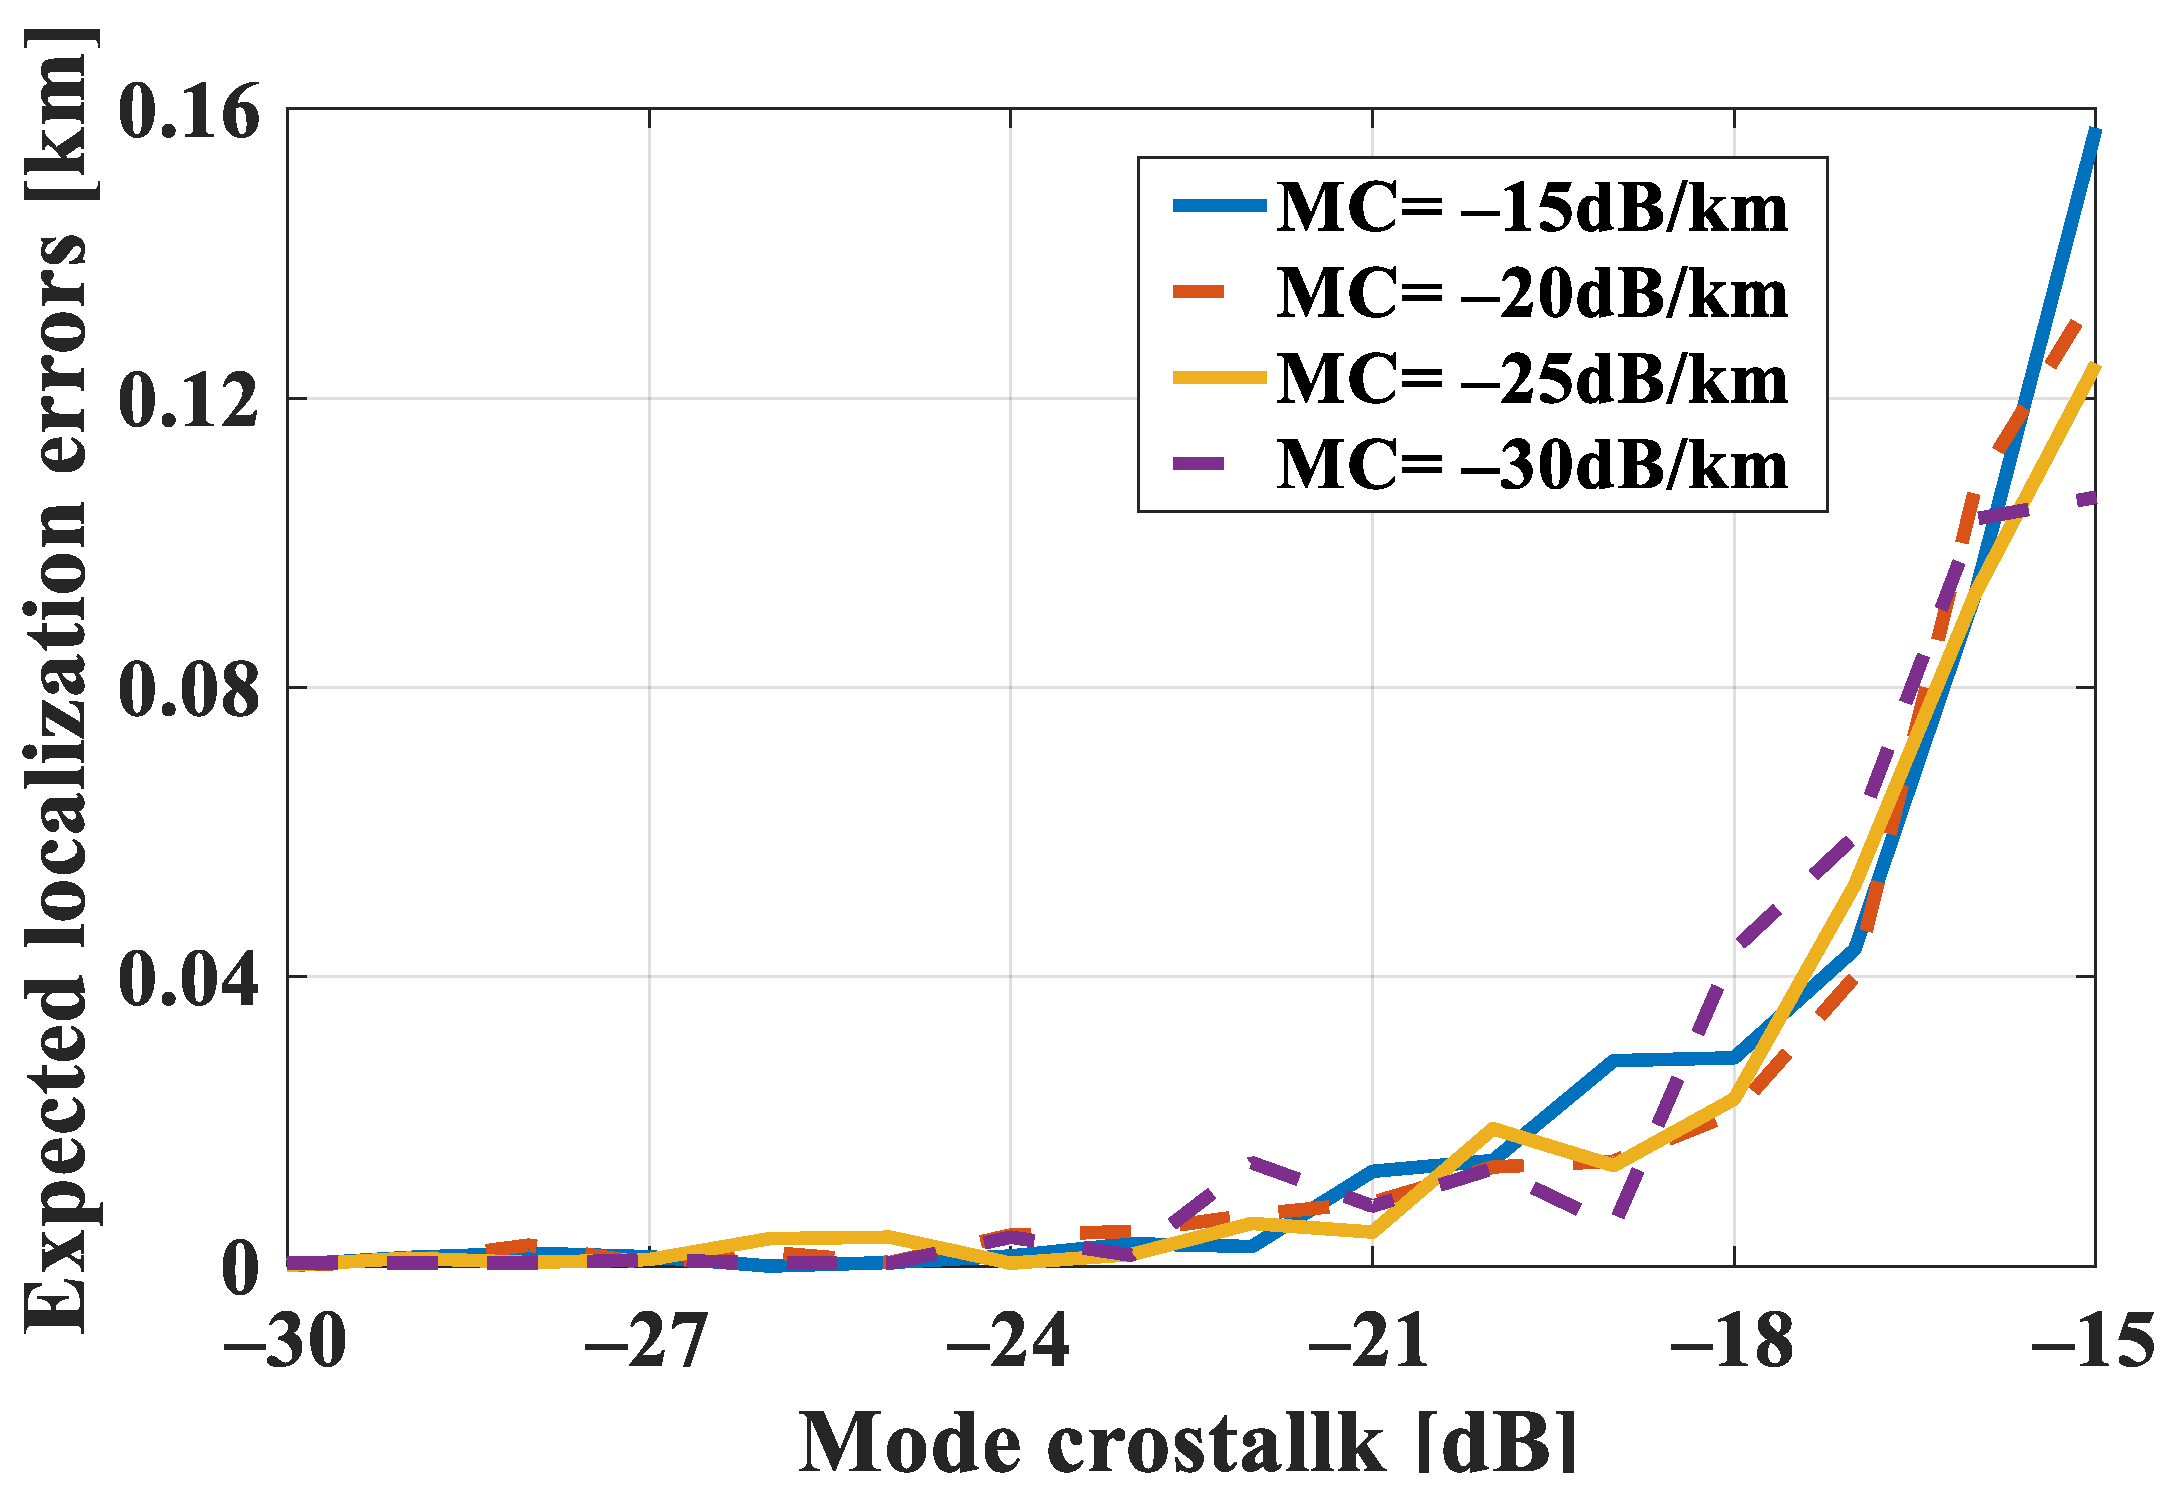
4.2. Error Analysis of Few-Mode Fiber Link Connector Mismatch

As shown in Figure 5, at the corresponding RL of each spatial mode combination, the expected localization error shows a peak. However, the return loss of most faults is greater or less than this value, so the impact of the decrease in the detection accuracy caused by the peak of the expected positioning error can be ignored. Here, the influence of MC and mode crosstalk on the localization accuracy of connector mismatch are introduced. It can be observed from Figure 12 that the FMF link connector mismatch is located at 10 km, and the mode combinations all exhibit high positioning accuracy. When mode crosstalk is introduced, the localization errors with different combinations are 14.31 m, 1.97 m, 1359.75 m, 37.37 m, 8661.64 m, and 5527.18 m, respectively. The mode combination with low mode crosstalk between LP11 and LP21 modes has the highest localization accuracy. When the mode coupling is introduced, the localization errors of the six mode combinations are 11.26 m, 1.71 m, 674.73 m, 34.84 m, 7349.77 m, and 4565.53 m, respectively. The mode combination with low MC between LP01 and LP21 modes has the highest localization accuracy. Therefore, selecting the mode combination LP01 and LP21 to locate the connector mismatch can obtain a high-precision location.
The position error of an FC/PC connector mismatch obtained here is different from our previous research when the FMF link is 6 km and the FC/PC connector mismatch occurs at 3 km, and the localization accuracy of the combination LP11 and LP21 mode can reach 3.58 m. This is due to differences between analytical conditions; the normalized power reflection coefficient is the ratio of the Rayleigh backscattered power. Therefore, when the location of the fault location is greater than L / 2 (i.e., z p > L / 2 ), there will be obvious localization errors. In conclusion, for FMF connector mismatch, the mode combination LP01 and LP21 can always achieve high-precision localization regardless of the analysis conditions. Similarly, the mode group with low mode coupling and crosstalk needs to be selected for analysis.
For the connector mismatch, R L = 55 dB, I L = 14 dB, the length of FMF is 50 km, and the connector mismatch occurs at 10 km. Figure 13 shows the effect of mode crosstalk and MC on the connector mismatch fault location accuracy. We can conclude that the detection error fluctuates less when the mode coupling changes with −30, −25, −20, and −15 dB/km. Therefore, the inherent mode coupling of FMF has little influence on the fault detection accuracy. As the inherent mode crosstalk of MUX/DEMUX devices increases (−30 dB~−15 dB), the fault detection accuracy will be affected to some extent when the crosstalk reaches −20 dB, mainly because the optical power at both ends of the system will be greatly affected when the crosstalk reaches a certain degree.

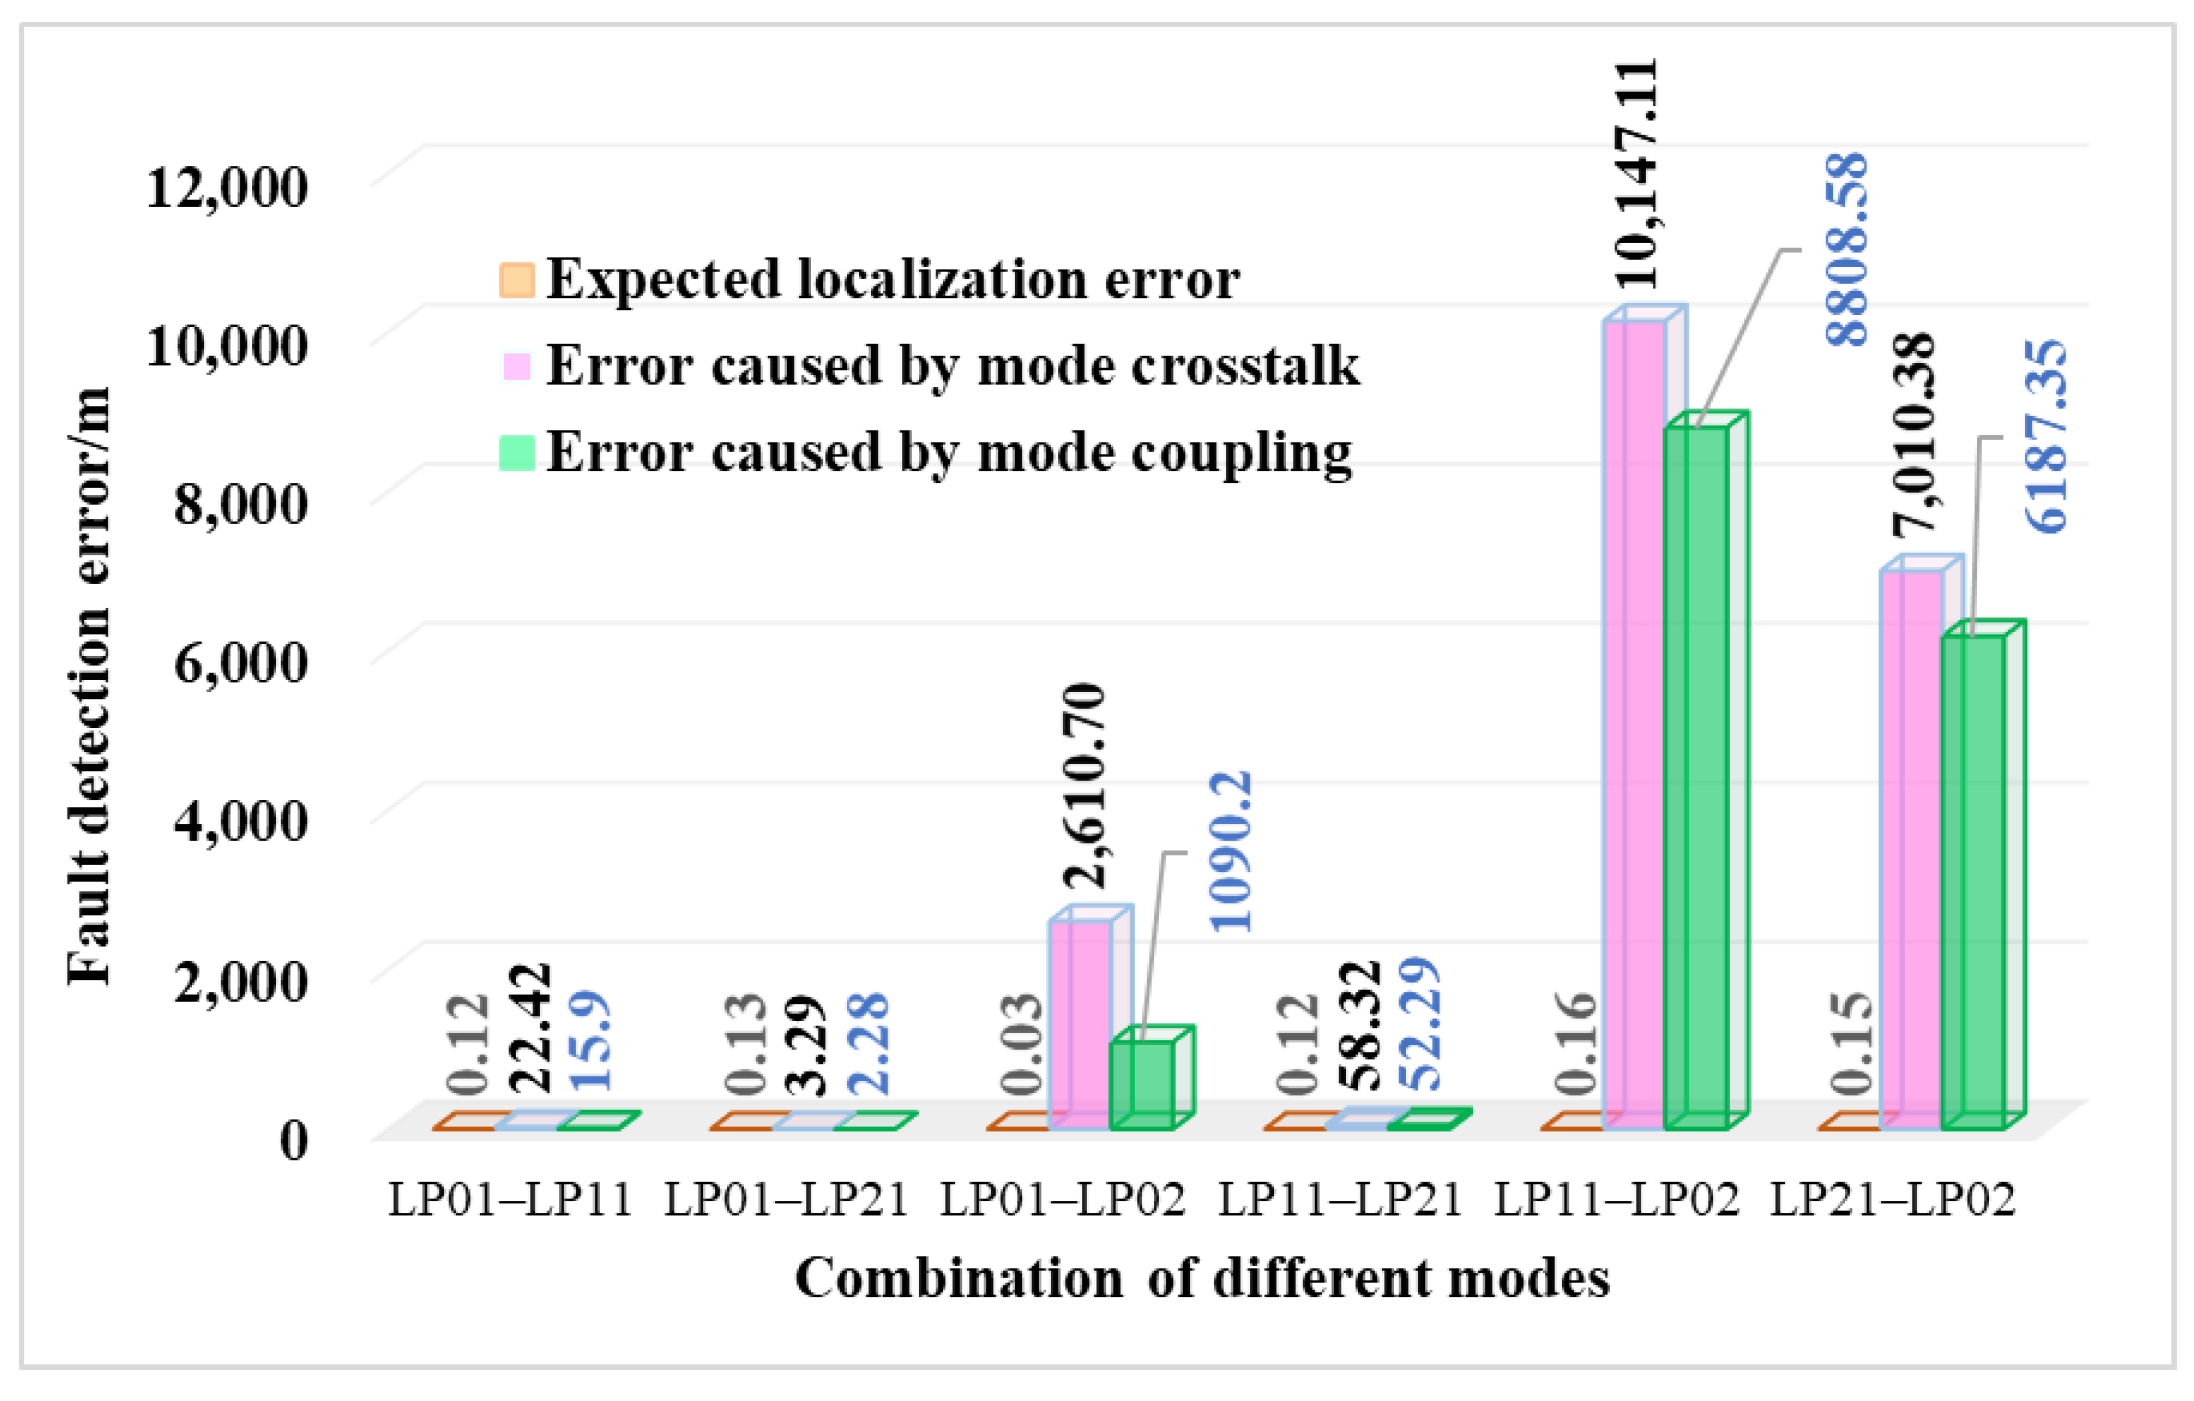
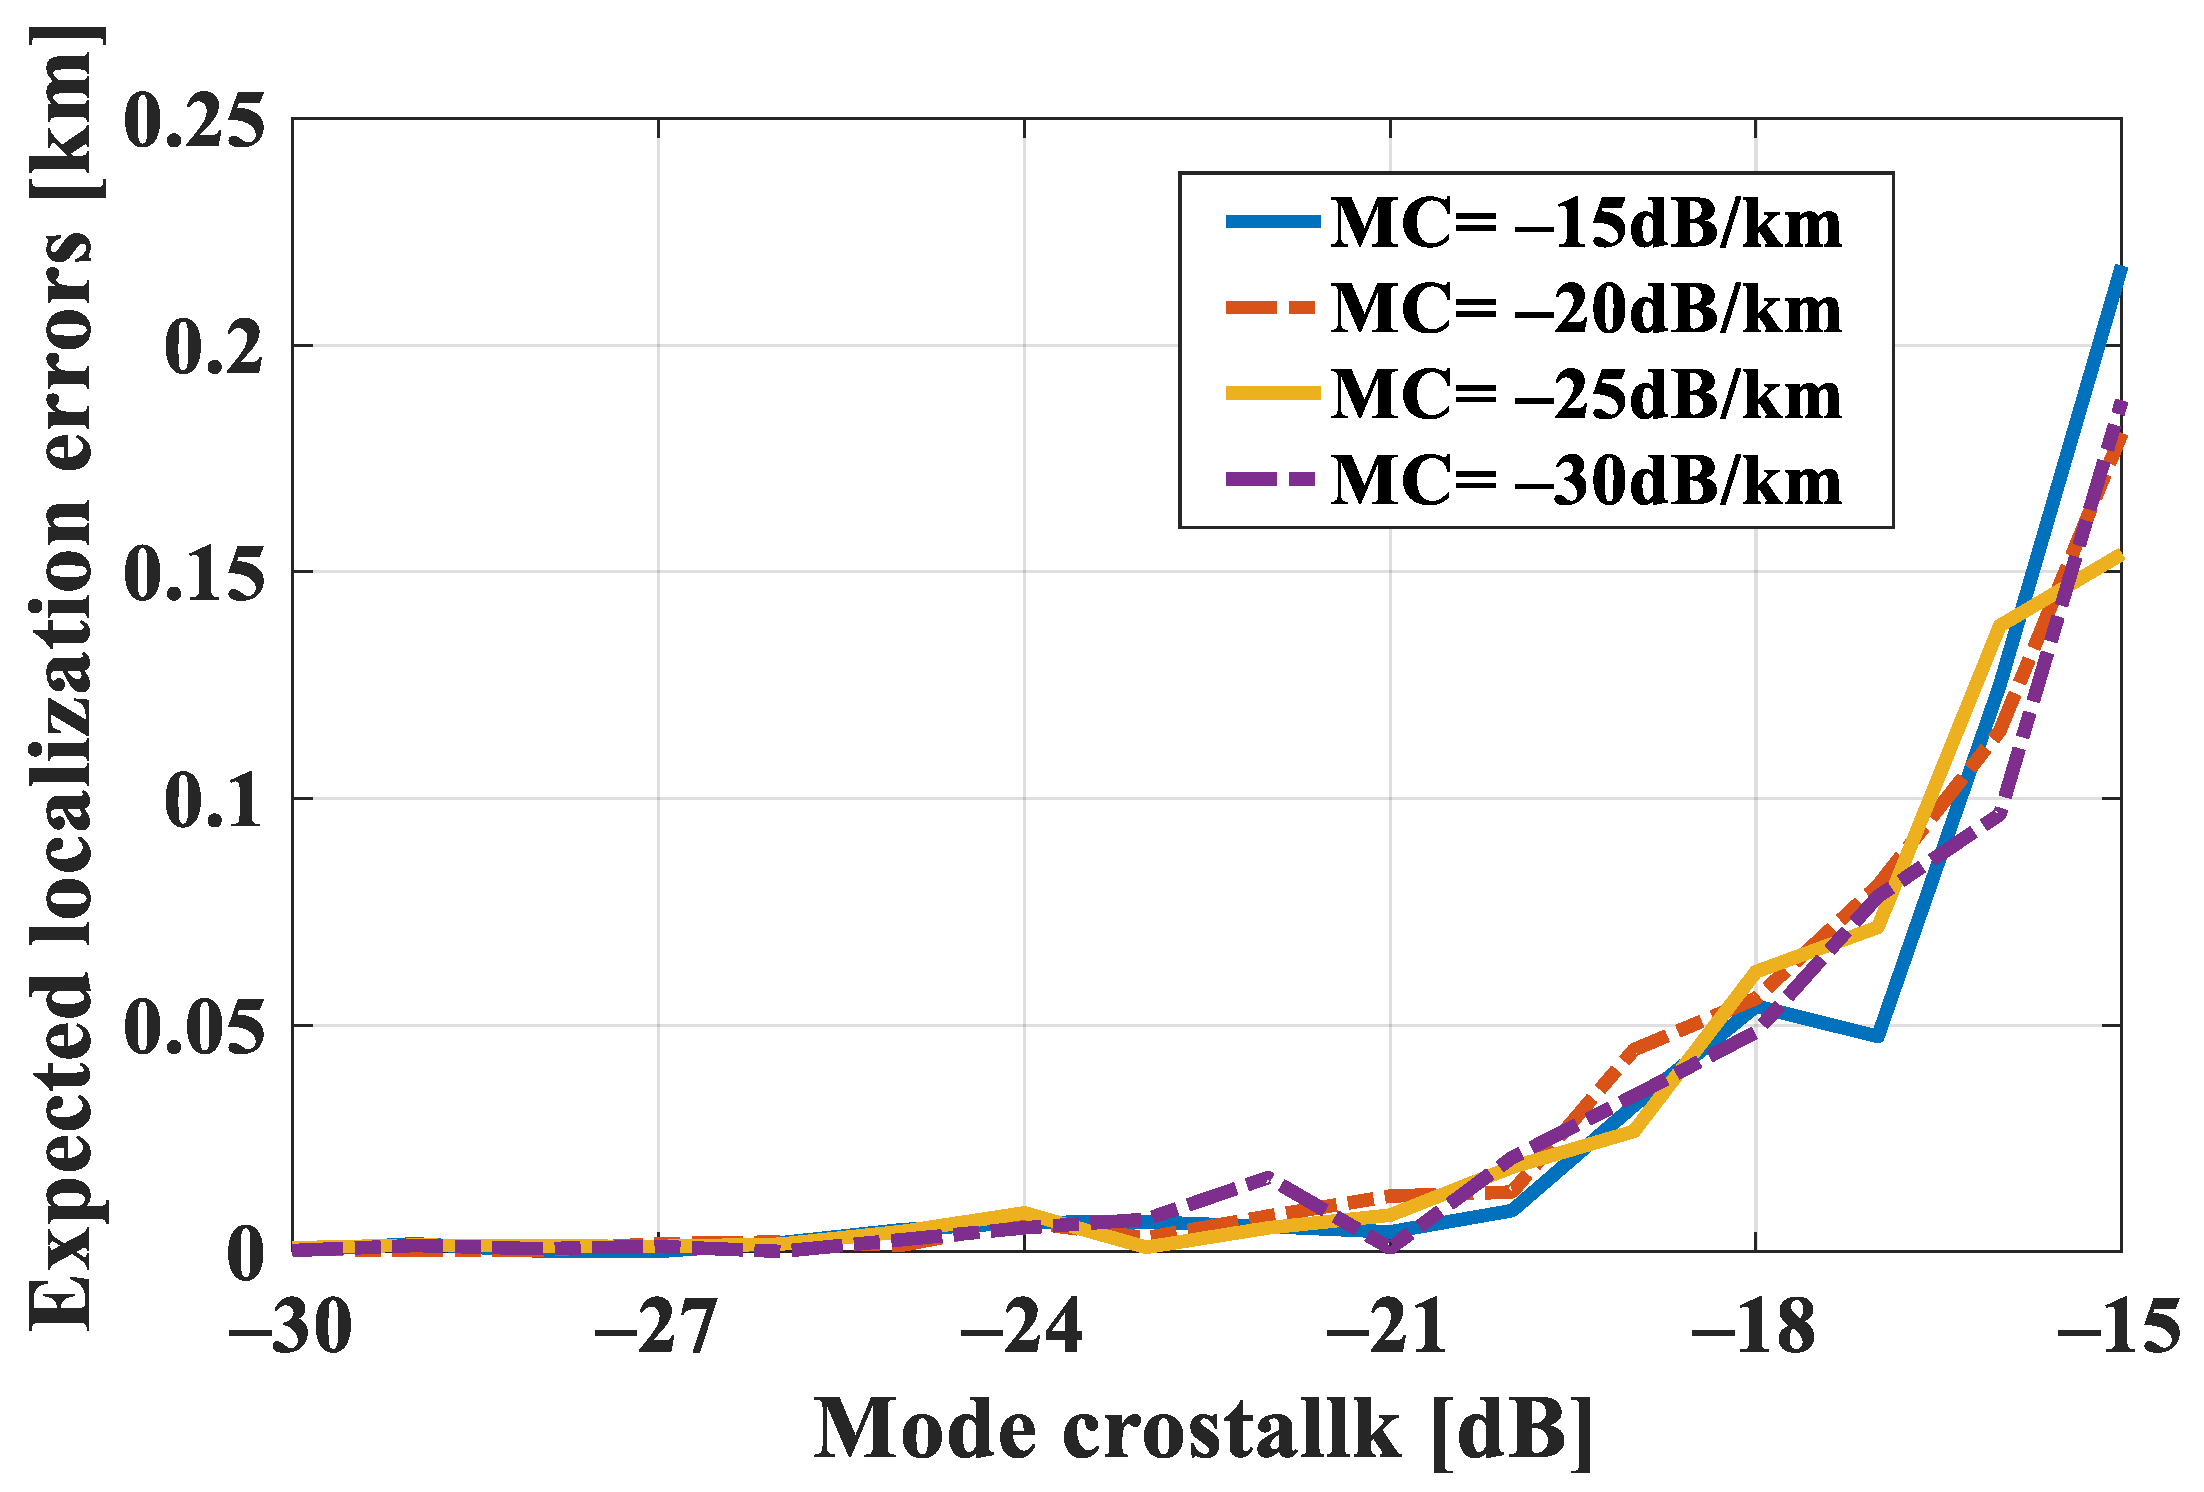
4.3. Error Analysis of Few-Mode Fiber Bending

As shown in Figure 7 and Figure 8, as the fiber length increases, the localization accuracy degrades in synchronization. When the fault is located at 12.5 km, the localization error of the combination of all the mode combinations is not greater than 0.2 m. When the mode crosstalk is introduced into the FMF bending system, the localization errors of different combinations are 22.42 m, 3.29 m, 2610.70 m, 58.32 m, 10147.11 m, and 7010.38 m, respectively, as shown in Figure 14. The mode combination LP11 and LP21 has the smallest mode crosstalk and lower localization error. With the change of crosstalk between different mode combinations, the greater the crosstalk between modes, and the greater the localization error. Similarly, when mode coupling is introduced into the system, the localization errors of the mode combinations are 15.90 m, 2.28 m, 1090.20 m, 52.29 m, 8808.58 m, and 6187.35 m, respectively. The MC between LP01 and LP21 is minimal and also exhibits high localization accuracy. Therefore, selecting the mode combination LP01 and LP21 to locate FMF bending can obtain a good localization effect.
Similarly, for the FMF bending, the impact of the crosstalk and MC on the fault detection precision is analyzed. Similar to the conclusion of connector mismatch and FMF break, when the mode crosstalk is large, it will have a certain impact on the fault accuracy, and the result is shown in Figure 15.
Through the analysis of the above various fault types, for FMF break, connector mismatches, and bending, the mode combination LP01 and LP21 provides a positioning accuracy of 3.42 m, 1.97 m, and 3.29 m, respectively. It can be seen that mode crosstalk has a larger impact on position accuracy, and the greater the crosstalk between the selected mode groups, the greater the impact on position accuracy. Meanwhile, the results show that crosstalk has a more significant impact on the accuracy of fault localization than mode coupling. The location and quantification of fault are based on the Rayleigh backscattering power, so mode crosstalk has a greater impact on fault localization accuracy. It is necessary to select a reasonable mode group for fault detection.

5. Further Discussion and Conclusions

Table 4 summarizes the comparison between OTDR and Long-Reach MDM Transmission fault detection techniques based on MM-TRA. Although OTDR technology has the potential of comprehensive and convenient monitoring of Long-Reach MDM Transmission, it mainly realizes fault characterization by measuring the Rayleigh backscattering distribution of LP01 mode. In fact, the loss characteristics of the LP01 mode are quite different from those of the high-order spatial mode. The LP01 mode measured by OTDR shows no fault, which does not mean that there is no fault in the high-order mode. So, the OTDR technology is inaccurate and incomplete in the characterization of multi-mode FMF link faults [19]. The proposed MM-TRA scheme based can realize high-sensitivity detection by introducing a high order mode detection dimension, and the fault characterization accuracy is effectively improved.
The OTDR averaging process requires a relatively long measurement time, while MM-TRA significantly reduces the measurement time (e.g., 1~2 s for MM-TRA compared to more than 1 min for OTDR). For example, the single measurement time is 1 millisecond for a 100 km optical fiber link, the average number is 216, and the measurement time is no less than 1 min. Especially for long distance and high-precision measurement, the average number is greater and the measurement time will be longer. For the proposed scheme in this paper, the measurement dynamic range is improved by increasing the input power injected into different spatial modes. At the same time, it can improve the dynamic range without affecting the spatial resolution. This method requires a double-ended measurement. The OTDR has advantages in single-ended measurement and dynamic range (e.g., the dynamic range of Yokogawa OTDR is about 50 dB), but the dynamic range and spatial resolution are not compatible. The proposed method has a higher spatial resolution compared with OTDR, except in the presence of sub-optimal monitoring combinations modes (e.g., the combinations of LP21 and LP02 mode for FMF break event) where a low resolution (61.5 m) can be obtained. At the same time, the use of the non-modulated continuous light and a simple power meter in the MM-TRA scheme can make the whole fault detection scheme simple and achieve cost savings, making it a very competitive practical solution in the field of optical communication networks.

6. Conclusions

This paper proposes a fault detection technology based on MM-TRA, which can realize fault detection and location for FMF links only by measuring the transmitted, reflecting, and backscattering power of different modes. This method does not need to modulate the light source, only needs to inject continuous light waves into the corresponding spatial mode of the FMF, which makes the entire detection system simple. The ability of the proposed method to locate various faults, such as FMF break, connector mismatch, and bending along FMF link is theoretically analyzed and validated. In addition, the effects of mode crosstalk and mode coupling on fault localization accuracy are introduced, respectively. The results show that the fault accuracy of the mode combination LP01 and LP21 is the best. It should be noted that the fault localization accuracy of the MM-TRA method can be optimized by choosing an appropriate combination of spatial modes. The proposed method in this paper is of great significance to accelerate the construction and application of MDM based on FMF transmission.

Author Contributions

Conceptualization, methodology, and writing—original draft preparation, F.L.; formal analysis, investigation, and resources, Z.H., software, and validation, T.G. All authors have read and agreed to the published version of the manuscript.

Funding

This work was supported in part by the National Natural Science Foundation of China under Grant No. 62105246, Zhejiang Provincial Natural Science Foundation of China under Grant No. LY23F050003.

Institutional Review Board Statement

Not applicable.

Informed Consent Statement

Not applicable.

Data Availability Statement

Data is contained within the article.

Conflicts of Interest

The authors declare no conflicts of interest.

References

  1. Rademacher, G.; Puttnam, B.J.; Luís, R.S.; Sakaguchi, J.; Klaus, W.; Eriksson, T.A.; Awaji, Y.; Hayashi, T.; Nagashima, T.; Nakanishi, T.; et al. 10.66 Peta-Bit/s Transmission over a 38-Core-Three-Mode Fiber. In Proceedings of the Optical Fiber Communication Conference, San Diego, CA, USA, 8–12 March 2020; Optical Society of America: Washington, DC, USA, 2020. Th3H.1. [Google Scholar]
  2. Puttnam, B.J.; Rademacher, G.; Luís, R.S. Space-division multiplexing for optical fiber communications. Optica 2021, 8, 1186–1203. [Google Scholar] [CrossRef]
  3. Li, G.; Bai, N.; Zhao, N.; Xia, C. Space-division multiplexing: The next frontier in optical communication. Adv. Opt. Photonics 2014, 6, 413–487. [Google Scholar] [CrossRef]
  4. Winzer, P.J. Making spatial multiplexing a reality. Nat. Photonics 2014, 8, 345–348. [Google Scholar] [CrossRef]
  5. Zuo, M.; Ge, D.; Liu, J.; Gao, Y.; Shen, L.; Lan, X.; Chen, Z.; He, Y.; Li, J. Long-haul intermodal-MIMO-free MDM transmission based on a weakly coupled multiple-ring-core few-mode fiber. Opt. Express 2022, 30, 5868–5878. [Google Scholar] [CrossRef]
  6. Soma, D.; Beppu, S.; Yoshikane, N.; Tsuritani, T. High-Capacity Mode Division Multiplexing Transmission Technology. In Proceedings of the Optical Fiber Communication Conference, San Diego, CA, USA, 6–10 March 2022; Optical Society of America: Washington, DC, USA, 2022. M4B.2. [Google Scholar]
  7. Zhang, M.; Wang, Y. Review on Chaotic Lasers and Measurement Applications. J. Light. Technol. 2021, 39, 3711–3723. [Google Scholar] [CrossRef]
  8. Lu, L.; Song, Y.; Zhang, X.; Zhu, F. Frequency division multiplexing OTDR with fast signal processing. Opt. Laser Technol. 2012, 44, 2206–2209. [Google Scholar] [CrossRef]
  9. Li, B.; Deng, G.; Zhang, R.; Ou, Z.; Zhou, H.; Ling, Y.; Wang, Y.; Wang, Y.; Qiu, K.; Song, H.; et al. High Dynamic Range Externally Time-Gated Photon Counting Optical Time-Domain Reflectometry. J. Light. Technol. 2019, 37, 5899–5906. [Google Scholar] [CrossRef]
  10. Liao, R.L.; Tang, M.; Zhao, C.; Wu, H.; Fu, S.N.; Liu, D.M.; Shum, P.P. Harnessing oversampling in correlation-coded OTDR. Opt. Express 2019, 27, 1693–1705. [Google Scholar] [CrossRef]
  11. Wang, S.; Fan, X.Y.; He, Z.Y. Ultra-high resolution Optical Reflectometry based on Linear Optical Sampling Technique with Digital Dispersion Compensation. IEEE Photonics J. 2017, 9, 6804710. [Google Scholar] [CrossRef]
  12. Xiong, J.; Wang, Z.N.; Wu, Y.; Rao, Y.J. Single-Shot COTDR Using Sub-Chirped-Pulse Extraction Algorithm for Distributed Strain Sensing. J. Light. Technol. 2020, 38, 2028–2036. [Google Scholar] [CrossRef]
  13. Fernández, M.P.; Bulus Rossini, L.A.; Pascual, J.P.; Costanzo Caso, P.A. Enhanced fault characterization by using a conventional OTDR and DSP techniques. Opt. Express 2018, 26, 27127–27140. [Google Scholar] [CrossRef] [PubMed]
  14. Von Der Weid, J.P.; Souto, M.H.; Garcia, J.D.; Amaral, G.C. Adaptive Filter for Automatic Identification of Multiple Faults in a Noisy OTDR Profile. J. Light. Technol. 2016, 34, 3418–3424. [Google Scholar] [CrossRef]
  15. Nakazawa, M.; Yoshida, M.; Hirooka, T. Measurement of mode coupling distribution along a few-mode fiber using a synchronous multi-channel OTDR. Opt. Express 2014, 22, 31299–31309. [Google Scholar] [CrossRef]
  16. Badar, M.; Lu, P.; Buric, M.; Ohodnicki, P. Integrated Auxiliary Interferometer for Self-Correction of Nonlinear Tuning in Optical Frequency Domain Reflectometry. J. Light. Technol. 2020, 38, 6097–6103. [Google Scholar] [CrossRef]
  17. Zhang, Z.P.; Fan, X.Y.; Wu, M.S.; He, Z.Y. Phase-Noise-Compensated OFDR Realized Using Hardware-Adaptive Algorithm for Real-Time Processing. J. Light. Technol. 2019, 37, 2634–2640. [Google Scholar] [CrossRef]
  18. Abdelli, K.; Cho, J.Y.; Azendorf, F.; Griesser, H.; Tropschug, C.; Pachnicke, S. Machine-learning-based anomaly detection in optical fiber monitoring. J. Opt. Commun. Netw. 2022, 14, 365–375. [Google Scholar] [CrossRef]
  19. Cen, M.; Chen, J.J.; Moeyaert, V.; Megret, P.; Wuilpart, M. Advanced Fault-Monitoring Scheme for Ring-Based Long-Reach Optical Access Networks. J. Light. Technol. 2017, 35, 1876–1885. [Google Scholar] [CrossRef]
  20. Song, C.; Liu, X.; Liu, F.; Zhang, M.; Hu, G. Fault detection of few-mode fiber based on high-order mode with high fault detection sensitivity. Opt. Lett. 2019, 44, 4487–4490. [Google Scholar] [CrossRef]
  21. Liu, F.; Zhang, W.; Wu, P.; He, Z. Fault detection sensitivity enhancement based on high-order spatial mode trend filtering for few-mode fiber link. Opt. Express 2021, 29, 5226–5235. [Google Scholar] [CrossRef]
  22. Yu, D.; Fu, S.; Cao, Z.; Tang, M.; Liu, D.; Giles, I.; Koonen, T.; Okonkwo, C. Mode-dependent characterization of photonic lanterns. Opt. Lett. 2016, 41, 2302–2305. [Google Scholar] [CrossRef]
  23. Liu, F.; Hu, G.; Song, C.; Chen, W.; Chen, C.; Chen, J. Simultaneous measurement of mode dependent loss and mode coupling in few mode fibers by analyzing the Rayleigh backscattering amplitudes. Appl. Opt. 2018, 57, 8894–8902. [Google Scholar] [CrossRef] [PubMed]
  24. Boffi, P.; Sambo, N.; Martell, P.; Parolari, P.; Gatto, A.; Cugini, F.; Castoldi, P. Mode-Group Division Multiplexing: Transmission, Node Architecture, and Provisioning. J. Light. Technol. 2022, 40, 2378–2389. [Google Scholar] [CrossRef]
  25. Cen, M.; Chen, J.J.; Moeyaert, V.; Megret, P.; Wuilpart, M. Full monitoring for long-reach TWDM passive optical networks. Opt. Express 2016, 24, 15782–15797. [Google Scholar] [CrossRef] [PubMed]
Figure 1. Definition of transmitted power P T and backscattering/reflecting power P B .
Photonics 11 00523 g001
Figure 2. The experimental schematic diagram of the MM-TRA technique system.
Photonics 11 00523 g002
Figure 3. The distribution of expected localization errors when a break event occurs at different positions in an FMF link.
Photonics 11 00523 g003
Figure 4. The distribution of expected localization errors when a fiber break occurs at positions L / 2 .
Photonics 11 00523 g004
Figure 5. Expected localization errors as a function of R L for connector mismatch event occur at 10 km. (a) Mode combination LP01 and LP11, LP01 and LP21, (b) Mode combination LP01 and LP02, LP11 and LP21, (c) Mode combination LP11 and LP02, LP21 and LP02.
Photonics 11 00523 g005
Figure 6. Calculated R i for different R L when connector mismatch occurs at different locations. (a) R 1 and R 2 , (b) R 1 and R 3 , (c) R 1 and R 4 , (d) R 2 and R 3 , (e) R 2 and R 4 , and (f) R 3 and R 4 .
Photonics 11 00523 g006aPhotonics 11 00523 g006b
Figure 7. The expected localization errors when fiber bending occurs at different positions.
Photonics 11 00523 g007
Figure 8. The distribution of expected errors when an FMF bending occurs at L / 2 .
Photonics 11 00523 g008
Figure 9. The localization errors as a function of insertion loss for six mode combinations.
Photonics 11 00523 g009
Figure 10. Error analysis of FMF break.
Photonics 11 00523 g010
Figure 11. The location accuracy of break fault with different mode crosstalk in MUX and DEMUX and mode coupling in FMF.
Photonics 11 00523 g011
Figure 12. Error analysis of FMF link connector mismatch.
Photonics 11 00523 g012
Figure 13. The influence of MC and mode crosstalk on the location accuracy of FMF link connector mismatch.
Photonics 11 00523 g013
Figure 14. Error analysis of FMF bending.
Photonics 11 00523 g014
Figure 15. The influence of mode coupling and mode crosstalk on the location accuracy of FMF bending.
Photonics 11 00523 g015
Table 1. Parameters of the analytical model [19].
Parameters α s D I R R L i s o L I L c i r ( 12 ) I L c i r ( 23 )
Value0.169 dB/km60 dB65 dB50 km0.332 dB0.461 dB
Table 2. Insertion loss of MUX/DEMUX.
IL(dB)MUXDEMUX
Mode
LP015.4671.176
LP111.8721.686
LP213.1723.084
LP028.8944.390
Table 3. Mode crosstalk and mode coupling between modes in the device and FMF [23].
ModesMode Crosstalk [dB]Mode Coupling [dB/km]
LP01--LP11−18.85−23.43
LP01--LP21−27.91−26.43
LP01--LP02−24.94−20.21
LP11--LP21−17.18−19.44
LP11--LP02−19−21.31
LP21--LP02−20.81−18.64
Table 4. Comparison between the proposed MM-TRA method and the OTDR [20,25].
Our Proposed MethodOTDR
Detection sensitivityBetter than 0.1 dB by high-order modeInvalid detection by LP01
Spatial resolution (m)1~15 for most cases, 61.5 for events using LP21 and LP0210–30
Measure time1~2 s (100 km)>1 min (100 km)
Light sourceNon-modulation continuous light Modulated optical pulse
Dynamic rangeImproved by increasing the input power<50 dB
Multiple events detectionNoYes
Double-ended measurementYesNo
Disclaimer/Publisher’s Note: The statements, opinions and data contained in all publications are solely those of the individual author(s) and contributor(s) and not of MDPI and/or the editor(s). MDPI and/or the editor(s) disclaim responsibility for any injury to people or property resulting from any ideas, methods, instructions or products referred to in the content.

