Abstract
Due to the limitations of traditional geometric error measurement, the measurement accuracy of long-stroke geometric errors is generally not high and the operation is complicated. In response to the above situation, in this study, a geometric error measurement system is built with a laser beam as the reference line and 2D position sensitive detector as the photoelectric conversion device. The single measurement range is 40 m, and the measurement range is further expanded through the principle of segmented splicing. Using an ultra-long guide rail as the measurement object for straightness measurement, the experimental results are similar to those of a laser interferometer. The uncertainty analysis model was obtained through the analysis of quantity characteristics, and based on this, the variance synthesis theorem and probability distribution propagation principle were studied to form two uncertainty synthesis methods. The measurement evaluation results showed that the two methods were basically consistent. The work provided a reference method for the uncertainty evaluation of position-sensitive detector measurement systems in the future.
1. Introduction
Accurate measurement and management of geometric errors is crucial for ensuring the accuracy of mechanical processing, assembly quality, and product performance. This is particularly crucial in fields such as aerospace, precision instruments, and micro-machinery that require extremely high precision. Although traditional measurement tools such as laser interferometers and coordinate-measuring machines have high measurement accuracy, they still face some challenges, such as high equipment costs, low measurement efficiency, sensitivity to environmental conditions, and measurement range limitations. Given these limitations, it is particularly important to develop a new type of geometric error measurement technology that is cost-effective and can overcome these drawbacks.
With the popularization of optical devices, many new geometric error measurement and detection methods have emerged. Position-sensitive detectors (PSDs), also known as coordinate photocells, are widely used in geometric error measurement due to their high accuracy, sensitivity, fast response, and ease of integration with other systems. Zhang Xiulei built a Lissajous trajectory-testing platform based on oscilloscopes and PSDs [1]; Gao Yue and others utilized a combination of three two-dimensional PSDs to achieve the measurement of displacement and angle in six degrees of freedom of spatial relative motion [2]; Zhao Wenhe and his team, addressing the challenge of flexible support and parallel support platforms between some moving bodies and bases without a definite axis of rotation, proposed a non-contact three-axis angle measurement scheme based on dual two-dimensional PSDs [3]; Chen Gao proposed a non-contact coaxiality measurement system based on laser collimation for the coaxiality measurement problem of large span and small holes. This system, centered around laser displacement sensors and integrated with a PSD, addresses the measurement challenges effectively [4]; Yu-Ta Chen utilized a PSD along with other optical modules in an integrated design and validated a measurement system that concurrently measures the six-degree-of-freedom geometric errors of machine tools. This innovative measurement system is cost-effective and versatile in its functionality [5]; B. Fan proposed the use of a dual-optical path photoelasticimeter incorporating diffraction gratings and multiple PSDs for the real-time measurement of surface deformation [6].
By analyzing the current research situation, many geometric error measurements have applied PSDs. Although they have achieved measurement goals, they are only limited to small-scale measurements and have not developed towards long-distance geometric error measurements, which greatly limits the application scenarios of PSDs. Moreover, the above-mentioned scholars only focus on how to complete measurement tasks, neglecting the evaluation of measurement uncertainty, and providing incomplete measurement results, which also limits the application of PSD-based geometric error measurement systems in the field of metrology. Therefore, how to extend PSDs to long-distance geometric error measurement and uncertainty assessment has become an urgent problem to be solved.
Based on the above issues, this article proposes and designs a long-distance geometric error measurement system using a two-dimensional PSD and semiconductor laser emitters. The single measurement range can reach 40 m and the measurement range can be further expanded through the principle of segmented splicing. Unlike traditional measurement methods, the measurement system studied can simultaneously measure the straightness in both horizontal and vertical directions, and supports disconnection and reconnection, achieving separate long-distance geometric error measurement. In order to verify the reliability of the measurement system, taking the straightness measurement of a 45 m guide rail as an example, the main sources of system uncertainty were determined using the value statistics method. An uncertainty evaluation and analysis model was established, and uncertainty synthesis was carried out using the variance synthesis theorem and probability distribution propagation principle in GUM. By comparing the evaluation results, the usability of the system was verified, laying a foundation for future uncertainty evaluation of PSD-based measurement systems for specific measurement tasks using GUM.
2. Measuring Principle
2.1. Working Principle of Two-Dimensional PSD [7,8,9]
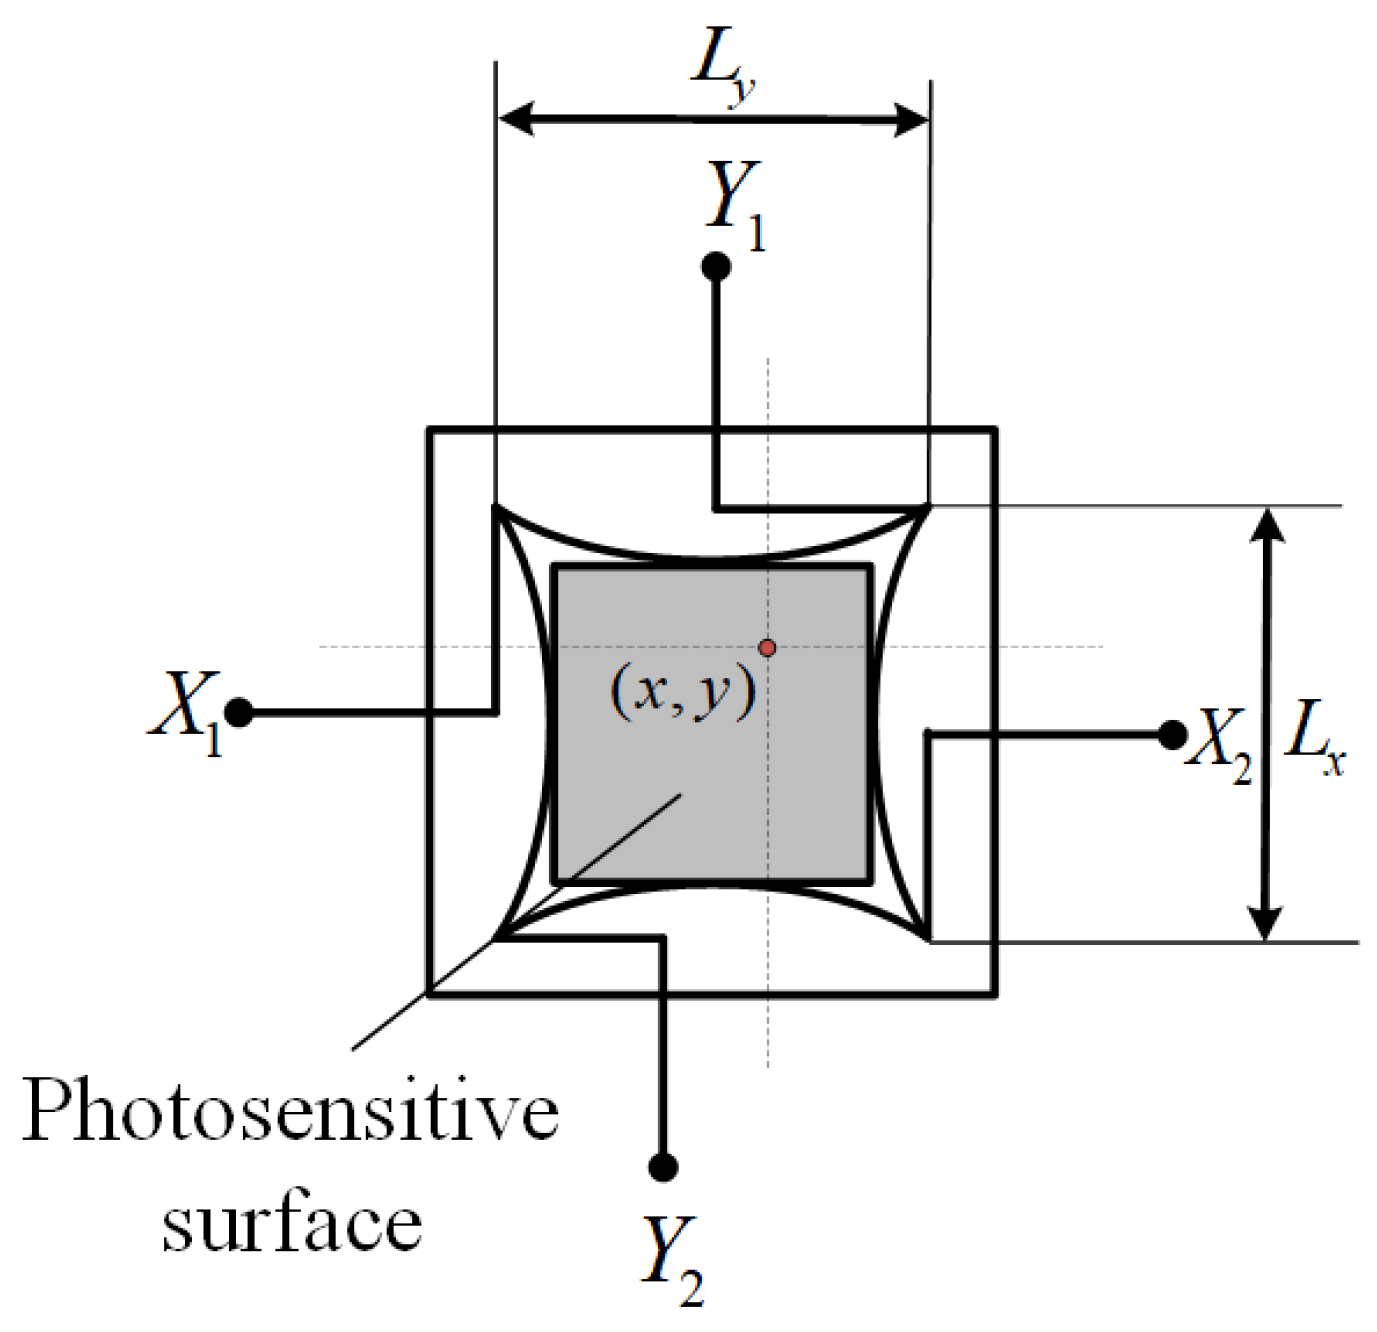
The schematic diagram of the two-dimensional pillow-shaped PSD is shown in Figure 1. When the light source illuminates the photosensitive surface of the PSD, the position of the light spot on the effective area experiences lateral photoelectric effects, creating a potential difference that generates corresponding photocurrents , , , and at the four electrodes labeled X1, X2, X3, and, X4, respectively.
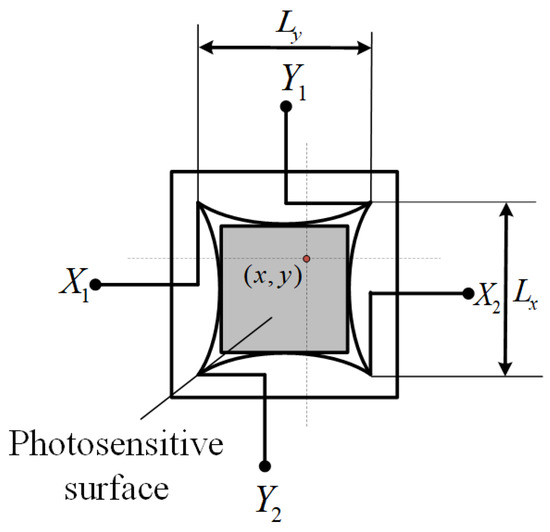
Figure 1.
PSD structure diagram.
The dimensions of the photosensitive surface of the PSD are represented by and . By collecting the photocurrent signals generated at the four electrodes, the position coordinates of the incident light source illuminating on the PSD’s photosensitive surface can be calculated. The photocurrent-to-position conversion formula is as follows:
2.2. Measurement of Geometric Errors Based on PSD Laser Collimation Principle [10,11]
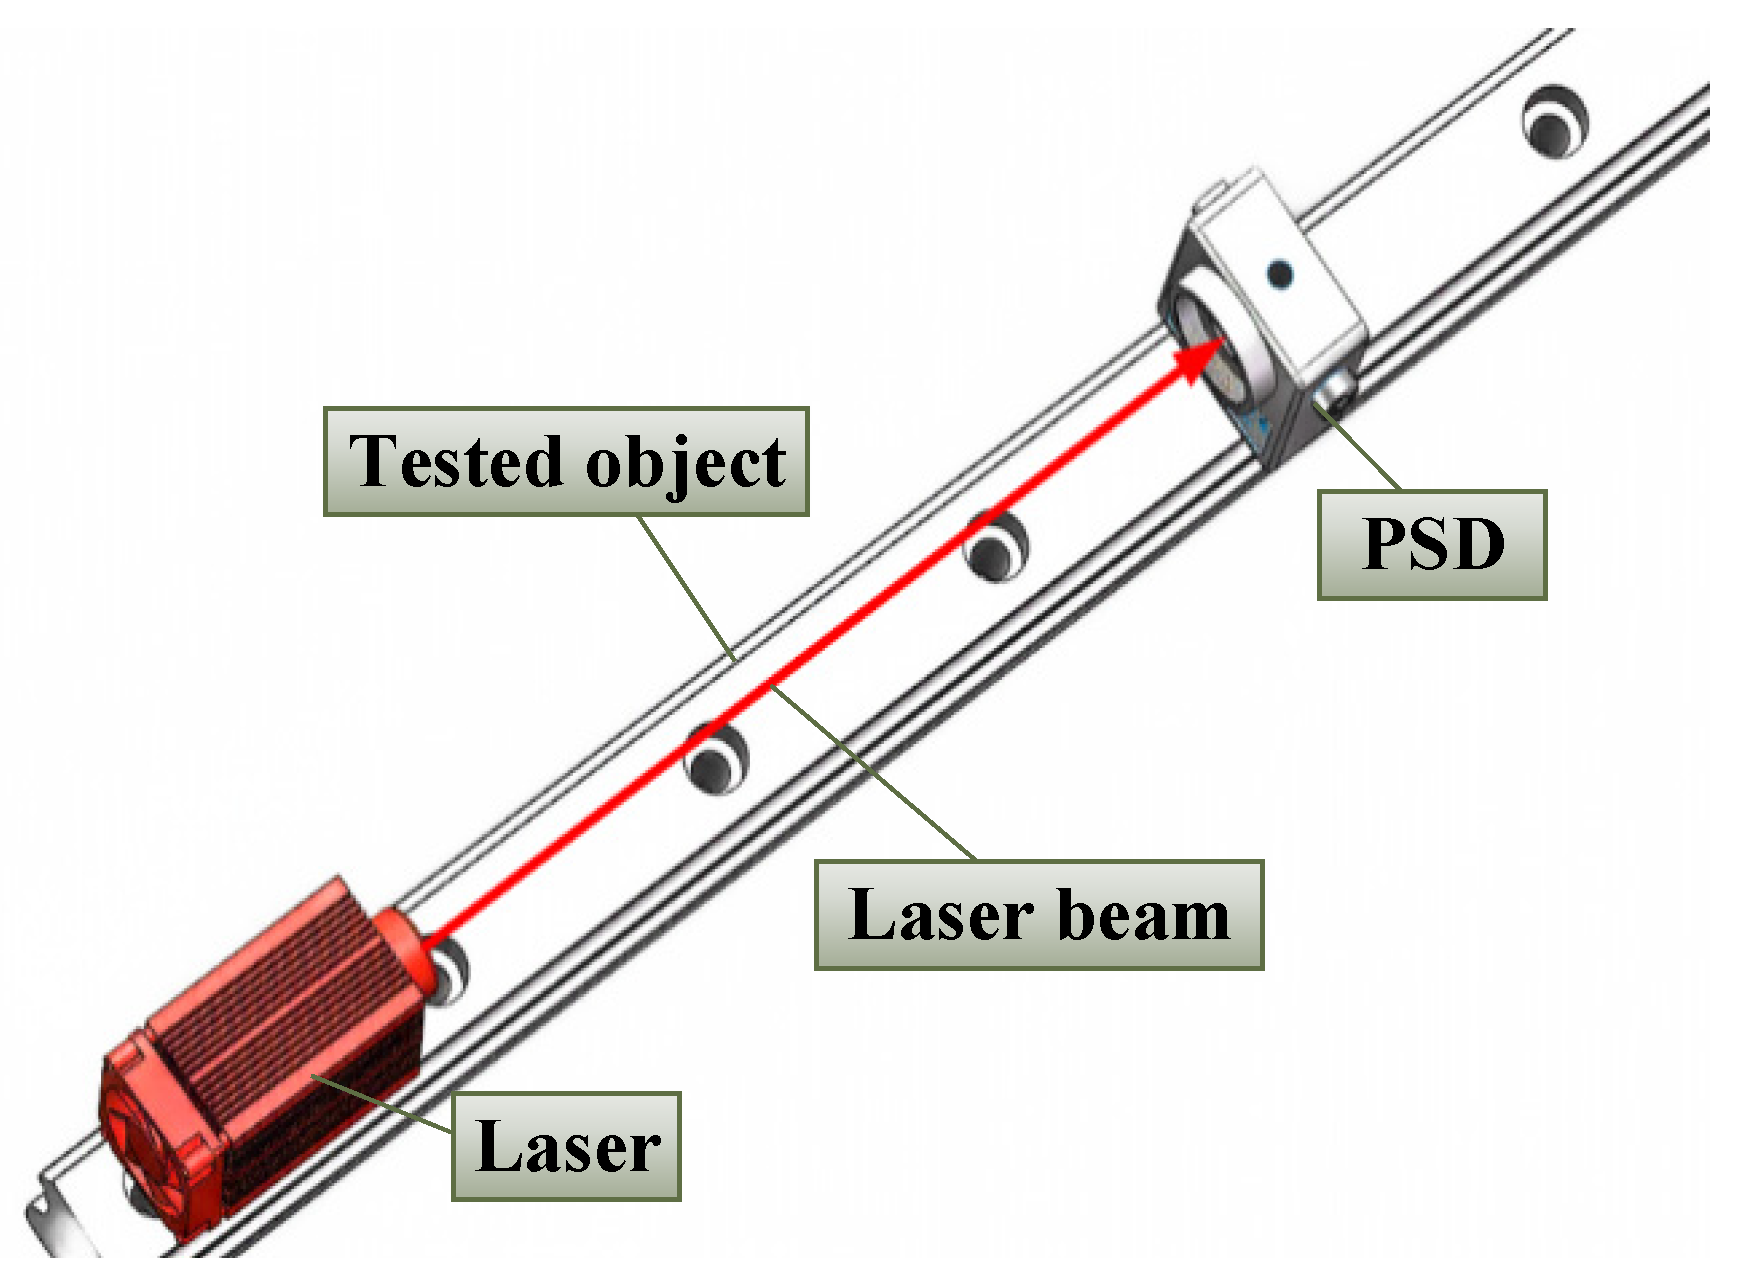
As shown in Figure 2, the basic principle of geometric error measurement based on PSD laser collimation is that the laser beam emitted by the laser is projected onto the photosensitive surface of the PSD, and the laser beam serves as the reference line for measurement. When the PSD moves on the surface of the measured object, the geometric error of the measured surface causes relative displacement between the laser beam and the photosensitive surface of the PSD, resulting in a change in the position of the light spot incident on the photosensitive surface. Based on the working principle of the PSD, accurate information on changes in spot position can be obtained.
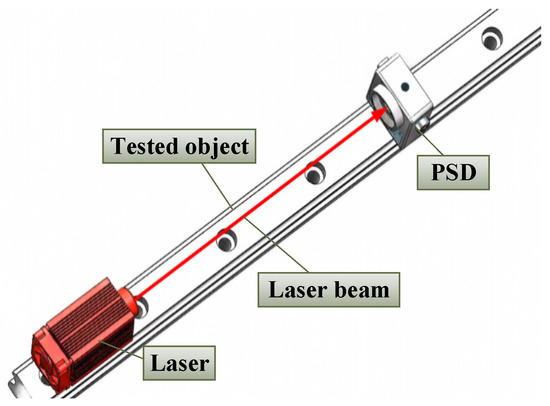
Figure 2.
Basic measurement principles.
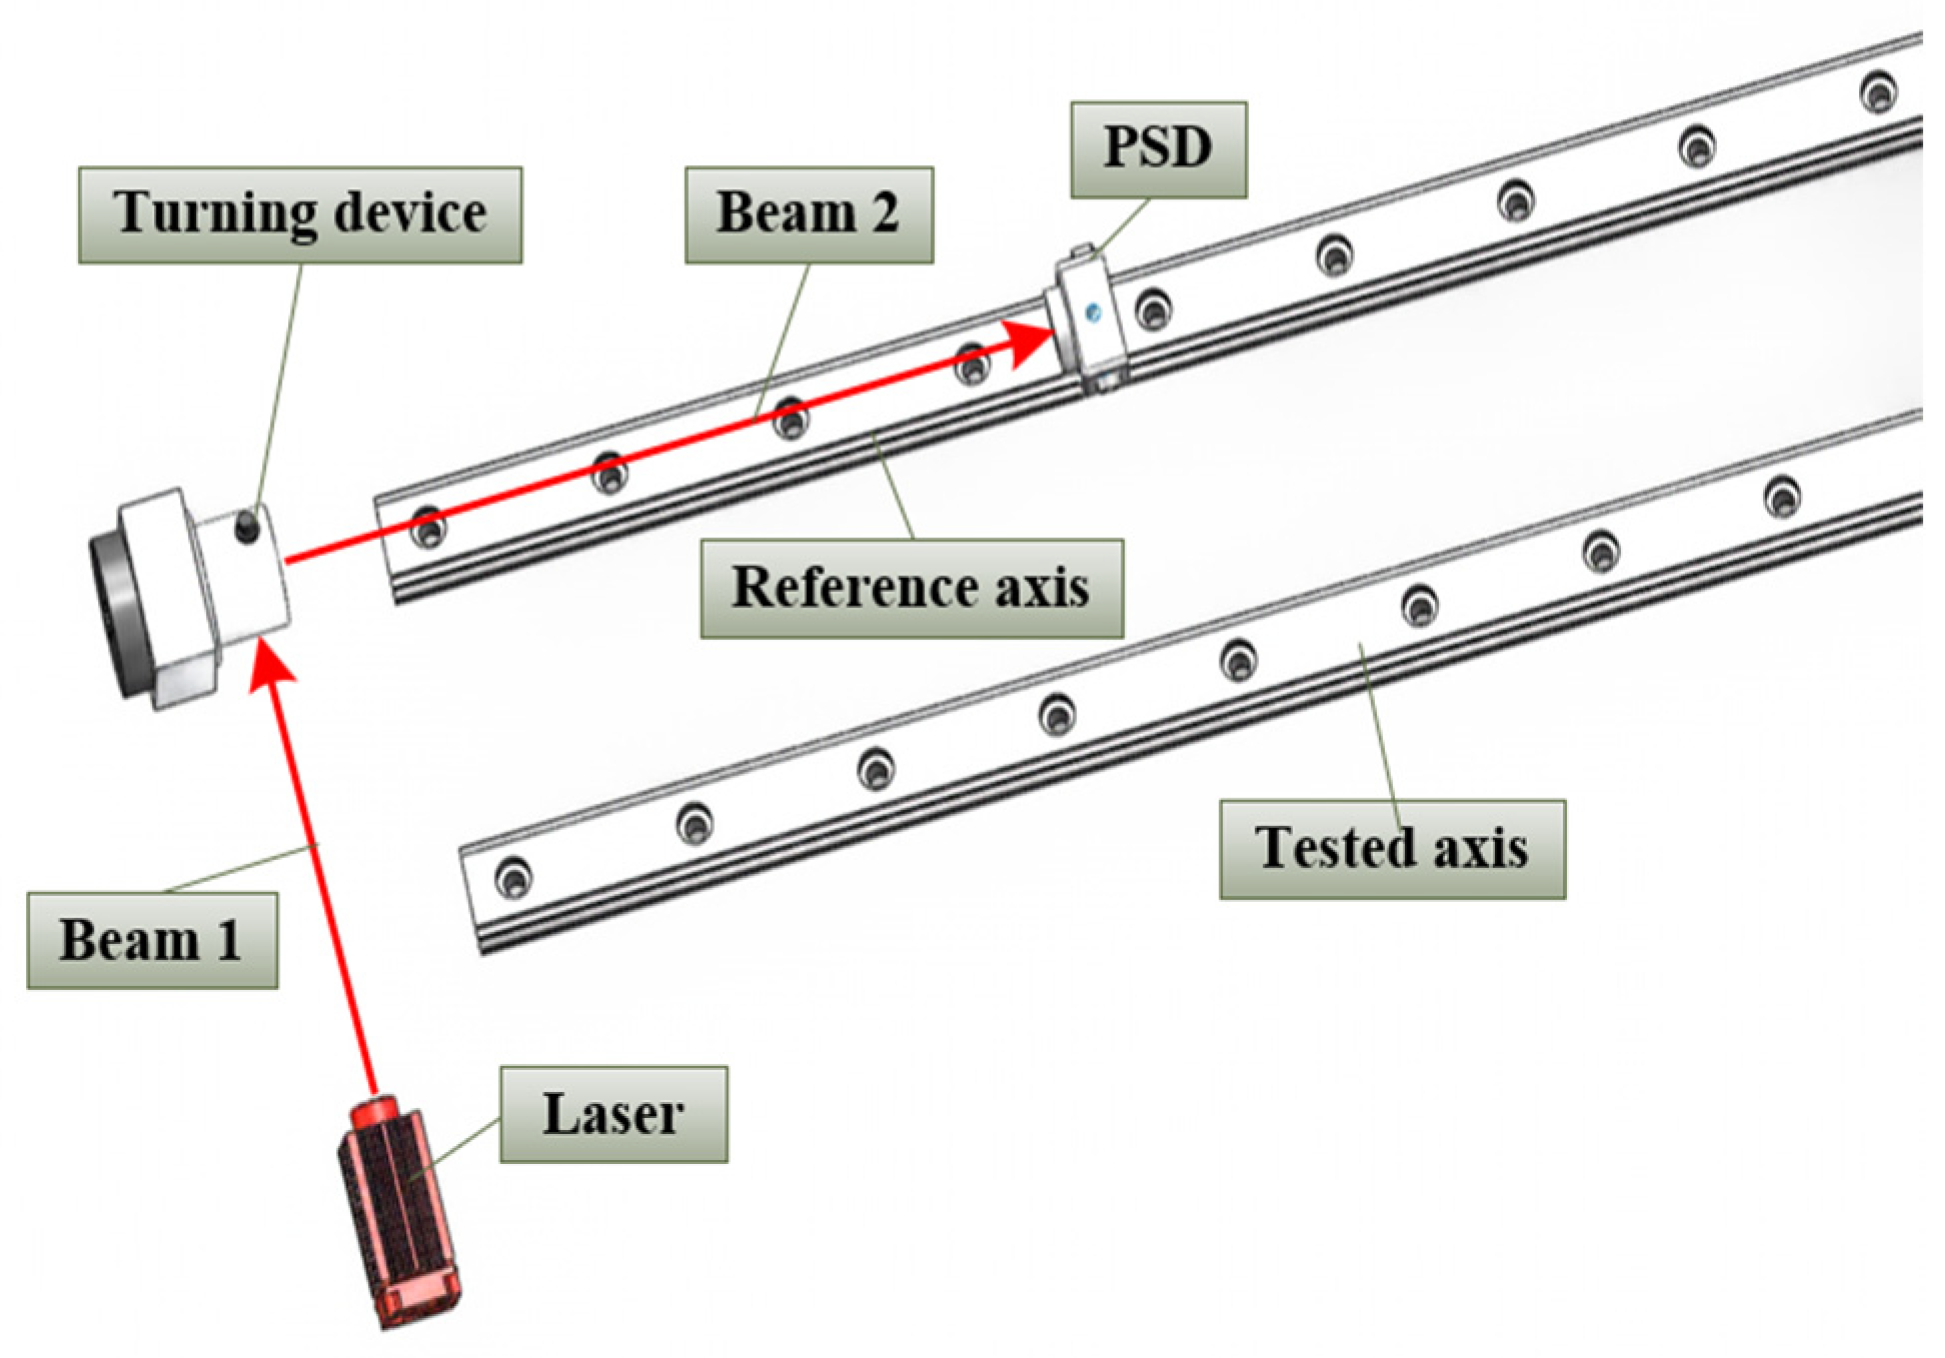
Based on the aforementioned measurement principle analysis, a measurement system can be designed to simultaneously measure geometric errors such as straightness, parallelism, and flatness. The specific implementation methods for straightness and parallelism are shown in Figure 3, with a similar approach for flatness.

Figure 3.
Principles of straightness and parallelism measurement.
Before measurement, a light beam deflection device containing a pentaprism is placed at the front end of the reference axis, and optical path adjustment is performed. The position of the laser emitter remains unchanged throughout the entire measurement phase. The laser emits a beam, which is reflected 90° by a pentaprism and is parallel to the reference axis. The position detection device is moved to complete the straightness measurement. For parallelism measurement, the process begins with repeating the measurement of the reference axis. Then, the beam turning device and the position-detection device are moved to the axis being measured, and the position-detection device is moved to complete the parallelism measurement.
2.3. Principle of Segmented Splicing
For long-travel measurement objects that exceed the measuring range of a PSD, it is necessary to divide the object into multiple measurement segments based on the actual interruptions of the object being measured. Taking an ultra-long guide rail as an example, there are overlapping measurement areas between adjacent segments. The adjacent segments of the ultra-long guide rail are divided into two sections, referred to as segment and segment , as shown in Figure 4. The overlapping area should not be less than 20% of the length of the measurement segment it is a part of, and both segments and should maintain a consistent measurement step within the overlapping area . Coordinate system is established at the starting position of the long guide rail measurement, and coordinate system is established at the joint position. In these systems, the -axis direction coincides with the direction of the guide rail’s motion axis. The -axis is used to measure horizontal straightness, while the -axis measures vertical straightness.
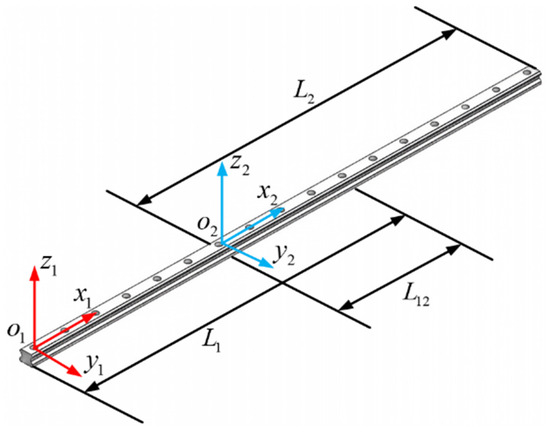
Figure 4.
Splicing principle.
Assuming that there are common measurement points between and within , the on between measurement point and measurement point in is as follows:
where α is the number of measurement points between coordinate system and coordinate system , and k should satisfy both 0 < k < m and 0 < k < n.
In the process of straightness stitching measurement, due to changes in the position of the PSD and the laser on the guide rail, there may be differences in the attitude between the actual coordinate system of and the ideal coordinate system . Therefore, the coordinate system is unified to the coordinate system through coordinate changes:
Simplified:
is defined as the rotation matrix, indicating that the coordinate system becomes parallel to the coordinate system after rotating through an angle about the y-axis and through an angle about the z-axis; is described as the translation matrix, indicating that the coordinate system coincides with the coordinate system after translating by along the y-axis and by along the z-axis.
Substituting and into Formula (5) yields the following:
The expansion formulas for each matrix are as follows:
Obtain the least squares solutions for angle , angle , displacement , and displacement from Equation (6):
By substituting the above solution into Equation (4), can be unified into the coordinate system. Finally, the results can be calculated based on all measurement points unified into and combined with the geometric error evaluation method.
3. Analysis and Modeling of Measurement Uncertainty [12,13,14]
3.1. Error Traceability Method
The uncertainty source analysis based on error source tracing is an effective integration of classical error theory and uncertainty theory. This approach enables the analysis of factors affecting measurement outcomes from various perspectives, including measurement devices, measurement methods, principles, measurement environments, measurement personnel, and the object being measured.
- (1)
- Measurement device
Due to the characteristics of the semiconductor materials, PSDs exhibit inherent non-linear errors that lead to discrepancies between the measured and actual positions. Additionally, mechanical machining errors in the PSD’s motion platform and power instability of the laser can also affect the measurement outcomes.
- (2)
- Measurement methods
(a) Optical path adjustment error
In actual measurement processes, the laser beam emitted by the laser is not parallel to the motion axis of the tested guide rail, making it difficult to serve as the required baseline for measurement. It is necessary to utilize the difference in readings from the PSD at the start and end of the tested workpiece, approximated to be zero, to establish a usable measurement baseline.
(b) Algorithm error
How the measurement system software calculates the position coordinates of the incident light point and the geometric error evaluation algorithm may also have an impact on the measurement results.
- (3)
- Measurement environments
Environmental factors such as air disturbances, background light interference, and temperature fluctuations can all impact the measurement accuracy of the PSD.
- (4)
- Measurement personnel
The influence of the measured object on the measurement results is mainly due to the inclination of the measured object and the optical properties of the surface. The tilt of the tested guide rail can cause the light beam to enter the PSD at an angle, resulting in measurement errors; if the tested guide rail is too bright, it will produce mirror reflection, causing interference from stray light.
- (5)
- Measurement personnel and sampling strategy
Possible sources of uncertainty mainly include the education level, experience, responsibility, cognition, and physical strength of the measurer. When selecting how many measurement points to use as evaluation factors, both too many and too few can also affect the measurement results.
Based on the analysis above, it is evident that there are numerous factors influencing the accuracy of measurement systems, most of which have complex and difficult-to-quantify relationships with the measurement outcomes. Moreover, when changing a measurement subject, a new analysis is required. Hence, the error traceability method proves challenging to implement effectively for specific measurement tasks.
3.2. Quantitative Characteristic Analysis Method
To avoid the complexities of error traceability analysis, the statistical characteristics of measurement results can be utilized to determine uncertainty components. The key indicators of the measurement system’s statistical characteristics include offset, linearity, stability, resolution, repeatability, and reproducibility. These indicators allow for a more thorough and comprehensive reflection of how various error sources influence the uncertainty of measurement outcomes.
(1) Offset and linearity
While offset and linearity are distinct accuracy indicators, both reflect the systematic errors of the measurement system itself. Therefore, when addressing specific measurement tasks, such as straightness, the impacts of both on the measurement results can be considered together. Generally, indicators reflecting the system’s detection capability, such as indicated error and maximum permissible error, are used to quantify the magnitude of uncertainty components introduced by offset and linearity.
(2) Uncertainty introduced by resolution and repeatability
Resolution reflects the measurement system’s ability to recognize small changes. Repeatability refers to the consistency of results obtained from multiple measurements of the same object under the same measurement conditions. Systems with high resolution often exhibit clear repeatability, while systems with low resolution may occasionally overlook the influence of repeatability. Therefore, in uncertainty evaluations, only the larger of the two factors is generally calculated.
(3) Uncertainty introduced by stability and reproducibility
Stability reflects the ability of a measurement system to maintain its metrological characteristics over time. Reproducibility refers to the consistency among measurement results for the same object when there are changes in measurement conditions, such as different operators, measurement methods, or measurement locations. Stability is crucial for the long-term reliability of measurement results, while reproducibility ensures that results are consistent across various conditions and is key for comparing results obtained from different scenarios or setups.
In conclusion, when using the constructed measurement system for measurements, the major sources of uncertainty affecting the measurement results include maximum allowable error, resolution, repeatability, reproducibility, beam drift during long-distance laser measurements, and errors in adjusting the optical path. Furthermore, given that long guideways are divided into relatively short segments through segmented splicing measurements, the impact of beam drift due to long-distance measurements can be neglected. Therefore, the uncertainty analysis model established based on the analysis of measurement value characteristics is as follows:
where is the best estimation of the measurement result, is the indication error of the system, is the error caused by resolution, is the repeatability error, is the reproducibility error, and is the error due to optical path adjustment.
Based on the above uncertainty analysis model, this article will take the measurement of ultra-long guide rails as an example, and evaluate the measurement uncertainty using the uncertainty synthesis method based on the variance synthesis theorem and the MCM uncertainty synthesis method based on the probability propagation principle, respectively.
4. Measurement Experiments and Evaluation of Measurement Uncertainty
4.1. Measurement Experiment on Straightness Splicing of Ultra-Long Guide Rails
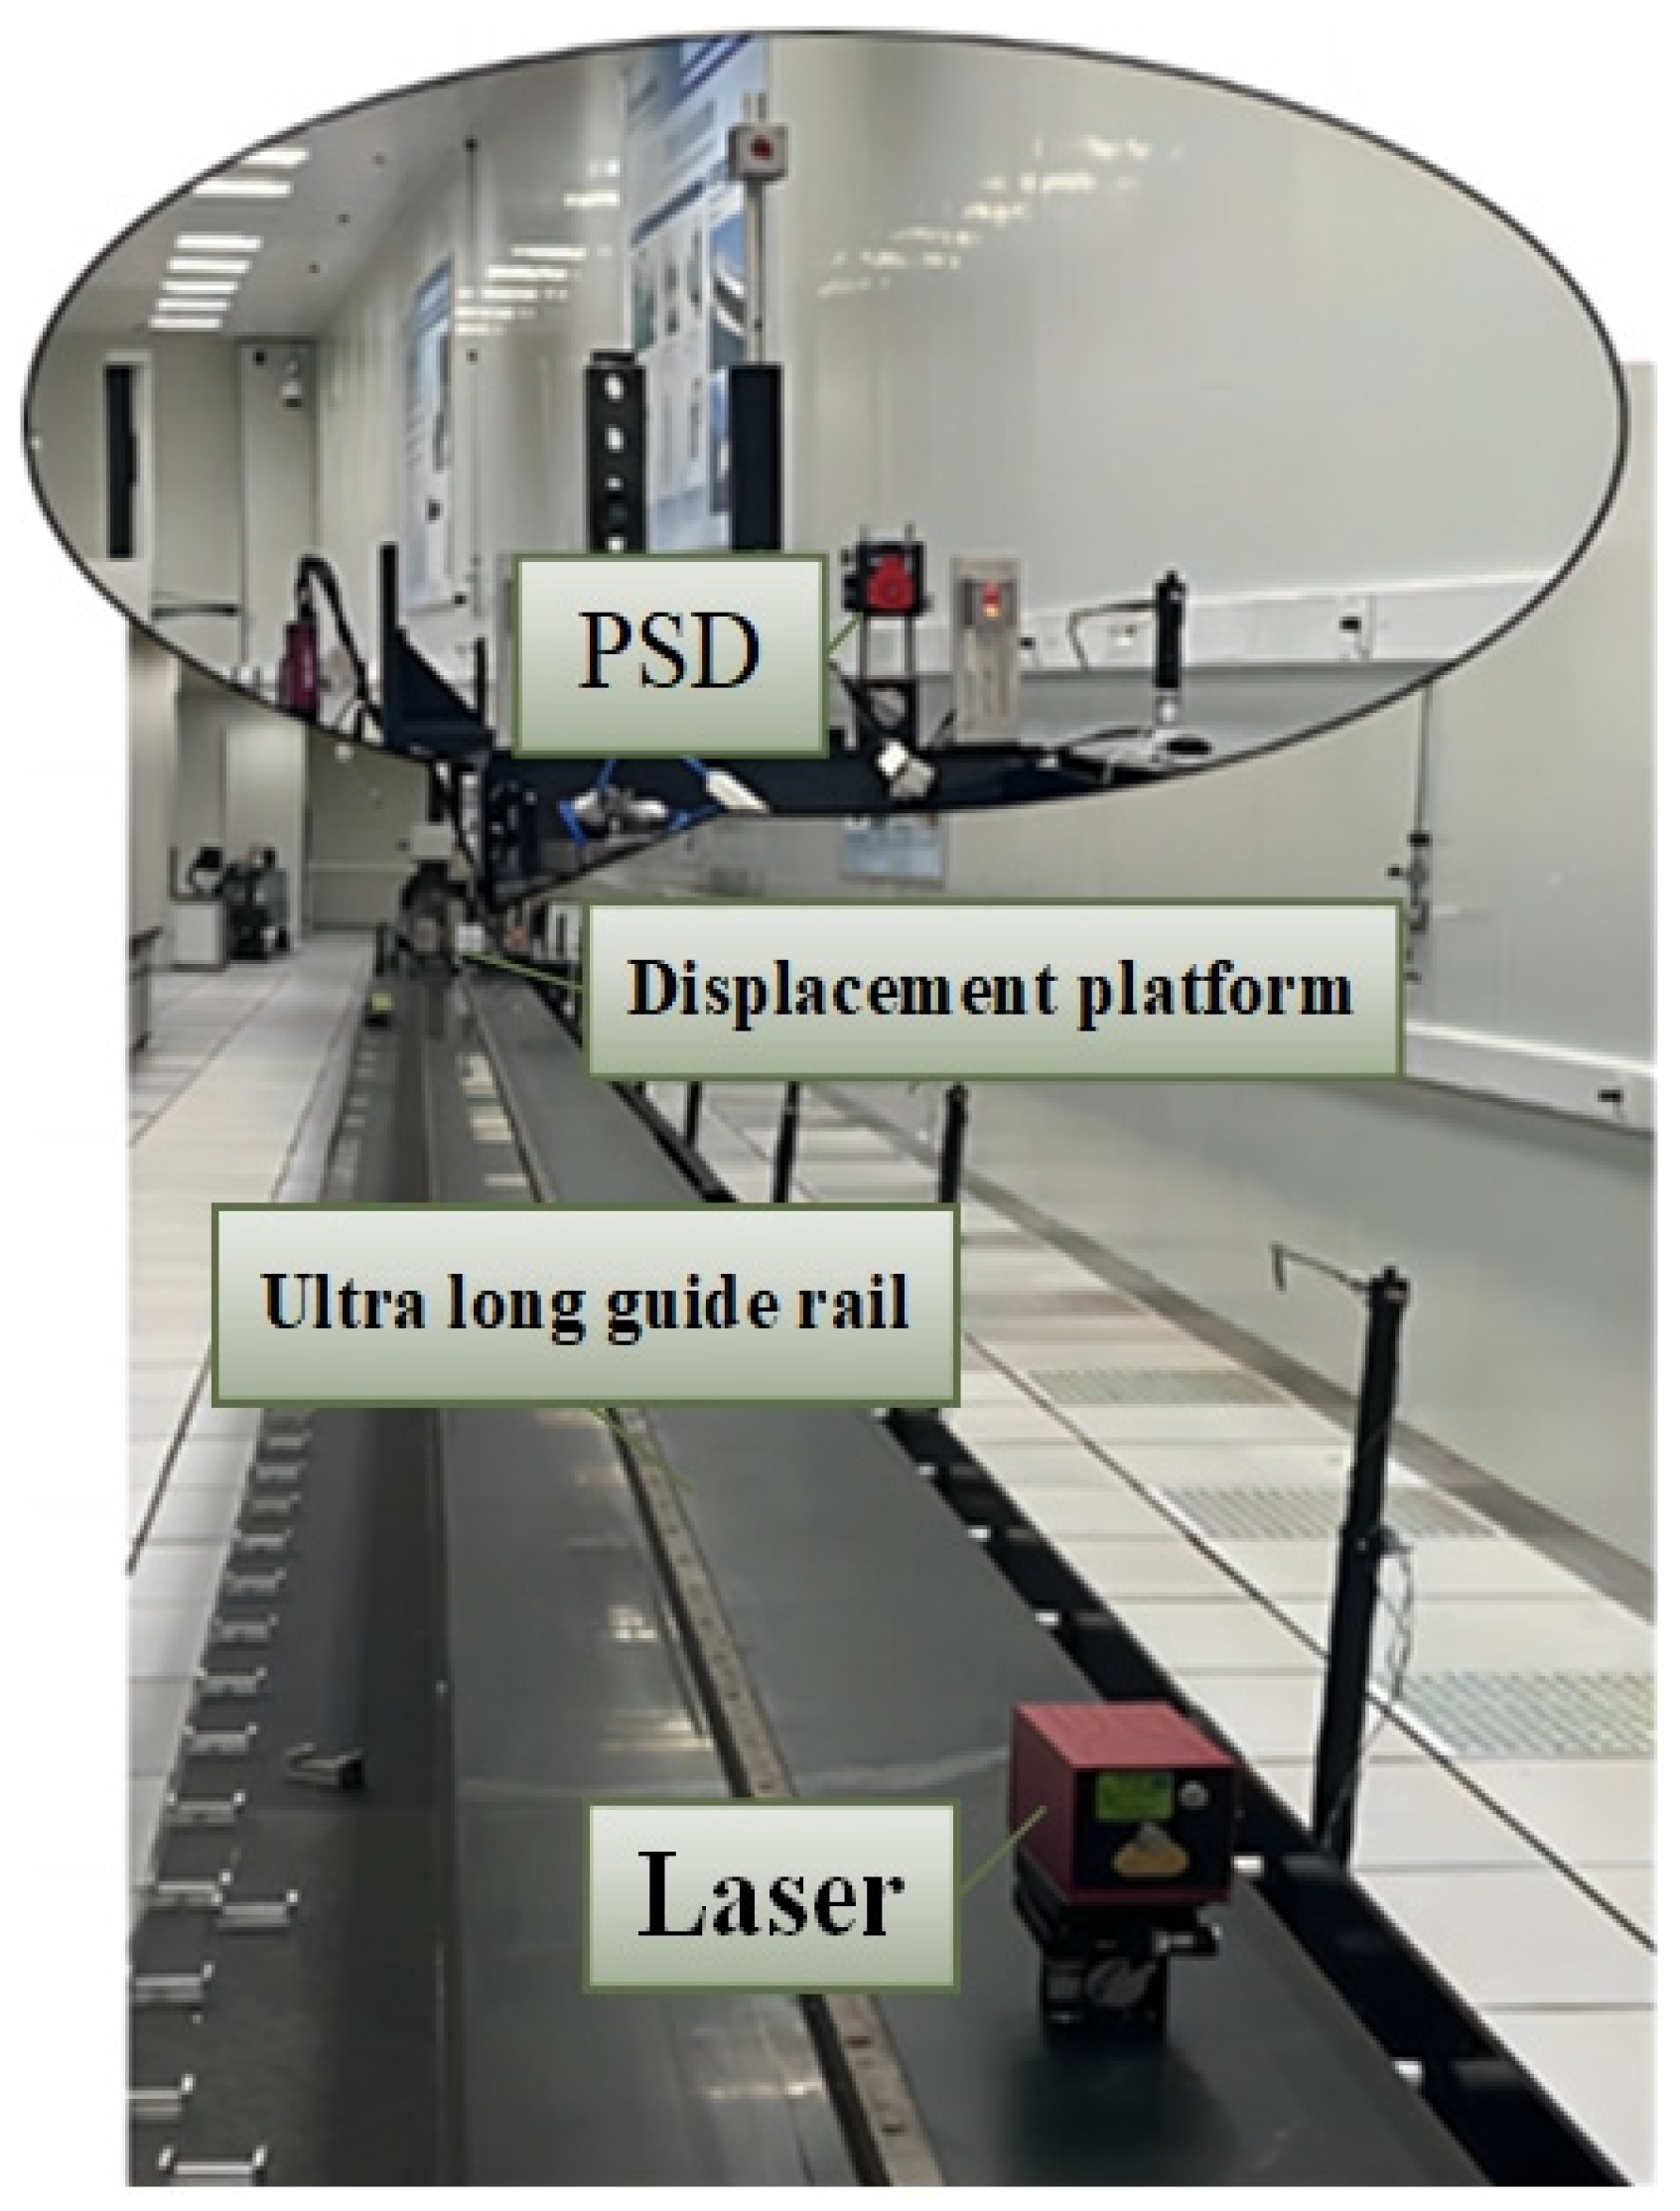
Using this system for horizontal straightness measurement, the measurement object is an ultra-long guide rail with a length of 45 m, as shown in Figure 5, and the measurement uncertainty evaluation is completed.
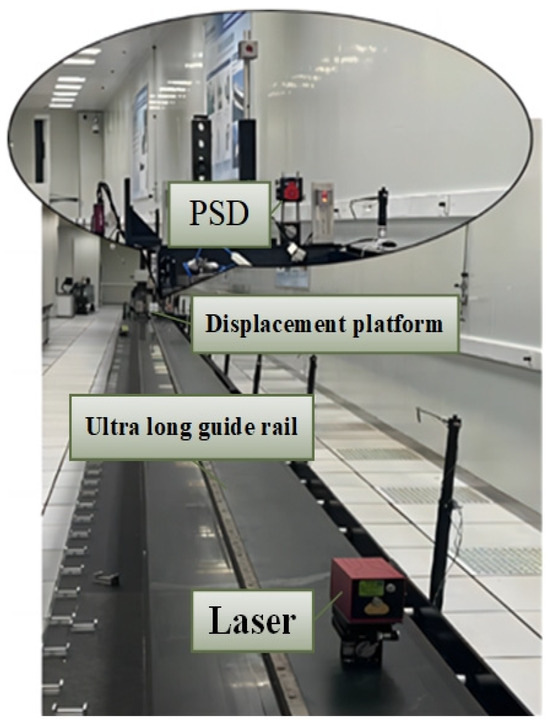
Figure 5.
Measurement experiment on ultra-long guide rail.
(1) Measurement benchmark construction
Before measurement, it is necessary to adjust the light to be parallel to the motion axis of the guideway, that is, to adjust the difference in the readings of the PSD at the two ends of the guideway to zero. The straight line determined by the two end points is used as the measurement baseline for the straightness of the guideway.
The schematic diagram of the optical path adjustment in the horizontal direction is illustrated in Figure 6, with a similar configuration in the vertical direction. The proximal end refers to the end closer to the laser source, while the distal end is the end farther from the laser source. Utilizing the principle of similar triangles, the required adjustment displacement at the proximal end is calculated. Subsequently, the PSD is moved to the distal end to adjust the laser’s angle, aiming to reduce the difference in readings between the two positions to zero. This process needs to be repeated, and in most cases, the adjustment can only approximate zero.
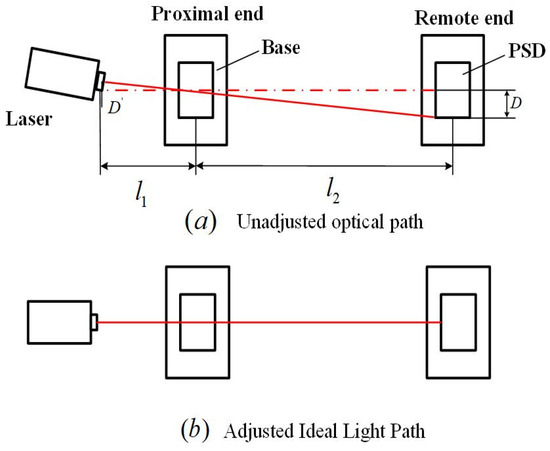
Figure 6.
Light path adjustment.
(2) Splicing process
Divide the ultra-long guide rail into three sections of 0–21 m, 12–33 m, and 33–45 m to complete the splicing experiment, with 10 splicing points for each section. Taking 0–21 m and 12–33 m as examples, the common measurement area is set at 12 to 21 m. Firstly, set the laser at the starting position and establish the beam reference line. Next, starting from 0 m and ending at 21 m, a total of 21 measurement points are selected every 1 m. These measurement points form an group and are sampled through the system. Afterwards, change the position of the laser, readjust the light source at on the guide rail, and establish a new beam reference line. Select 21 measurement points within a range of 12 to 33 m with a spacing of 1 m, and sample the measurement points for Group . The sampling of measurement points for Group is also carried out using this method. Finally, using the principle of splicing measurement and the least squares method, the straightness is calculated.
(3) Least squares method for evaluating straightness
Use the least squares method to fit the least squares centerline of the horizontal straightness , where represents the slope of the least squares line, and represents the intercept of the least squares line. The specific calculation formulas for parameters and are as follows:
The distance from coordinate point to the horizontal least squares centerline is the horizontal straightness error:
The final straightness is the following:
where is the maximum value of the horizontal straightness error, and is the minimum value of the horizontal straightness error.
4.2. Uncertainty Evaluation Based on Quantitative Statistical Method [15,16,17,18]
Using the measurement system and segmented splicing principle described in this article, 10 repeated experiments and reproducibility experiments with different measurement personnel were conducted on the straightness error of ultra-long guide rails. The specific measurement results of the repeatability experiment and reproducibility experiment are shown in Table 1 and Table 2, respectively.

Table 1.
Repetitive experimental data.
Table 2.
Reproducible experimental data.
4.2.1. Uncertainty Synthesis Based on the Variance Synthesis Theorem
The uncertainty evaluation process and quantification results of straightness measurement in this system are as follows:
(1) The uncertainty component introduced by the maximum allowable error
In the formula, is the maximum allowable error of the system, and after relevant metrological calibration, = (0.001 + 1% H) mm (H is the maximum change during the measurement process).
(2) The uncertainty components introduced by resolution and repeatability
The resolution of the PSD sensor is r = 0.0001 mm; hence, the uncertainty component introduced by the resolution is
When using the average of N measurement results as the best estimate, the uncertainty component introduced by repeatability is
In the formula, represents the i-th measurement result, represents the mean measurement result, and represents the number of measurements.
(3) The uncertainty component introduced by reproducibility
In the formula, represents the number of measurement groups, represents the new measurement column data, and represents the mean of .
(4) The uncertainty component introduced by the optical path adjustment error
The maximum optical path adjustment error in the experiment is taken, so the uncertainty component introduced by the optical path adjustment error is
(5) Composite uncertainty
Calculate the composite standard uncertainty of straightness based on the square root method:
The confidence probability P = 95% is taken as the inclusion factor k = 2, and the extended uncertainty is obtained as
4.2.2. Synthesis of Uncertainty in MCM Based on the Principle of Distributed Propagation
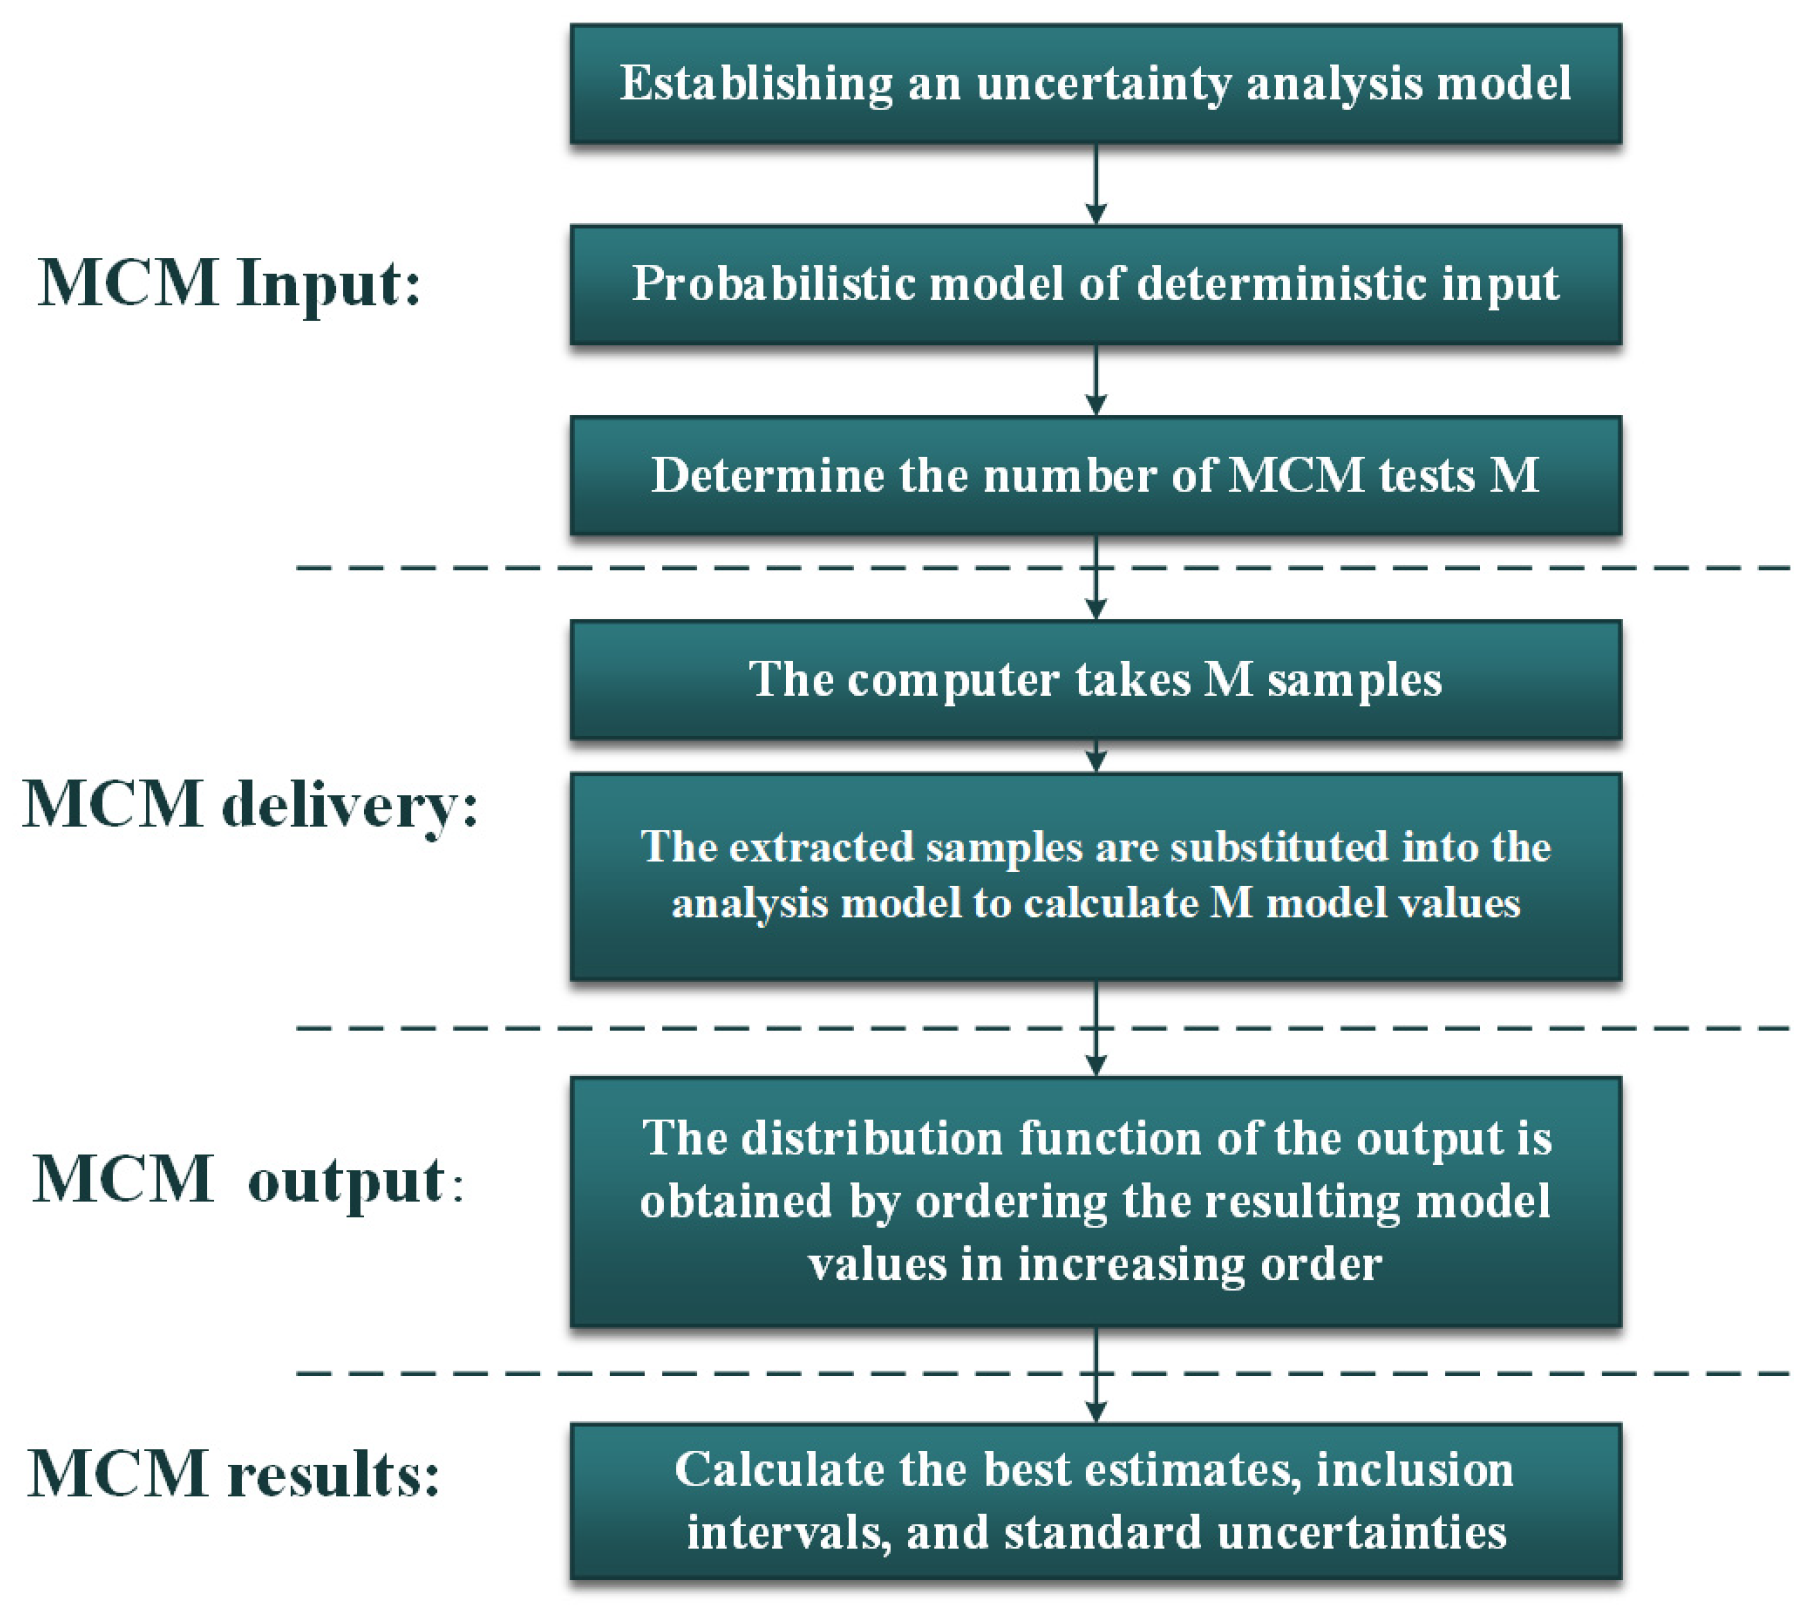
The MCM for evaluating measurement uncertainty is based on the principle of probability distribution propagation. Through the probability model of the input quantity and random sampling, the probability distribution of the output quantity can be directly obtained. The implementation steps are as follows Figure 7:
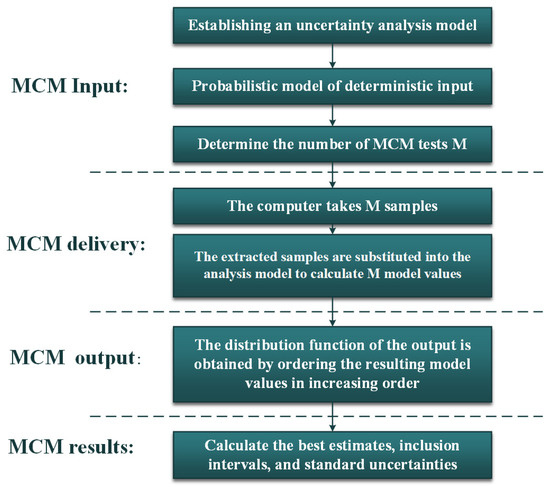
Figure 7.
MCM evaluation process.
- (1)
- Establish a measurement uncertainty analysis model using Equation (14) to determine each input quantity;
- (2)
- Determine the probability distribution and probability function that the input quantity conforms to, and follow a uniform distribution for and ; consider following a normal distribution for , , and ;
- (3)
- Generate random sampling data through computer software based on the probability distribution of each input quantity, with 106 experiments conducted;
- (4)
- Calculate the value of the corresponding output quantity and sort it incrementally to obtain the distribution function of the output quantity;
- (5)
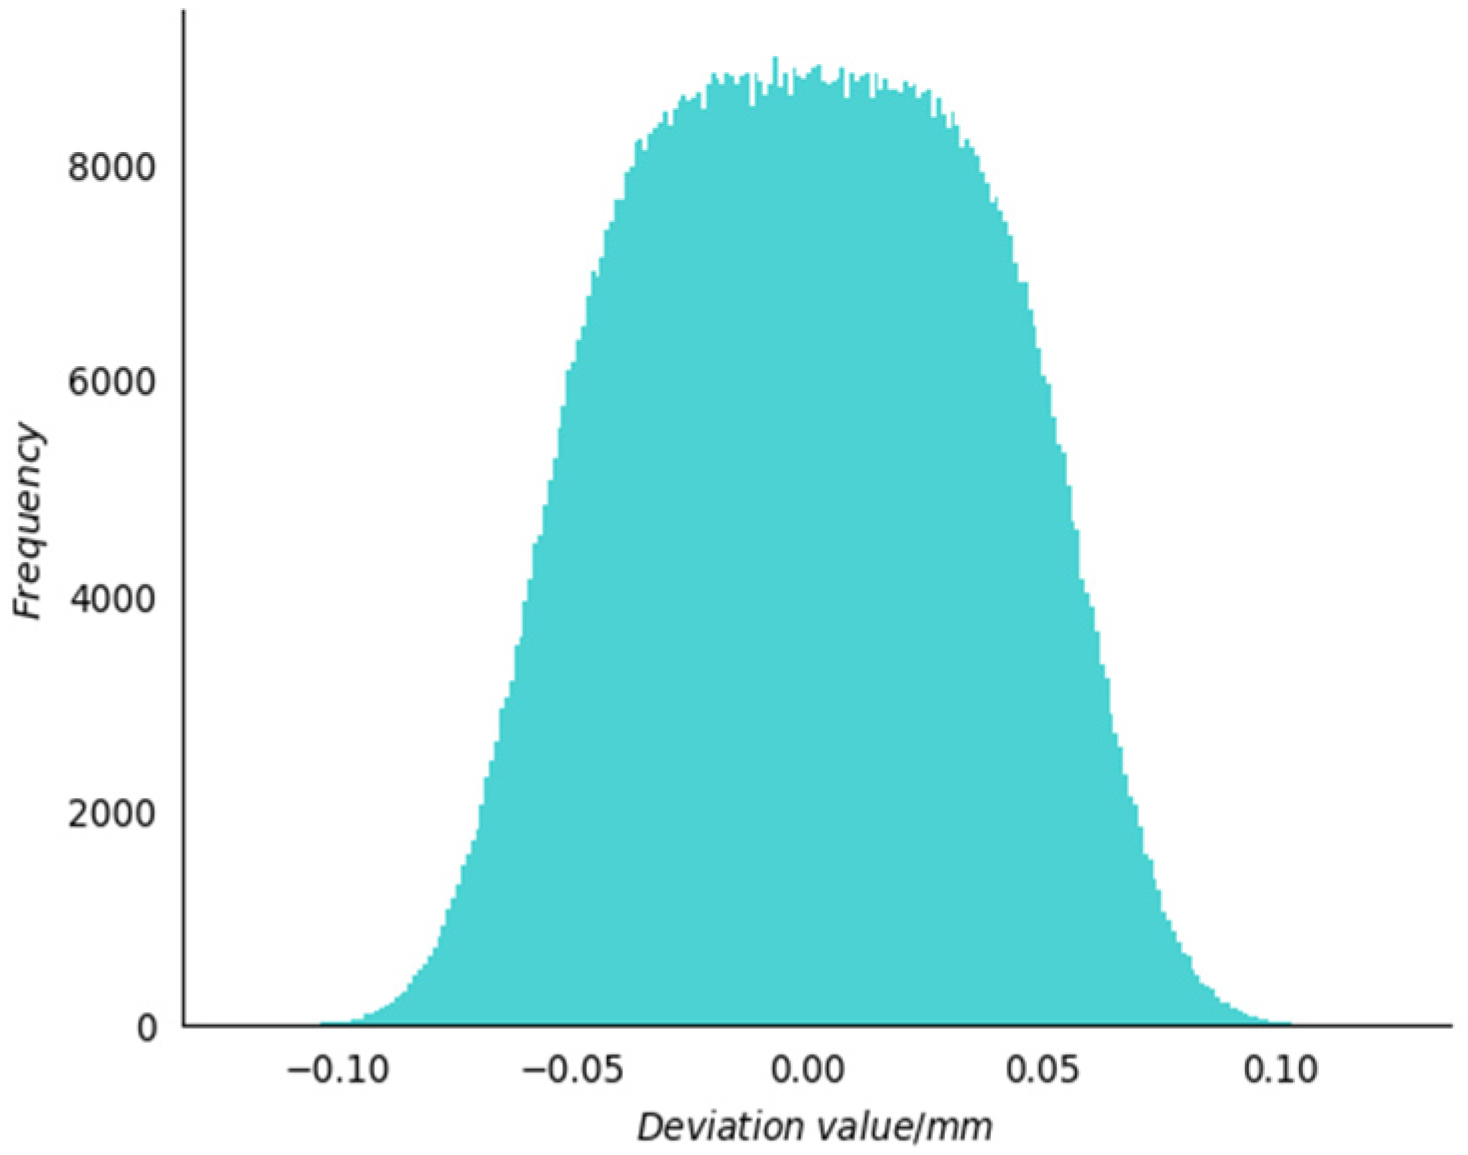
- Calculate the standard uncertainty based on the confidence probability P = 95% and the distribution function of the output quantity. The MCM results are shown in Figure 8.
 Figure 8. Histogram of MCM evaluation results.
Place the evaluation results of the above two uncertainty synthesis methods in Table 3:
Table 3.
The uncertainty synthesis results of the variance synthesis theorem and distribution propagation principle.
4.2.3. Comparison of Composite Uncertainty Results Based on the Variance Synthesis Theorem and Distribution Propagation Principle
By analyzing the evaluation results of two uncertainty synthesis methods, it can be concluded that when using the quantitative statistical characteristic method, the various uncertainty components are assumed to be independent of each other. At the same time, when the output distribution sign is normal distribution or t-distribution, the standard uncertainty results obtained by the two methods are basically the same; among these two methods of uncertainty synthesis, the MCM uncertainty synthesis method based on the principle of distributed propagation is more in line with the actual error propagation law by simulating random experimental sampling, and the evaluation results obtained are more reasonable and reliable.
5. Conclusions Remarks
A PSD-based geometric error measurement method is proposed, and a related measurement system is designed and established based on this method. The measurement range is expanded by the principle of segmented splicing measurement. Through experimental verification of the straightness measurement of ultra-long guide rails, the system meets the requirements of engineering applications. The results show that the measurement system proposed in this paper has high measurement accuracy and good repeatability for the measurement of geometric errors in separated long-distance travel.
Based on the measurement methods and uncertainty assessment methods studied, we have drawn the following conclusions:
(1) The use of a coordinate transformation splicing method to achieve long-distance geometric error measurement reduces the impact of noise and laser drift on sampling results.
(2) In the analysis of uncertainty sources in specific measurement tasks, the advantage of using a quantity statistics method is more obvious, avoiding the analysis and quantification of complex uncertainty sources. This article verifies through experiments that the uncertainty analysis model established by this method is suitable for PSD measurement systems and provides reference for the evaluation of measurement uncertainty in complex sensors.
(3) Through the combination of two uncertainty synthesis methods, MCM based on the variance synthesis theorem and the distribution propagation principle, it was found that when the output distribution follows a normal distribution or t-distribution, the uncertainty results obtained by the two methods are basically consistent; the MCM based on the principle of distributed propagation characterizes more input distribution information, resulting in higher reliability and more scientific results.
Author Contributions
Conceptualization, Y.C. and Y.L.; data curation, B.S.; formal analysis, P.L and Y.W.; investigation, Y.C.; methodology, P.L.; project administration, S.L.; software, P.L.; writing—original draft, P.L.; writing—review and editing, Y.C. and P.L. All authors have read and agreed to the published version of the manuscript.
Funding
This research was supported by the Natural Science Foundation of Zhejiang Province of China (Grant Number LY22E050005), Zhejiang Province Industry University Cooperation Collaborative Education Project, the National Key Research and Development Plan (2022YFB3207400), and the special fund for basic scientific research business expenses of central public welfare scientific research institutes (TKS20230204).
Institutional Review Board Statement
Not applicable.
Informed Consent Statement
Not applicable.
Data Availability Statement
Data are contained within the article.
Conflicts of Interest
Author Bin Shen was employed by the company Hangzhou Optical-Ruler Technology Co., Ltd. The remaining authors declare that the research was conducted in the absence of any commercial or financial relationships that could be construed as a potential conflict of interest.
References
- Zhang, X.L.; Wang, C.H.; Han, Y.X. Analysis of Error Sources in the Lissajous Scanning Trajectory Based on Two-Dimensional MEMS Mirrors. Photonics 2023, 10, 1123. [Google Scholar] [CrossRef]
- Gao, Y.E.; Liu, W.; Lv, S.M.; Zang, Y.K.; Dong, B.W. Six-degree-of-freedom displacement and angle measurement system based on two-dimensional position-sensitive detector. Opt. Precis. Eng. 2018, 26, 2930–2939. [Google Scholar] [CrossRef]
- Zhao, W.H.; Bai, Y.Y.; Wang, J.K.; Zhang, L.Z. Accuracy analysis of a three-dimensional angle measurement sensor based on dual PSDs. Infrared Laser Eng. 2024, 53, 106–116. [Google Scholar]
- Gao, C.; Lu, Y.H.; Lu, Z.W.; Liu, X.Y.; Zhang, J.H. Research on coaxiality measurement system of large-spansmall-hole system based on laser collimation. Measurement 2022, 191, 110765. [Google Scholar] [CrossRef]
- Chen, Y.T.; Lin, W.C.; Liu, C.S. Design and experimental verification of novel six-degree-of freedom geometric error measurement system for linear stage. Opt. Lasers Eng. 2017, 92, 94–104. [Google Scholar] [CrossRef]
- Fan, B.; Dai, X.; Xie, H.; Zhao, B.; Guo, B. Dual-Light-Path Optical Strain Gauge Using Diffraction Grating and Position-Sensitive Detectors for Deformation Measurement. Exp. Mech. 2017, 57, 1275–1287. [Google Scholar] [CrossRef]
- Zhou, G.L.; Li, L.Y.; Zhou, Y.; Chen, X.Y. High-Sensitivity Seawater Refraction Index Optical Measurement Sensor Based on a Position-Sensitive Detector. Sensors 2024, 24, 2050. [Google Scholar] [CrossRef] [PubMed]
- Wang, W.H.; Lu, J.P.; Ni, Z.H. Position-sensitive detectors based on two-dimensional materials. Nano Res. 2020, 14, 1889–1900. [Google Scholar] [CrossRef]
- Hong, Y.H.; Masoller, C.; Lee, M.W. Preface for Special Issue: Advancements in Semiconductor Lasers. Photonics 2023, 10, 944. [Google Scholar] [CrossRef]
- Jing, T.; Zhu, J.; Chen, T. Research on PSD-Based Straightness Measurement Method of Separated Long Guide Rail. Acta Metrol. Sin. 2024, 45, 425–432. [Google Scholar]
- Su, H.; Ye, R.F.; Cheng, F.; Gui, C.C.; Yu, Q. A Straightness Error Compensation System for Topography Measurement Based on Thin Film Interferometry. Photonics 2021, 8, 149. [Google Scholar] [CrossRef]
- Zhao, Y.F.; Cheng, Y.B. Uncertainty modeling and evaluation ofprofile measurement by structured light Scanner. Meas. Sci. Technol. 2022, 33, 095018. [Google Scholar] [CrossRef]
- Huang, Q.X.; Zhang, Z.Y.; Guo, X.Q.; Chen, Z.W.; Li, H.L. Measurement uncertainty evaluation of the orthogonal deviation angles of the target mirror of micro/nano measuring machine. J. Electr. Measur. Instr. 2022, 36, 10. [Google Scholar]
- Guan, J.Y.; Wang, Z.Y.; Li, S. Monte Carlo assessment of measurement uncertainty for handheld laser scanners. Electron. Meas. Technol. 2021, 44, 72–76. [Google Scholar]
- JCGM 100:2008; Guide to the Expression of Uncertainty in Measurement, GUM 1995 with Minor Corrections. The Joint Committee for Guides in Metrology: Paris, France, 2008.
- JCGM 101:2008; Supplement 1 to the “Guide to the Expression of Uncertaninty in Measurement”—Propagation of Distributions Using a Monte Carlo Method. The Joint Committee for Guides in Metrology: Paris, France, 2008.
- Sepahi-Boroujeni, S.; Mayer, J.R.R.; Khameneifar, F. Efficient uncertainty estimation of indirectly measured geometric errors of five-axis machine tools via Monte-Carlo validated GUM framework. Precis. Eng. 2021, 67, 160–171. [Google Scholar] [CrossRef]
- Chen, Y.M.; Li, X.H.; Huang, L.X.; Wang, X.; Liu, C.H.; Zhao, F.; Hua, Y.; Feng, P. GUM method for evaluation of measurement uncertainty: BPL long wave time service monitoring. Measurement 2022, 189, 110459. [Google Scholar] [CrossRef]


Disclaimer/Publisher’s Note: The statements, opinions and data contained in all publications are solely those of the individual author(s) and contributor(s) and not of MDPI and/or the editor(s). MDPI and/or the editor(s) disclaim responsibility for any injury to people or property resulting from any ideas, methods, instructions or products referred to in the content. |
© 2024 by the authors. Licensee MDPI, Basel, Switzerland. This article is an open access article distributed under the terms and conditions of the Creative Commons Attribution (CC BY) license (https://creativecommons.org/licenses/by/4.0/).