Article

An Effective Model for Capturing the Role of Excitonic Interactions in the Wave-Packet Dynamics of DNA Nucleobases

1
Department of Physics, School of Physical Science and Technology, Ningbo University, Ningbo 315211, China
2
Rosalind Franklin Institute, Harwell, Oxfordshire OX11 0QX, UK
3
Department of Pharmacology, University of Oxford, Oxford OX1 3QT, UK
*
Author to whom correspondence should be addressed.
Photonics 2024, 11(6), 566; https://doi.org/10.3390/photonics11060566
Submission received: 28 April 2024 / Revised: 29 May 2024 / Accepted: 4 June 2024 / Published: 17 June 2024
(This article belongs to the Special Issue Ultrafast Optics and Applications)

Abstract

:
Investigating exciton dynamics within DNA nucleobases is essential for comprehensively understanding how inherent photostability mechanisms function at the molecular level, particularly in the context of life’s resilience to solar radiation. In this paper, we introduce a mathematical model that effectively simulates the photoexcitation and deactivation dynamics of nucleobases within an ultrafast timeframe, particularly focusing on wave-packet dynamics under conditions of strong nonadiabatic coupling. Employing the hierarchy equation of motion, we simulate two-dimensional electronic spectra (2DES) and calibrate our model by comparing it with experimentally obtained spectra. This study also explores the effects of base stacking on the photo-deactivation dynamics in DNA. Our results demonstrate that, while strong excitonic interactions between nucleobases are present, they have a minimal impact on the deactivation dynamics of the wave packet in the electronic excited states. We further observe that the longevity of electronic excited states increases with additional base stacking and pairing, a phenomenon accurately depicted by our excitonic model. This model enables a detailed examination of the wave packet’s motion on electronic excited states and its rapid transition to the ground state. Additionally, using this model, we studied base stacks in DNA hairpins to effectively capture the primary exciton dynamics at a reasonable computational scale. Overall, this work provides a valuable framework for studying exciton dynamics from single nucleobases to complex structures such as DNA hairpins.

1. Introduction

The unraveling of the photoexcitation and deactivation mechanism in nucleobasesand nucleotides is an important question for understanding DNA photostability under UV radiation [1,2,3,4]. It is well established that the UV excitation of DNA nucleobases decays within a few picoseconds [5]. Under UV excitation, the population excite to an electronically bright state π π * and undergo an ultrafast radiationless transition to a dark excited state n π * within an ultrafast timescale, implying the existence of a conical intersection (CI) between two potential energy surfaces (PESs) [6,7]. In the vicinity of the CI, strong nonadiabatic coupling between PESs induces a strong mixture of electronic and vibrational Degrees of Freedom statistics (DoFs), which results in Born–Oppenheimer approximation breakdown [8,9]. Nonadiabatic dynamics in nucleobases have been intensively studied by quantum chemistry calculations [10,11]. The revealed dynamics show the short lifetime of the electronic excited state, which implies the wave packet moves to the grounded state within an ultrafast timescale. Due to the recent development of ultrafast spectroscopic techniques, studies of radiationless transitions and deactivation processes of DNA have been carried out over the last decades. In 2005, Kohler et al. studied the excited-state dynamics in A-T DNA by transient absorption spectroscopy [12]. They observed that base stacking is the key geometric factor in determining the lifetime of electronic excited states in DNA. However, due to the lack of detailed calculations, the physical mechanism of wave-packet dynamics and deactivation processes were missing. In addition, excited-state dynamics in DNA are complicated. Marguet et al. state that the interpretation of Ref. [12] was oversimplified [13]. Moreover, the charge–transfer dynamics in DNA have also been studied by time-resolved spectroscopy [14]. More interestingly, the development of multipulse configuration has been extended to UV regions and its application in 2D ES was achieved by Prokhorenko and coworkers [15] in 2016. Due to the advanced pulse compression techniques, they achieved a time resolution of 5 fs. In this way, they were able to probe the quantum coherence and the ultrafast deactivation dynamics by 2D ES with an excellent Signal/Noise Ratio (SNR). Moreover, the quantum coherent dynamics of the pyren molecule were further studied by 2D ES at a UV wavelength [16].
Theoretically, the photoinduced dynamics in excited states of DNA and nucleobases have been well studied by ab initio methods [17]. Garavelli et al. employed the CASPT2 or CASSCF to scan the PESs and calculated the 2D ES by using the phase-matching approach in the UV region [18,19]. However, the full configuration methods of electronic orbitals in molecules are a great challenge in calculations [7]. Meanwhile, the system–bath model could provide an alternative approach to studying the photo-excited state dynamics in nucleobases and DNA. Based on the system–bath model, Dijkstra et al. developed an effective model to capture the population transfers and relaxation dynamics in nucleobases [20]. By transforming the key reaction coordinates into the bath, an effective excitonic model could yield numerically exact results with a hierarchy equation of motion (HEOM) [21,22]. Duan et al. constructed an effective model for capturing the wave-packet dynamics near the CI [23]. By transforming the effective reaction coordinates into the bath, they developed an effective model to examine the population relaxation with a strong nonadiabatic coupling in the CI. Furthermore, the model was further employed to examine the impact of vibrational coherence on the process of photoisomerization [24,25].

2. Materials and Methods

Motivated by the above-mentioned model, we construct an excitonic model to study the photoexcitation and deactivation dynamics of nucleobases [26,27]. A unified model of excited-state dynamics from nucleobases to DNA string was built. We first constructed an exciton model and refined the modeling parameters by calculating 2D ES in the UV region [28,29]. The excitonic interaction of the base stacking was calculated. The constructed dimer model of adenine molecules allowed us to study the impact of exciton interaction on the population dynamics. With the increasing number of stacking bases, we were able to observe the gradual prolonging of the excited-state lifetime of bright electronic states in a string of stacked adenine molecules. By studying the photoexcitation and deactivation dynamics in nucleobases, the detailed mechanism of the deactivation process in the DNA string can be well interpreted. At the same time, our work in the experiments was feasible. One can collect the 2D ES by using pump/probe beam geometry [30]. The pump pulse is generated by a pulse shaper, which shapes the pulses from a broadband ultrashort laser source with a center wavelength of 800 nm ± 17 nm, pulse width of 50 fs, repetetion rate of 1 KHz, and pulse energy of 900 µJ. The derivation details are provided in Appendix A. Our work provides a valuable platform for studying the detailed physical mechanism of photoactivation, deactivation, single nucleobases and big molecules of DNA strings.
We first captured the excited-state dynamics and relaxation process in a nucleobase. The adenine molecule was selected for study. In principle, the rest of the nucleobases can be extended by using different site energies and parameters. We constructed an exciton model with three electronic states; the Hamiltonian can be written as
H = ϵ e | e e | + ϵ d | d d | + M 2 Ω 2 2 Q 2 d e D 2 | e e | + M 2 Ω 2 2 Q 2 d d D 2 | d d | + M 1 Ω 1 2 Q 1 D 1 ( d V 1 | d e | + h . c . ) + M 1 Ω 1 2 Q 1 D 1 ( d V 1 | g d | + h . c . )
where | g , | e , and | d denote the electronic ground, bright, and dark states, respectively, ϵ e and ϵ d are the site energies of bright and dark electronic states, and M i , D i , and Ω i are the masses and characteristic length scales. To efficiently form CI, we also selected two reaction coordinates and used them as tuning modes Q 2 and a coupling mode Q 1 [31]. The adiabatic energy varies along Q 2 , and the coupling between the adiabatic states varies along Q 1 . Based on this procedure, we were able to construct effective CIs between bright and dark excited states of ( π π * and n π * ), and between dark and ground states of ( n π * and | g ). Through a canonical transformation, the Hamiltonian was rewritten as [20,23]
H = ϵ e e e + ϵ d d d + d e e e + d d d d α g 2 α x α d v g d + h . c . α g 1 α x α d v d e + h . c . α g α x α ,
The parameters of d e and d d indicate the amplitude of the vibronic coupling strength of the tuning mode, and d v and d v are the vibronic coupling strengths between bright–dark and dark–ground states, respectively. We employed three baths with coupling strengths of g 2 α , g 1 α , and g 1 α , respectively. The frequency distribution of these coupling strengths can be modeled as spectral densities. The Lorentzian spectral densities with Drude-type cut-off were employed as J ( ω ) = 2 λ i π γ i ω ω 2 + γ i 2 , where λ i and γ i are the reorganization energy and cut-off frequency for the ith bath, respectively. A detailed derivation of the cascade equations of motion is provided in Appendix B.

3. Results

3.1. The 2D Electron Spectra of DNA Bases

The simulation results are shown in Figure 1a–c with selected waiting times, T = 0, 250, and 500 fs, respectively.
To capture the main features of Ground State Bleaching (GSB) and Exciting State Absorption (ESA) in 2D ES, we needed to add two electronic states and the transitions from bright and dark states. The site energies of | e and | d were 40,000 cm−1 and 28,000 cm−1, respectively. The parameters were set as d e = −1.0, d d = 1.0 and λ 2 α = 4000 cm−1 in order to form effective CIs. The d v and d v were set as 1.0. The reorganization energies of two baths were set as 40 and 80 cm−1, respectively [20]. Therefore, λ 1 α = 40 cm−1 and λ 1 α = 80 cm−1, respectively. In addition, the cut-off frequency of spectral densities was γ = 1000 cm−1 for all baths.
Generally, the axis of the two-dimensional spectrum is expressed as follows: the horizontal axis is the excitation frequency axis ( ω t ) and the vertical axis is the detection frequency axis ( ω τ ). In Figure 1a, we observe a signature GSB central peak of 40,000 cm−1 at T = 0 fs. The ESA peak is shown as a broadband blue (negative) peak located at ( ω τ , ω t ) = (37,000, 40,000) cm−1, indicating the transition from | d to the high energy level. The time-resolved magnitude of this ESA peak is checked to track the population transferring from | e to | d . The absolute value of ESA peak reaches a maximum at around 300 fs and subsequently decays. The transient absorption (TA) spectrum was calculated and is shown in Figure 1d. It is shown how our three-level model could capture the population transfer and the photo-deactivation process in the adenine molecule. With these parameters, the PESs of ground, electronic bright, and dark states were constructed and these are shown in Figure 2. To obtain the 2D ES, we need to include high-level electronic states as well as the electronic transition from | d in our model.
With the optimal set of parameters, we were able to study the detailed population transfers and the motion of the wave packet on PESs near the CI in the electronically excited states of the adenine molecule. We first calculated the population dynamics of the three-level model, as shown in Figure 3a. The time-resolved population of | e is represented as a red dotted line. The dynamics of the dark state | d and ground state | g are shown as blue and black lines, respectively. The calculations were performed at 300 K. It is shown that the population was initially located at the bright electronic state | e . It then decayed rapidly to the dark state | d at 100 fs. Based on the configuration of PESs, it is clear that the wave packet passed through the CI and deactivated to the dark electronic state. Moreover, the population on the electronic ground state | g increased within an ultrafast timescale and reached a maximum at 500 fs, which is in agreement with the timescale revealed in the spectroscopic measurements [15]. We further calculated the population dynamics at a low temperature (77 K), as shown in Figure 3e. The population transfer from | e to | d and the subsequent relaxation to | g were slower when comparing with the results at room temperature.
We further studied the population dynamics and the associated relaxation of the other nucleobases. We calculated the site energies of nucleobases, guanine, thymine, and cytosine molecules. We calculated the population dynamics of their bright, dark, and ground states ( | e , | d and | g ) and plotted the time-resolved traces, as shown in Figure 3a–h, at different temperatures. We observed the deactivation dynamics from | e to | g with similar timescales compared to the results of adenine shown in Figure 3a,e. We concluded that the constructed three-level model can capture the population transfer and the main deactivation dynamics of the CIs between ground and excited states.

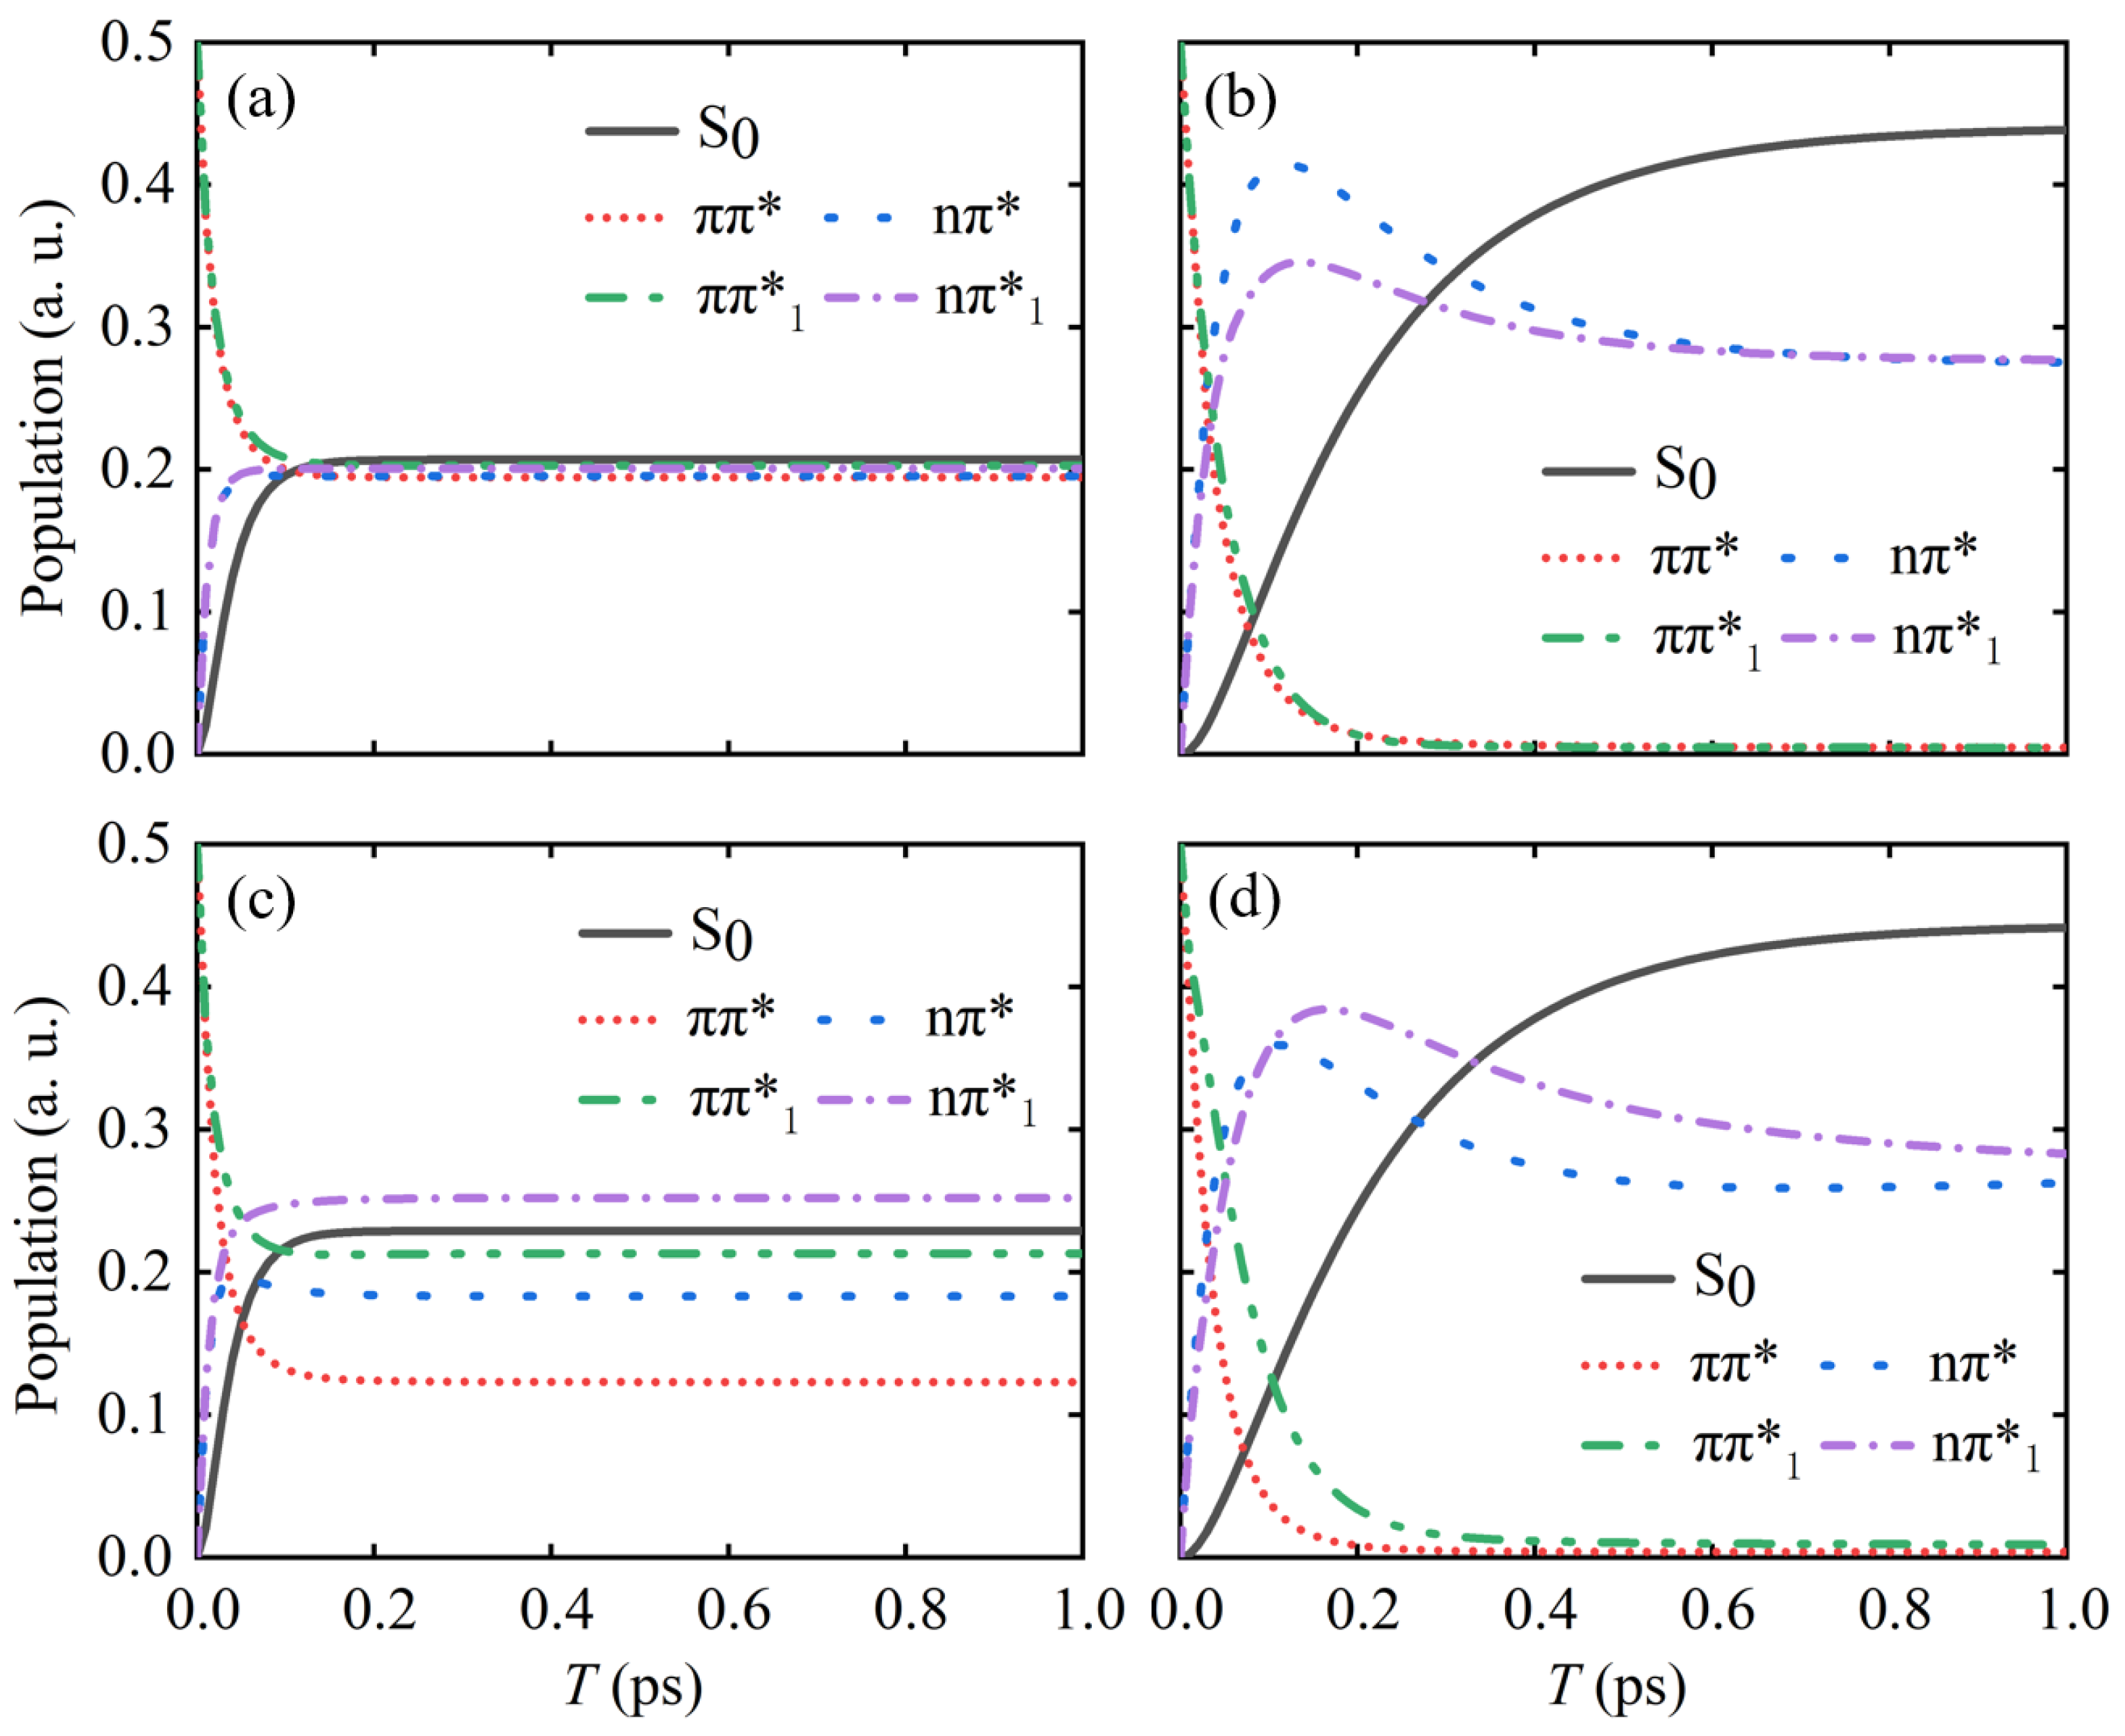
3.2. Impact of Base Stacking on Population Transfer in Nucleobases

Based on the proposed three-level model, we studied the impact of base stacking on the population transfer and the associated coherent dynamics of electronic excited states of nucleobases. We first obtained the molecular configuration of base stacking. The configurations of stacking effect between two adenine molecules were selected. Starting from a DNA configuration (1SM5.pdb), we selected two adenine molecules with stacking configurations. The extracted molecular configurations are shown in Figure 4a,b, respectively. With the same stacking configuration, the energies of excited states were calculated by using the Time-dependent Density Functional Theory (TDDFT) method. The magnitude and directions of transition dipole moments were calculated by TDDFT as well; these are shown by red arrows in Figure 4a. An angle of 15 degrees between two stacked adenines can be observed. The exciton coupling between two adenine molecules was calculated as ∼150 cm−1 with a component of charge transfer by using the atomic–transition–charge method. The calculation details of excitonic coupling can be found in Ref. [32]. Note that the charge-transfer mechanisms between two nucleobases are not considered here.
We further constructed an exciton model with two stacked adenines and calculated the associated population dynamics at 300 K, as shown in Figure 5a. It was found that the population transfer from π π * to n π * was slightly slower than the case of single adenine, indicating that the excited-state relaxation can be slightly modulated by the strong excitonic coupling between two adenine molecules. We also calculated the population dynamics of an adenine dimer at a low temperature (77 K). As shown in Figure 5b, the population was initially located at two bright electronic states, | e 1 and | e 2 , with a value of 0.5. They decayed rapidly and reached a minimum within 100 fs, showing the same timescale of deactivation compared to the results with a single adenine molecule. Moreover, the population of electronic ground state | g increased with evolving time and reached a maximum at 500 fs, which quantitatively agrees with the observations of dynamics of ground states with a single adenine. Obviously, the base stacking effect does not significantly alter excited-state dynamics in an adenine dimer. We further calculated the population dynamics of an adenine–thymine dimer at a lower temperature 77 K, as shown in Figure 5c. Compared to the results with single adenine, we observed a difference in population transfer from the bright state | e to the dark state | d with a small rate of transfer. However, the deactivation pathways and timescales did not change dramatically at 77 K.

4. Discussion

In our modeling and calculations, we showed that the constructed three-level model can capture the main feature of population transfer and deactivation dynamics in adenine molecules, as well as the stacking effect. Moreover, we also showed that this model could track the wave-packet dynamics on PESs of the other three types of nucleobases. The base stacking could modulate the population dynamics of excited states with an increasing number of nucleobases. However, in this paper, the employment of HEOM, which yields numerically exact results, required large-scale computational resources. This limited us to performing the calculations with larger scale stacking bases. The recent development of parallel calculations with a Graphics Processing Unit (GPU) allowed us to perform calculations on a much larger scale [33,34]. The combination of an effective exciton model with GPU techniques will enable us to perform the excited-state calculations, yielding numerically exact results with a reasonable scale of DNA string. Our model shows potential in understanding the detailed mechanism of deactivation in DNA strings.

5. Conclusions

In this paper, we developed a sophisticated model tailored to elucidating the dynamics of photon-induced population transfer and deactivation in nucleobases, utilizing a refined three-level excitonic framework derived from the linear vibronic coupling model. Our approach simplifies the computational effort by incorporating reaction coordinates directly into the environmental bath. By leveraging 2DES experimental data for parameter validation, we effectively aligned our model with empirical observations. Employing this model, we examined the photon-driven population dynamics and associated wave-packet movements on the potential energy surfaces of the adenine molecule. Furthermore, we extended our analysis to adenine molecules in a base-stacking arrangement, observing how the excitonic interactions between nucleobases progressively modulate population transfers and deactivation pathways near conical intersections. This study provides comprehensive insights into the exciton deactivation mechanisms from individual nucleobases to complex DNA structures, establishing a potent framework for investigating the photoexcitation and subsequent deactivation of nucleobases and DNA arrays in the realm of photonics.

Author Contributions

H.-G.D. conceived the research project and discussed with A.J.; T.G. calculated the 2DES; T.G., A.J. and H.-G.D. analyzed the data; P.-P.Z. and A.J. wrote the first draft and all authors refined the manuscript; H.-G.D. supervised this project. All authors have read and agreed to the published version of the manuscript.

Funding

This work was supported by an NSFC grant, No. 12274247, and the Foundation of National Excellent Young Scientists.

Institutional Review Board Statement

Not applicable.

Informed Consent Statement

Not applicable.

Data Availability Statement

Data underlying the results presented in this paper are not publicly available at this time but may be obtained from the authors upon reasonable request.

Conflicts of Interest

The authors declare no conflicts of interest.

Appendix A. The Phase Matching Approach

Only rephasing (RP) signals are usually detected in two-dimensional spectroscopic experiments; their direction is K S = k 1 + k 2 + k 3 . For non-rephasing (NR) signals, their direction is K S = k 1 k 2 + k 3 , K 1 , K 2 , where K 3 represents the direction of the first, second, and third pulses, respectively. As can be seen from the RP signal and the NR signal directions, another signal is obtained by simply switching the order of the first and second pulses. If the time interval between the first pulse and the second pulse of the RP spectrum is defined as τ 0 , then the NR spectrum τ 0 .
By fixing the residence time T, the time domain signal S ( τ , T , t ) can obtain the corresponding two-dimensional spectrum S ( ω τ , T , ω t ) .
I ( ω t , T , ω τ ) = Re 0 d τ 0 d t e i ( ω τ τ + ω t t ) S n r ( t , T , τ ) + e i ( ω τ τ + ω t t ) S r p ( t , T , τ ) ] .
Two-dimensional electron spectroscopy usually detects the rephasing (RP) signal in the k r p = k 1 + k 2 + k 3 direction and non-rephasing(NR) signals in the k n r = k 1 k 2 + k 3 direction. The sum of the spectra of the two phase-matching directions is the two-dimensional absorption spectrum, which is commonly used in signal detection direction. The two-dimensional absorption spectrum can obtain the most information, and, of course, it can also detect other phase-matching directions, such as k 1 + k 2 k 3 , which gives a two-dimensional electron double quantum coherence spectrum.
At the impulsive limit, the absorption spectrum of the 2D spectrum is partially given by R n r ( τ , T , t ) and R r p ( τ , T , t ) carries out a two-dimensional Fourier transform.
S n r ( ω τ , T , ω t ) = Re 0 0 d τ d t e i ω τ τ + i ω t t R n r ( τ , T , t )
S r p ( ω τ , T , ω t ) = Re 0 0 d τ d t e i ω τ τ + i ω t t R r p ( τ , T , t )
S ( ω τ , T , ω t ) = S n r ( ω τ , T , ω t ) + S r p ( ω τ , T , ω t )

Appendix B. The Hierarchy Equations of Motion

The spectral density J k ( ω ) is defined as
J k ( ω ) = j g j k 2 2 m j k ω j k δ ( ω ω j k )
and the corresponding correlation function is
C k ( t ) = 1 π 0 J k ( ω ) coth ( β ω 2 ) cos ω t i sin ω t d ω
We further have the Bose distribution function:
1 1 e β ω = 1 β ω + 1 2 + l = 1 N l 2 η l β ω β ω 2 + ξ l 2
coth ( β ω 2 ) = 2 1 1 e β ω 1 2 = 2 β ω + l = 1 N l 4 η l ω β ω 2 + ν l 2 , ν l = ξ l β
Let us first consider the Drude spectral density
J k ( ω ) = 2 λ k γ k ω ω 2 + γ k 2 J k ( ω ) coth ( β ω 2 ) = 2 λ k γ k ω ω 2 + γ k 2 2 β ω + l = 1 N l 4 η l ω β ω 2 + ν l 2
1 π 0 J k ( ω ) coth ( β ω 2 ) cos ω t d ω = i λ k γ k coth ( i β γ k 2 ) e γ k t 4 λ k γ k β l = 1 N l η l ν l γ k 2 ν l 2 e ν l t = λ k γ k cot ( β γ k 2 ) e γ k t 4 λ k γ k β l = 1 N l η l ν l γ k 2 ν l 2 e ν l t
1 π 0 J k ( ω ) sin ω t d ω = λ k γ k e γ k t
In summary, the correlation function for the Drude spectral density is
C k ( t ) = λ k γ k cot ( β γ k 2 ) i e γ k t 4 λ k γ k β l N l η l ν l γ k 2 ν l 2 e ν l t
Because the correlation function is a sum of exponentials, a hierarchy of equations of motion for the reduced density matrix can be derived in the usual way. If we write the correlation function as
C k ( t ) = j k = 0 J k ( c j k + i c j k ) e γ j k t
We can derive the HEOM that consists of the following set of equations of motion for the auxiliary density operators (ADOs):
t ρ ^ n 1 , , n N B ( t ) = i H ^ S × + k = 1 N B j k = 0 J k n j k γ j k ρ ^ n 1 , , n N B ( t )
k = 1 N B Φ ^ k j k = 0 J k ρ ^ , n k + e j k , ( t ) k = 1 N B j k = 0 J k n j k Θ ^ j k ρ ^ , n k e j k , ( t )
Here, e j k is the unit vector along the j k th direction and we defined H ^ S × ρ ^ = [ H ^ S , ρ ^ ] ,   Φ ^ k ρ ^ = i [ V ^ k , ρ ^ ] and Θ ^ k = c j k Φ ^ k + i c j k Ψ ^ k , with Ψ ^ k ρ ^ = i { V ^ k , ρ ^ }   n k = ( n k 0 k , , n k j k ) , where each element takes an integer value greater than zero.

References

  1. Crespo-Hernández, C.E.; Cohen, B.; Hare, P.M.; Kohler, B. Ultrafast excited-state dynamics in nucleic acids. Chem. Rev. 2004, 104, 1977–2019. [Google Scholar] [CrossRef] [PubMed]
  2. Lu, Y.; Lan, Z.; Thiel, W. Computational modeling of photoexcitation in DNA single and double strands. In Photoinduced Phenomena in Nucleic Acids II; DNA Fragments and Phenomenological Aspects; Springer: Cham, Switzerland, 2015; pp. 89–122. [Google Scholar]
  3. Barbatti, M.; Borin, A.C. Photoinduced Phenomena in Nucleic Acids II: DNA Fragments and Phenomenological Aspects; Springer: Cham, Switzerland, 2015; ISBN 9783319132723. [Google Scholar]
  4. Gray, H.B. Charge Transfer in DNA: From Mechanism to Application; John Wiley Sons: Hoboken, NJ, USA, 2006. [Google Scholar]
  5. Middleton, C.T.; de La Harpe, K.; Su, C.; Law, Y.K.; Crespo-Hernández, C.E.; Kohler, B. DNA excited-state dynamics: From single bases to the double helix. Annu. Rev. Phys. Chem. 2009, 60, 217–239. [Google Scholar] [CrossRef] [PubMed]
  6. Keefer, D.; Schnappinger, T.; de Vivie-Riedle, R.; Mukamel, S. Visualizing conical intersection passages via vibronic coherence maps generated by stimulated ultrafast X-ray Raman signals. Proc. Natl. Acad. Sci. USA 2020, 117, 24069–24075. [Google Scholar] [CrossRef] [PubMed]
  7. Barbatti, M.; Aquino, A.J.A.; Szymczak, J.J.; Nachtigallová, D.; Hobza, P.; Lischka, H. Relaxation mechanisms of UV-photoexcited DNA and RNA nucleobases. Proc. Natl. Acad. Sci. USA 2010, 107, 21453–21458. [Google Scholar] [CrossRef] [PubMed]
  8. Domcke, W.; Yarkony, D.R. Role of conical intersections in molecular spectroscopy and photoinduced chemical dynamics. Annu. Rev. Phys. Chem. 2012, 63, 325–352. [Google Scholar] [CrossRef] [PubMed]
  9. Domcke, W.; Yarkony, D.R. Köppel, H. Conical Intersections: Theory, Computation and Experiment; World Scientific: Singapore, 2011; Volume 17. [Google Scholar]
  10. Domcke, W.; Yarkony, D.R.; Köppel, H. Electronic Structure, Dynamics and Spectroscopy; World Scientific: Singapore, 2004. [Google Scholar]
  11. Crespo-Otero, R.; Barbatti, M. Recent Advances and Perspectives on Nonadiabatic Mixed Quantum-Classical Dynamics. Chem. Rev. 2018, 118, 7026–7068. [Google Scholar] [CrossRef] [PubMed]
  12. Crespo-Hernández, C.E.; Cohen, B.; Kohler, B. Base stacking controls excited-state dynamics in A.T DNA. Nature 2005, 436, 1141–1144. [Google Scholar] [CrossRef] [PubMed]
  13. Markovitsi, D.; Talbot, F.; Gustavsson, T.; Onidas, D.; Lazzarotto, E.; Marguet, S. Molecular spectroscopy: Complexity of excited-state dynamics in DNA. Nature 2006, 441, E7; discussion E8. [Google Scholar] [CrossRef] [PubMed]
  14. Fujitsuka, M.; Majima, T. Charge transfer dynamics in DNA revealed by time-resolved spectroscopy. Chem. Sci. 2017, 8, 1752–1762. [Google Scholar] [CrossRef] [PubMed]
  15. Prokhorenko, V.I.; Picchiotti, A.; Pola, M.; Dijkstra, A.G.; Miller, R.J.D. New Insights into the Photophysics of DNA Nucleobases. J. Phys. Chem. Lett. 2016, 7, 4445–4450. [Google Scholar] [CrossRef] [PubMed]
  16. Picchiotti, A.; Nenov, A.; Giussani, A.; Prokhorenko, V.I.; Miller, R.J.D.; Mukamel, S.; Garavelli, M. Pyrene, a Test Case for Deep-Ultraviolet Molecular Photophysics. J. Phys. Chem. Lett. 2019, 10, 3481–3487. [Google Scholar] [CrossRef] [PubMed]
  17. Kleinermanns, K.; Nachtigallová, D.; de Vries, M.S. Excited state dynamics of DNA bases. Int. Rev. Phys. Chem. 2013, 32, 308–342. [Google Scholar] [CrossRef]
  18. Conti, I.; Nenov, A.; Höfinger, S. Excited state evolution of DNA stacked adenines resolved at the CASPT2//CASSCF/Amber level: From the bright to the excimer state and back. Phys. Chem. Chem. Phys. 2015, 17, 7291–7302. [Google Scholar] [CrossRef] [PubMed]
  19. Borrego-Varillas, R.; Nenov, A.; Kabaciński, P.; Conti, I.; Ganzer, L.; Oriana, A.; Jaiswal, V.K.; Delfino, I.; Weingart, O.; Manzoni, C.; et al. Tracking excited state decay mechanisms of pyrimidine nucleosides in real time. Nat. Commun. 2021, 12, 7285. [Google Scholar] [CrossRef] [PubMed]
  20. Dijkstra, A.G.; Prokhorenko, V.I. Simulation of photo-excited adenine in water with a hierarchy of equations of motion approach. J. Chem. Phys. 2017, 147, 64102. [Google Scholar] [CrossRef] [PubMed]
  21. Ishizaki, A.; Tanimura, Y. Quantum Dynamics of System Strongly Coupled to Low-Temperature Colored Noise Bath: Reduced Hierarchy Equations Approach. J. Phys. Soc. Jpn. 2005, 74, 3131–3134. [Google Scholar] [CrossRef]
  22. Tanimura, Y. Reduced hierarchy equations of motion approach with Drude plus brownian spectral distribution: Probing electron transfer processes by means of two-dimensional correlation spectroscopy. J. Chem. Phys. 2012, 137, 22A550. [Google Scholar] [CrossRef] [PubMed]
  23. Duan, H.-G.; Thorwart, M. Quantum Mechanical Wave Packet Dynamics at a Conical Intersection with Strong Vibrational Dissipation. J. Phys. Chem. Lett. 2016, 7, 382–386. [Google Scholar] [CrossRef] [PubMed]
  24. Duan, H.-G.; Miller, R.J.D.; Thorwart, M. Impact of Vibrational Coherence on the Quantum Yield at a Conical Intersection. J. Phys. Chem. Lett. 2016, 7, 3491–3496. [Google Scholar] [CrossRef]
  25. Qi, D.-L.; Duan, H.-G.; Sun, Z.-R.; Miller, R.J.D.; Thorwart, M. Tracking an electronic wave packet in the vicinity of a conical intersection. J. Chem. Phys. 2017, 147, 74101. [Google Scholar] [CrossRef]
  26. Tuna, D.; Sobolewski, A.L.; Domcke, W. Mechanisms of ultrafast excited-state deactivation in adenosine. J. Phys. Chem. A 2014, 118, 122–127. [Google Scholar] [CrossRef] [PubMed]
  27. Perun, S.; Sobolewski, A.L.; Domcke, W. Ab initio studies on the radiationless decay mechanisms of the lowest excited singlet states of 9H-adenine. J. Am. Chem. Soc. 2005, 127, 6257–6265. [Google Scholar] [CrossRef] [PubMed]
  28. Rozenman, G.G.; Peisakhov, A.; Zadok, N. Dispersion of organic exciton polaritons—A novel undergraduate experiment. Eur. J. Phys. 2022, 43, 35301. [Google Scholar] [CrossRef]
  29. Roller, E.-M.; Argyropoulos, C.; Högele, A.; Liedl, T.; Pilo-Pais, M. Plasmon-Exciton Coupling Using DNA Templates. Nano Lett. 2016, 16, 5962–5966. [Google Scholar] [CrossRef] [PubMed]
  30. Khalil, M.; Tokmakoff, A. Signatures of vibrational interactions in coherent two-dimensional infrared spectroscopy. Chem. Phys. 2001, 266, 213–230. [Google Scholar] [CrossRef]
  31. Zhang, X.; Liu, Z.; Jha, A.; Liang, X.-T.; Thorwart, M.; Dwayne Miller, R.J.; Duan, H.-G. Disentangling the complexity of coupled vibrations by two-dimensional electronic-vibrational spectroscopy. J. Phys. B At. Mol. Opt. Phys. 2023, 56, 145001. [Google Scholar] [CrossRef]
  32. Kistler, K.A.; Spano, F.C.; Matsika, S. A benchmark of excitonic couplings derived from atomic transition charges. J. Phys. Chem. B 2013, 117, 2032–2044. [Google Scholar] [CrossRef] [PubMed]
  33. Tsuchimoto, M.; Tanimura, Y. Spins Dynamics in a Dissipative Environment: Hierarchal Equations of Motion Approach Using a Graphics Processing Unit (GPU). J. Chem. Theory Comput. 2015, 11, 3859–3865. [Google Scholar] [CrossRef]
  34. Kramer, T.; Noack, M.; Reinefeld, A.; Rodríguez, M.; Zelinskyy, Y. Efficient calculation of open quantum system dynamics and time-resolved spectroscopy with distributed memory HEOM (DM-HEOM). J. Comput. Chem. 2018, 39, 1779–1794. [Google Scholar] [CrossRef]
Figure 1. Calculated 2D electronic spectra (real part) and transient absorption spectrum based on three-level model. The calculated 2D electronic spectrum at T = 0, T = 250 and T = 500 fs are shown in (ac). The calculated values for the transient absorption spectrum of adenine are described in (d).
Photonics 11 00566 g001
Figure 2. (a) Quantum mechanical spectroscopic model for DNA nucleobases: there are two conical crossings between bright and dark states and between dark and ground states. (b) Spectral models describing the dynamics of DNA bases.
Photonics 11 00566 g002
Figure 3. The population dynamics of adenine, thymine, guanine, and cytosinethe. (ah) shows the normal-temperature (300 K) and low-temperature (77 K) population dynamics of the three-level model. The excited-state dynamics of the bright and dark states are plotted as red and blue dotted lines, respectively. The ground-state dynamics are shown by the black line.
Photonics 11 00566 g003
Figure 4. (a) geometric configuration of A-A nucleobase stacking, electronic transition dipoles μ i j and the center-to-center distance vector. (b) Watson–Crick ground state geometric configuration of A-T base pairs with bond lengths indicated in angstroms.
Photonics 11 00566 g004
Figure 5. (a,b) The population dynamics of A-A base stacking; (c,d) the population dynamics of A-T base pairs. The left and right panels show the normal-temperature (300 K) and low-temperature (77 K) population dynamics of the three-level model. The excited-state dynamics of bright and dark states are plotted as red and blue dotted lines, respectively. The ground-state dynamics are shown by the black line.
Photonics 11 00566 g005
Disclaimer/Publisher’s Note: The statements, opinions and data contained in all publications are solely those of the individual author(s) and contributor(s) and not of MDPI and/or the editor(s). MDPI and/or the editor(s) disclaim responsibility for any injury to people or property resulting from any ideas, methods, instructions or products referred to in the content.

