Abstract
High-precision time–frequency is widely used in time measurement, satellite navigation, scientific research, and other fields. With the rapid development of optical clock technology, the fractional frequency instability and uncertainty of optical clock have reached 10−18 orders of magnitude, which is expected to contribute to generating the International Atomic Time and may even be used to redefine the “second” in the future. Therefore, the long-distance transfer of time–frequency signals between optical atomic clocks is of great significance. Free-space optical frequency transfer technology is one of the important technologies for solving the space-based optical clock comparison because of its high transfer precision and easy networking characteristics. In order to solve the long-distance space-based optical clock comparison, this paper investigates a free-space active phase noise compensation method using an Acousto-Optic Modulator (AOM), based on the traditional optical fiber phase noise compensation scheme. This new method is more flexible and scalable than the optical fiber time–frequency transfer technology. The optical frequency transfer over a 64 m free-space link is demonstrated. The fractional frequency transfer instability during free running is 9.50 × 10⁻¹⁶ at 1 s, and 4.44 × 10⁻¹⁶ at 2000 s, and the fractional frequency instability after compensation is 7.10 × 10⁻¹⁷ at 1 s, 1.94 × 10⁻¹⁹ at 2000 s, which is about 1–3 orders of magnitude better than that in free running, and provides a feasible scheme for space-based optical clock comparison.
1. Introduction
High-precision time–frequency transfer technology can be applied to the field of fundamental physics research, including the verification of general relativity [1,2], dark matter detection [3], gravitational wave detection, etc. [4]. It can also be applied to other scientific and technological fields, such as time measurement [5], satellite navigation [6], geodesy [7], Very-Long-Baseline Interferometry (VLBI) [8,9], etc.
At present, the Two-Way Satellite Time and Frequency Transfer (TWSTFT) technology is mainly used to realize remote international time comparisons. The uncertainty of TWSTFT is about 1 ns [10], and the fractional frequency instability of TWSTFT is about 10−15–10−16 in one day [11,12]. The optical fiber time–frequency transfer technology is also used between time-keeping laboratories to achieve a high-precision time–frequency transfer. The uncertainty of an optical fiber time transfer can reach tens of ps, and the fractional frequency instability is about 10−19–10−20 per day [13,14,15,16,17].
In recent years, the maturity of optical clocks has been continuously improved, and the instability of neutral atomic optical lattice clocks can reach the order of 10−19, and the uncertainty can reach the order of 10−18 [18], which has laid a solid foundation for the redefinition of the “second”. In addition, the principle prototype of strontium atomic optical clocks for space stations developed by the National Time Service Center (NTSC) of the Chinese Academy of Sciences (CAS) has realized a closed-loop operation. The time-share self-comparison fractional frequency instability of this principle prototype is 2.6 × 10⁻¹⁵/τ1/2, and the in-loop instability is 3.3 × 10⁻¹⁷ when the integration time is 4096 s [19]. In the Kepler project, the German Aerospace Center and the German Research Center for Geosciences planned to carry ultra-narrow linewidth lasers or iodine molecular clocks on the next generation of Galileo satellites [20], whereby the index of ultra-narrow linewidth lasers is better than 2 × 10⁻¹⁵ at 1 s [21]. The fractional frequency instability of the iodine molecular clock is 6 × 10⁻¹⁵ at 1 s, and 3 × 10⁻¹⁵ at 1000 s [22]. The comparison between space optical frequency standards, such as the optical atomic clock or the ultra-narrow linewidth laser carried on the space station or satellite, as well as the comparison between space optical frequency standards and ground optical clocks, requires the support of the ultra-high-precision free-space optical time–frequency transfer technology. The accuracy of the traditional microwave time–frequency transfer technology cannot meet the demand, and the optical fiber time–frequency transfer technology cannot realize the comparison between atomic clocks in free space. The frequency instability of the classical laser time-transfer technology, based on a pulse time-of-flight measurement, is about the order of 10−16 [23,24,25,26], which cannot achieve the required comparison accuracy between optical clocks. Although free-space time–frequency comparison techniques based on optical combs are capable of achieving a fractional frequency comparison instability of 10−18–10−19 [27,28], the size and complexity of the optical frequency combs limit the types of satellites on which these systems can be deployed, thus limiting the range of scientific and industrial applications of such satellites. In contrast, the coherent optical frequency transfer technology requires only relatively simple optical transceiver hardware and therefore has advantages in terms of size, weight, and robustness, which are critical to the successful deployment of such systems on satellites. Moreover, the coherent optical frequency transfer has potential in the optical clock frequency comparison and the optical frequency Doppler velocity measurement. In 2010, K. Djerroud et al. (Paris Observatory, France) reported the realization of an optical frequency transfer in a 5 km atmosphere. The experiment did not adopt phase noise compensation, and the fractional frequency instability achieved 1.3 × 10⁻¹⁴ at 1 s and 2 × 10⁻¹⁵ at 100 s [29].
The phase noise introduced by the free-space link is too large, which leads to the poor precision of the transferred optical frequency. As such, it cannot meet the requirements of the optical clock comparison. In order to solve the problem, an active phase noise compensation method at the sender is proposed in this paper. The fractional frequency instability of the free-space optical frequency transfer link through 64 m can reach 7.10 × 10⁻¹⁷ at 1 s, and 1.94 × 10⁻¹⁹ at 2000 s, which can support the frequency transfer and the comparison of optical clocks.
The structure of this paper is as follows: Section 1 introduces the present situation of high-precision time–frequency transfer technology and the necessity of free-space optical frequency transfer technology. Section 2 introduces the basic principles of the active phase noise compensation at the sender for the optical frequency transfer technique. Section 3 introduces the experimental results and the discussion. Finally, conclusions are given.
2. Experimental Methods
2.1. Experimental Principle
The active phase noise compensation technology uses round-trip signals through the transmission link to measure and compensate for phase fluctuations caused by interference on the link. This technology was first proposed by Ma and his colleagues [30] and is mainly applied in optical fiber time–frequency transfer technology. The active phase noise compensation technology is utilized either in the sender or in the receiver. In sender compensation mode, the optical signal passes through the transmission channel twice, while in the receiver compensation mode, the optical signal passes three times. Compared with the receiver compensation method, the sender compensation method has less attenuation of the optical signal, which is a great advantage in the application of satellites where optical fiber time–frequency transfers encounter low remaining power. Due to the large amount of backscattering introduced by the optical fiber, two AOMs are usually used to eliminate it [31]. Compared with the optical fiber time–frequency transfer system, the free-space optical time–frequency transfer system contains shorter optical fiber with less backscattering. Therefore, we propose using sender active phase noise compensation for the free-space optical frequency transfer method based on a single AOM. The frequency transfer principle of active phase noise compensation in free space is shown in Figure 1.
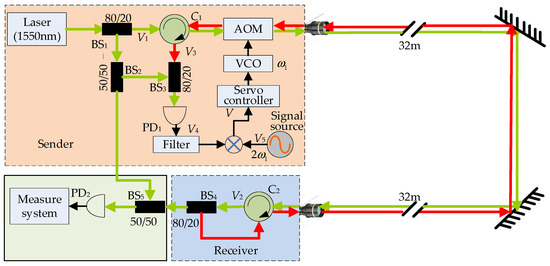
Figure 1.
Schematic diagram of an optical frequency transfer experiment in free space.
At the sender, the optical frequency signal output of the laser is denoted as follows:
where A is the amplitude of the optical frequency signal, which has nothing to do with the subsequent phase transformation process, and is omitted from the following formulas for convenience.
The light emitted by the laser is coupled by the beam splitter BS1 and beam splitter BS2 to a part of the optical signal :
After the optical fiber circulator, through the AOM driven by the Voltage Controlled Oscillator (VCO) into the collimator, and then through the free-space optical path transmission to the receiving end, the optical signal at this time is :
where, is the phase introduced by the AOM, is the phase of the signal source, and is the phase noise introduced by the free-space link during the optical signal transmission.
After the optical signal reaches the receiving end through the fiber splitter, a part of the signal consists of the optical frequency signal that can be used by the receiver, and the other part is returned to the transmitting side in the same way as before. The returned optical signal, derived from the optical fiber through the optical fiber circulator, is as follows:
Since the return signal passes through the AOM again, the phase introduced by the AOM is also doubled. After combining the optical signals and with the detector, the beat frequency of the two signals can be obtained as follows:
After mixing the signals with from the microwave source and filtering, an error signal is generated to control the VCO:
Use this error signal to control the frequency of the VCO so that it always satisfies , with C as a certain constant. Obviously, there is also , with D as a constant. In this way, the signal received by the user can be expressed as follows:
It can be seen that the signal does not contain the phase noise introduced by the link, and the signal instability is the same as that of the transmitting signal .
2.2. Experimental System Construction
We built a demonstration and verification system for the free-space optical frequency transfer using the active phase noise compensation technology with the configuration shown in Figure 1. The system is mainly composed of a narrow linewidth laser, an AOM, two circulators, two collimators, a VCO, a servo controller, two photodetectors, a signal source, a test system, etc. The narrow linewidth continuous-wave laser source E15, with a center wavelength of 1550.12 nm, and produced by NKT Photonics, is used as the optical frequency reference. The linewidth is less than 100 Hz and the output power is 40 mW. The optical fiber collimator 60FC-L-4-M60-08 is produced by Schafter + Kirchhoff (Hamburg, Germany) with a numerical aperture of 0.14, focal length of 60.5 mm, maximum clear aperture of 16 mm, collimated beam diameter of 10.9 mm, and beam divergence of 0.04 mrad. Through actual measurement, it was found that the coupling efficiency was about 70%, and the maximum working distance was about 64 m with the 1550 nm wavelength. Therefore, this paper chose the 64 m length for the verification. The servo controller is an LB1005 produced by Newport Company (Irvine, CA, USA), and the error control voltage range is ±10 V. The AOM with a +80 MHz center frequency is produced by GOOCH & HOUSEGO (Ilminster, UK).
The signal processing flow of the phase noise compensation at the sender is as follows: the laser signal generated by the narrow linewidth laser is split into two paths by a (80:20) fiber beam splitter BS1. Of the total amount, 80% of the branch light passes through the optical fiber circulator C1 and then undergoes an AOM frequency shift of +80 MHz to arrive at the receiver via the free-space folding optical path. The receiver circulator C2 receives the signal and sends 80% of it back to the sender via the circulator C2, the collimator, and the beam splitter BS4 (80:20). The signal received by the sender’s collimator passes through the AOM and C1 again and enters the beam splitter BS3. Then, 20% of the branch optical signal output by BS1 passes through a 50:50 beam splitter BS2, splitting the light into two paths. One branch signal combines with the output signal of BS3 and then passes into detector 1. The returned light detected at photodetector 1, along with the beat frequency signal of the local reference signal, passes through the filter and combines with the 160 MHz signal generated by the frequency source. The combined signal then passes through the phase detector to generate the error signal of the phase noise compensation. The error signal is then fed back to the 80 MHz crystal oscillator via the LB1005 high-speed servo controller (PID controller), which generates an 80 MHz signal to drive the AOM for phase noise compensation. The other signal of the optical fiber beam splitter BS2 (50%) reaches the optical fiber beam splitter 5 and beats with the output signal of the beam splitter BS4 (20%) to evaluate the frequency instability of the signal transmitted to the receiver.
For an easy evaluation, both the sender and the receiver were placed on an optical platform. On another optical platform with a length of 32 m, two planar mirrors were placed at 90 degrees of each other to fold the optical path and increase the path length of the light transmission.
As shown in Figure 1, in this experiment, we set the center frequency of the VCO to 80 MHz, and the output frequency of the signal source to 160 MHz (), so that the error signal after the mixing and filtering was close to 0. We used rubidium atomic clocks to provide a frequency reference for the signal sources and counters.
In order to evaluate the frequency instability of the signal after the link compensation, we sent the optical frequency signal reproduced at the receiver and the optical frequency signal at the sender to the detector, then used a Keysight 53230A frequency counter (Keysight, Santa Rosa, CA, USA) to measure the frequency of the beat signal. The frequency instability of the collected frequency data was analyzed and processed by the Stable32 V1.5 software.
The phase noise of the in-loop beat signal at photodetector 1 represents the phase noise introduced by the optical signal through the free-space link twice. The phase noise of the out-of-loop beat signal at photodetector 2 represents the phase change introduced by the transmitted optical signal through a free-space link. The InGaAs amplifier photodetector (Thorlabs Inc., Newton, NJ, USA) with a low noise and high gain was used in the experiment. The maximum bandwidth was 250 MHz and the wavelength response range was 800–1700 nm.
3. Results and Discussion
3.1. Frequency Instability Performance Evaluation
In order to fully evaluate the performance of the stable free-space laser link, we constructed a 64 m free-space laser link based on the active phase noise compensation using the principles shown in Figure 1. The experiments of a free-space laser transfer under conditions of free running and active phase noise compensation, respectively, were carried out. The data after 4 h of stabilized operation were measured. The Stable32 V1.5 software was used to analyze the frequency instability, and the value of the frequency instability was obtained. The experimental results are shown in Figure 2. Two sets of data are plotted in a graph for easy comparison.

Figure 2.
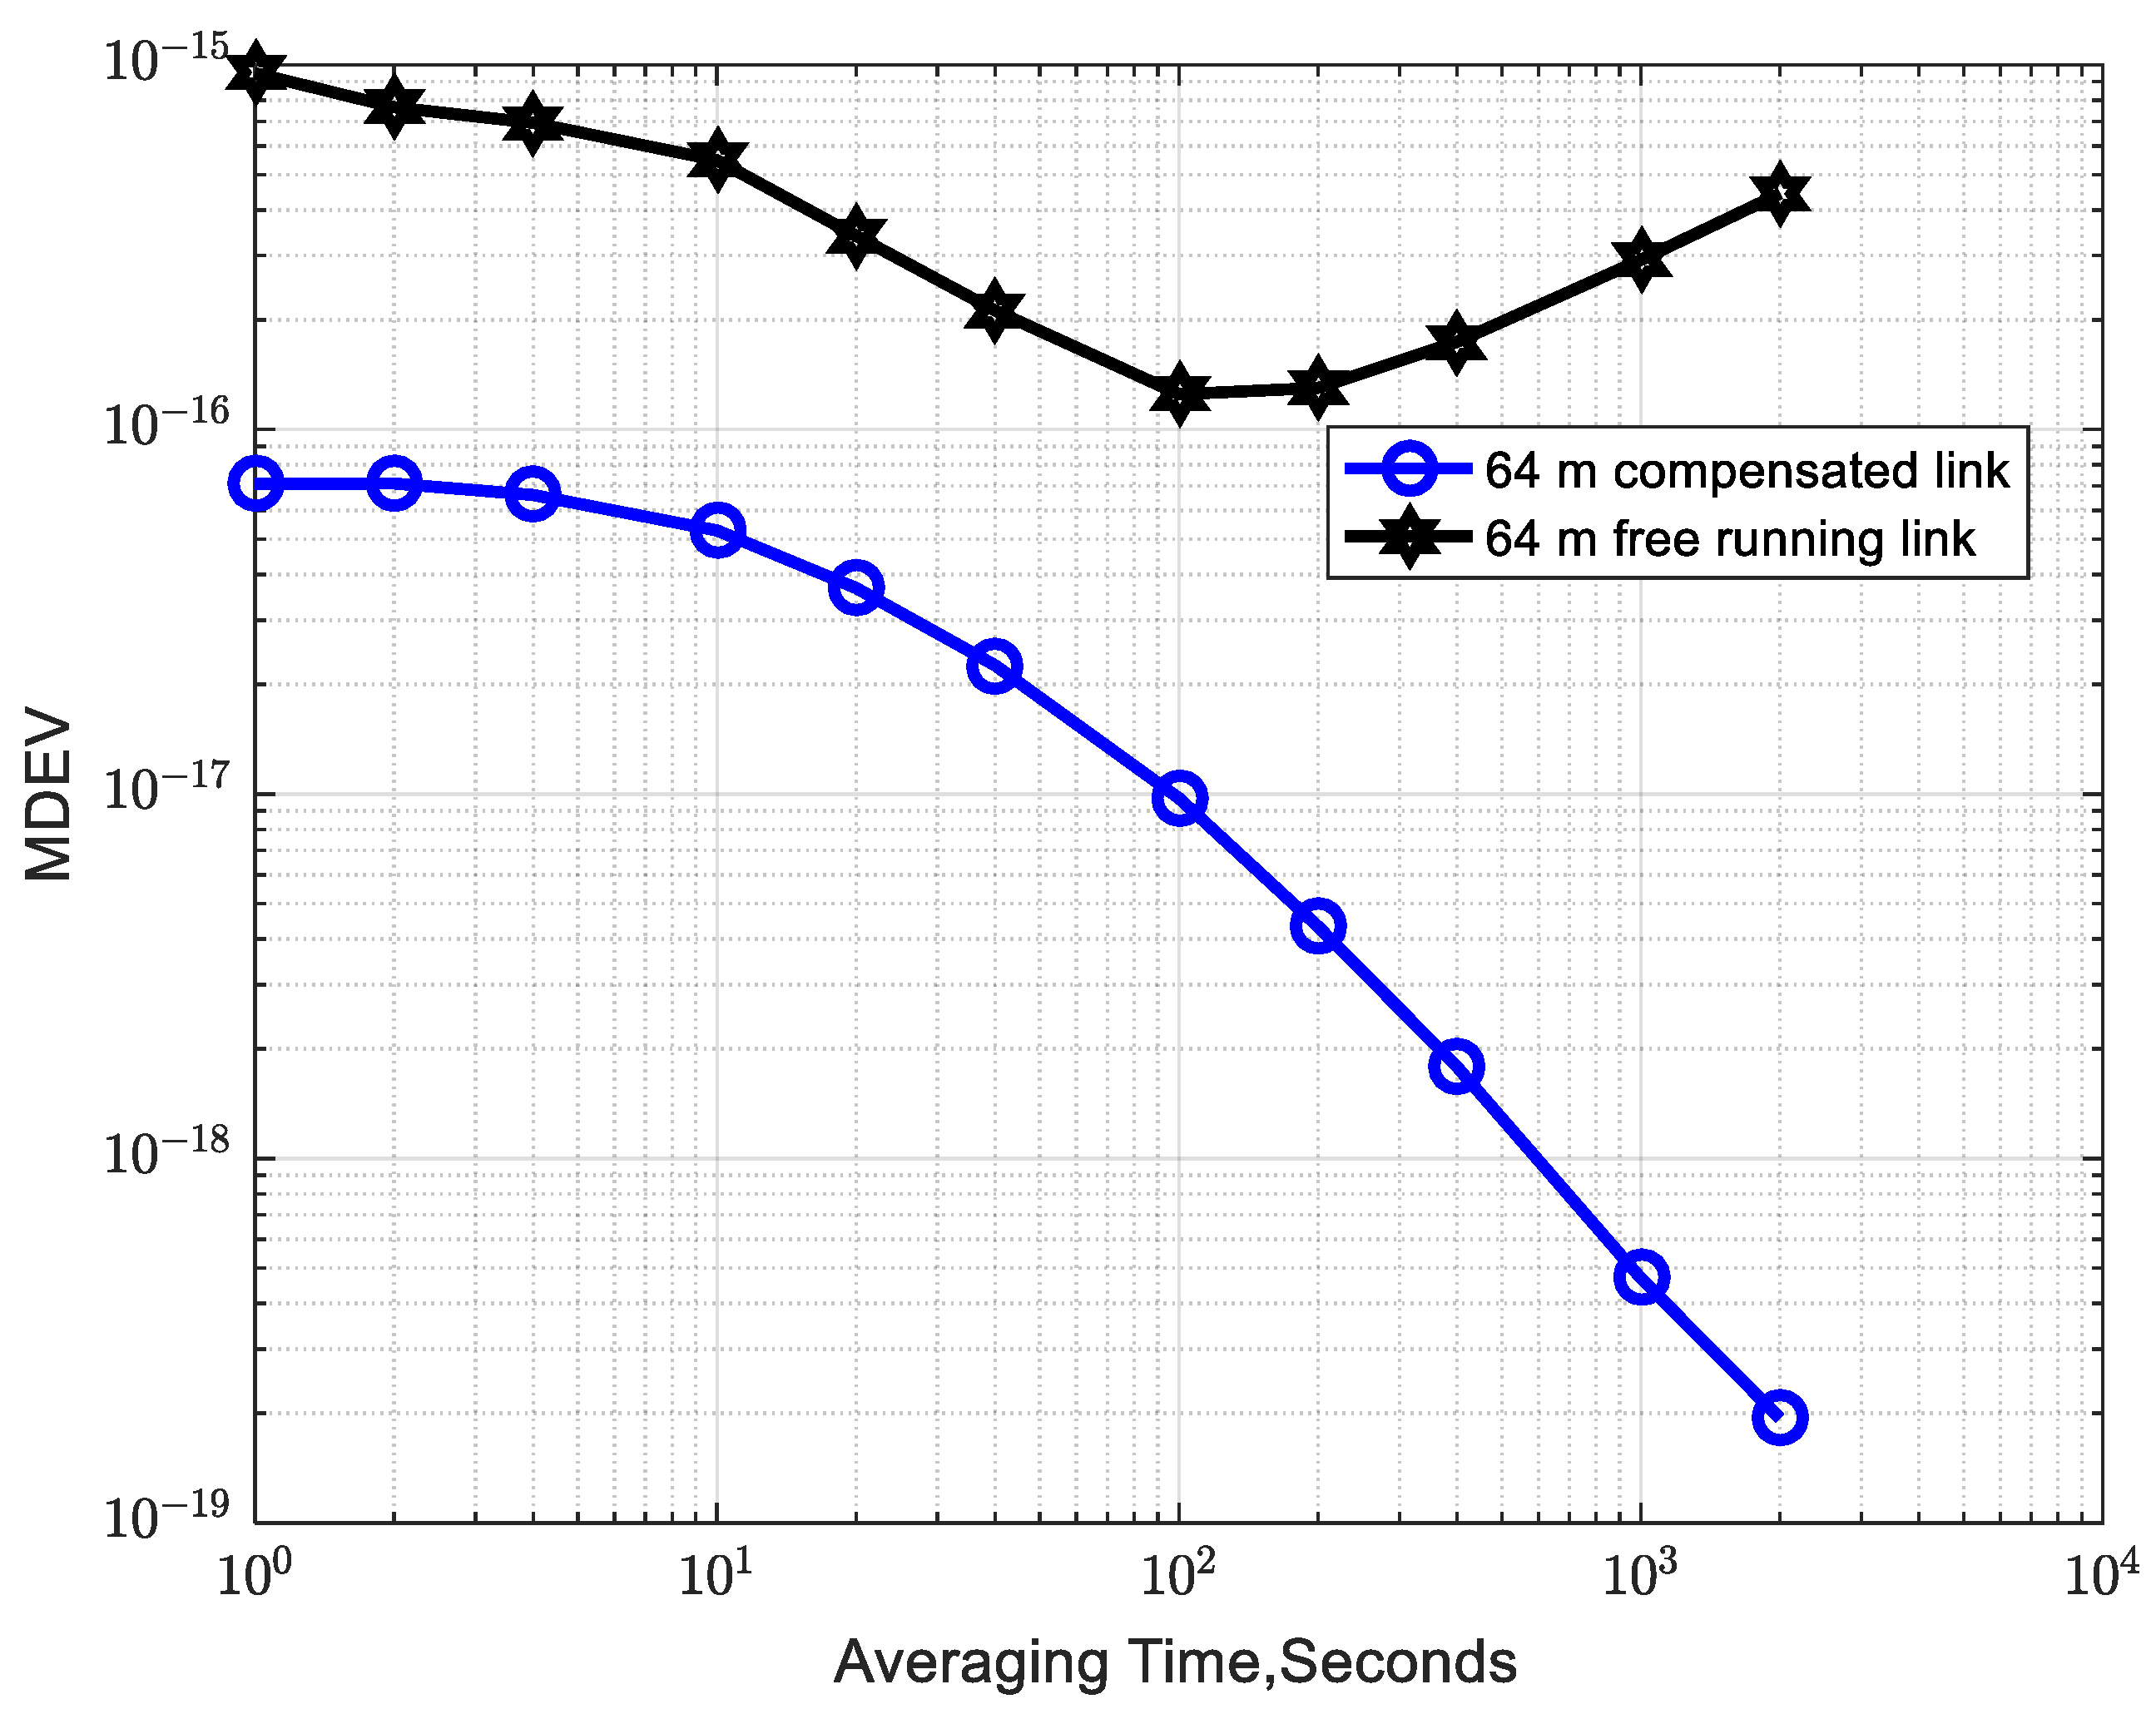
Additional fractional frequency instability diagram of 64 m indoor space laser frequency transfer experiment link.
The black curve (hexagon) in Figure 2 shows the additional frequency instability of the 64 m free-space laser transfer link under free-running conditions. We used the Modified Allan Deviation (MDEV) to characterize the additional fractional frequency instability of the link. The results show that when the integration time is 1 s, the MDEV is 9.50 × 10⁻¹⁶. When the integration time reaches 100 s, the MDEV decreases to 1.25 × 10⁻¹⁶. The integration time from 1 s to 100 s shows a decreasing trend, which is mainly affected by frequency modulation flicker noise, phase modulation flicker noise, and frequency modulation white noise. Over 100–2000 s, the curve trend begins to rise, and by 2000 s, the MDEV rises to 4.44 × 10⁻¹⁶. In this period, it is mainly affected by frequency modulation flicker noise and random walk noise.
The blue curve (circular) in Figure 2 shows the additional fractional frequency instability of the 64 m spatial laser frequency transfer link after active phase noise compensation. The results show that when the integration time is 1 s, the MDEV is 7.10 × 10⁻¹⁷. When the integration time reaches 10 s, the MDEV decreases to 5.28 × 10⁻¹⁷. The integration time from 1 s to 10 s shows a slower decreasing trend, which is mainly affected by frequency modulation flicker noise and frequency modulation white noise. Over 10–100 s, the curve trend continues to decline, mainly due to the influence of phase modulation white noise and phase modulation flicker noise. At 100 s, the MDEV drops to 9.74 × 10⁻¹⁸. In the 100–2000 s, the downward trend is intensified, mainly due to frequency-modulated white noise and phase-modulated flicker noise. In the 2000 s, the MDEV drops to 1.94 × 10⁻¹⁹.
Compared with free running, after active phase noise compensation, the additional fractional frequency instability of the laser link is improved by more than one order of magnitude at 1–100 s. During 100–2000 s, the additional fractional frequency instability of the laser link is improved by 1–3 orders of magnitude.
3.2. Analysis of Optical Frequency Transfer Accuracy
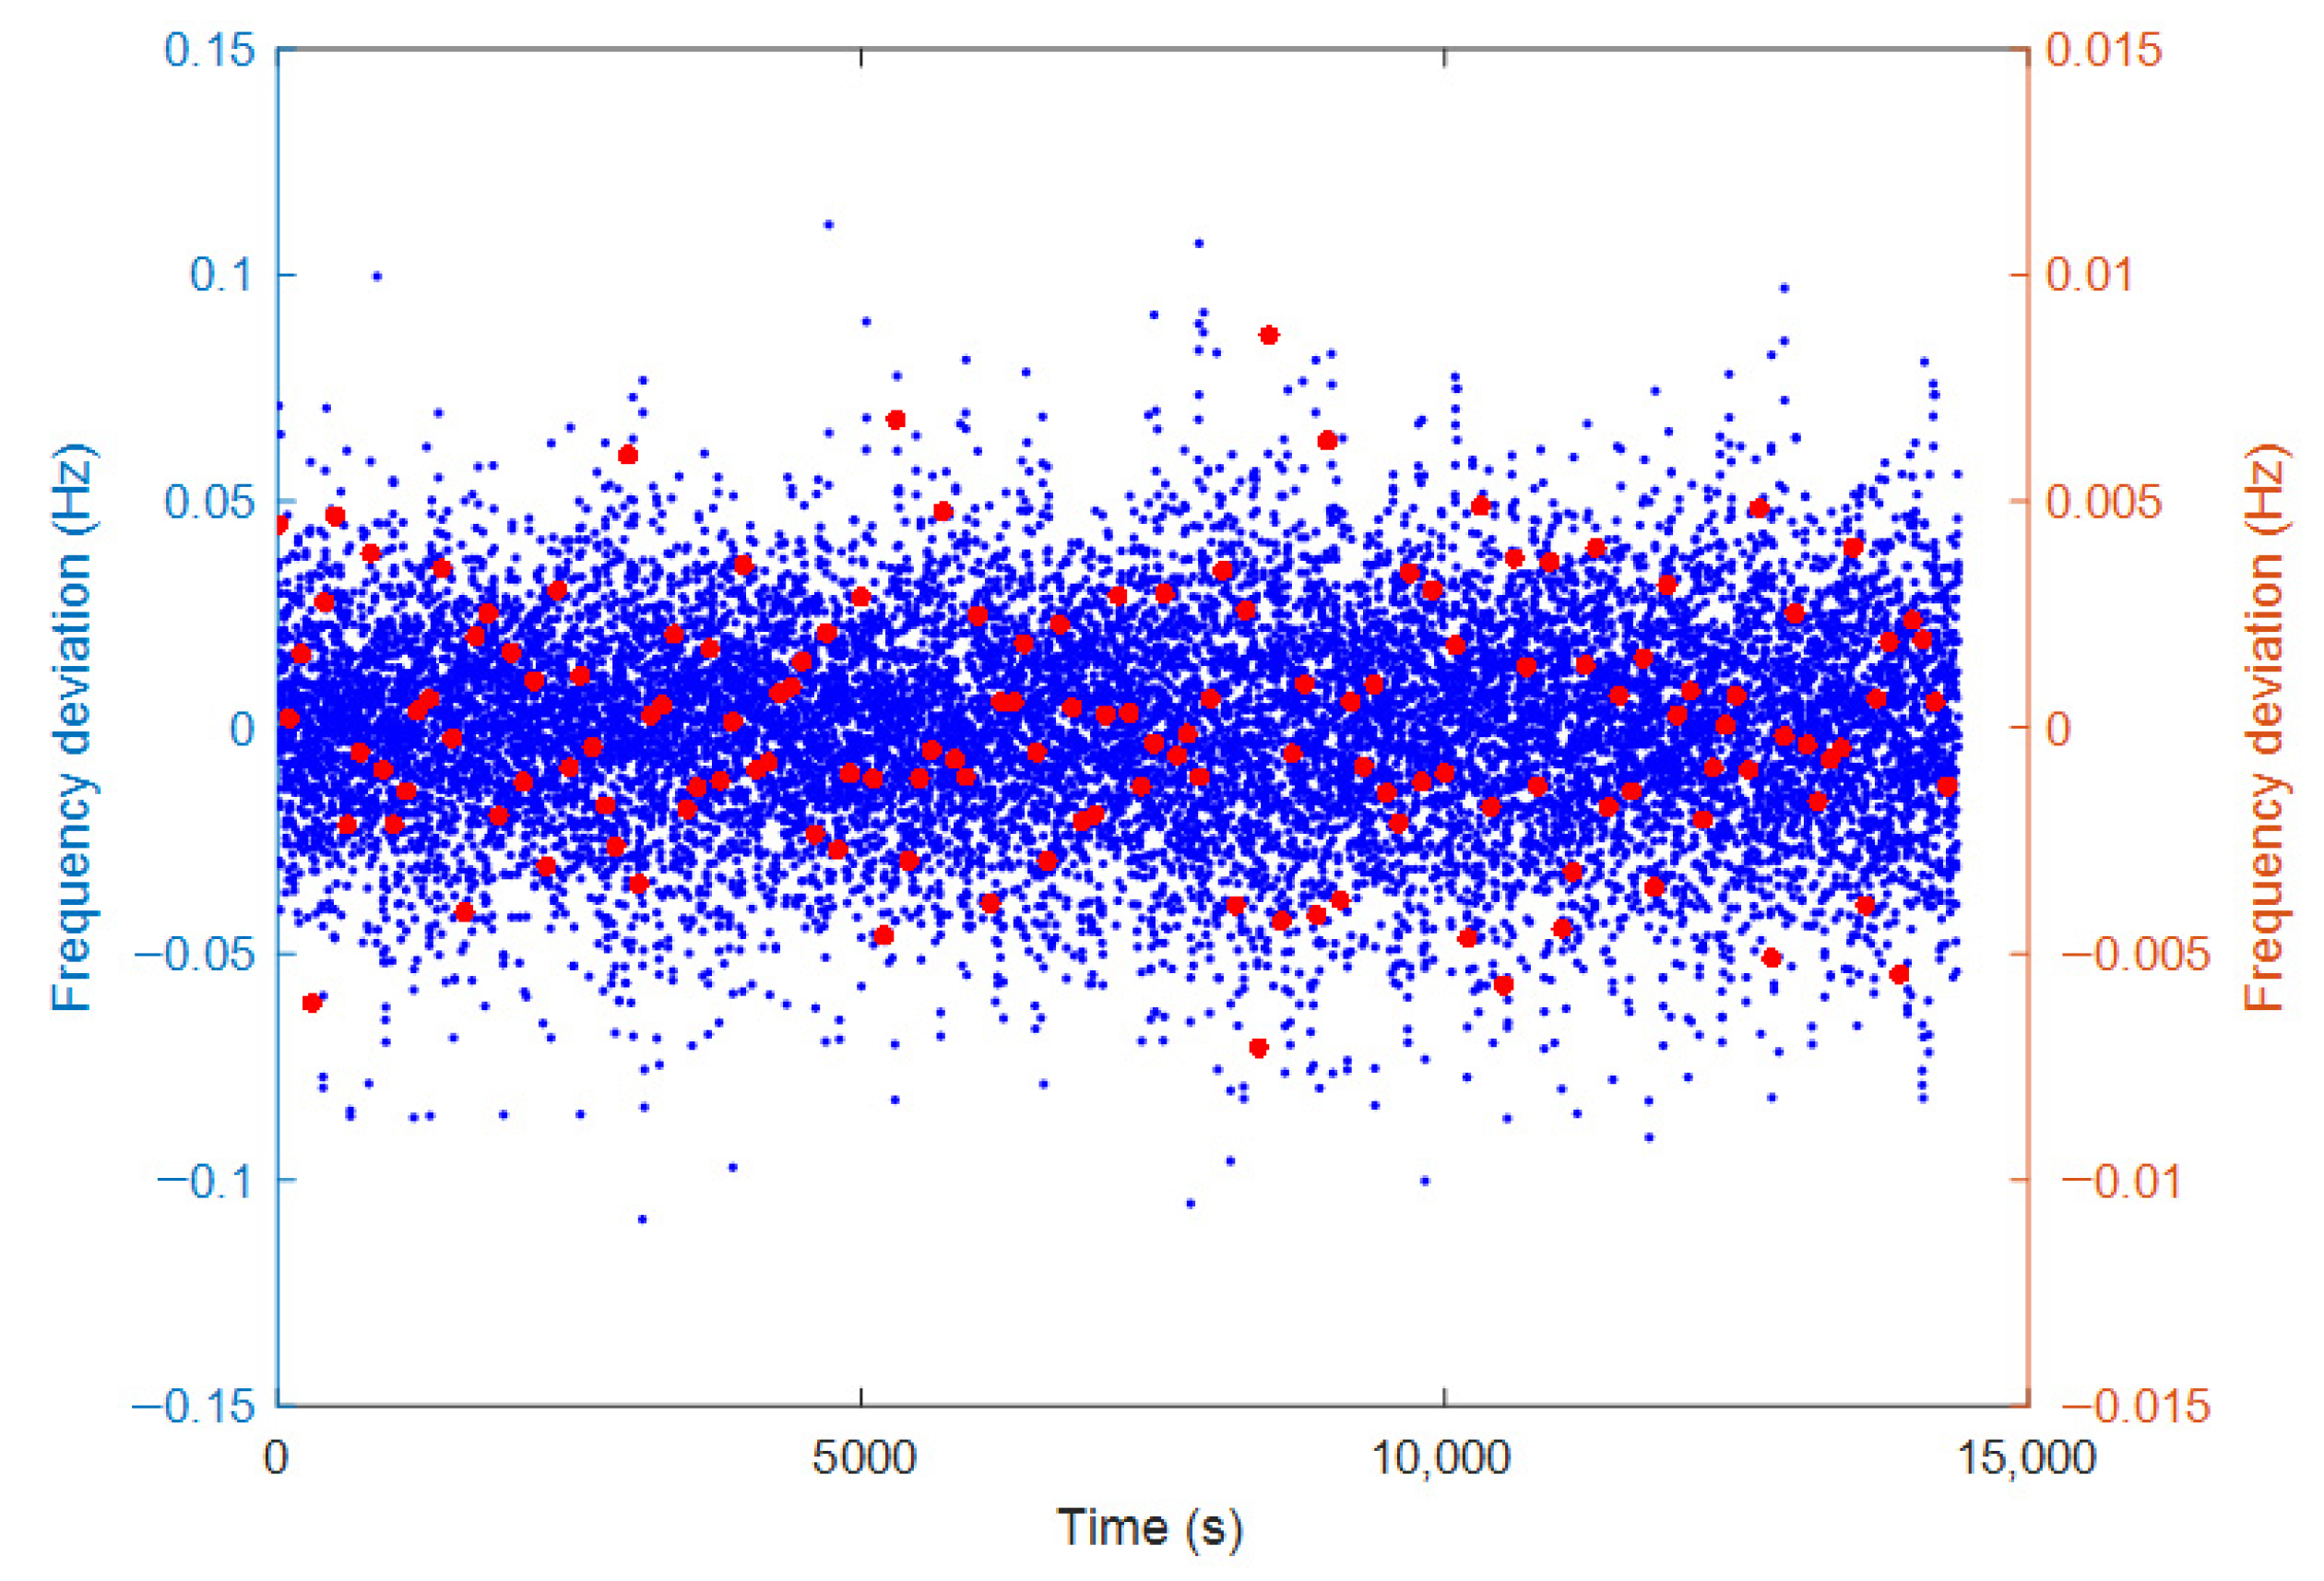
In order to reveal any frequency deviation of the transferred laser that may not be revealed in the assessment of fractional frequency instability, we further evaluated the accuracy of the optical frequency transfer. Figure 3 shows the frequency deviation of the beat signal with a total of 14,400 data points (left axis) recorded in a 1 s sampling time. By averaging the data for every 100 s, 144 data points are obtained, as shown in the right axis of Figure 3. The arithmetic mean of the total 144 data points is 35.8 μHz (1.85 × 10⁻¹⁹) and the standard deviation is 2.8 mHz (1.45 × 10⁻¹⁷). Based on the relevant theories in reference [32], we conservatively estimated the accuracy of the transmitted optical signal to be 1.2 × 10⁻¹⁸. We can conclude that there is no systematic frequency offset between the send and transmitting frequencies at the level of 10−18.

Figure 3.
Relative frequency deviation between the beat signal and the nominal 80 MHz signal. The blue dots represent the relative frequency deviation of 1 s data; the red dots represent the relative frequency deviation of 100 s average data.
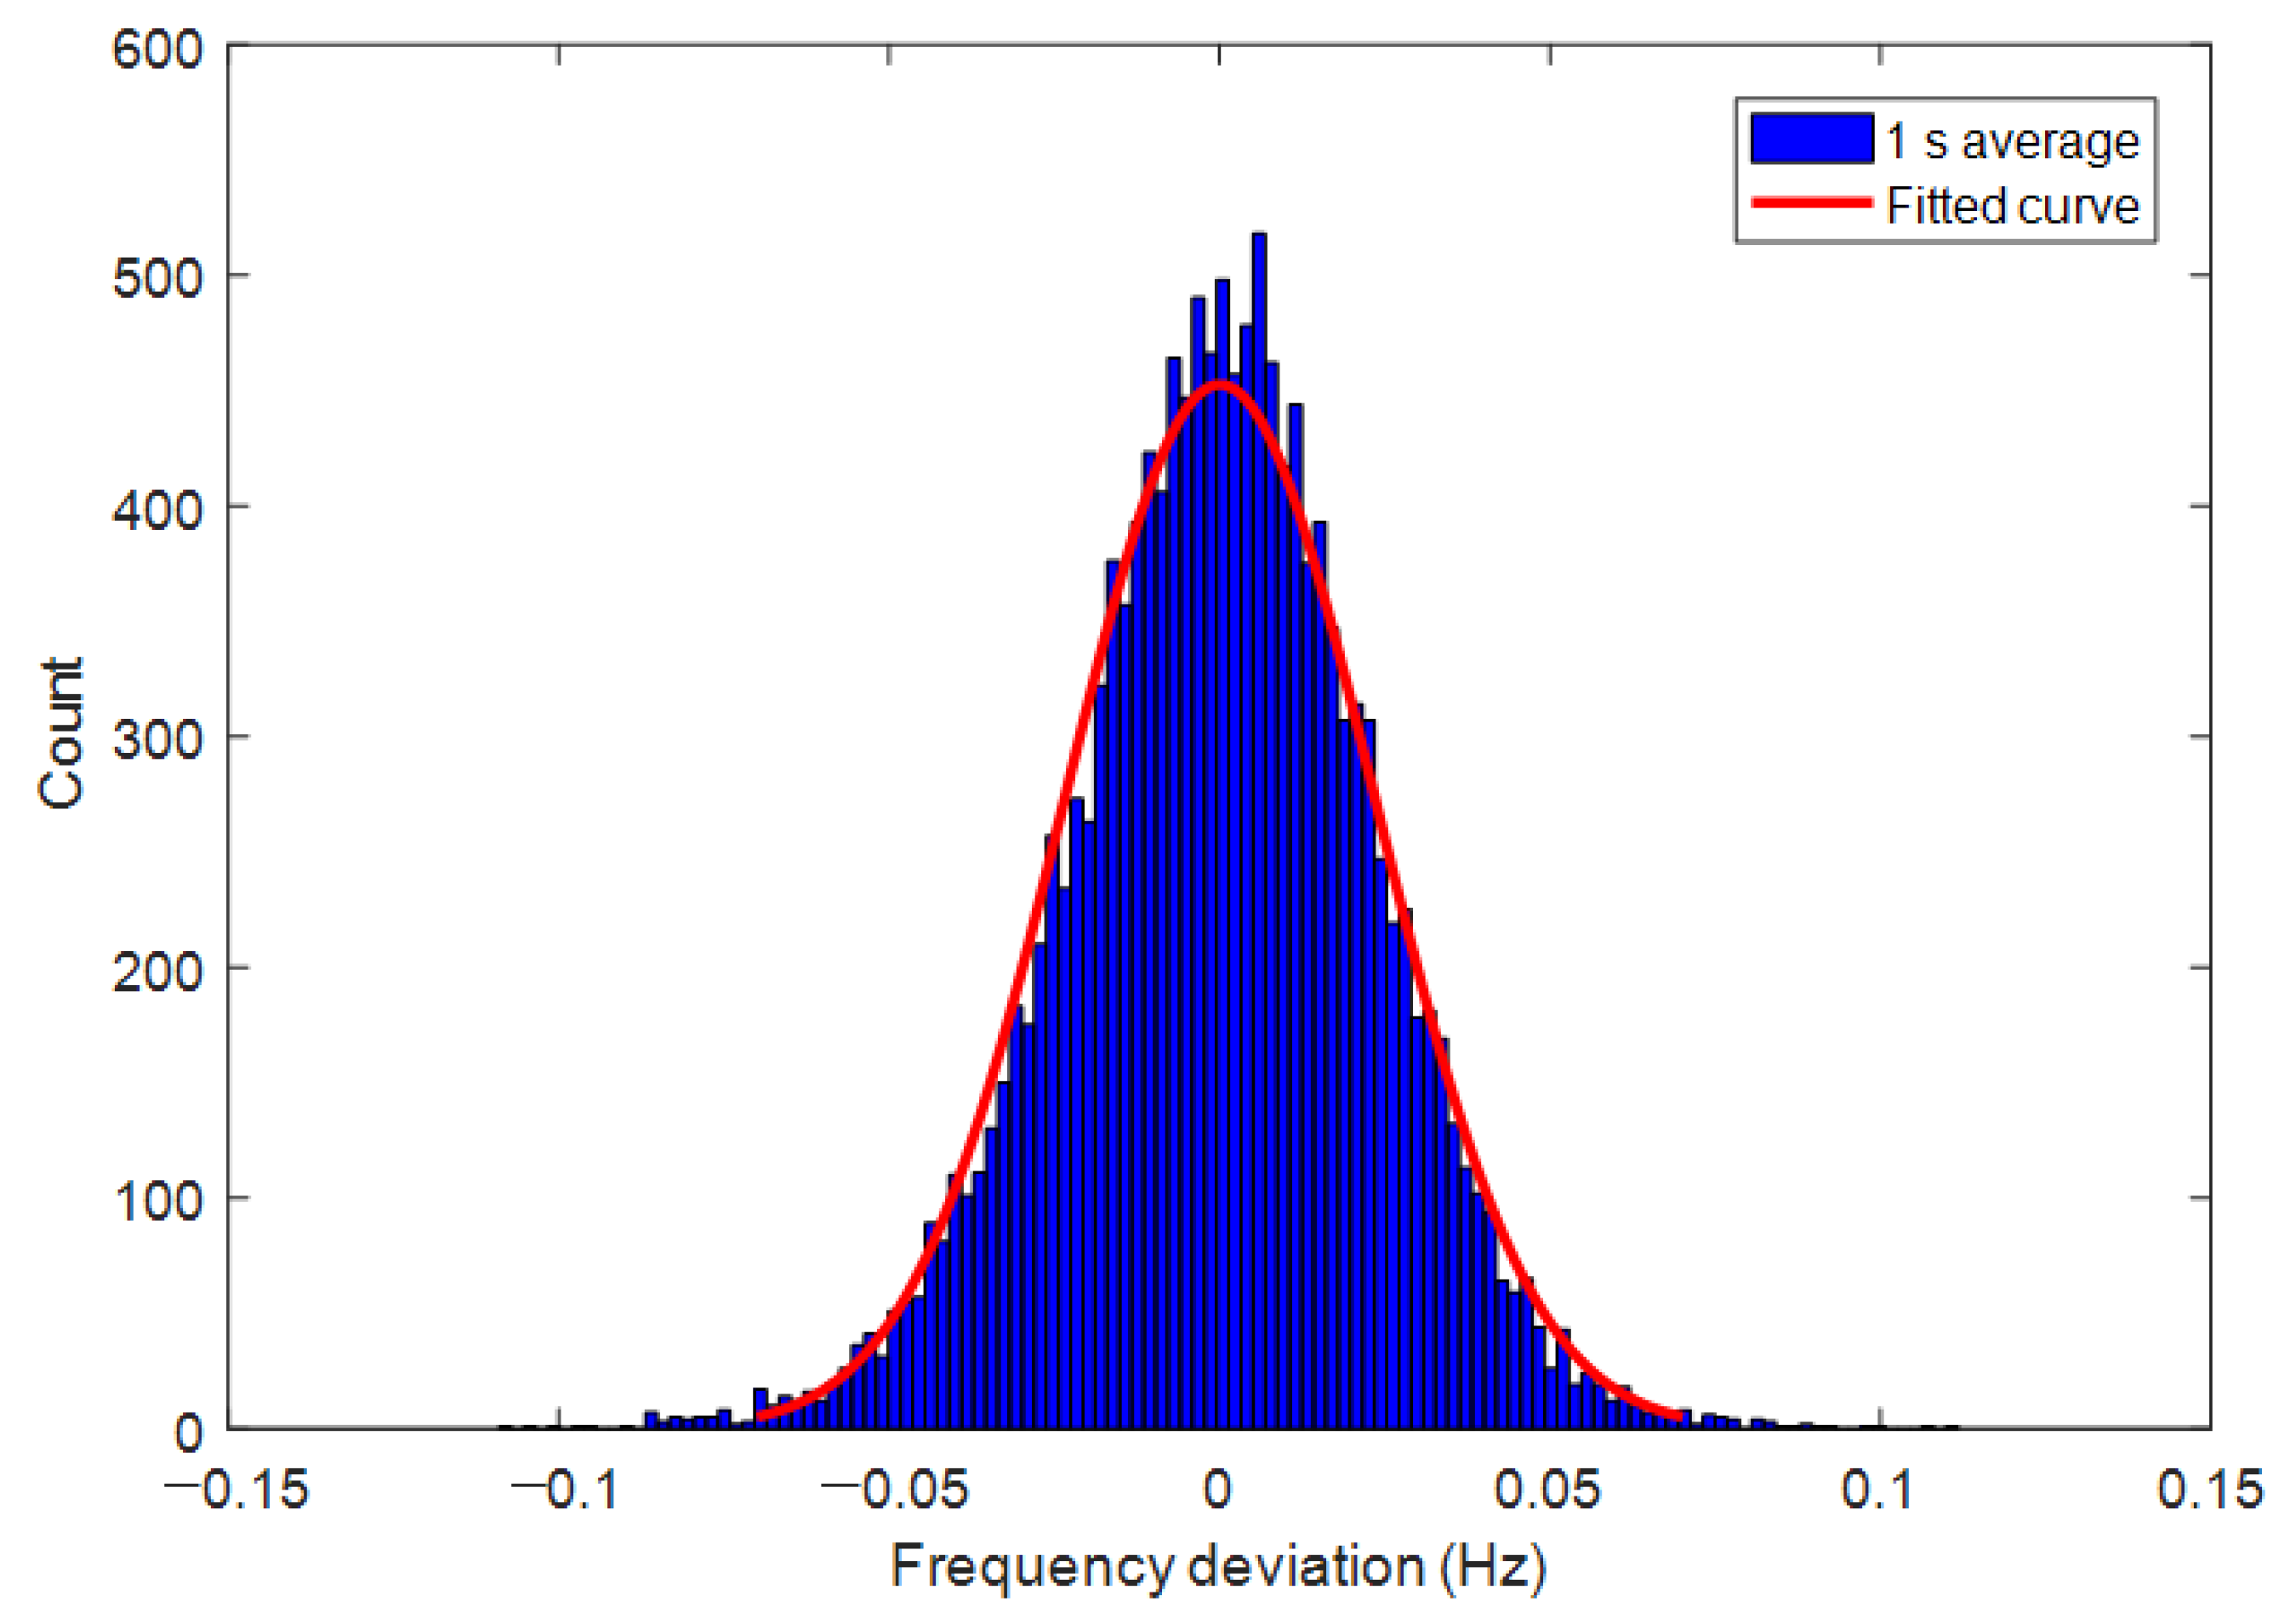
The histogram and fitting of the frequency deviation are shown in Figure 4 and Figure 5, respectively. The blue bar graph and red curve in Figure 4 represent the histogram and Gaussian fitting curve corresponding to the relative frequency deviation between the beat signal and the nominal 80 MHz signal by using the 1 s data. As can be seen from the histogram, most of the 1 s data are concentrated within ±0.08 Hz. From the Gaussian fitting curve, it can be seen that the Gaussian curve is highly consistent with the histogram and that the data show a normal distribution.
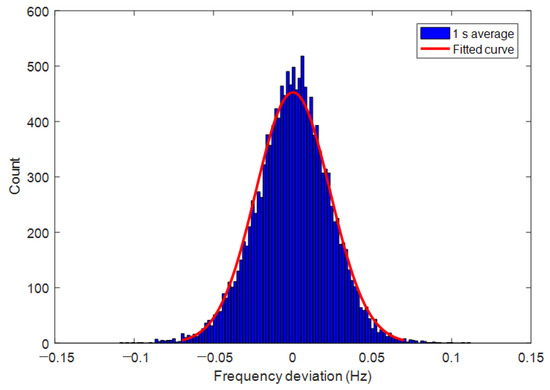
Figure 4.
Histogram and Gaussian fitting curve corresponding to frequency deviation between beat signal and the nominal 80 MHz signal (1 s data).
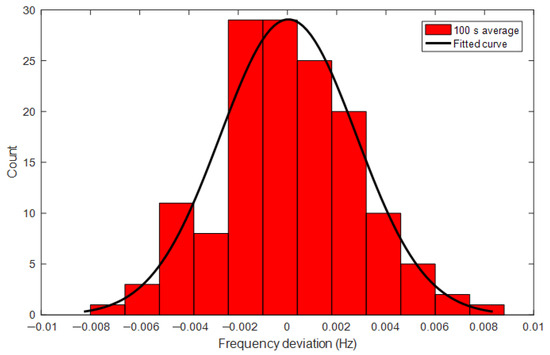
Figure 5.
Histogram and Gaussian fitting curve corresponding to frequency deviation between beat signal and the nominal 80 MHz signal (100 s data average).
In Figure 5, the red bar graph and the black curve, respectively, represent the histogram and Gaussian fitting curve corresponding to the data after a 100 s average of the frequency deviation data between using the beat signal and the nominal 80 MHz signal. As can be seen from the histogram, most of the data after the 100 s average are concentrated within ±0.008 Hz. From the Gaussian fitting curve, it can be seen that the Gaussian curve deviates slightly from the histogram. The slight deviation from the Gaussian shape is mainly caused by the asymmetric part of the fiber being subjected to temperature drifts, vibrations, etc., which are not in the compensation loop. To suppress this effect, temperature control of the asymmetric part of the fiber is required.
This experiment is carried out in the indoor passageway, and the atmospheric environment is relatively stable. When the free-space optical frequency transfer system is placed outdoors, the system will be affected by atmospheric turbulence. When the turbulence is strong, it will cause the optical signal power coupled to the collimator to fluctuate and will cause the round-trip path delay to jitter, resulting in the phase noise compensation being more difficult, and finally leading to the deterioration of the fractional frequency instability of the free-space optical frequency transfer system [33,34,35]. In order to achieve a better frequency transfer effect, it is necessary to increase the adaptive optical terminal and other devices to stabilize the power of the received signal based on the method proposed in this paper. In the next step, we plan to use this scheme to carry out experimental research on the free-space optical frequency transfer at the order of kilometers under outdoor strong turbulence conditions.
4. Conclusions
Oriented to the space-based optical clock comparison problem, an active phase noise compensation free-space optical frequency transfer method is proposed, which is based on the active phase noise compensation of an AOM. Compared with other domestic and international optical fiber frequency transfers, this method has a simpler structure, lighter weight, and lower cost, so it is more suitable for spaceborne applications.
In this paper, a free-space optical frequency demonstration and verification system was constructed, and a 64 m free-space optical frequency transfer technology test based on active phase noise compensation was carried out. The experiment shows that compared with free running, after adopting active phase noise compensation at the sender, the MDEV is 7.10 × 10⁻¹⁷ when the integration time is 1 s, and MDEV decreases to 1.94 × 10⁻¹⁹ when the integration time is 2000 s. There is a 1–3 order-of-magnitude improvement in the fractional frequency instability of the laser link. The uncertainty of the frequency transfer can reach 1.2 × 10⁻¹⁸. Hence, the scheme of the sender compensation optical frequency transfer based on an AOM proposed in this paper simplifies the receiver equipment and can provide technical support for the optical clocks transfer comparison.
Author Contributions
Conceptualization, G.W. and Y.H.; methodology, G.W. and Z.L.; software, Z.L.; validation, G.W. and Z.L.; formal analysis, G.W. and Z.L.; investigation, X.L. and K.H; resources, Y.H. and X.J.; data curation, Z.L.; writing—original draft preparation, G.W.; writing—review and editing, Z.L., X.L. and K.H.; visualization, G.W. and K.H.; supervision, Y.H. and X.J.; project administration, G.W., X.J. and Y.H.; funding acquisition, G.W., X.J. and Y.H. All authors have read and agreed to the published version of the manuscript.
Funding
This research was funded by National Natural Science Foundation of China (Grant No. 12373079). This research was also supported by National Key Research and Development Program of China (Grant No. 2023YFC2205501, 2023YFC2205502 and 2023YFC2205504), Key Research Program (Grant No. 2019-JCJQ-ZD-342-00) and Technical Basic Research Projects (Grant No. JSJL2020203B001).
Institutional Review Board Statement
Not applicable.
Informed Consent Statement
Not applicable.
Data Availability Statement
The data presented in this study are available on reasonable request from the corresponding authors.
Conflicts of Interest
The authors declare no conflicts of interest.
References
- Delva, P.; Puchades, N.; Schönemann, E.; Dilssner, F.; Courde, C.; Bertone, S.; Gonzalez, F.; Hees, A.; Le Poncin-Lafitte, C.; Meynadier, F.; et al. Gravitational Redshift Test Using Eccentric Galileo Satellites. Phys. Rev. Lett. 2018, 121, 231101. [Google Scholar] [CrossRef] [PubMed]
- Altschul, B.; Bailey, Q.G.; Blanchet, L.; Bongs, K.; Bouyer, P.; Cacciapuoti, L.; Capozziello, S.; Gaaloul, N.; Giulini, D.; Hartwig, J.; et al. Quantum tests of the Einstein Equivalence Principle with the STE–QUEST space mission. Adv. Space Res. 2015, 55, 501–524. [Google Scholar] [CrossRef]
- Derevianko, A.; Pospelov, M. Hunting for topological dark matter with atomic clocks. Nat. Phys. 2014, 10, 933–936. [Google Scholar] [CrossRef]
- Kolkowitz, S.; Pikovski, I.; Langellier, N.; Lukin, M.D.; Walsworth, R.L.; Ye, J. Gravitational wave detection with optical lattice atomic clocks. Phys. Rev. D 2016, 94, 124043. [Google Scholar] [CrossRef]
- Takamoto, M.; Ushijima, I.; Das, M.; Nemitz, N.; Ohkubo, T.; Yamanaka, K.; Ohmae, N.; Takano, T.; Akatsuka, T.; Yamaguchi, A.; et al. Frequency ratios of Sr, Yb, and Hg based optical lattice clocks and their applications. Comptes Rendus Phys. 2015, 16, 489–498. [Google Scholar] [CrossRef]
- Lewandowski, W.; Arias, E.F. GNSS times and UTC. Metrologia 2011, 48, S219–S224. [Google Scholar] [CrossRef]
- Lion, G.; Panet, I.; Wolf, P.; Guerlin, C.; Bize, S.; Delva, P. Determination of a high spatial resolution geopotential model using atomic clock comparisons. J. Geod. 2017, 91, 597–611. [Google Scholar] [CrossRef]
- Krehlik, P.; Buczek, Ł.; Kołodziej, J.; Lipiński, M.; Śliwczyński, Ł.; Nawrocki, J.; Nogaś, P.; Marecki, A.; Pazderski, E.; Ablewski, P.; et al. Fibre-optic delivery of time and frequency to VLBI station. Astron. Astrophys. 2017, 603, A48. [Google Scholar] [CrossRef]
- Clivati, C.; Aiello, R.; Bianco, G.; Bortolotti, C.; De Natale, P.; Di Sarno, V.; Maddaloni, P.; Maccaferri, G.; Mura, A.; Negusini, M.; et al. Common-clock very long baseline interferometry using a coherent optical fiber link. Optica 2020, 7, 1031–1037. [Google Scholar] [CrossRef]
- Jiang, Z.; Zhang, V.; Huang, Y.-J.; Achkar, J.; Piester, D.; Lin, S.-Y.; Wu, W.; Naumov, A.; Yang, S.-h.; Nawrocki, J.; et al. Use of software-defined radio receivers in two-way satellite time and frequency transfers for UTC computation. Metrologia 2018, 55, 685–698. [Google Scholar] [CrossRef]
- Bauch, A.; Achkar, J.; Bize, S.; Calonico, D.; Dach, R.; Hlavać, R.; Lorini, L.; Parker, T.; Petit, G.; Piester, D.; et al. Comparison between frequency standards in Europe and the USA at the 10−15 uncertainty level. Metrologia 2006, 43, 109–120. [Google Scholar] [CrossRef]
- Fujieda, M.; Takiguchi, H.; Achkar, J.; Abgrall, M.; Guena, J.; Riedel, F.; Benkler, E.; Weyers, S.; Piester, D. Carrier-phase two-way satellite frequency transfer between LNE-SYRTE and PTB. In Proceedings of the 2016 European Frequency and Time Forum (EFTF), York, UK, 4–7 April 2016; pp. 1–4. [Google Scholar]
- Wang, B.; Gao, C.; Chen, W.L.; Miao, J.; Zhu, X.; Bai, Y.; Zhang, J.W.; Feng, Y.Y.; Li, T.C.; Wang, L.J. Precise and continuous time and frequency synchronisation at the 5 × 10⁻¹⁹ accuracy level. Sci. Rep. 2012, 2, 556. [Google Scholar] [CrossRef] [PubMed]
- Droste, S.; Ozimek, F.; Udem, T.; Predehl, K.; Hansch, T.W.; Schnatz, H.; Grosche, G.; Holzwarth, R. Optical-frequency transfer over a single-span 1840 km fiber link. Phys. Rev. Lett. 2013, 111, 110801. [Google Scholar] [CrossRef] [PubMed]
- Xue, W.; Zhao, W.; Quan, H.; Xing, Y.; Zhang, S. Cascaded Microwave Frequency Transfer over 300-km Fiber Link with Instability at the 10−18 Level. Remote Sens. 2021, 13, 2182. [Google Scholar] [CrossRef]
- Hu, L.; Tian, X.; Wu, G.; Chen, J. Passive optical phase noise cancellation. Opt. Lett. 2020, 45, 4308–4311. [Google Scholar] [CrossRef] [PubMed]
- Xue, R.; Hu, L.; Shen, J.; Chen, J.; Wu, G. Branching Optical Frequency Transfer with Enhanced Post Automatic Phase Noise Cancellation. J. Light. Technol. 2021, 39, 4638–4645. [Google Scholar] [CrossRef]
- Oelker, E.; Hutson, R.B.; Kennedy, C.J.; Sonderhouse, L.; Bothwell, T.; Goban, A.; Kedar, D.; Sanner, C.; Robinson, J.M.; Marti, G.E.; et al. Demonstration of 4.8 × 10⁻¹⁷ stability at 1 s for two independent optical clocks. Nat. Photonics 2019, 13, 714–719. [Google Scholar] [CrossRef]
- Guo, F.; Tan, W.; Zhou, C.H.; Xia, J.; Chen, Y.X.; Liang, T.; Liu, Q.; Liu, Y.; He, D.J.; Zhou, Y.Z.; et al. A proof-of-concept model of compact and high-performance 87Sr optical lattice clock for space. AIP Adv. 2021, 11, 125116. [Google Scholar] [CrossRef]
- Güther, C. Kepler–Satellite Navigation without Clocks and Ground Infrastructure. In Proceedings of the 31st International Technical Meeting of The Satellite Division of the Institute of Navigation (ION GNSS+ 2018), Miami, FL, USA, 24–28 September 2018; pp. 849–856. [Google Scholar]
- Schmidt, T.D.; Trainotti, C.; Isoard, J.; Giorgi, G.; Furthner, J.; Gnther, C. Composite Clock Algorithms for System Time in Global Navigation Satellite Systems. In Proceedings of the 31st International Technical Meeting of The Satellite Division of the Institute of Navigation (ION GNSS+ 2018), Miami, FL, USA, 24–28 September 2018; pp. 963–967. [Google Scholar]
- Schuldt, T.; Döringshoff, K.; Kovalchuk, E.V.; Keetman, A.; Pahl, J.; Peters, A.; Braxmaier, C. Development of a compact optical absolute frequency reference for space with 10−15 instability. Appl. Opt. 2017, 56, 1101–1106. [Google Scholar] [CrossRef]
- Fridelance, P.; Samain, E.; Fridelance, P. T2L2-Time transfer by Laser link: A new optical time transfer generation. Exp. Astron. 1997, 7, 191–207. [Google Scholar] [CrossRef]
- Exertier, P.; Samain, E.; Courde, C.; Martin, N.; Torre, J.M.; Oneto, J.L.; Geoazur, M.L.-B.; Guillemot, P.; Leon, S. T2L2: Five years in space. In Proceedings of the 2013 Joint European Frequency and Time Forum & International Frequency Control Symposium (EFTF/IFC), Prague, Czech Republic, 21–25 July 2013; pp. 632–635. [Google Scholar]
- Cacciapuoti, L.; Much, R.; Feltham, S.; Nasca, R.; Vudali, T.; Hess, M.P.; Stringhetti, L.; Salomon, C. ACES status at completion of the engineering models phase. In Proceedings of the EFTF-2010 24th European Frequency and Time Forum, Noordwijk, The Netherlands, 13–16 April 2010; pp. 1–10. [Google Scholar]
- Schreiber, K.U.; Prochazka, I.; Lauber, P.; Hugentobler, U.; Schafer, W.; Cacciapuoti, L.; Nasca, R. Ground-based demonstration of the European Laser Timing (ELT) experiment. IEEE Trans. Ultrason. Ferroelectr. Freq. Control 2010, 57, 728–737. [Google Scholar] [CrossRef] [PubMed]
- Shen, Q.; Guan, J.-Y.; Zeng, T.; Lu, Q.-M.; Huang, L.; Cao, Y.; Chen, J.-P.; Tao, T.-Q.; Wu, J.-C.; Hou, L.; et al. Experimental simulation of time and frequency transfer via an optical satellite–ground link at 10−18 instability. Optica 2021, 8, 471–476. [Google Scholar] [CrossRef]
- Shen, Q.; Guan, J.-Y.; Ren, J.-G.; Zeng, T.; Hou, L.; Li, M.; Cao, Y.; Han, J.-J.; Lian, M.-Z.; Chen, Y.-W.; et al. Free-space dissemination of time and frequency with 10−19 instability over 113 km. Nature 2022, 610, 661–666. [Google Scholar] [CrossRef] [PubMed]
- Djerroud, K.; Acef, O.; Clairon, A.; Lemonde, P.; Man, C.N.; Samain, E.; Wolf, P. Coherent optical link through the turbulent atmosphere. Opt. Lett. 2010, 35, 1479–1481. [Google Scholar] [CrossRef] [PubMed]
- Ma, L.-S.; Jungner, P.; Ye, J.; Hall, J.L. Delivering the same optical frequency at two places: Accurate cancellation of phase noise introduced by an optical fiber or other time-varying path. Opt. Lett. 1994, 19, 1777–1779. [Google Scholar] [CrossRef] [PubMed]
- Deng, X.; Liu, J.; Jiao, D.D.; Gao, J.; Zang, Q.; Xu, G.J.; Dong, R.F.; Liu, T.; Zhang, S.G. Coherent Transfer of Optical Frequency over 112 km with Instability at the 10−20 Level. Chin. Phys. Lett. 2016, 33, 114202. [Google Scholar] [CrossRef]
- Lee, W.-K.; Yu, D.-H.; Park, C.Y.; Mun, J. The uncertainty associated with the weighted mean frequency of a phase-stabilized signal with white phase noise. Metrologia 2010, 47, 24–32. [Google Scholar] [CrossRef]
- Sinclair, L.C.; Swann, W.C.; Bergeron, H.; Baumann, E.; Cermak, M.; Coddington, I.; Deschenes, J.D.; Giorgetta, F.R.; Juarez, J.C.; Khader, I.; et al. Synchronization of Clocks Through 12 km of Strongly Turbulent Air Over a City. Appl. Phys. Lett. 2016, 109, 151104. [Google Scholar] [CrossRef] [PubMed]
- Taylor, M.T.; Belmonte, A.; Hollberg, L.; Kahn, J.M. Effect of atmospheric turbulence on timing instability for partially reciprocal two-way optical time transfer links. Phys. Rev. A 2020, 101, 033843. [Google Scholar] [CrossRef]
- Wang, L.; Jiao, W.H.; Hu, L.; Chen, J.P.; Wu, G.L. Residual timing jitter in the free-space optical two-way time and frequency transfer caused by atmospheric turbulence. Opt. Laser Technol. 2023, 163, 109365. [Google Scholar] [CrossRef]


Disclaimer/Publisher’s Note: The statements, opinions and data contained in all publications are solely those of the individual author(s) and contributor(s) and not of MDPI and/or the editor(s). MDPI and/or the editor(s) disclaim responsibility for any injury to people or property resulting from any ideas, methods, instructions or products referred to in the content. |
© 2024 by the authors. Licensee MDPI, Basel, Switzerland. This article is an open access article distributed under the terms and conditions of the Creative Commons Attribution (CC BY) license (https://creativecommons.org/licenses/by/4.0/).