Article

Simplified 1.5 μm Distributed Feedback Semiconductor Laser (DFB-LD) Frequency Stabilization System Based on Gas Absorption Chamber

School of Electrical and Information Engineering, Tianjin University, Tianjin 300072, China
*
Author to whom correspondence should be addressed.
Photonics 2024, 11(7), 621; https://doi.org/10.3390/photonics11070621
Submission received: 21 May 2024 / Revised: 16 June 2024 / Accepted: 27 June 2024 / Published: 28 June 2024
(This article belongs to the Special Issue Laser Technology and Applications)

Abstract

:
The classical 1.5 μ m band frequency-stabilized laser using acetylene gas saturated absorption can achieve high frequency stability and reproducibility, but its system design is complex and bulky. For some practical applications, a simple, compact system containing anti-interference abilities is preferred. In this study, a low-cost and simple-structured 1.5 μ m frequency-stabilized laser is constructed using digital control methods, wavelength modulation technology, and acetylene gas absorption. The fiber input and output optical devices of the system significantly simplify the optical path and reduce the volume of the system. The error signal is obtained by the first-order differential method, and a combination of the high-speed comparator circuit and the microcontroller unit (MCU) is used to detect the error signal. Through the feedback control method of coarse temperature adjustment and fine current adjustment, the second-level frequency stability of the laser is stabilized within 100 kHz, that is, the frequency stability reaches 10 10 . The designed system achieved continuous and stable operation for more than 6 h, and the long-term frequency stability reached 10 9 .

1. Introduction

Lasers have been used in optical communication, optical frequency scaling, and high-resolution spectroscopy since their appearance in the 1960s because of their excellent coherence and brightness [1,2]. Precision measurement has the most extensive applications in lasers, particularly in interferometry. In precision interferometry, the laser wavelength is used as a “ruler” to measure the length, displacement, velocity, and other important parameters based on the principle of laser interference. Thus, the stability of the laser wavelength (or frequency) directly affects the accuracy of the measurement results [3,4]. Therefore, precision measurements require the laser to achieve a single-frequency output, while also requiring the laser frequency fluctuation to be as small as possible. However, the laser output from a free-running laser experiences slow drift and mode jumping owing to various factors, such as working environment conditions [5,6]. Consequently, active frequency stabilization of the laser is necessary. Laser frequency stabilization has become essential in modern precision measurement technologies [7].
Currently, there are three main methods for achieving laser-output-frequency control using active frequency stabilization: saturated absorption spectrum frequency stabilization, external modulation frequency stabilization, and frequency stabilization without modulation [8,9,10,11,12]. In 2011, Wang et al. [13] used a combination of saturated absorption and polarization spectroscopy to ensure that the frequency fluctuation of the external cavity semiconductor laser (ECDL) did not exceed 0.6 MHz within 300 s. The experimental structure of the saturated absorption spectroscopy frequency stabilization technique is simple and inexpensive; however, the modulated signal introduces additional noise, which reduces the frequency stabilization accuracy. In 2017, Aldous et al. [14] used carrier modulation dependent on the acousto-optic modulator (AOM) drive frequency to provide spatially and spectrally separated sidebands to achieve laser wavelength stabilization and stabilize the laser output frequency on the order of MHz. In 2021, Yasui et al. [15] stabilized the light source frequency using an optical frequency comb that was more than five orders of magnitude more stable than when the laser was free-running and eliminated the effect of frequency fluctuations over long measurement times. Moreover, the light source frequency could be locked to any frequency of the comb teeth.
The above three methods used ECDL for frequency stabilization and obtained high-frequency stability; however, ECDL exhibits disadvantages such as slow tuning speed, large size, and difficult optical path collimation [16], which require further development and improvement. In addition, distributed feedback semiconductor lasers (DFB-LDs) have been employed as the core light source in optical systems owing to their direct high-speed modulation, low cost, small size, easy integration, and mass production [17,18].
In 2011, Numata et al. [19] used a phase modulator (PM) to externally modulate the laser output to lock the DFB-LD output frequency to the center of the CO 2 absorption spectrum. The peak-to-peak value of the laser frequency jitter was less than 0.3 MHz in 0.8 s (average time). This method offered a large slope of error signal, small background signal effect, and ease of locking. However, the high cost of the PM limits its practical application. To overcome the high cost of external modulators, in 2014, Sun et al. [20] used a polarization rotational optical feedback method to stabilize the frequency of a DFB-LD at the D 2 saturation absorption line of cesium, which does not require additional electrical feedback and eventually reduces the frequency drift of the laser from 96 MHz to 6.6 MHz, ensuring high frequency stability while lowering system costs. In 2017, Du et al. [21] designed a frequency-stabilized system device based on a space-body absorption cell and frequency-modulated spectral counting, which has a root-mean-square frequency of approximately 50 kHz in 0.1 s (average time). However, the Allan variance of this frequency stabilization gradually deteriorates after 1000 s, and the long-term stability of the frequency remains challenging. In 2016, Jinjin et al. [22] stabilized the output wavelength of a 1550 nm DFB-LD at the edge of the absorption line of hydrogen cyanide (HCN) gas and used a digital signal processor to complete the frequency search and frequency stabilization to achieve frequency shift within 15 MHz in 2 h. The study further demonstrated the potential of digital control methods in frequency stabilization. In 2019, Jiaoxu et al. [23] proposed a water-vapor-based second harmonic absorption property to establish a new method of frequency stabilization for 1396-nm narrow line width DFB-LD. They reported that the wavelength drift of the laser output was effectively suppressed within ±0.16 pm (20 MHz) in 100 h. This work demonstrated significant advancements in stabilizing laser frequencies over longer time scales. These developments illustrate the gradual improvements in DFB-LD frequency stabilization technology across different time scales and cost efficiencies. Despite significant achievements, the relative frequency stabilization accuracy of the DFB-LD is generally in the MHz range, that is, the frequency stability is of the order of 10 8 . Therefore, the frequency stabilization technology of the DFB-LD must be further developed with higher accuracy.
The acetylene gas molecule ( C 2 H 2 ) has a linear symmetric molecular structure and no permanent dipole moment. It is gaseous and inactive at room temperature. In addition, C 2 H 2 has more than 50 strong absorption spectral lines (1520–1550 nm), with different vibrational absorption spectral lines spaced up to GHz and the whole absorption band spanning up to THz. Thus, the C 2 H 2 saturation absorption spectral line in the 1.5 μ m band is an ideal wavelength/frequency reference standard [24,25]. As early as 2012, Xiaobo Wang et al. [26] proposed a single-photon modulation technique based on kHz modulation frequencies. By detecting the single-photon absorption spectrum of acetylene gas, they achieved a frequency stability better than 25 MHz for the 1.5 μ m DFB-LD output. However, this system was bulky, limiting the modulation frequency, and its frequency stability was insufficient for current applications. In 2020, Roy Zektzer et al. [27] designed a compact integrated laser wavelength stabilization system with an acetylene gas absorption cell. Their experimental results showed that this system could maintain the frequency stability of a 1.5 μ m laser within 400 kHz for 34 s. Although this system provided a cost-effective and compact acetylene frequency stabilization solution, its long-term stability was poor, making it unsuitable for applications requiring extended operation times.
This study developed a low-cost and simple-structured 1.5 μ m DFB frequency-stabilized laser using a digitally controlled method combining the wavelength modulation technique and C 2 H 2 absorption. The optical devices in this system were all fiber input–output types, which simplified the optical path and reduced the size. First-order differentiation was used to obtain the error signal, which delineates two states differing by 180 when the central wavelength deviates from the frequency stabilization reference, and the design realized a combination of a high-speed comparator circuit and a microcontrol unit (MCU) for error signal identification. The high-speed comparator allowed for fine adjustment of the laser frequency stabilization locking point by setting thresholds. The addition of MCU digital assistance improved the anti-interference capability of the frequency stabilization system against external environmental fluctuations. Experimental results showed that the DFB-LD frequency stabilization scheme achieves high frequency stability. The second-level frequency stability of the laser was controlled to the order of 10 10 with an integration time of about 100 s, which was two orders of magnitude better than that before stabilization, representing an improvement of over 100 times. For long-term frequency stability, the standard deviation of the feedback DC signal over 6 h of operation was calculated. The frequency stability of the laser was maintained at 10 9 , demonstrating a significant stabilization effect.

2. Experimental Principle

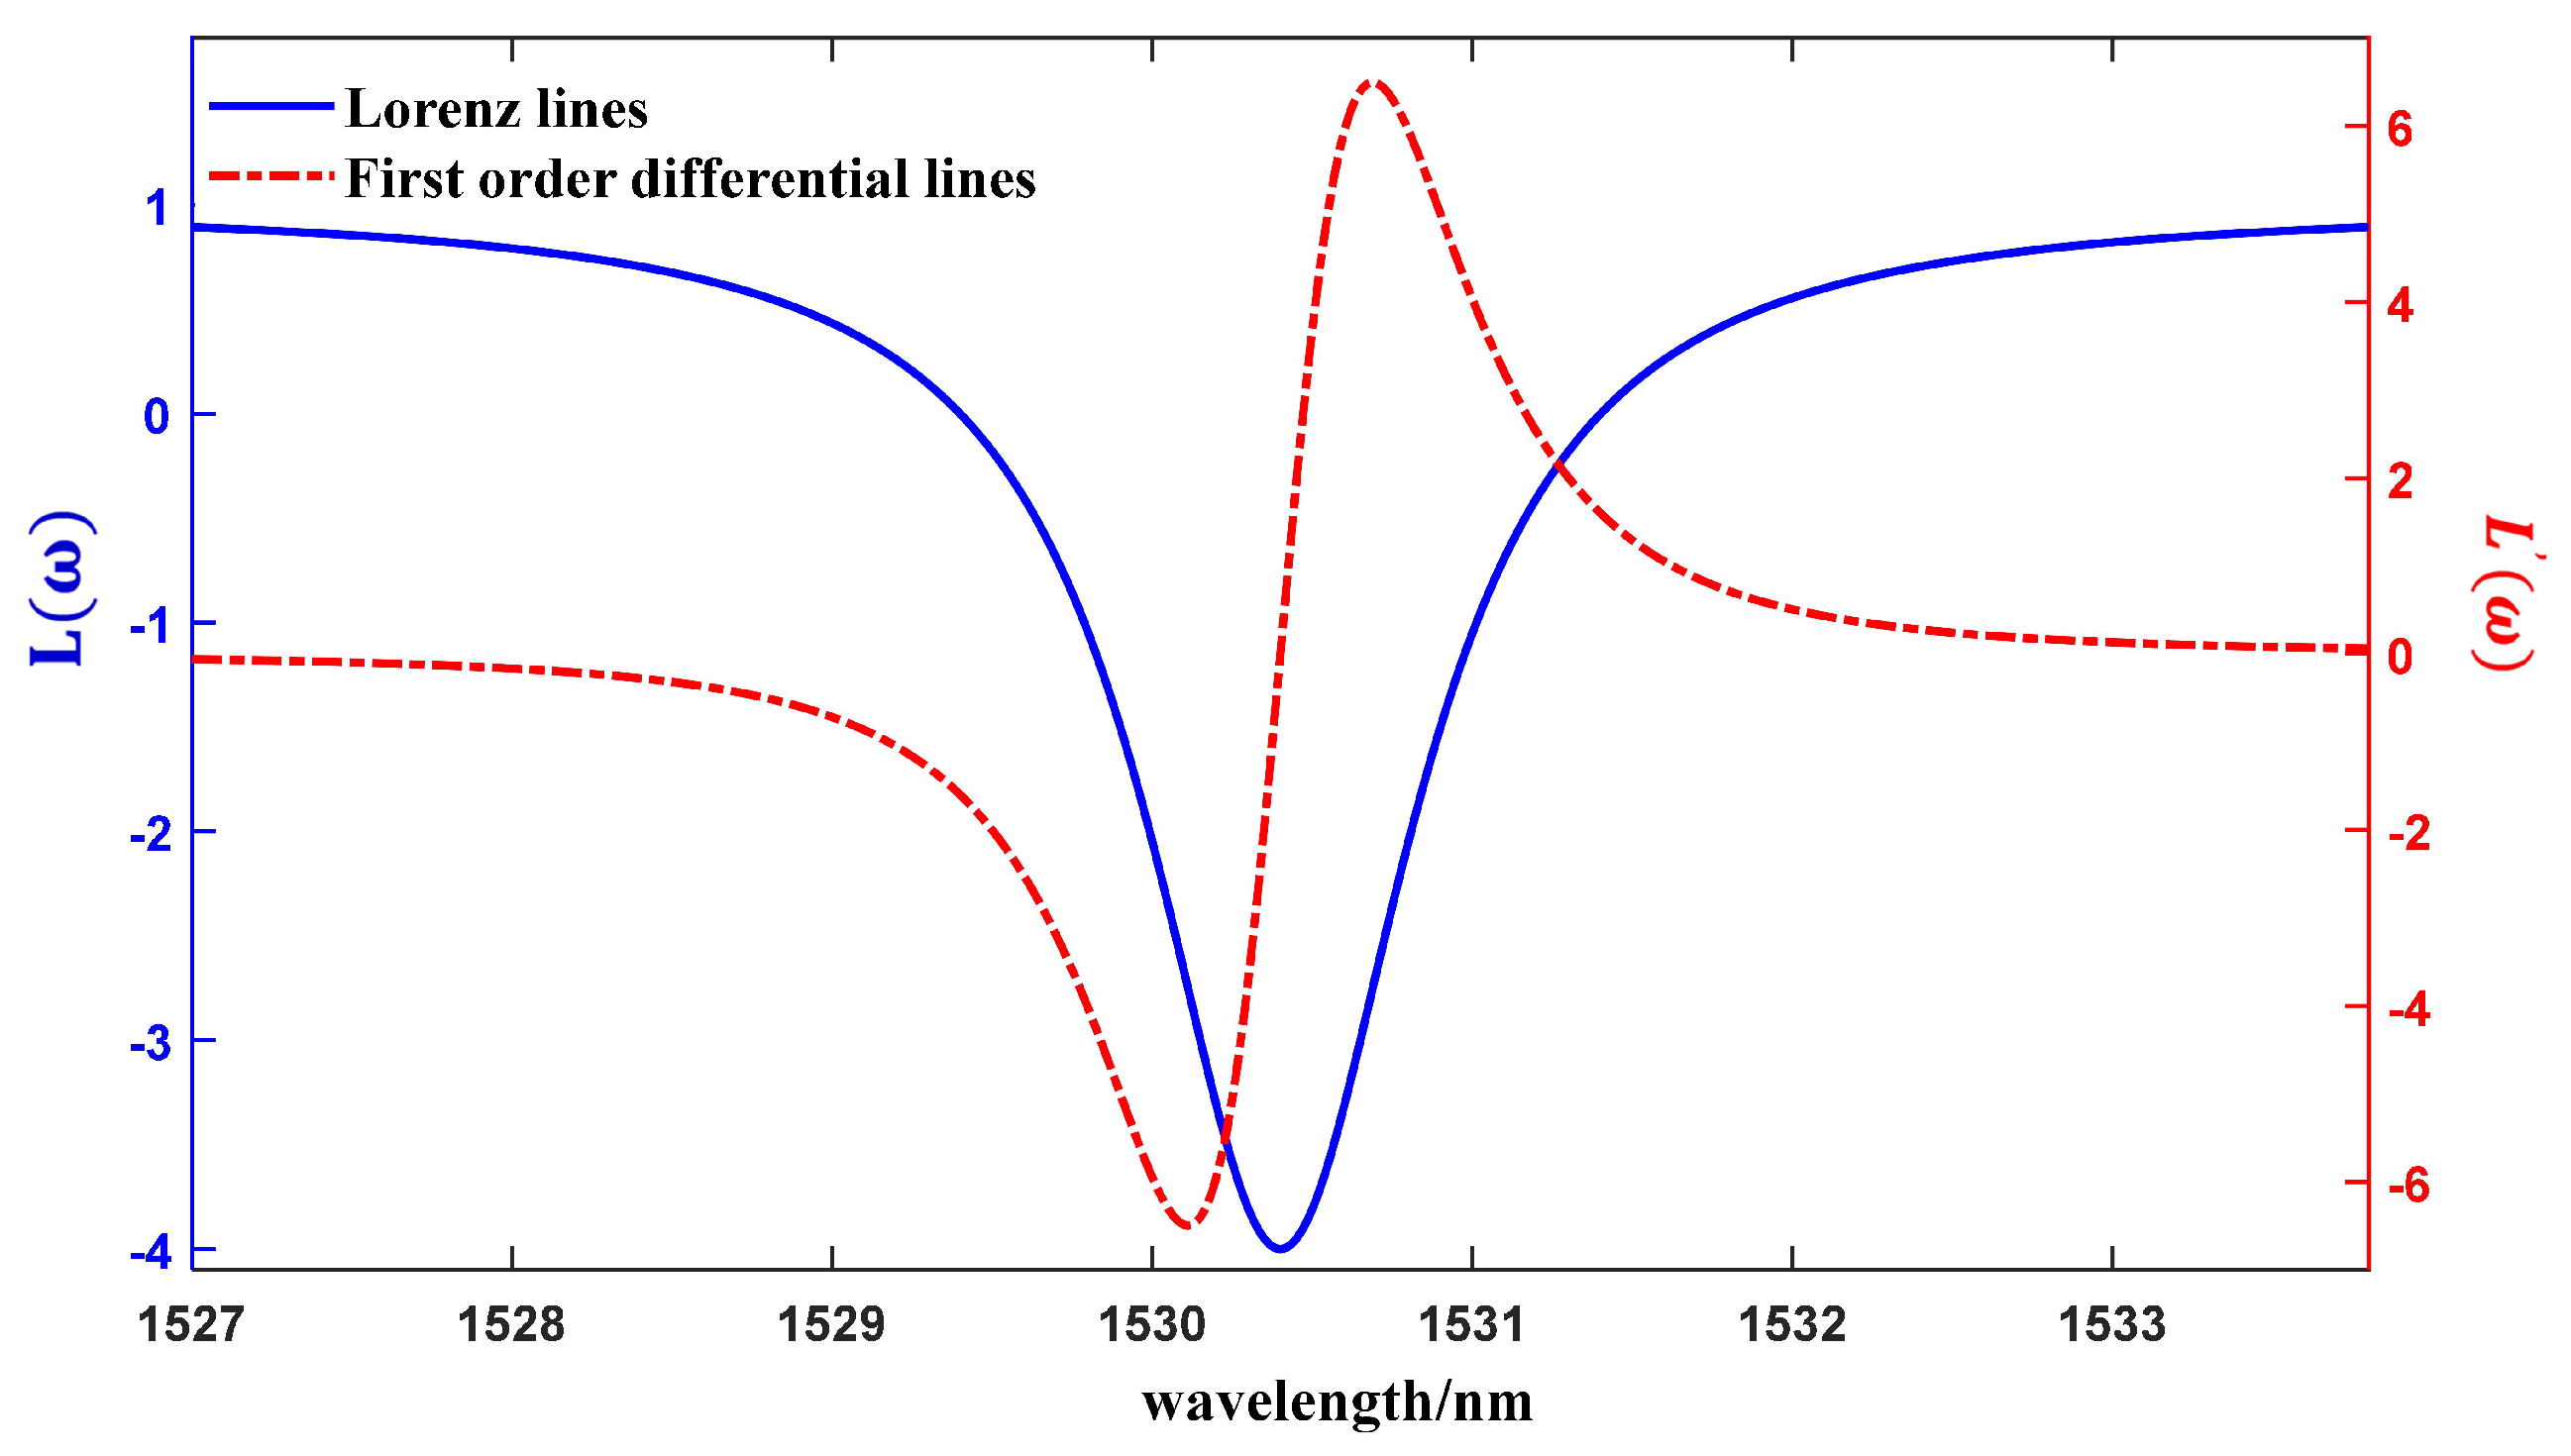
2.1. Frequency Identification Properties of C 2 H 2

The distribution of acetylene gas (C2H2-12-H(3)-50-FCAPC) transmission peaks near 1530 nm were measured using an erbium-doped fiber amplifier (EDFA) as the light source (Figure 1a). These spectral lines are separated from each other and can all be used as a reference for laser frequency stabilization. The absorption peak at the peak wavelength of 1530.40 nm was chosen for the experiment, and the 3 dB bandwidth of the absorption peak was approximately 7 pm, as shown in Figure 1b.
The absorption spectrum is of Lorentzian type [28], and the transmittance can be expressed as
L ( ω ) = 1 α γ 2 γ 2 + ( ω ω 0 ) 2
where α is the absorbance of the absorption center, γ is the half-width of the absorption spectrum, and ω 0 is the central frequency of the transmission peak. The primary differential curve is
L ( ω ) = 2 α γ 2 ( ω ω 0 ) [ γ 2 + ( ω ω 0 ) 2 ] 2
Near the center frequency of the transmission peak, | ω ω 0 | γ , the approximation is
L ( ω ) = 2 α ( ω ω 0 ) γ 2
Figure 2 shows the simulated transmission spectrum of the acetylene absorption chamber and its first-order differential curves. The simulation parameters were as follows: ω 0 = 1530.4 nm, γ = 0.5, α = 5, and ω ranged from 1527 nm to 1533 nm. The first-order differential curve in the region near the wavelength of 1530.40 nm at the center of the absorption peak was approximately linear, and the first-order differential was positive when ω > ω 0 and negative when ω < ω 0 . This property can be used for frequency identification.

2.2. Generation of Error Signals

The modulation–demodulation method is widely used to obtain first-order differentiation [29]. A modulation signal is added to the laser frequency.
δ ω t = A sin Ω t
where A is the modulated signal amplitude, and Ω is the modulated signal frequency. After the modulated laser was absorbed by the acetylene gas, the spectral signals were Taylor-expanded to obtain
L ω + δ ω t = L ( ω ) + L ( ω ) A sin Ω t + 1 2 L ( ω ) A 2 sin 2 Ω t +
Then, the modulated optical signal was multiplied by B sin ( Ω t ) , which has the same frequency and phase as the modulated signal, to obtain the following:
L ω + δ ω t · B sin Ω t = L ( ω ) B sin Ω t + L ( ω ) A B sin 2 Ω t + 1 2 L ( ω ) A 2 B sin 3 Ω t + = 1 2 ( L ( ω ) A B L ( ω ) A B cos 2 Ω t ) + L ( ω ) B sin Ω t + 1 2 L ( ω ) A 2 B sin 3 Ω t +
After this signal was converted by the photodetector, only 1 2 L ( ω ) A B was a low-frequency term; the remaining were frequencies of Ω and its multiples. Using the low-pass filter (LPF), the DC error signal 1 2 L ( ω ) A B term can be obtained. This is the required error signal. When the laser frequency is greater than the acetylene absorption peak center frequency, the error signal is positive, and it is negative in the opposite case. This error signal was used for the feedback correction of the laser output frequency to achieve laser frequency stabilization.
In this design, a gas absorption cell was proposed to serve as the absolute reference for wavelength. The chosen acetylene gas absorption cell is commonly used as a wavelength calibrator in the C-band for optical communications, providing multiple absorption peaks for laser wavelength calibration. After passing through the gas absorption cell, the optical signal was converted into an electrical signal by a photodetector. Due to the effect of wavelength modulation, the photodetector received a time-varying signal instead of a direct current (DC) signal. The reference wavelength of the laser produced different signals depending on its position relative to the absorption peak.
Figure 3 shows the demodulated signal of the laser’s reference wavelength at different positions relative to the absorption peak. When the reference wavelength coincides exactly with the valley of the absorption peak, the wavelength change of the frequency Ω output is a repetition frequency of 2 Ω signal. Since the cosine function is perfectly symmetrical at the reference wavelength, and both sides of the absorption peak are symmetrical, the signal with a repetition frequency of 2 Ω is completely flat and has no Ω frequency component. However, when the reference wavelength is shifted from the bottom of the absorption peak, the symmetry of the modulating signal is disrupted, resulting in a staggered 2 Ω output signal. At this point, there is a repetition of the envelope with a frequency of Ω . Further shifting weakens the 2 Ω signal component and enhances the Ω signal component. Therefore, when the amplitude of the feedback DC signal from Equation (6) is zero, the reference wavelength is aligned with the valley of the gas absorption peak. When it is not zero, the wavelength is shifted, and the phase of 2 Ω can be in two states, differing by 180 , indicating different directions of the shift.
Based on the above analysis, the sign (positive/negative) of the error feedback signal can be used to determine the position of the central wavelength of the laser output relative to the absorption peak of the acetylene gas absorption chamber, thereby providing feedback to control the laser output wavelength.

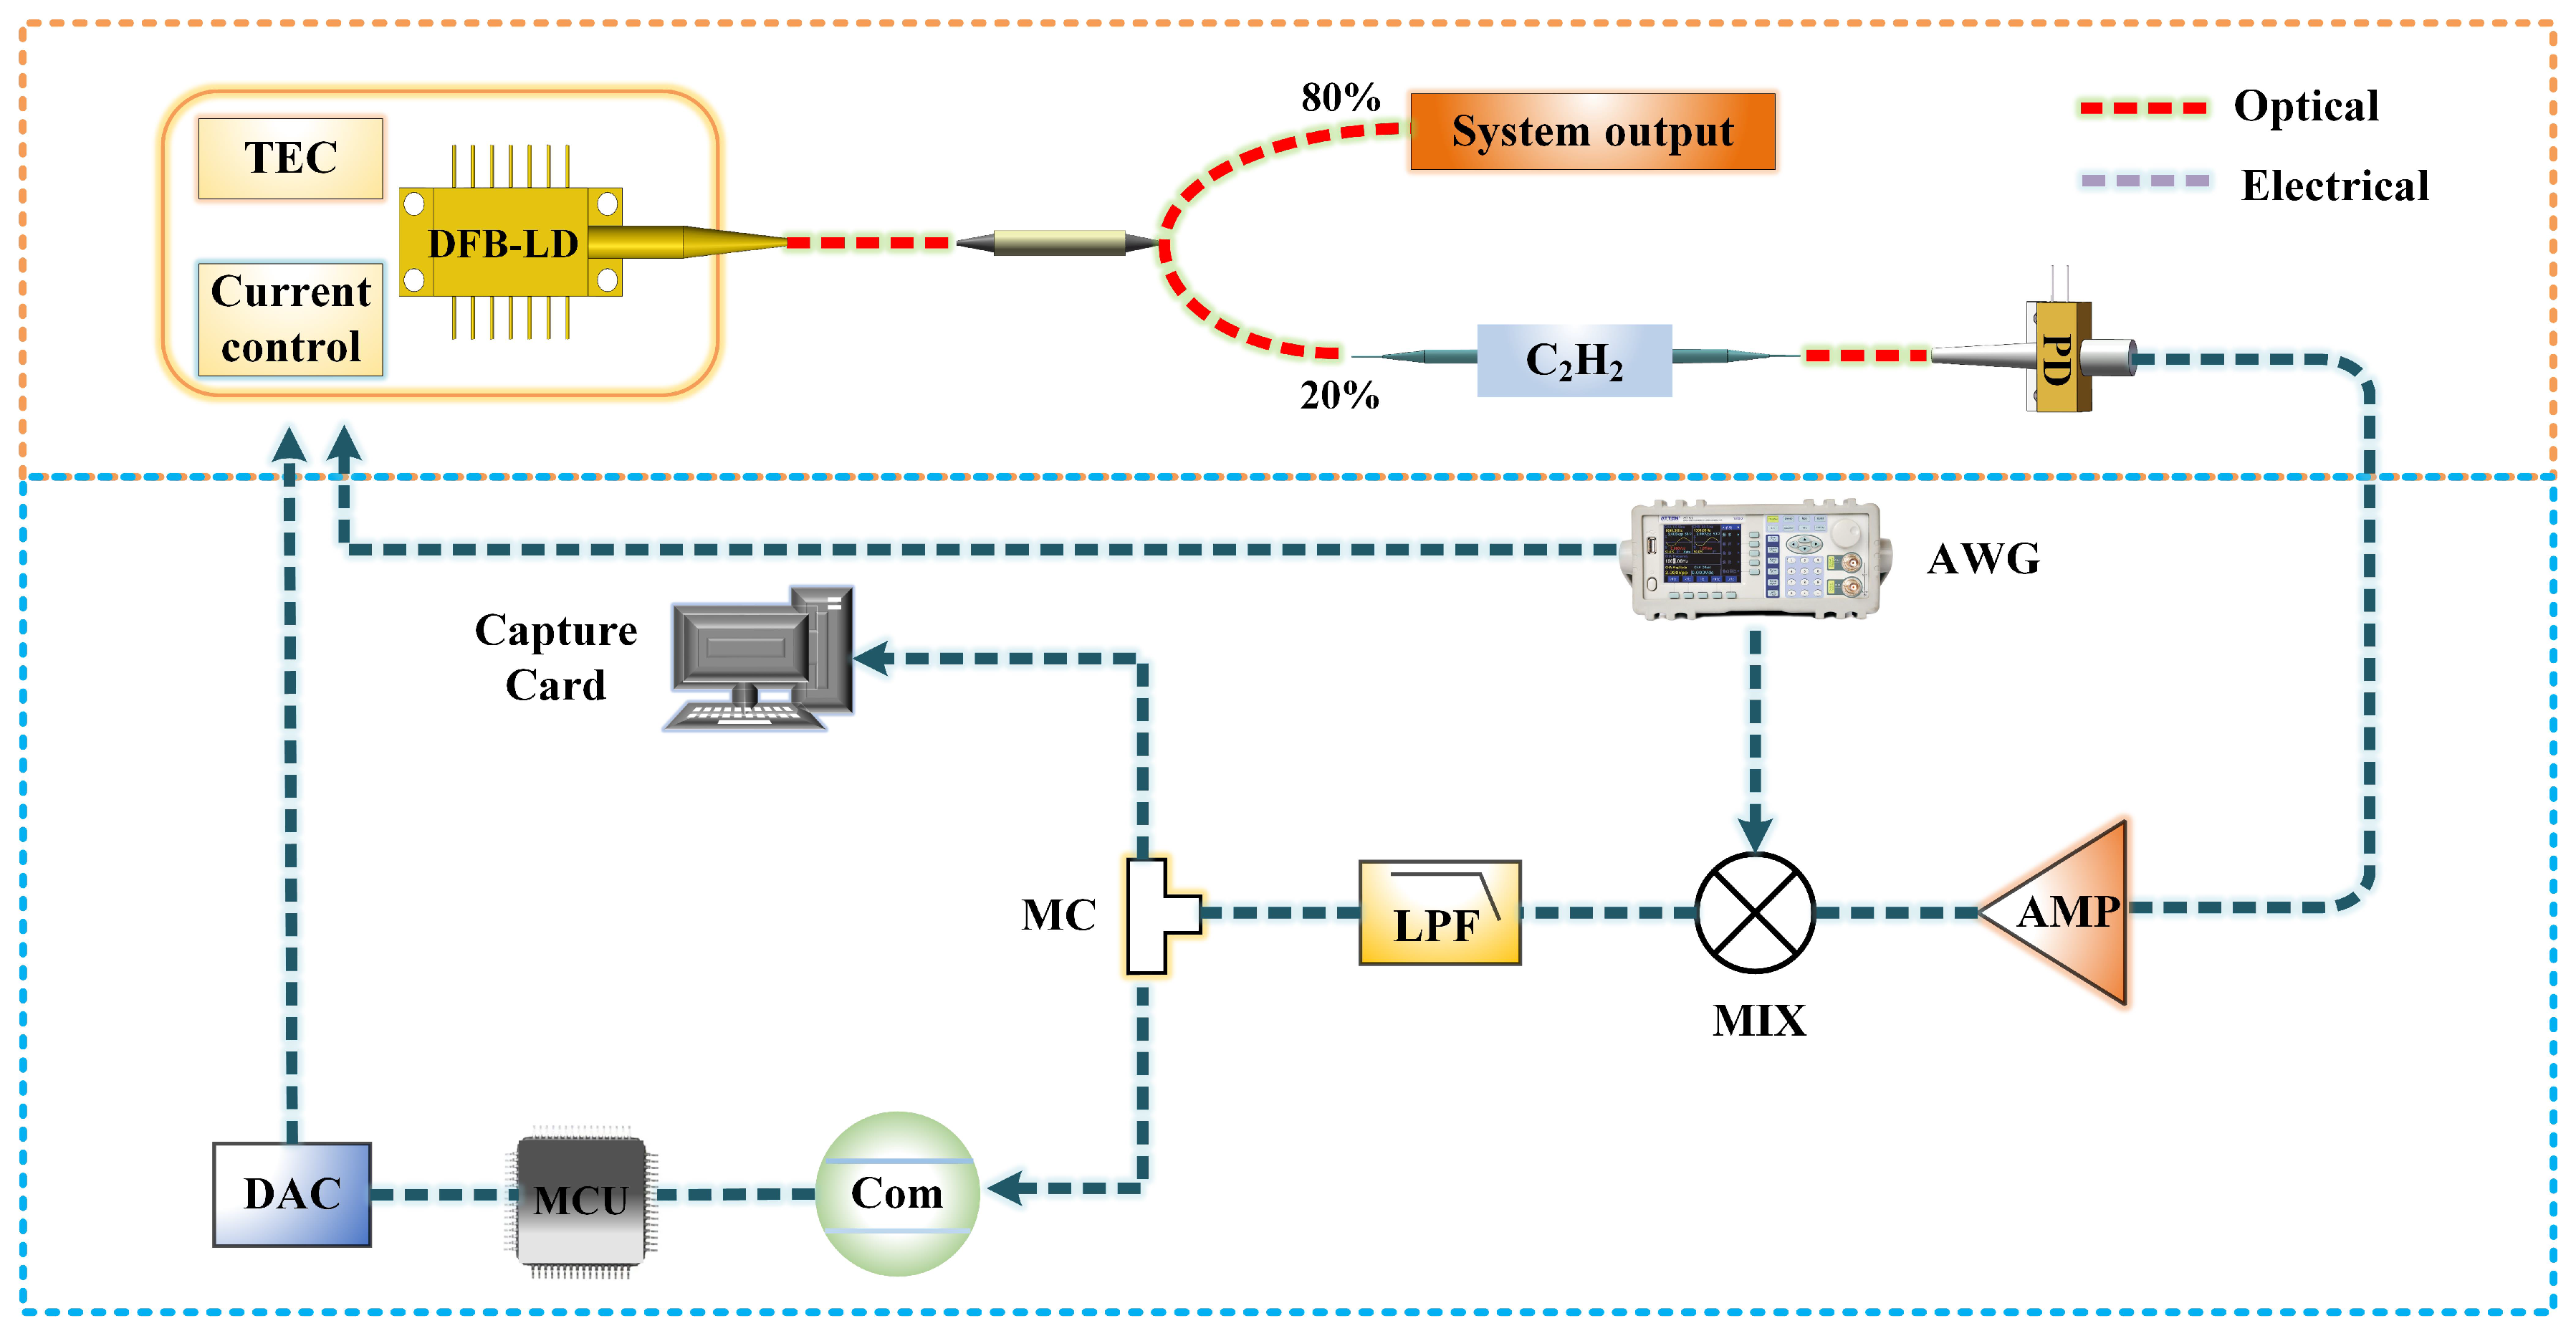
3. Experimental Setup

A block diagram of the composition of the frequency stabilization system of the semiconductor laser based on digital control using acetylene gas absorption is shown in Figure 4. The optical path was output by a distributed feedback semiconductor laser (DFB-LD) with a wavelength of 1530 nm. The light was divided into two paths using a optical coupler with a splitting ratio of 2:8 into two paths—one is the output light source of the system, and the other for feedback correction of the frequency stabilization system—and enters the acetylene gas absorption chamber. The light passing through the acetylene gas absorption chamber was converted into an electrical signal using a photodetector (PD) and amplified using an amplifier (OPA1611). The PD had an optical fiber pigtail input, 3 dB bandwidth of 14 GHz, 17 dBm maximal input optical power, and 0.8 A/W responsivity. The OPA1611 operational amplifier had single-ended input, chip input voltage noise of 1.1 nV Hz at 1 kHz, ultra-low noise, and distortion. The signal generator provides two identical signals with the same frequency of 12 MHz: One signal with high and low levels of +50 mV and −50 mV, respectively, is applied to the current source of the laser to modulate the optical frequency of the laser output, and the other signal with high and low levels of +750 mV and −750 mV, respectively, is mixed and demodulated in the multiplier (AD835, offering fast processing speed and low product noise) with the electrical signal after detector conversion and amplifier amplification. The mixed signal was passed through an LPF to obtain a DC error signal related to the frequency offset. The DC error signal was acquired using an acquisition card to observe the effect of the feedback control. The error signal was detected using a high-speed comparator circuit, a microcontroller unit (MCU) (ADCMP602) providing a 3.5 ns propagation delay, and a single-supply TTL/CMOS comparator chip, which has applications for high-speed instrumentation design, as threshold detectors and pulse width modulators. In the frequency stabilization device design, a high-speed comparator circuit was used to detect the error signal caused by the laser frequency deviation from the center frequency of the acetylene gas chamber. For input error signal less than the threshold voltage set by the comparator, the comparator output a low level and vice versa. The MCU determined the offset direction between the current laser and center frequencies of the acetylene chamber based on the high and low levels obtained from the comparator circuit. To control the output voltage of the DAC, feedback control of the laser temperature control and current control module was implemented, and laser frequency stabilization was realized.

4. Experimental Results

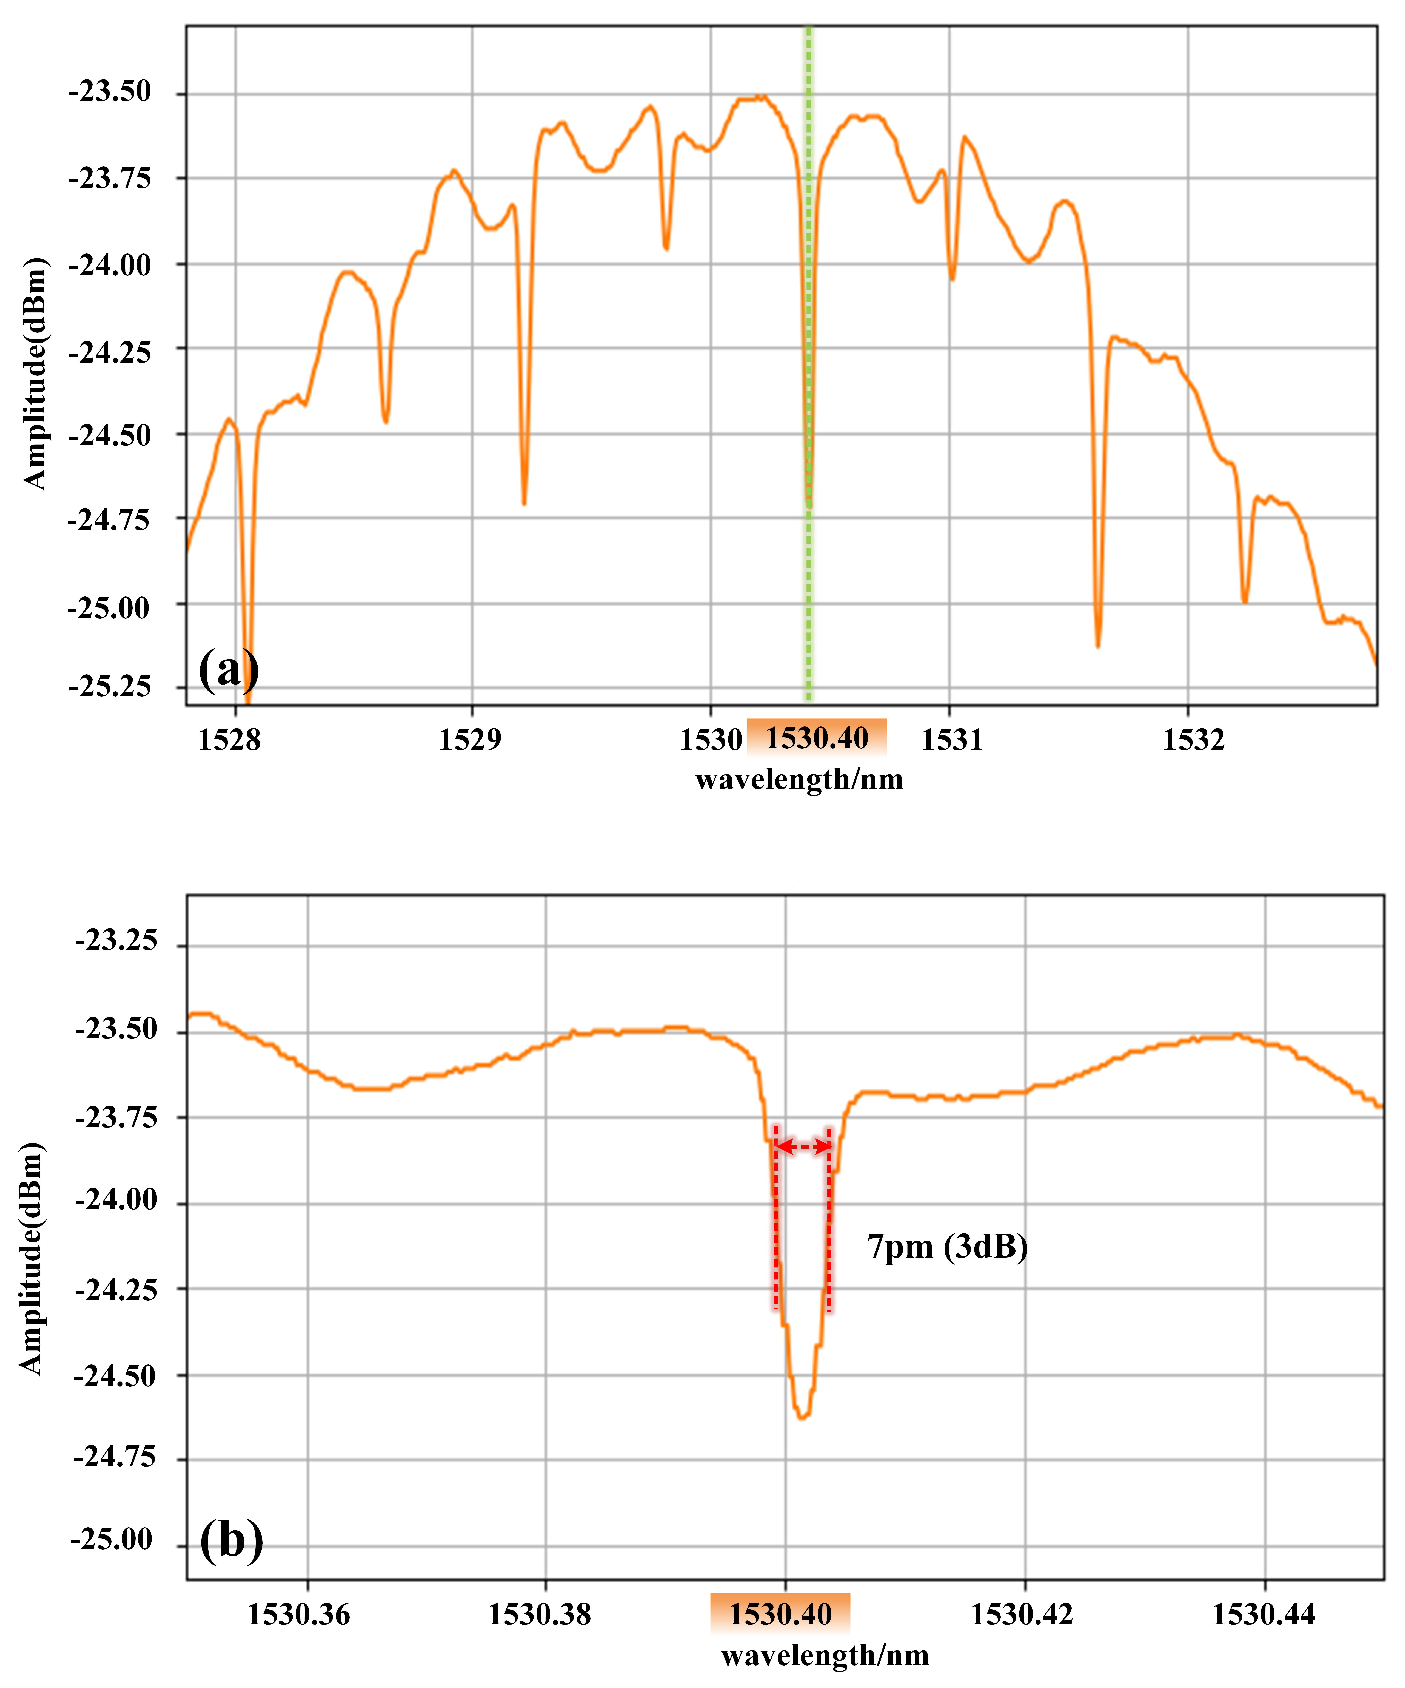
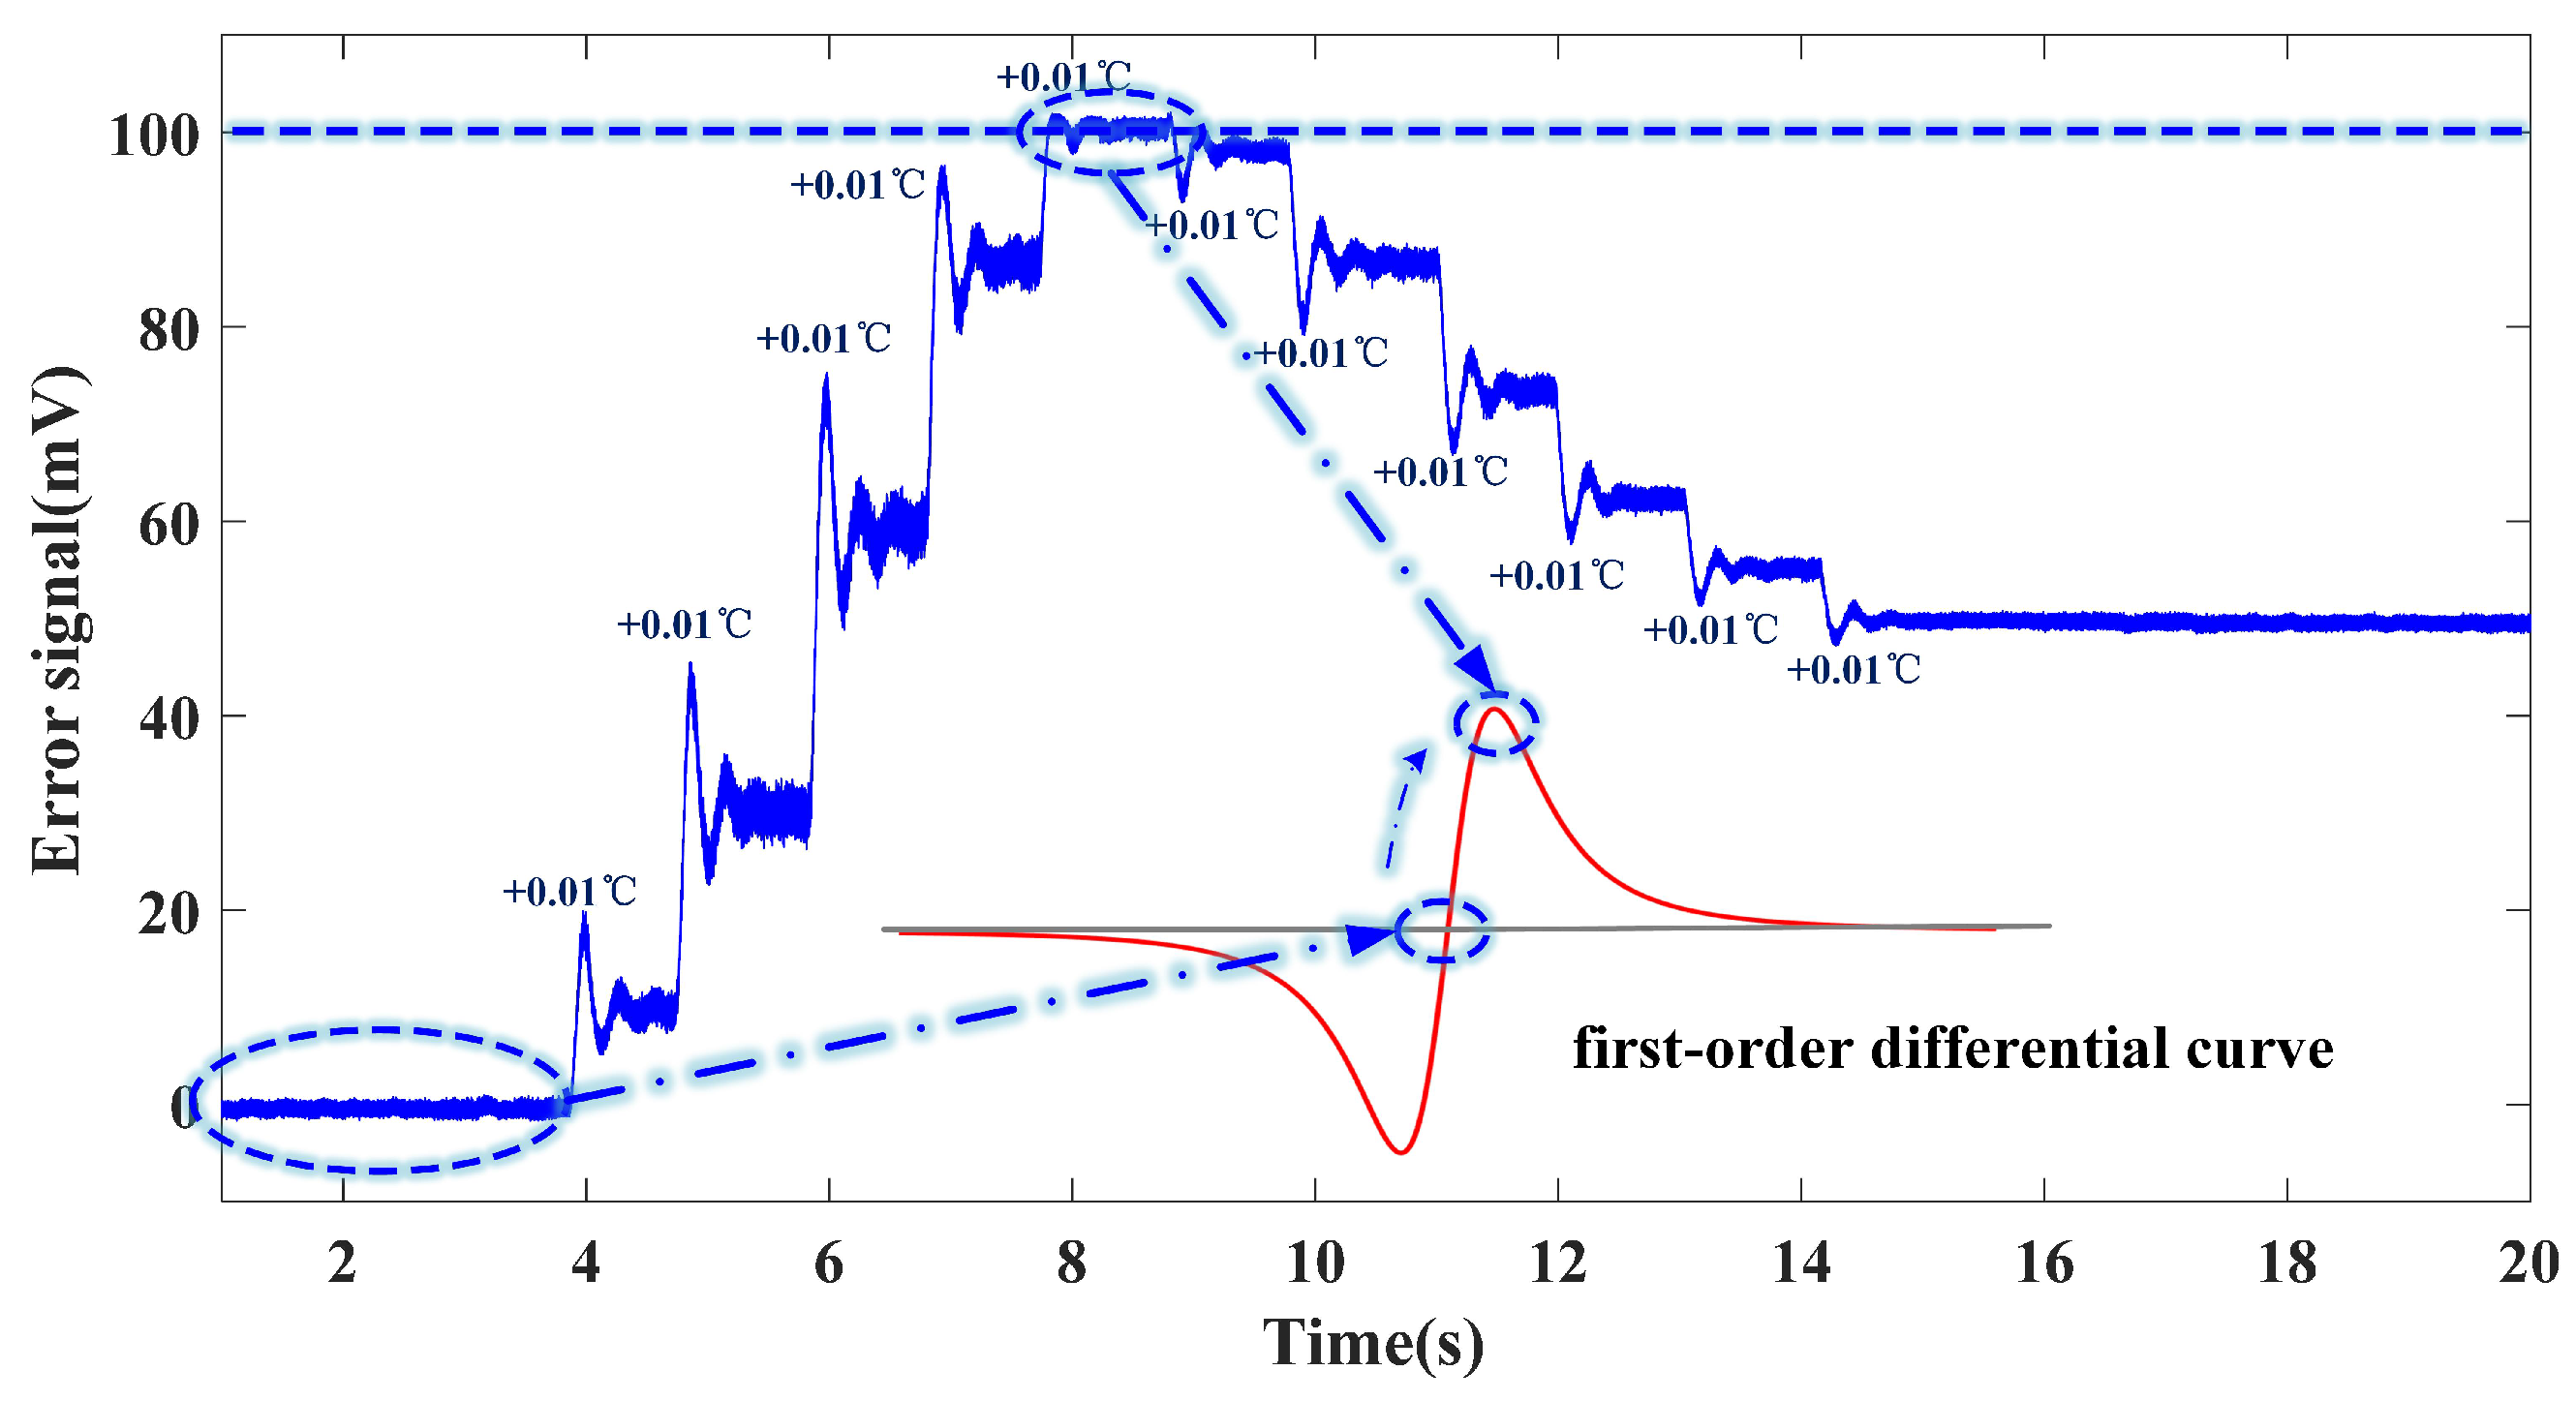
4.1. Experimental Test before Frequency Stabilization

To explore the relationship between the output frequency of the DFB laser and the working temperature and injection current in the experiment, we conducted tests on the variation of the DFB laser output wavelength with respect to the working temperature and drive current. During the free operation of the DFB laser, we utilized a high-precision temperature control platform to adjust the working temperature of the laser within the range of 20–30 °C, with a step size of 0.1°C. The spectrometer recorded the output wavelength of the laser. The test results, as shown in Figure 5a, revealed a linear relationship between the working wavelength of the laser and the temperature variation. Through linear fitting, we obtained the slope of this curve to be 0.1 nm/°C, indicating that when the working temperature of the laser changed by 0.01 °C, the wavelength of the laser changed by 0.001 nm.
Similarly, we fixed the operating temperature of the laser at 25 °C and tested the relationship between the output wavelength and the drive current. As shown in Figure 5b, the variation of the laser’s output frequency with the drive current also exhibited a linear relationship. Through linear fitting, we obtained the slope of this curve to be 0.01 nm/mA, indicating that when the current changed by 1 mA, the corresponding change in the laser output wavelength was 0.01 nm.
After completing the MCU’s DAC driver program, we conducted tests on the output voltage of the DAC module channels. The upper part of Figure 6 shows the main program for testing the output voltage of the DAC module. Upon initializing the DAC ports in the main function, the voltage output settings for different DAC channels were accomplished by calling the DAC unipolar output function and setting the channel with the DAC_CODE encoding value. The actual output voltage calculation formula is as follows:
V out = V ref × DAC _ CODE 2 n
where V out is the output voltage, V ref is the reference voltage, DAC_CODE is the digital code of the DAC, and n is the number of bits of the DAC. Here, V ref is 5 V, and n is 16; the DAC_CODE encoding values for channel one and channel two are set to 35,000 and 60,000, respectively. Calculations show that the output voltage for channel one is 2.67 V and for channel two is 4.58 V. The actual measurement results are consistent with the theoretical calculation results. The lower part of Figure 6 shows the main program for the MCU controlling the DAC module to drive the DFB laser current. The MCU adjusts the laser frequency stabilization setpoint within a small range by detecting the high and low levels of the high-speed comparator output, achieving automatic frequency stabilization at startup.
Subsequently, we tested the linear relationship between the output voltage of the DAC module and the operating current of the DFB laser. Different DAC codes were sent via the MCU, and the operating current of the DFB was measured. As shown in Figure 7, when the DAC module output voltage code varied between 14,500 and 22,000, the laser operating current ranged from 59 mA to 75 mA, demonstrating a good linear relationship.
From the experimental tests, we concluded that when the DAC_CODE changed by the smallest increment, the corresponding change in the laser current was approximately 0.0015 mA. Figure 7 shows that when the drive current changed by 1 mA, the laser output wavelength changed by approximately 0.01 nm. Therefore, when the DAC_CODE value changed by the smallest increment, the wavelength change was 0.015 pm. This control precision far exceeds the frequency stability of the laser in free-running mode. Thus, this scheme can achieve the frequency stability of the DFB laser.

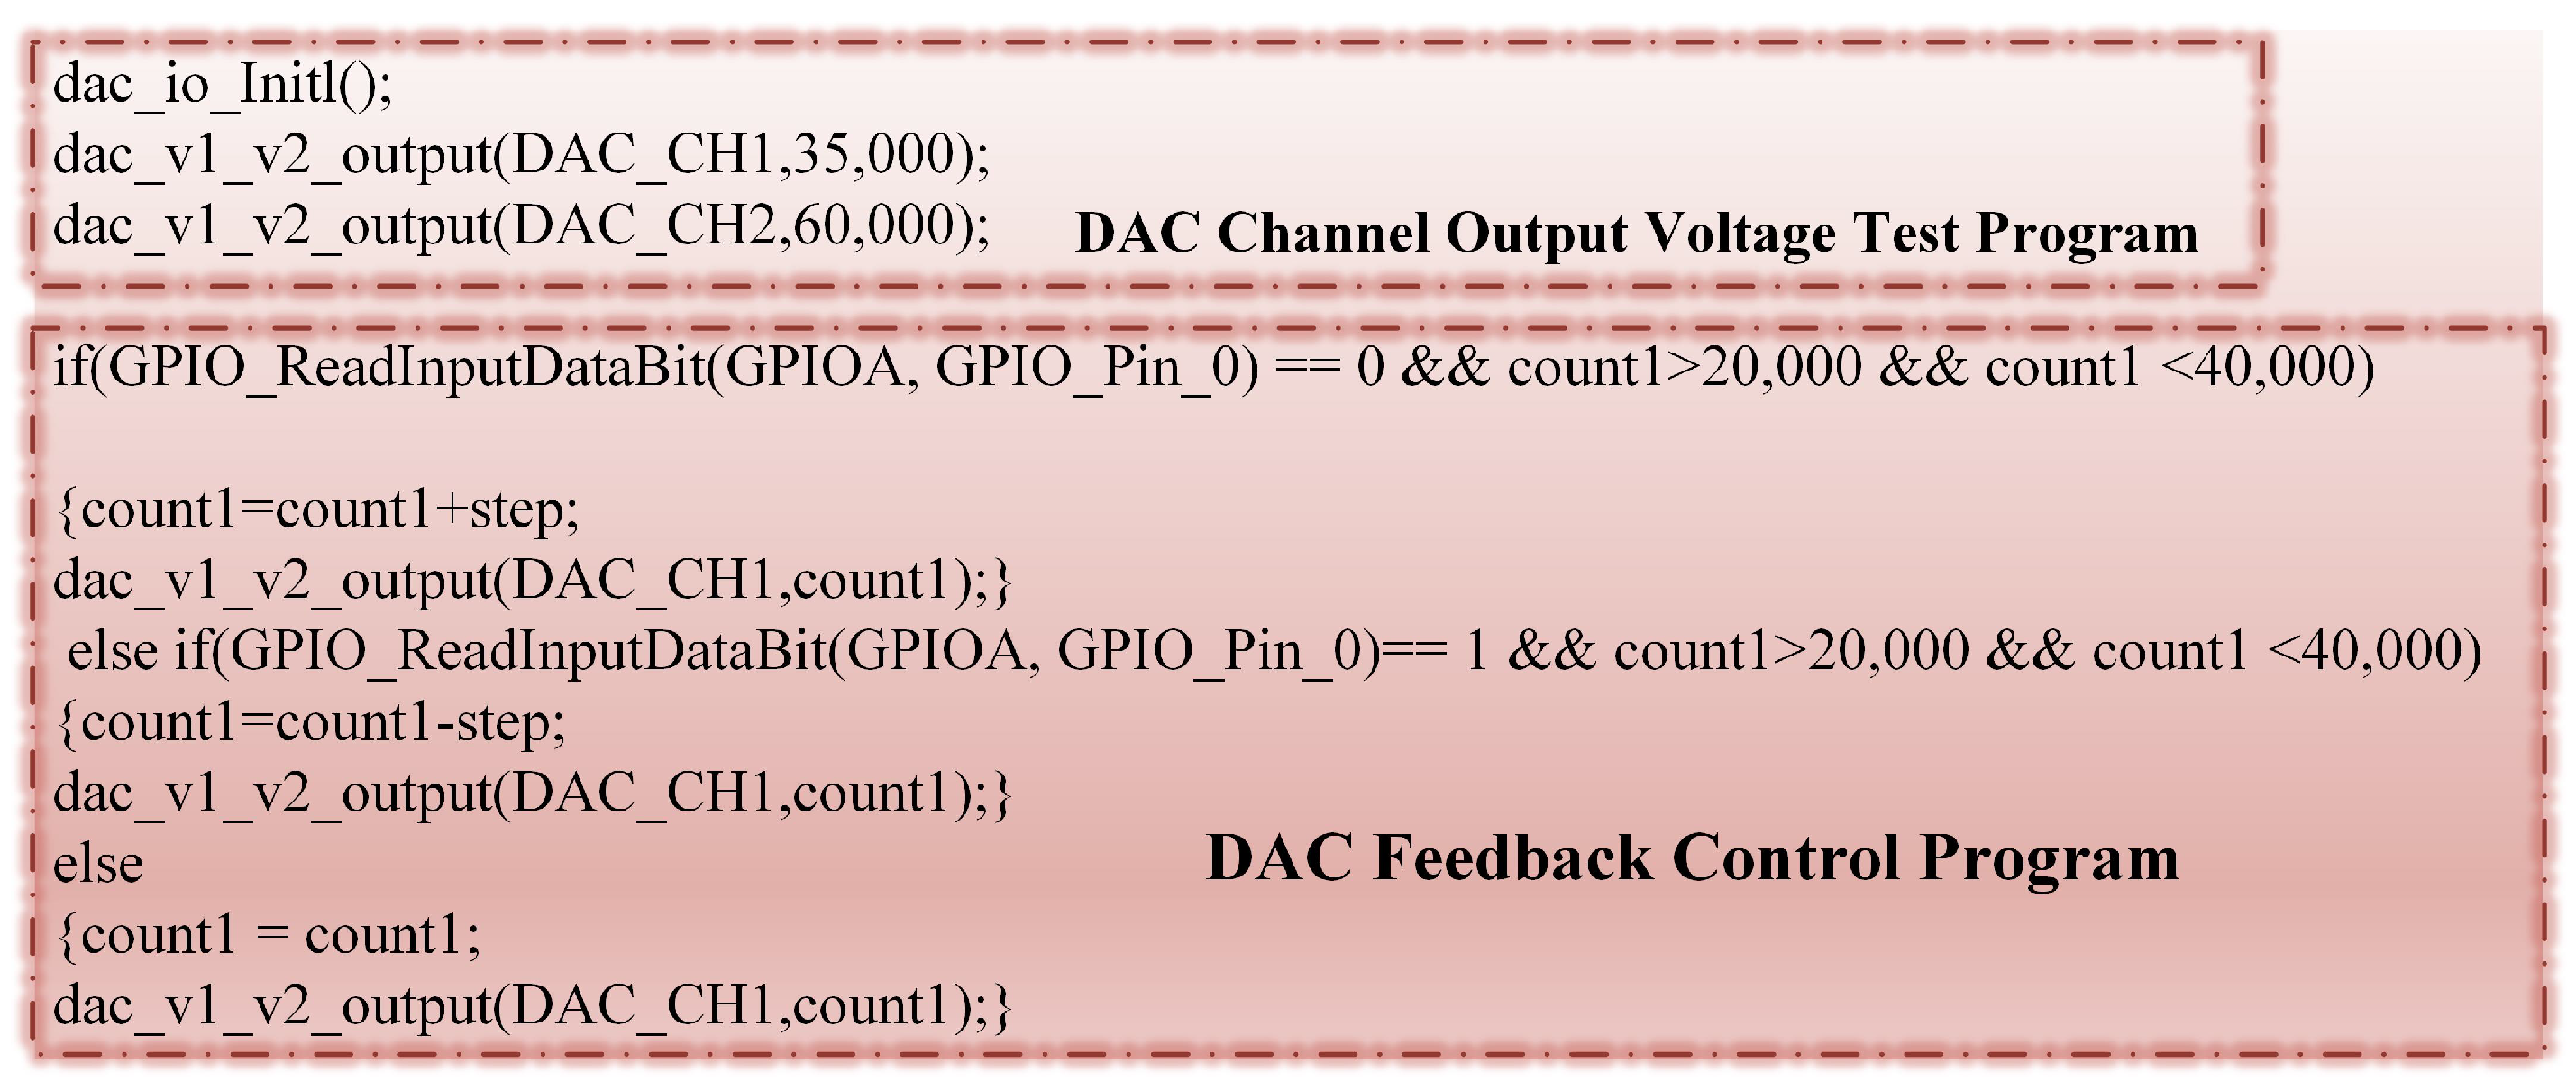
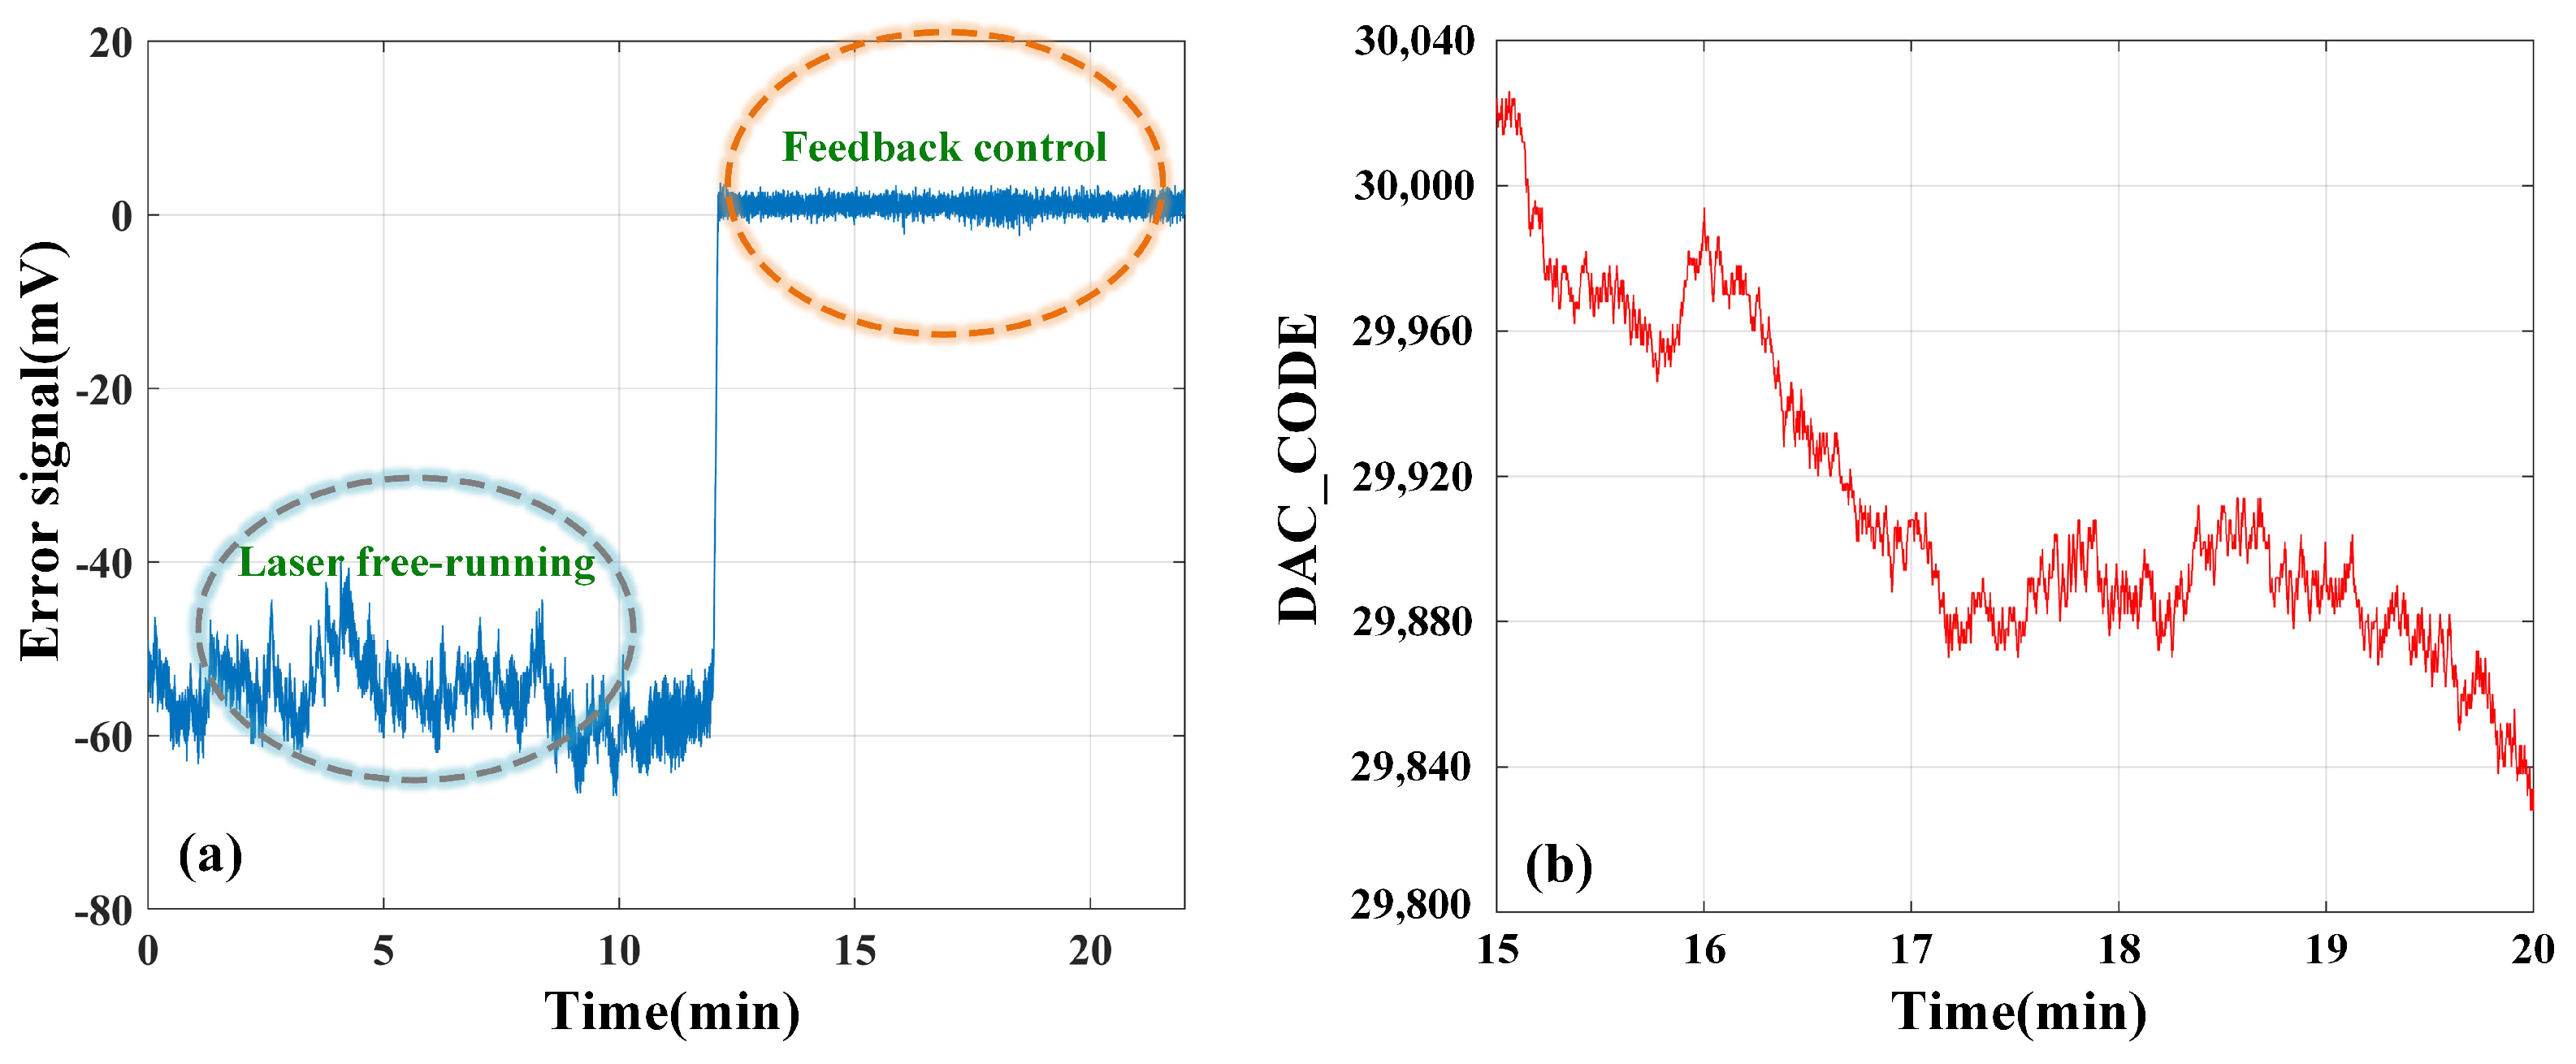
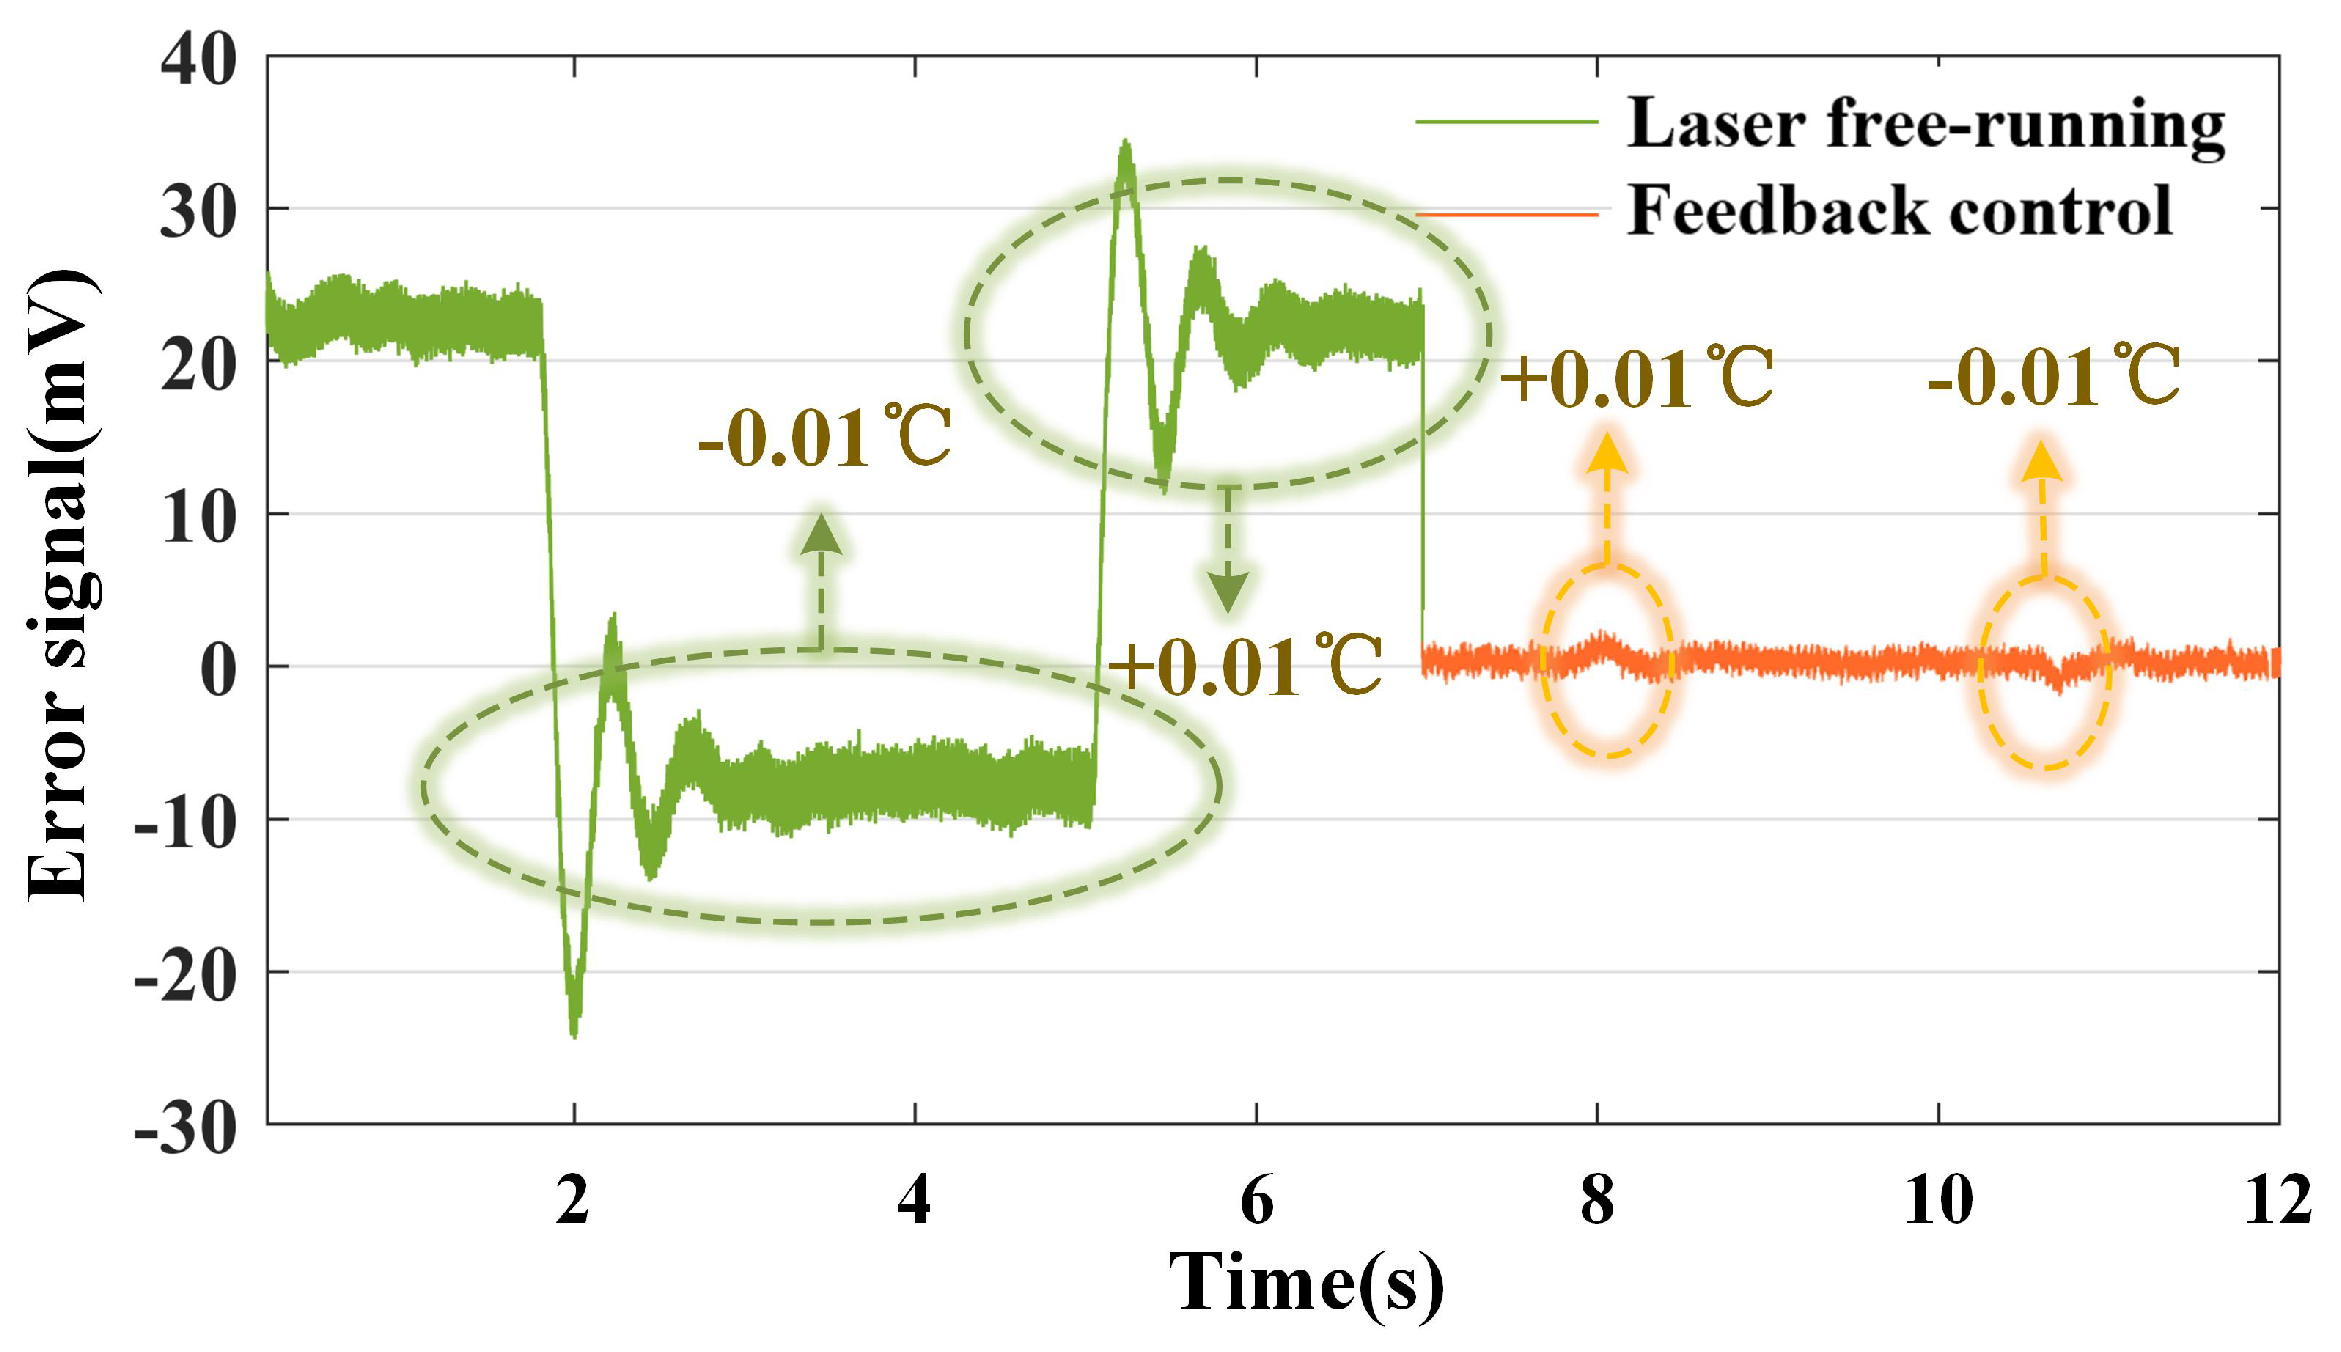
4.2. Automatic Frequency Stabilization after Power on

According to Figure 2 and Equations (3) and (6), when the laser output frequency is aligned with that of the acetylene gas absorption peak, the theoretical value of the error signal should be zero, given that the threshold voltage setting of the comparator should be positive, and the threshold voltage of the comparator was set to 1 mV.
When the feedback control system was not operating, that is, the laser was running freely, the error signal fluctuates owing to the laser frequency drift (first half of Figure 8a). After the feedback control system was powered on, the MCU began judging the current laser output frequency relative to the acetylene gas absorption peak based on the high and low levels received from the comparator. The MCU controlled the output voltage of the DAC to complete the feedback control of the laser temperature and current control modules. The error signal was generated to rapidly approach the threshold voltage until it was locked near the threshold voltage to realize the laser frequency stabilization function (latter part of Figure 8a). During the operation of the frequency stabilization system, we recorded the DAC output code (DAC_CODE) and selected results from 15 to 20 min, as shown by the red line in Figure 8b. It can be seen that throughout the stabilization process, the MCU adjusted the DAC output by comparing the detected error signal with the threshold. This adjustment stabilized the laser’s central frequency, as the error signal was locked at the comparator’s threshold voltage.
Further testing the stability of the frequency stabilization system, for a free-running laser, with change in the laser working temperature, the error signal fluctuated significantly owing to the change in the laser frequency (indicated by the green line in Figure 9). When the frequency stabilization system was powered on, the error signal was locked near the threshold voltage, and changes in the laser working temperature did not cause a fluctuation in the error signal, with the error signal remaining near the threshold value (indicated by the red line in Figure 9). With an experimental observation time of more than 6 h, the frequency-stabilized laser did not lose its lock, indicating that this frequency-stabilization device was suitable for long-term operation with fluctuations in environmental factors.

4.3. Frequency Stability Estimation

The effectiveness of frequency stabilization can be measured using a simple frequency stability measure, which is calculated by combining the fluctuation amplitude of the feedback error signal and the frequency discrimination sensitivity to invert the laser frequency fluctuation [30,31,32].
After the LPF, the output voltage was the error signal, which reflected the size of the laser output frequency deviation from the center of the acetylene absorption peak (1530.4 nm). From Equation (6) and the first-order derivative of the transmission peak in Figure 2, it was observed that when the laser output frequency coincided with the center frequency of the absorption peak, the error signal was 0. When the laser output wavelength was to the right of the transmission peak center frequency, the feedback DC signal reached its maximum value. The discriminant sensitivity was related to the slope of the first-order derivative signal at the zero-crossing point because the first-order function within the 3 dB linewidth (7 pm) of the acetylene absorption peak approximately exhibited linear variation. Herein, the operating temperature was changed such that the laser output frequency shifted to the half-width Δ v m of the absorption peak. The discriminant slope F s d of acetylene gas absorption can be obtained as follows:
F s d = Δ V Δ v m
where Δ V is the maximum change in the feedback DC signal. The half-width Δ v m of the absorption peak of the acetylene absorption chamber at 1530.40 nm was 440 MHz. When the output frequency of the laser deviated from the absorption peak equal to this half-width, the amplitude of the error signal was the highest. As shown in Figure 10, the error signal was measured to be 100 mV. Therefore, the slope of the discriminative frequency curve for acetylene was 0.23 mV/MHz. Thus, the stability of the output frequency of the laser is determined by measuring the voltage stability of the error signal.
As shown in Figure 11a,b, the variations in the error signal during the free operation of the laser and feedback control were measured. To measure the stability of the laser frequency, the Allan variance was calculated for average integration times between 0.1–300 s for both sets of data, as shown in Figure 11c. The green line in Figure 11c, indicated that the value of Allan variance of the laser when the frequency was not stabilized reached a minimum value of 0.46 mv for an integration time of 0.3 s; consequently, an increasing trend was observed. The red line in Figure 11c, indicated that the Allan variance decreased after frequency stabilization, reaching a minimum value of 0.012 mV at an integration time of about 100 s, after which the stability trend stabilized. The laser output frequency after feedback control was two orders of magnitude lower than that in the free operation, and the stability improved by more than hundred times. Based on the discriminative slope obtained using Equation (8), the frequency of the DFB laser was stabilized within 100 kHz in 100 s; that is, the frequency stability reached 10 10 in 100 s. For long-term stability, the root mean square error of the error signal was calculated to be 0.41 mV for 6 h of system operation. The value of the discriminative slope obtained from Equation (8) indicated that the frequency fluctuation was stable within 1.8 MHz, that is, the frequency stability reached 10 9 in 6 h.

5. Conclusions

A low-cost 1.5- μ m DFB frequency-stabilized laser with a simple structure was developed using the digital control method, combining the wavelength modulation technique and C 2 H 2 absorption. The optical devices in this system incorporated fiber input and output types for simplifying the optical path and reducing the size. The error signal was obtained by first-order differentiation, wherein the design implemented a combination of a high-speed comparator circuit and an MCU for error-signal identification. By setting the threshold value of the high-speed comparator, the locking point of laser frequency stabilization was varied within a small range. The addition of MCU digital assistance realized automatic frequency stabilization at power-on, and the anti-interference ability of external environmental fluctuations was strong. The second-level frequency stability of the laser was controlled to have an order of 10 10 with an integration time of about 100 s, which was two orders of magnitude better than that before stabilization, representing an improvement of over 100 times. For long-term frequency stability, the system operated stably for over 6 h, with the laser’s frequency stability control being within the 10 9 range, demonstrating a significant frequency stabilization effect. Our research has demonstrated significant advantages in terms of frequency stability, system volume, cost, and long-term stability. By employing high-speed comparators and MCU digital assistance for stable control, we have significantly improved the frequency stability of lasers at low cost and with simplified structure. Compared to existing laser frequency stabilization methods and other published research, our system can operate for extended periods and maintain high frequency stability over a wide temperature range. This indicates that our research has significant innovation and practicality in laser frequency stabilization technology compared to other related work.

Author Contributions

Conceptualization, J.W. and Y.G.; software, and Y.G.; validation, J.W., Y.G., J.Y. and Z.C.; writing—original draft preparation, Y.G.; writing—review and editing, J.W., J.Y. and H.L.; supervision, J.W., J.Y. and C.M. All authors have read and agreed to the published version of the manuscript.

Funding

This research was supported by the National Natural Science Foundation of China under Grant 62005194.

Institutional Review Board Statement

Not applicable.

Informed Consent Statement

Not applicable.

Data Availability Statement

The raw data supporting the conclusions of this article will be made available by the authors on request.

Conflicts of Interest

The authors declare no conflict of interest.

References

  1. Takamoto, M.; Hong, F.-L.; Higashi, R.; Katori, H. An optical lattice clock. Nature 2005, 435, 321–324. [Google Scholar] [CrossRef] [PubMed]
  2. Predehl, K.; Grosche, G.; Raupach, S.M.; Droste, S.; Terra, O.; Alnis, J.; Legero, T.; Hänsch, T.W.; Udem, T.; Holzwarth, R.; et al. A 920-kilometer optical fiber link for frequency metrology at the 19th decimal place. Science 2012, 336, 441–444. [Google Scholar] [CrossRef] [PubMed]
  3. Wu, M.; Fan, X.; Liu, Q.; He, Z. Quasi-distributed fiber-optic acoustic sensing system based on pulse compression technique and phase-noise compensation. Opt. Lett. 2019, 44, 5969–5972. [Google Scholar] [CrossRef] [PubMed]
  4. Billault, V.; Arpison, G.; Crozatier, V.; Kemlin, V.; Morvan, L.; Dolfi, D.; de Chatellus, H.G. Coherent optical fiber sensing based on a frequency shifting loop. J. Light. Technol. 2021, 39, 4118–4123. [Google Scholar] [CrossRef]
  5. Saleh, K.; Millo, J.; Didier, A.; Kersalé, Y.; Lacroûte, C. Frequency stability of a wavelength meter and applications to laser frequency stabilization. Appl. Opt. 2015, 54, 9446–9449. [Google Scholar] [CrossRef]
  6. Bennetts, S.; McDonald, G.D.; Hardman, K.S.; Debs, J.E.; Kuhn, C.C.; Close, J.D.; Robins, N.P. External cavity diode lasers with 5 khz linewidth and 200 nm tuning range at 1.55 μm and methods for linewidth measurement. Opt. Express 2014, 22, 10642–10654. [Google Scholar] [CrossRef] [PubMed]
  7. Spencer, A.; Barr, B.; Bell, A.; Briggs, J.; Minty, A.; Sorazu, B.; Wright, J.; Strain, K. Frequency noise stabilisation of a 1550 nm external cavity diode laser with hybrid feedback for next generation gravitational wave interferometry. Opt. Express 2022, 30, 22687–22699. [Google Scholar] [CrossRef] [PubMed]
  8. Xin, L.; Cheng, X.; Li, F.; Yang, Y.; Wu, K.; Li, Y.; Xia, Y.; Gong, S. Temperature-insensitive laser frequency stabilization to molecular absorption edge using an acousto-optic modulator. Opt. Lett. 2014, 39, 4416–4419. [Google Scholar] [CrossRef]
  9. Li, J.; Liu, J.; de Melo, L.; Luo, L.; Lai, T.; Wang, Z. Sub-megahertz frequency stabilization of a diode laser by digital laser current modulation. Appl. Opt. 2015, 54, 3913–3917. [Google Scholar] [CrossRef]
  10. McFerran, J.J. Laser stabilization with a frequency-to-voltage chip for narrow-line laser cooling. Opt. Lett. 2018, 43, 1475–1478. [Google Scholar] [CrossRef]
  11. Zhou, P.; Sun, W.; Liang, S.; Chen, S.; Zhou, Z.; Huang, Y.; Guan, H.; Gao, K. Digital long-term laser frequency stabilization with an optical frequency comb. Appl. Opt. 2021, 60, 6097–6102. [Google Scholar] [CrossRef] [PubMed]
  12. Wang, K.; Tian, H.; Meng, F.; Lin, B.; Cao, S.; Pi, Y.; Han, Y.; Fang, Z.; Song, Y.; Hu, M. Fiber-delay-line-referenced optical frequency combs: Three stabilization schemes. Chin. Opt. Lett. 2022, 20, 021204. [Google Scholar] [CrossRef]
  13. Wang, J.; Gao, J.; Yang, B. Comparison of frequency locking of 780 nm diode laser via rubidium saturated absorption and polarization spectroscopies. Chin. Opt. 2011, 4, 305–312. [Google Scholar]
  14. Aldous, M.; Woods, J.; Dragomir, A.; Roy, R.; Himsworth, M. Carrier frequency modulation of an acousto-optic modulator for laser stabilization. Opt. Express 2017, 25, 12830–12838. [Google Scholar] [CrossRef] [PubMed]
  15. Yasui, S.; Hiraishi, M.; Ishizawa, A.; Omi, H.; Kaji, R.; Adachi, S.; Tawara, T. Precise spectroscopy of 167ER: Y2SIO5 based on laser frequency stabilization using a fiber laser comb. Opt. Express 2021, 29, 27137–27148. [Google Scholar] [CrossRef] [PubMed]
  16. Bösel, A.; Salewski, K.D. Fast mode-hop-free acousto-optically tuned laser: Theoretical and experimental investigations. Appl. Opt. 2009, 48, 818–826. [Google Scholar] [CrossRef] [PubMed]
  17. Fu, S.; Shi, W.; Feng, Y.; Zhang, L.; Yang, Z.; Xu, S.; Zhu, X.; Norwood, R.A.; Peyghambarian, N. Review of recent progress on single-frequency fiber lasers. JOSA B 2017, 34, A49–A62. [Google Scholar] [CrossRef]
  18. Lu, D.; Yang, Q.L.; Wang, H.; He, Y.M.; Qi, H.F.; Wang, H.; Zhao, L.J.; Wang, W. Review of semiconductor distributed feedback lasers in the optical communication band. Chin. J. Lasers 2020, 47, 11–29. [Google Scholar]
  19. Numata, K.; Chen, J.R.; Wu, S.T.; Abshire, J.B.; Krainak, M.A. Frequency stabilization of distributed-feedback laser diodes at 1572 nm for lidar measurements of atmospheric carbon dioxide. Appl. Opt. 2011, 50, 1047–1056. [Google Scholar] [CrossRef]
  20. Sun, Y.; Wei, F.; Dong, Z.; Chen, D.; Cai, H.; Qu, R. All-optical frequency stabilization and linewidth reduction of distributed feedback diode lasers by polarization rotated optical feedback. Opt. Express 2014, 22, 15757–15762. [Google Scholar] [CrossRef]
  21. Du, J.; Sun, Y.; Chen, D.; Mu, Y.; Huang, M.; Yang, Z.; Liu, J.; Bi, D.; Hou, X.; Chen, W. Frequency-stabilized laser system at 1572 nm for space-borne CO2 detection lidar. Chin. Opt. Lett. 2017, 15, 031401. [Google Scholar]
  22. Guo, J.-J.; Liu, J.; Zhu, N.; Deng, Y.; Chen, W.; Tang, J.; Wang, Q. Frequency stabilization of a semiconductor laser based on gas absorption cell. In Proceedings of the 2016 25th Wireless and Optical Communication Conference (WOCC), Chengdu, China, 21–23 May 2016. [Google Scholar]
  23. Mei, J.X.; Wang, L.; Tan, T.; Liu, K.; Wang, G.S.; Gao, X.M. Research on new method of frequency stabilization of dfb laser based on second harmonic characteristics. Spectrosc. Spectr. Anal. 2019, 39, 2989–2992. [Google Scholar]
  24. Swann, W.C.; Gilbert, S.L. Pressure-induced shift and broadening of 1510–1540-nm acetylene wavelength calibration lines. JOSA B 2000, 17, 1263–1270. [Google Scholar] [CrossRef]
  25. Rothman, L.S.; Gordon, I.E.; Babikov, Y.; Barbe, A.; Benner, D.C.; Bernath, P.F.; Birk, M.; Bizzocchi, L.; Boudon, V.; Brown, L.R.; et al. The hitran2012 molecular spectroscopic database. J. Quant. Spectrosc. Radiat. Transf. 2013, 130, 4–50. [Google Scholar] [CrossRef]
  26. Zektzer, R.; Hummon, M.T.; Stern, L.; Sebbag, Y.; Barash, Y.; Mazurski, N.; Kitching, J.; Levy, U. A chip-scale optical frequency reference for the telecommunication band based on acetylene. Laser Photonics Rev. 2020, 14, 1900414. [Google Scholar] [CrossRef] [PubMed]
  27. Wang, X.B.; Ma, W.G.; Wang, J.J.; Xiao, L.T.; Jia, S.T. Single photon wavelength modulation absorption spectrum of acetylene for 1.5 μm laser wavelength stabilization. Opt. Express 2012, 61, 104205. [Google Scholar]
  28. Santiago, R.; Bedia, J.; Moreno, D.; Moya, C.; Riva, J.D.; Larriba, M.; Palomar, J. Acetylene absorption by ionic liquids: A multiscale analysis based on molecular and process simulation. Sep. Purif. Technol. 2018, 204, 38–48. [Google Scholar] [CrossRef]
  29. Park, J.; Seok, J.; Hong, J. Autoencoder-based signal modulation and demodulation methods for sonobuoy signal transmission and reception. Sensors 2022, 22, 6510. [Google Scholar] [CrossRef] [PubMed]
  30. Wang, Q.; Lai, S.; Qi, X.; Wang, Z.; Chen, X. Design of laser frequency stabilization experiment system based on saturated absorption spectroscopy. Exp. Technol. Manag. 2021, 38, 23–28. [Google Scholar]
  31. Zhou, K.; Zhao, H.; Yu, T.; Xue, L.; Ma, X. Frequency stabilization of 1.53 μm FBG ECLD based on C2H2 absorption lines. Chin. J. Quantum Electron. 2005, 22, 603–606. [Google Scholar]
  32. Yao, Y.; Zou, C.; Yu, H.; Guo, J.; Li, Y.; Liu, J. The developing condition analysis of semiconductor laser frequency stabilization technology. J. Semicond. 2018, 39, 114004. [Google Scholar] [CrossRef]
Figure 1. (a) Distribution of the acetylene−gas transmission peak near 1530 nm; (b) Detailed view of the absorption peak at 3 dB.
Photonics 11 00621 g001
Figure 2. Diagram of acetylene absorption transmission line at 1530.4 nm and its first−order differential curve.
Photonics 11 00621 g002
Figure 3. Demodulated signal at different positions of the absorption peak for the reference wavelength of the laser.
Photonics 11 00621 g003
Figure 4. DFB-LD frequency stabilization system block diagram; DFB-LD: distributed feedback semiconductor laser; TEC: Thermo Electric Cooler; CC: current control; OC: coupler; C 2 H 2 : acetylene gas absorption chamber; PD: photodetector; AMP: electrical amplifier; MIX: multiplier; LPF: low-pass filter; MC: electrical tee connector; Capture Card: signal acquisition card; Comparator: high-speed comparator; MCU: micro control unit; DAC: digital-to-analog converter module; AWG: signal generator.
Photonics 11 00621 g004
Figure 5. The influence of current and temperature tuning on laser wavelength. (a) Effect of temperature variation on laser wavelength; (b) Effect of current variation on laser wavelength.
Photonics 11 00621 g005
Figure 6. Main program for the MCU to control the DAC module.
Photonics 11 00621 g006
Figure 7. Relationship between laser drive current and DAC encoding value.
Photonics 11 00621 g007
Figure 8. (a) The error signal of laser free−running and feedback control; (b) The change of DAC code values of laser feedback.
Photonics 11 00621 g008
Figure 9. The influence of changing the laser operating temperature on the error signal.
Photonics 11 00621 g009
Figure 10. The schematic diagram of the maximum value of the feedback DC signal.
Photonics 11 00621 g010
Figure 11. The error signals depicted (a) when the laser operates freely and (b) when the frequency stabilization system is implemented; and (c) Allan variance of free−running laser and feedback control.
Photonics 11 00621 g011
Disclaimer/Publisher’s Note: The statements, opinions and data contained in all publications are solely those of the individual author(s) and contributor(s) and not of MDPI and/or the editor(s). MDPI and/or the editor(s) disclaim responsibility for any injury to people or property resulting from any ideas, methods, instructions or products referred to in the content.

