Article

Numerical Simulation of the Laser Welding Process for Diamond Saw Blades

1
Central Iron & Research Institute, Beijing 100081, China
2
Beijing Gang Yan Diamond Products Company, Beijing 102200, China
3
College of Engineering, Shantou University, Shantou 515063, China
*
Authors to whom correspondence should be addressed.
These authors contributed equally to this work.
Photonics 2024, 11(7), 676; https://doi.org/10.3390/photonics11070676
Submission received: 27 June 2024 / Revised: 11 July 2024 / Accepted: 18 July 2024 / Published: 19 July 2024
(This article belongs to the Special Issue Laser Processing and Modification of Materials)

Abstract

:
The development and application of laser welding transition layer technology is pivotal for manufacturing high-performance diamond saw blades. Despite its importance, there is a need for more precise modeling to optimize welding parameters and enhance blade performance. This study employs SYSWELD software to simulate the laser welding process, demonstrating high accuracy in predicting the molten pool shape. A cross-scale multi-field coupling model was established using the finite element method, incorporating temperature field, phase transformation, grain morphology, stress field, and fatigue performance. A comprehensive life cycle assessment identified optimal welding parameters. The results indicate that a laser welding speed of 26 mm/s and a power of 1700 W minimize weld stress, reduce the digital volume correlation (DVC) value, and enhance fatigue resistance. Additionally, welding tests confirmed that using 1700 W produced the highest tooth strength of 1200 MPa, validating the simulation results. This study addresses existing gaps in modeling accuracy and parameter optimization, offering a robust framework for improving the performance and reliability of laser-welded diamond saw blades.

1. Introduction

The advancement of laser technology has significantly enhanced the importance of laser welding within the domain of laser processing technology [1]. Laser welding is distinguished by minimal workpiece deformation, a high depth-to-width ratio, a small heat-affected zone, and an ability to operate in non-vacuum environments without generating X-rays during the process [2,3,4,5,6,7]. These attributes have facilitated its widespread application across several industrial sectors, including mechanical manufacturing, aerospace, automotive and shipbuilding, metallurgical technology, biomedicine, and microelectronics [8,9].
Due to its distinctive welding attributes, laser welding technology has achieved breakthroughs in dissimilar metal joining. Notably, it is progressively replacing conventional methods in diamond tool production. Laser welded diamond saw blades are widely used in gemstones, medical equipment, wood, glass fiber, stone crafts, ceramics, cemented carbide composite materials, and other emerging fields. Optimizing welding process parameters and enhancing welding strength through numerical simulation are essential to meet the increasing safety requirements of diamond saw blades.
In the field of numerical simulation of welding, finite element analysis helps to predict residual stress and deformation at the design stage, thus, reducing cost and effort. Numerous researchers have carried out thermo-mechanical analysis of laser welding of different materials. For instance, Zubairuddin et al. [10] used the SYSWELD software (version 2021.0) to analyze the laser welding of thick plates of Grade 91 steel, optimizing heat input conditions. Similarly, Ramos et al. [11] employed SYSWELD to investigate both laser welding and arc welding of T-shaped joints between steel pipes and plates, discussing the influence of different processes on residual stress. Their findings indicated a significantly reduced heat-affected zone and limited tensile residual stress.
In addition, Lu et al. [12] carried out a numerical analysis on the welding residual stress of butt welded joints of thick steel plates and studied the distribution of surface residual stress and the influence of steel plate thickness on the residual surface stress. Hong et al. [13] studied the effect of welding speed on the microstructure and mechanical properties of laser welded joints of selective laser melting Inconel 625 alloy and obtained that the tensile strength and elongation of the alloy increased with the increase of welding speed. The joint tensile strength exceeds 875 MPa, and the joint efficiency reaches 97.8%. The joint elongation is close to 39.8%, reaching 94.8% of the base material. Heinze et al. [14,15] studied the impact of heat source configuration on the quality of numerical welding deformation results, utilizing volumetric Gaussian and double-ellipsoidal Goldak heat sources. They clarified the effect of heat source configuration on calculation results, enhancing the prediction of weld-induced deformation.
Chen et al. [16] performed numerical simulations and experimental research on the microstructure and residual stress of multi-pass laser arc composite welding of 316L steel. They proposed a suitable heat source model for simulating both laser arc welding and laser beam welding, with simulation results validated against experimental data. Similarly, Du et al. [17] simulated and evaluated the properties of laser composite arc welding of chrome–molybdenum steel. They established a thermometallurgical finite element model for predicting the phase field and weld pool size in double butt welded chrome–molybdenum steel plates during the hybrid laser arc welding process. The predicted phase field and molten pool size showed good agreement with the experimental results, indicating that the numerical model has the potential to guide the development of the hybrid laser arc welding process. Zubairuddin et al. [18] performed thermal analysis using FlexPDE and SYSWELD on thin P91 steel and gas tungsten arc welding on a 2 mm thick ferritic martensitic steel plate based on the finite element method (FEM). They demonstrated that the weld profile predicted by their heat source fitting tool was consistent with their FEM-based predictive model profile. Sun et al. [19] investigated the influence of material hardening models on the calculation of welding residual stress in ultra-high-strength steel S960, as well as the impact of material laws on simulated residual stress in welded components made from this steel grade with exceptional strength properties at both room and high temperatures. Zubairuddin et al. [20] employed two-dimensional, three-dimensional coarse mesh and three-dimensional fine mesh models to conduct a thermodynamic analysis of multi-pass GTA welding on 6 mm thick class 91 steel plates. The double ellipsoidal heat source model was utilized for preheating simulation, while disc-shaped heat sources were used to simulate GTA welding. Analysis results demonstrated that preheating up to 200 °C significantly reduced deformation during multi-pass welding of class 91 steel plates. Zhang et al. [21] examined the effects of multi-beam preheating temperature and stress on buckling deformation in electron beam welding processes using a conical Gaussian heat source model for welding and a rectangular uniform plane heat source model for multi-beam preheating simulations. Temperature distribution, thermal stress, and weld deformations were simulated for SUS304 stainless steel sheets after electron beam welding, confirming the feasibility of multi-beam preheated electron beam welding. Zhang et al. [22] conducted numerical and experimental investigations into the formation mechanism and distribution of residual stress in combined laser arc welding (CLAW) processes applied to AH36 steel materials. A thermo-metallurgic–mechanical (TMM) model was established using SYSWELD software to study the distribution and formation mechanism of WRS in CLAW processes involving AH36 steel materials. The numerical results exhibited good agreement with experimental data.
Zhang et al. [23] have carried out a numerical simulation on the residual stress of the butt weld of complex column–beam welding structures. The influence of structural constraints and adjacent joints on the distribution and evolution of the final residual stress of the joint between the diaphragm and flange in the column–beam welded structure is described. Based on ABAQUS software (Version 2023), a three-dimensional thermo-mechanical coupling prediction method for residual stress distribution of multi-pass welded joints was established. Building on this foundation, Zhan et al. [24] carried out a simulation calculation and experimental research on the melting zone of a wide-band laser modified roll. A three-dimensional finite element model was established to simulate the wide-band laser remelting process and to predict the thermal and mechanical properties of the melting hard zone. Muhammad et al. [25] carried out numerical simulations to predict the deformation and residual stress of laser welding for aviation applications. They used finite element analysis to study the metallurgical phase transformation of AA 6056-T4 alloy and its effect on the residual stress and deformation state of laser-welded T-joints. Two independent models were studied using different finite element codes: the first for thermodynamic analysis using Abaqus and the second for mechanical analysis of hot metals using SYSWELD [26]. Yuan et al. [27] simulated the residual stress and fatigue strength of welded joints under ultrasonic impact treatment (UIT) and proposed a new three-dimensional numerical analysis method, including welding thermodynamic simulation and dynamic elastic–plastic finite element analysis of the ultrasonic impact treatment process of welded joints. The actual process parameters and ultrasound-induced material softening were considered, and appropriate adjustments were made to fit the experimental results. Yeo et al. [28] used a 3D fully coupled numerical model to study the microstructure and residual stress development of AH36 steel during laser surface melting. The numerical model established can reflect the actual laser melting process and predict the solid-state phase transition and stress development during melting. Yang et al. [29] discussed the effect of high-temperature exposure on the residual stress relief of a welded high-strength Q690 steel section through experimental and numerical studies. In the numerical study, the finite element analysis software ANSYS (version 2024 R1) was used to simulate the whole welding and high-temperature exposure stage, and the predicted residual stress after high temperature obtained by finite element analysis was in good agreement with the test results. Mahmoud et al. [30] used ABAQUS software to simulate the thermodynamic and metallurgical behavior of steel. The thermo-metallurgical and mechanical coupling was simulated using ABAQUS software, which is associated with phase transition and elastoplastic modules. Xu et al. [31] used SYSWELD to simulate the temperature and residual stress of NeT single slab specimens. In his research, an uncoupled three-dimensional thermodynamic analysis was performed using the software code SYSWELD. A double-biased double-ellipsoid heat source model was established and fitted using the heat source fitting tool. Xie et al. [32] conducted a numerical study on the dynamics of molten pool and solute distribution in laser deep penetration welding of steel and aluminum. A three-dimensional transient numerical model is established. Fluid flow, heat transfer, keyhole evolution, and mass transport between two different metals have been studied. The free surface was tracked by the fluid volume method (VOF). This study provides a new understanding of weld pool dynamics for laser welding of dissimilar metals and helps to guide the selection of welding parameters. Wang et al. [33] conducted numerical simulation and analysis on the temperature field of in-service multi-pass welding of sleeve fillet welds. The double ellipsoid heat source parameters for each welding head were determined using a heat source fitting method, resulting in a simulated weld pool morphology that closely matched the actual weld fillet welding head. By using the adjusted heat source, they employed the finite element method to numerically simulate the welding process, obtaining the temperature field for the multi-pass fillet weld.
The laser welding saw blade consists of three components: the working layer, the transition layer, and the matrix. The material properties of the transition layer and matrix significantly impact the intensity of laser welding. Simultaneously, the technological parameters of laser welding have a direct and substantial influence on welding intensity. Currently, there is a scarcity of numerical simulation studies on the diamond saw blade’s laser welding process. Additionally, by comparing with actual tooth results, optimal welding parameters can be determined. This holds great significance in enhancing the welding quality of diamond saw blades.

2. Calculation Method

2.1. Computation of Thermal Field

The welding technique employed for diamond saw blades is laser welding, and this study utilizes a 3D Gaussian heat source model to account for its characteristics. Specifically, the cross-sectional heat flux of the 3D heat source model exhibits a Gaussian distribution, characterized by lower energy in close proximity to the heat source and higher energy at its center. The entire heat source is modeled as a series of superimposed planar Gaussian heat sources along the depth direction. For high-power lasers, the beam profile may be slightly distorted (M2 > 1.3). The beam quality factor M2 indicates how much the laser beam deviates from an ideal Gaussian profile. An M2 value greater than 1.3 suggests that the beam profile is distorted, leading to a non-uniform energy distribution. The distortion in the beam profile affects the energy distribution on the material surface. This non-uniform energy distribution can result in variations in the temperature field and the shape of the molten pool, ultimately influencing the welding quality and mechanical properties of the weld. In practical scenarios, high-power laser beams often exhibit M2 values ranging from 1.3 to 2.0. For example, a laser with an M2 value of 1.5 may show a beam profile that is elongated or has multiple peaks rather than a single central peak typical of a perfect Gaussian distribution. To account for these distortions, we introduced correction factors in the simulation model. These factors adjust the energy distribution to reflect the actual beam profile observed in high-power lasers. By incorporating these adjustments, the model can more accurately simulate the welding process, providing results that closely match experimental data. The modified model was validated against experimental results obtained using high-power lasers with known M2 values. The adjusted simulations showed improved accuracy in predicting the temperature distribution and molten pool geometry, supporting the necessity of including beam profile distortions in the model.
This is schematically illustrated in Figure 1, which depicts the movement of a 3D Gaussian heat source model for a local joint butt test panel. The expression of the 3D Gaussian heat source model is presented below. To validate the accuracy of the heat source model, this study employs SYSWELD software.
Q = η P
q ( r , z ) = 9 η P e 3 π H ( e 3 1 ) ( r e 2 + r e r i + r i 2 ) exp 3 r 2 r 0 2
H = z e z i
r 2 = ( x x 0 ) 2 + ( y y 0 v t ) 2
r 0 = r e ( r e r i ) ( z e z ) z e z i
In Formula (1), Q represents the effective laser power, P denotes the laser power, and η stands for energy efficiency. In Formula (2), q(r,z) refers to the heat flux density distribution at a distance from the center position r, in plane H, with height z; H is the height of the heat source, e is a natural constant, re and ri are respectively upper and lower surface radii of the heat source, and r0 represents the maximum characteristic radius of the heat source on the z-coordinate plane. In Equations (3)–(5), ze represents the vertical distance between the workpiece surface and the upper surface of the heat source, zi represents the vertical distance between the workpiece surface and the lower surface of the heat source, v denotes welding speed, and t stands for welding time.
Laser welding can be simplified as a process of moving welding heat sources, where the temperature of the workpiece changes over time. By solving the nonlinear heat transfer equation below, we obtain the temperature history of each node during the welding process and transient temperature distribution across the entire model range.

2.2. Calculation of the Stress Field

In the SYSWELD stress field calculation model, the total strain is composed of elastic strain, plastic strain, phase transformation-induced plasticity, and thermal strain. The expression can be formulated as follows:
ε = ε e + ε p + ε t p + ε t h
Equation (6) ε e , ε p , ε t p , ε t h represents the cumulative plastic strain, elastic strain, plastic deformation due to slip, phase transformation-induced plasticity, and thermal expansion.
The models for calculating plastic strain and transformation-induced plasticity are presented below.
ε p c = 3 2 1 p 2 σ 1 y g ( p 2 ) E s σ e q + 3 ( α 1 α 2 ) σ 1 y p 2 ln ( p 2 ) s T
ε p t = 3 Δ ε 1 2 σ 1 y h σ e q σ u s ln ( p 2 ) p 2
Δ ε 1 2 t h is thermal strain difference between two phases, S is the macroscopic homogenization deviation tensor, α is the coefficient of thermal expansion, h ( σ e q σ u ) is a check function, 1 − P2 is the volume fraction of austenite in the Leblond equation, and P2 is the volume fraction of ferrite, bainite, or martensite. The thermal strain calculation model is as follows:
ε t h ( T ) = P h a s e s p k . ε K t h ( T )
ε k t h ( T ) = α k ( T ) T T i n i
In Equations (9) and (10), the thermal strain of phase k, the coefficient of thermal expansion of phase k, and the ratio of phase k.

3. Results and Discussion

3.1. Parameters for Materials and Welding Processes

The LW230 diamond saw blade was selected for the purpose of this welding simulation, with the detailed geometric parameters presented in Table 1 below. The circular saw blade is primarily composed of two distinct materials, namely, a Cu+Ni+Fe alloy for the working and transition layers and 30CrMo for the substrate material. Figure 2 and Figure 3 illustrate the thermophysical and mechanical properties parameters specifically for 30CrMo, while Figure 4 and Figure 5 depict those for the Cu+Ni+Fe alloy.

3.2. Refinement of the Welding Finite Element Model
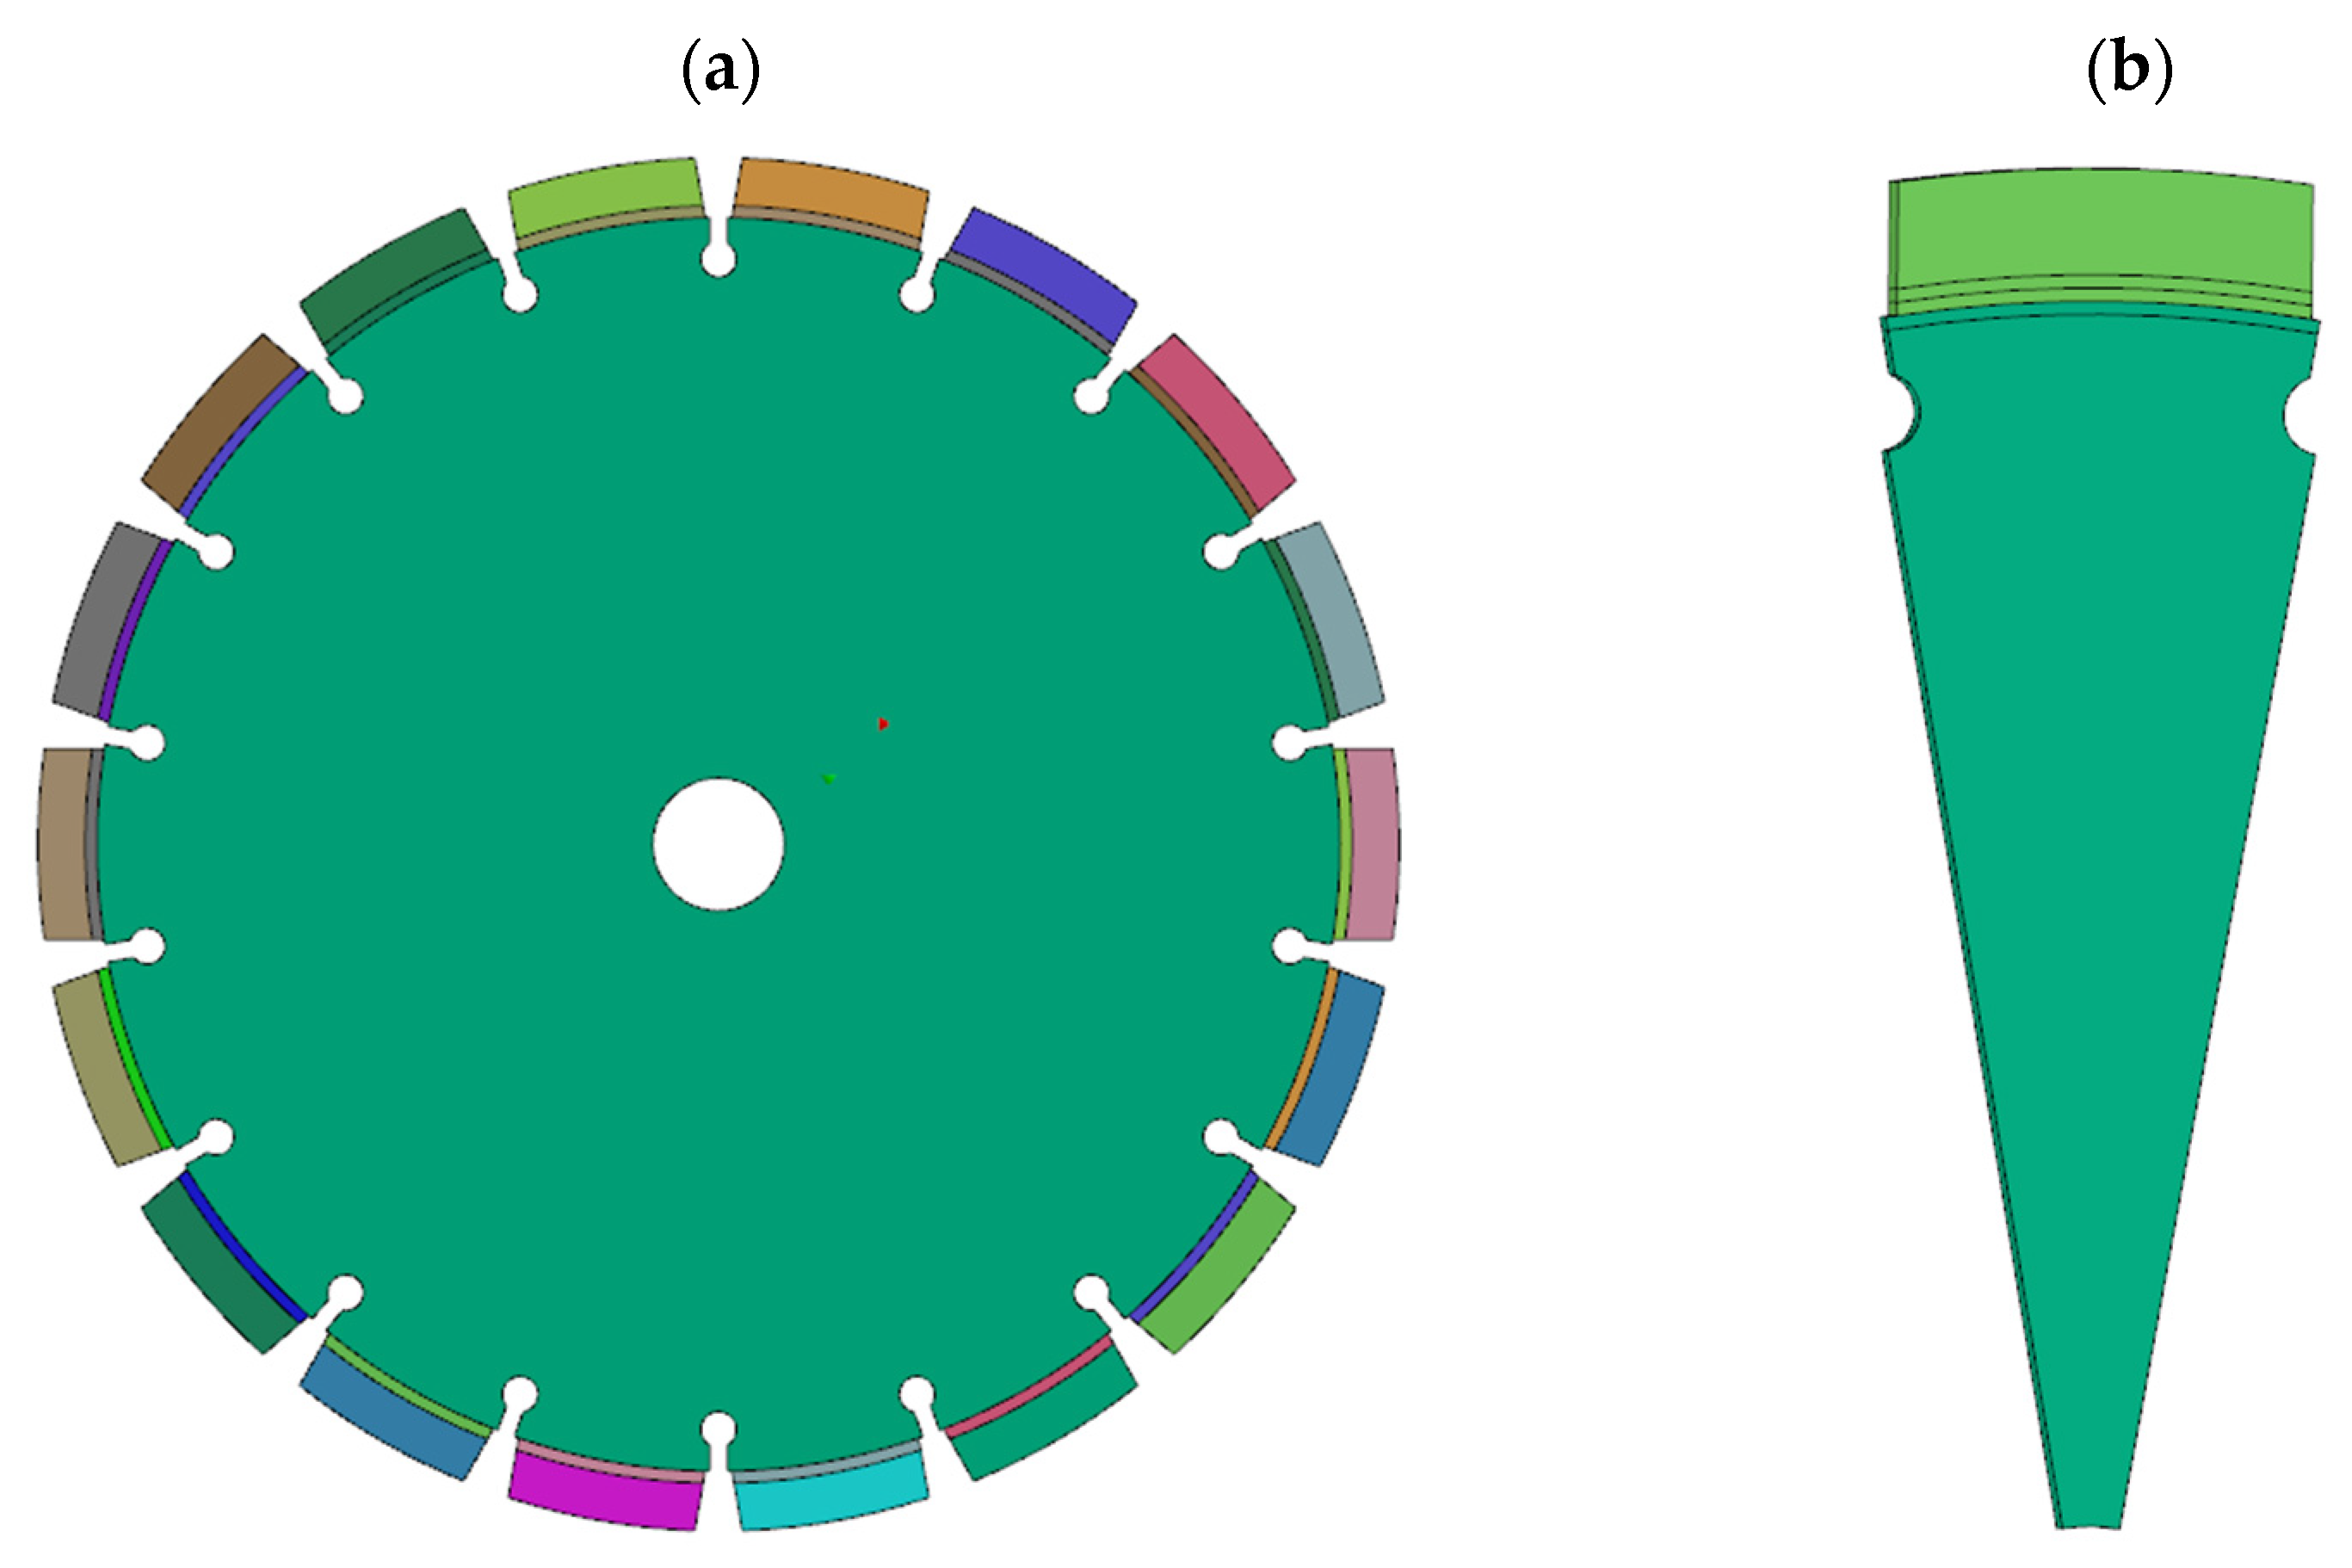
3.2.1. 3D Modeling

Refined the LW230 model in Solidworks, incorporating detailed representations of the substrate, working layer, and transition layer. We subsequently extracted a 1/18 scale model and imported it into SYSWELD software for grid division. The three-dimensional model diagram is illustrated in Figure 6a (overall view) and Figure 6b (partial view).
This model accurately captures the geometric nuances of the laser welding process and ensures high fidelity in the simulation results. Furthermore, the grid division was meticulously designed to balance computational efficiency with simulation accuracy, enhancing predictive capabilities.

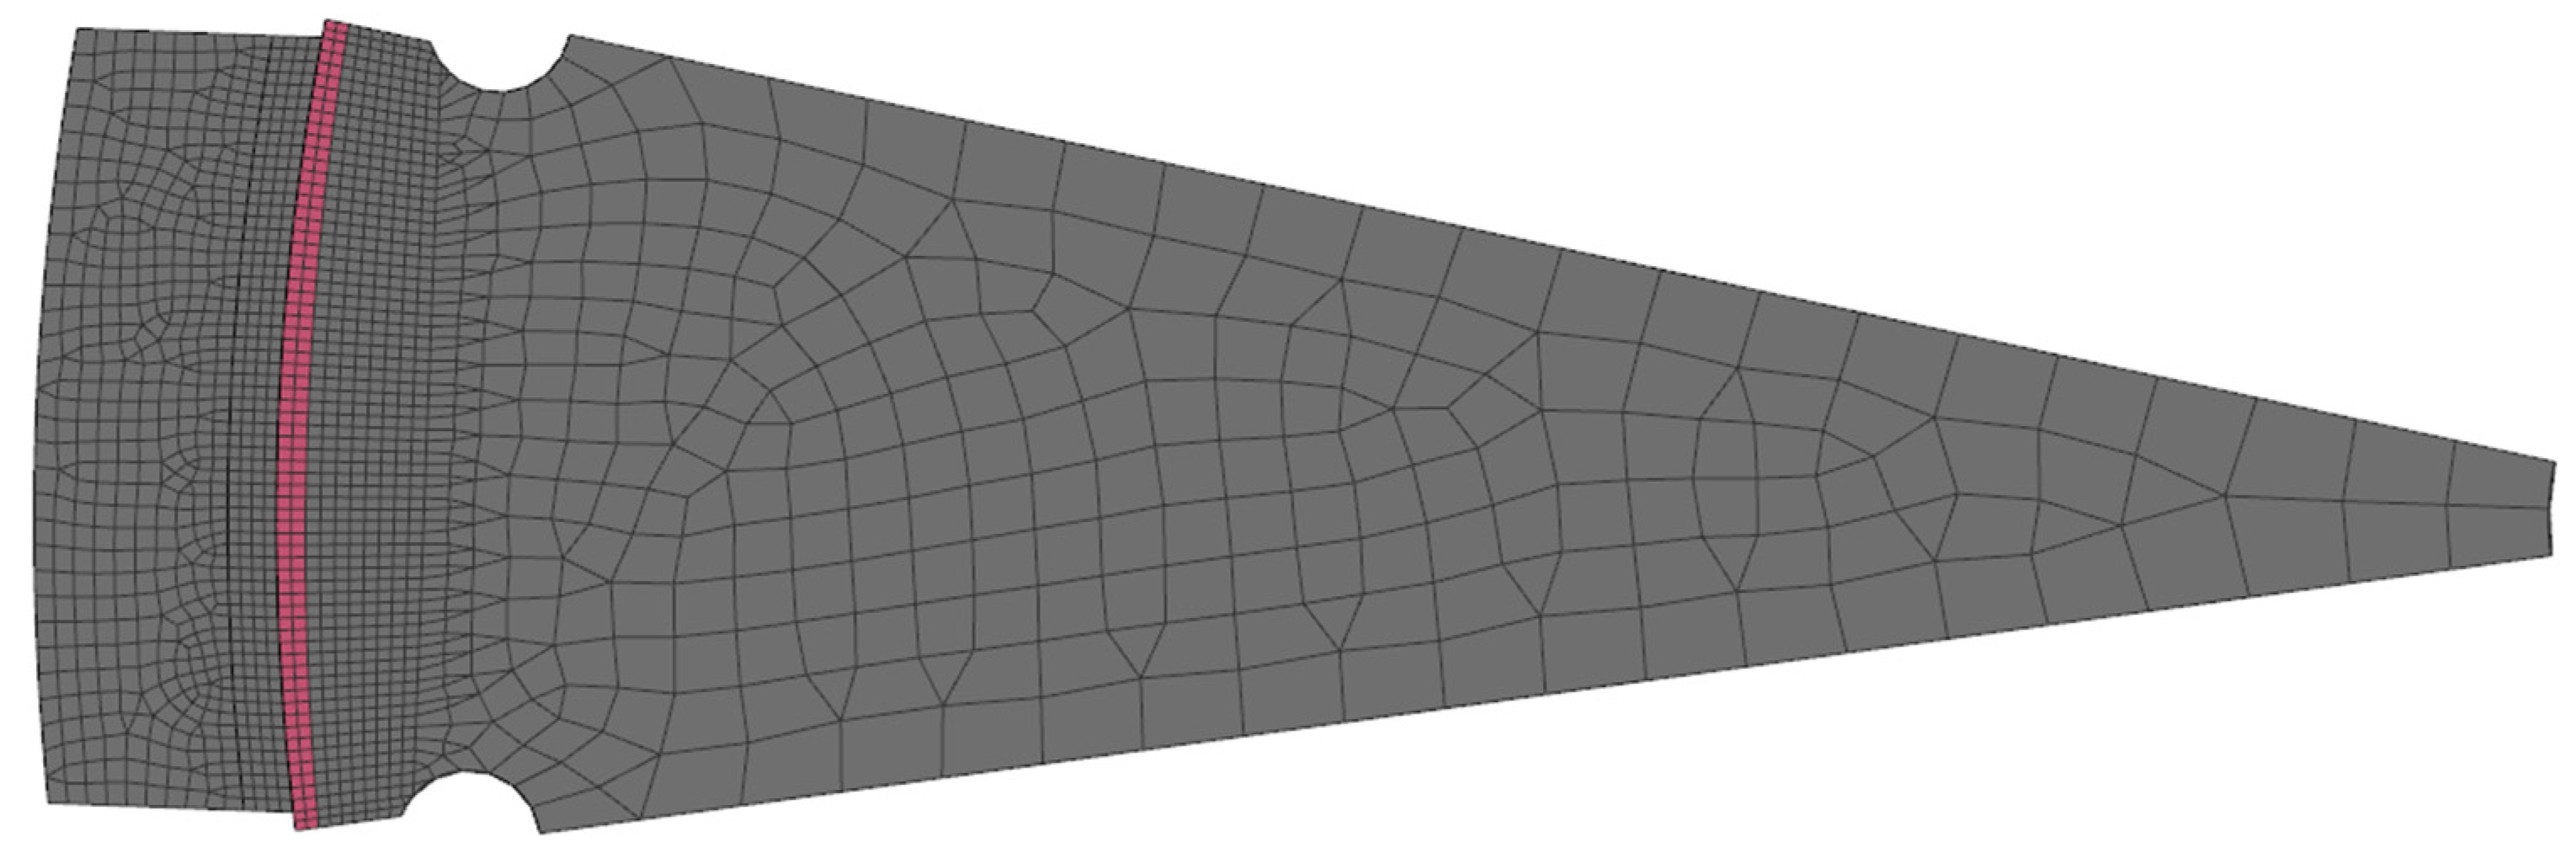
3.2.2. Grid Division

The mesh model, with a volume mesh of 25,000 units, was established based on the size of the LW230 diamond saw blade and the characteristics of laser welding, as depicted in Figure 7. In order to address the rapid heating and highly non-uniform nature of welding, local refinement has been applied to both weld and heat-affected zones within the mesh, ensuring that at least three layers of mesh are included in each direction within the heat source size. Conversely, coarsening was implemented for the base metal meshes located away from the weld position. Figure 7 shows the detailed grid division, highlighting the denser mesh near the weld zone and the gradual transition to coarser meshes further away. This strategic mesh refinement is crucial for accurately capturing the thermal gradients and stress distributions during the welding process.

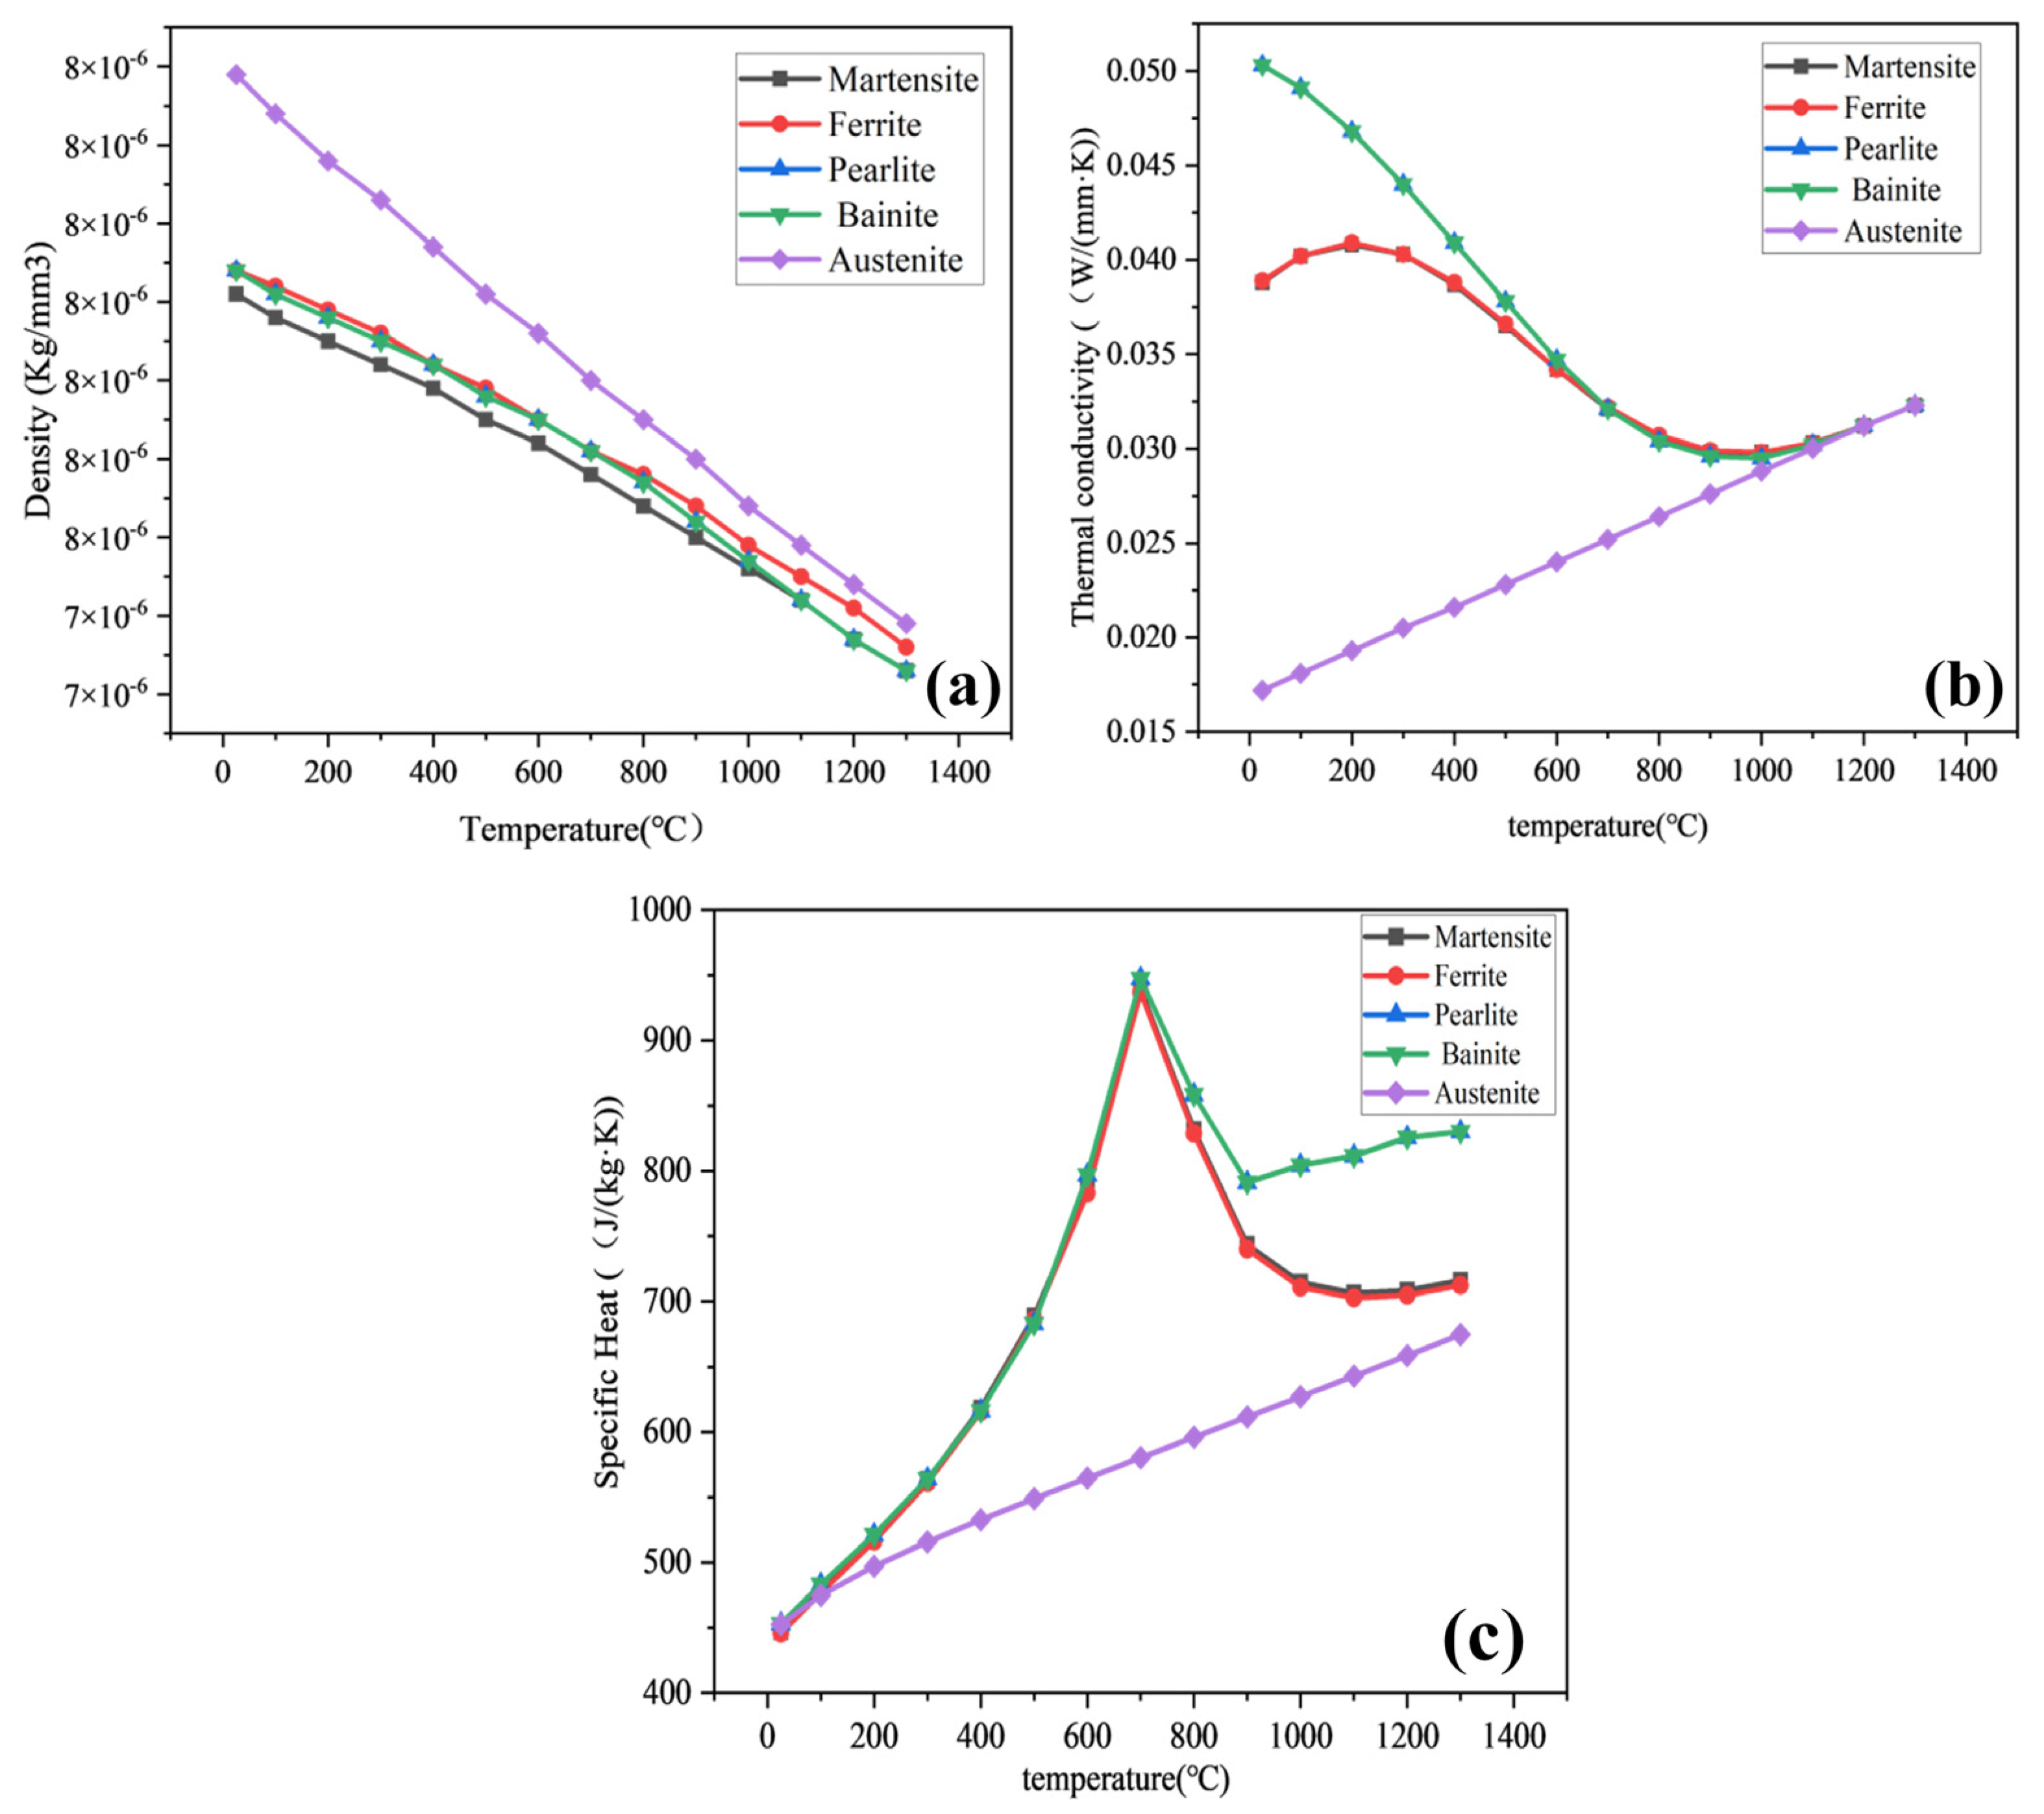
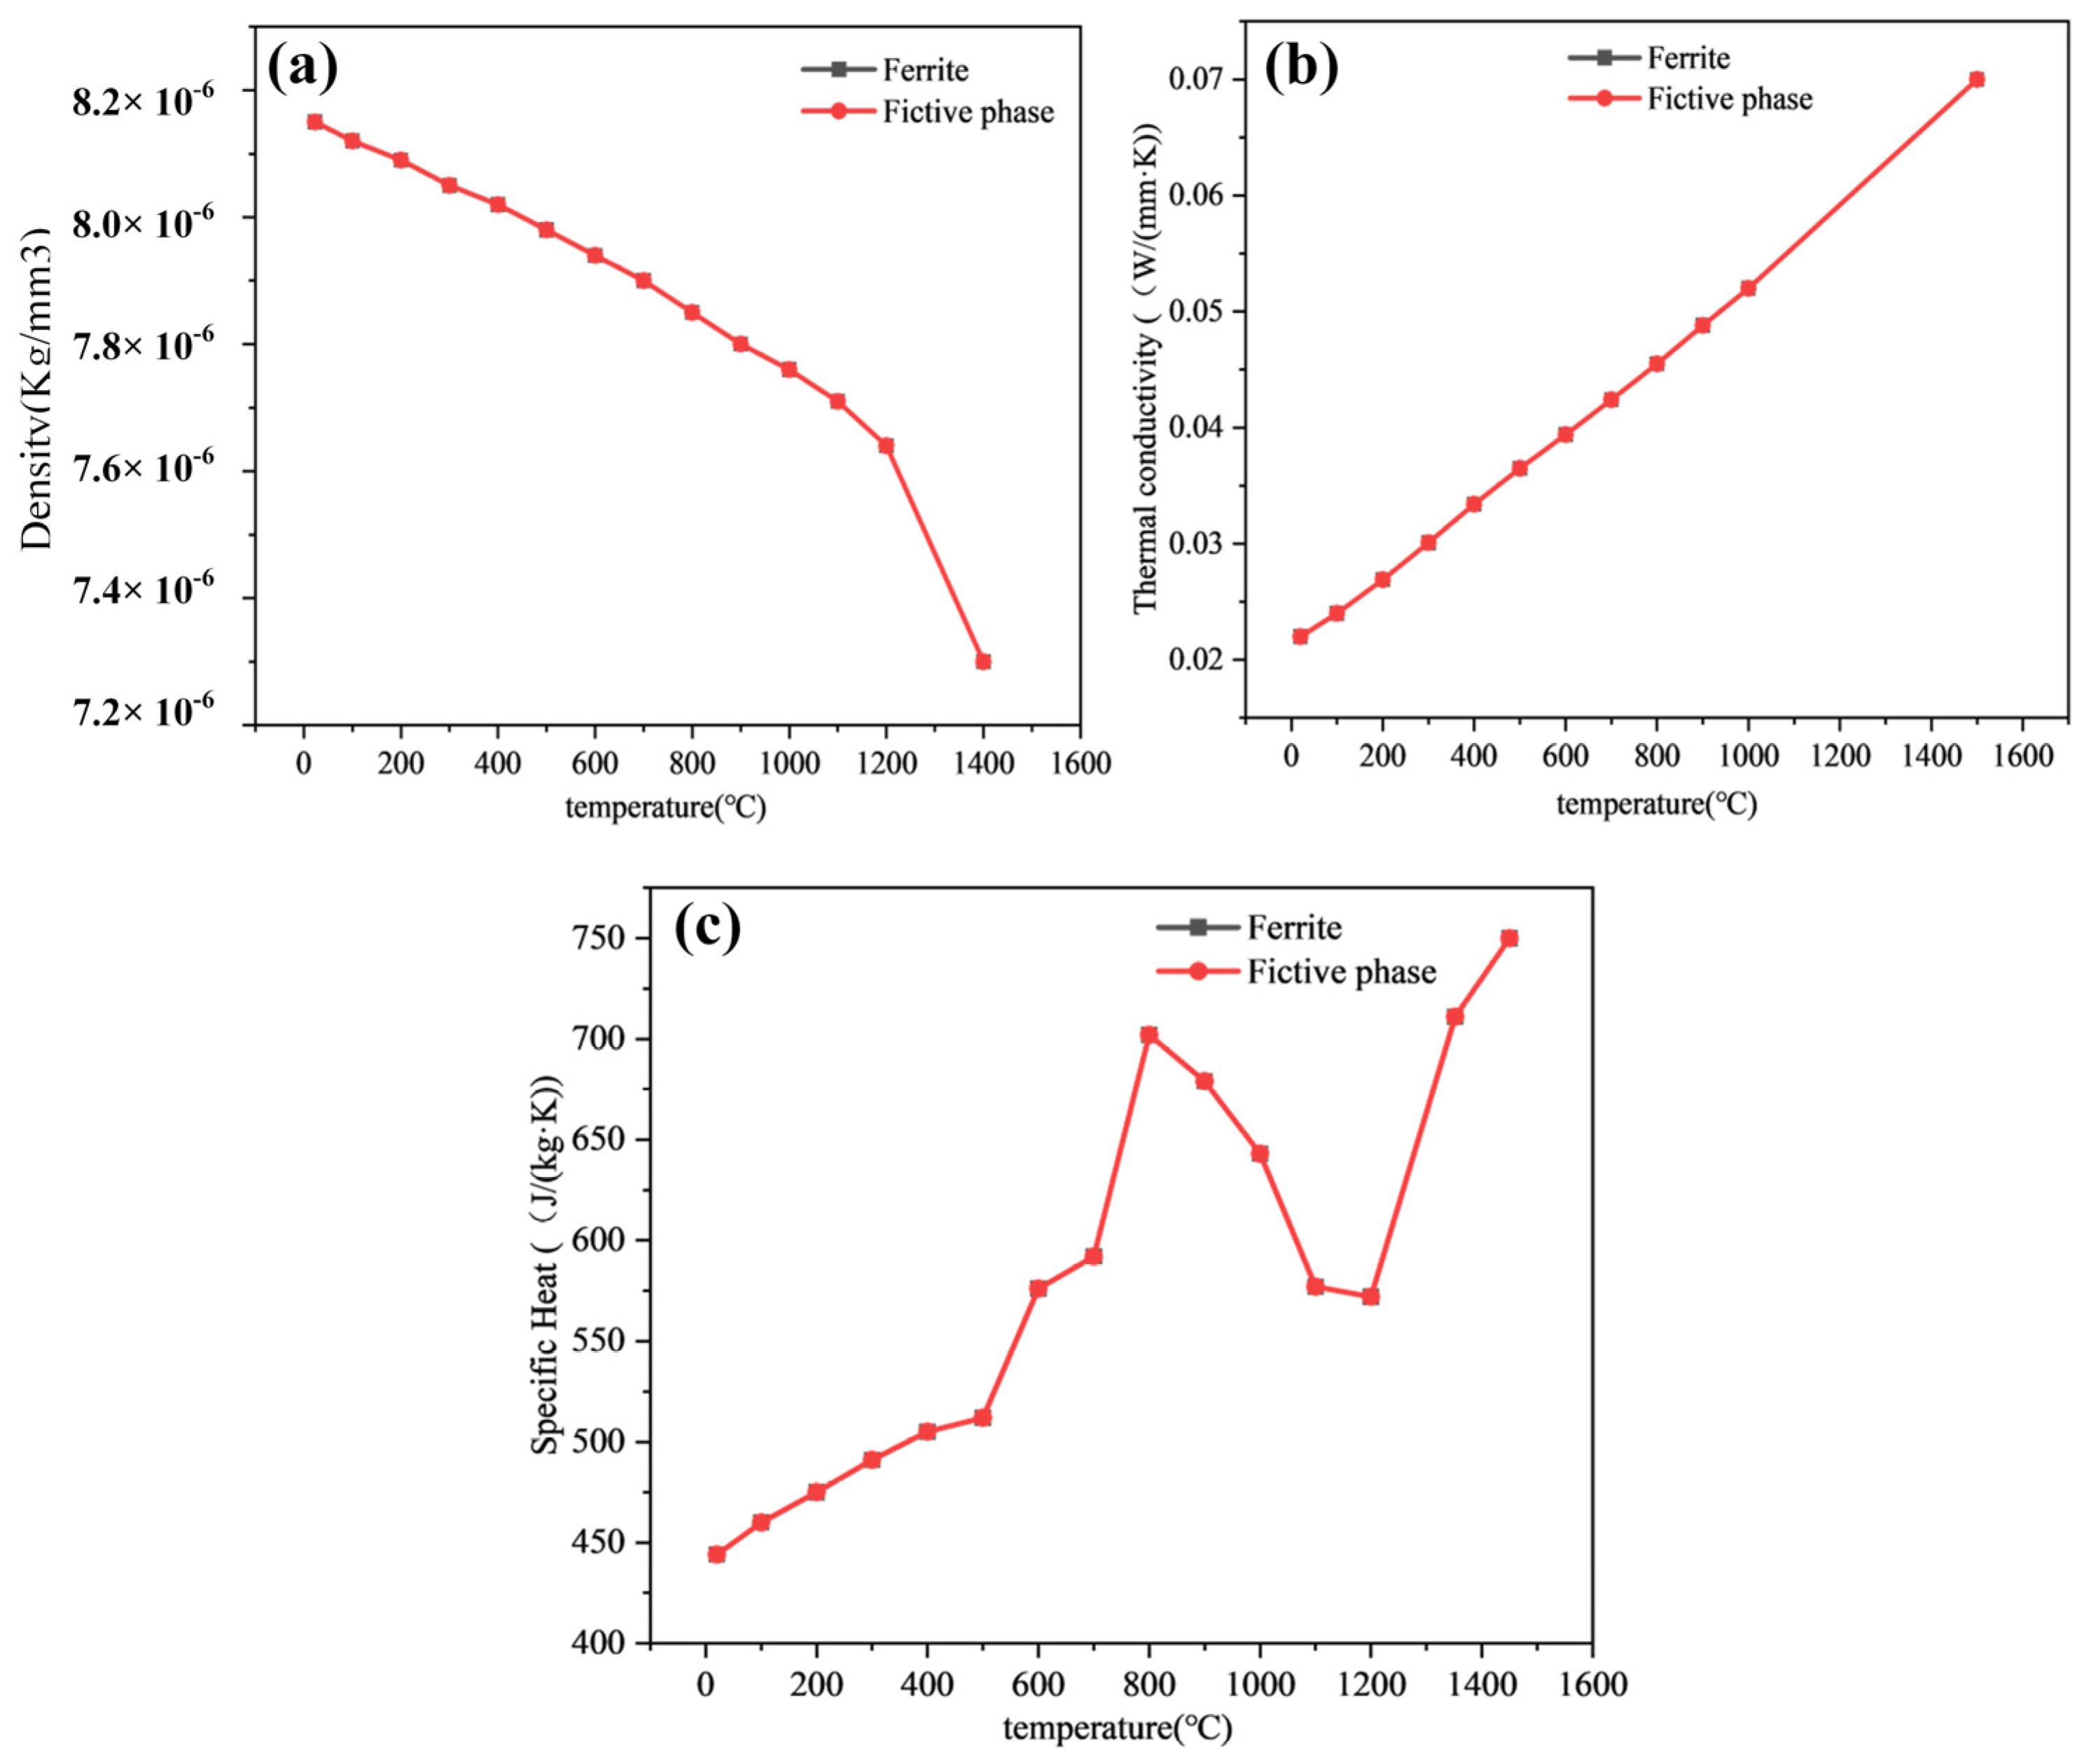
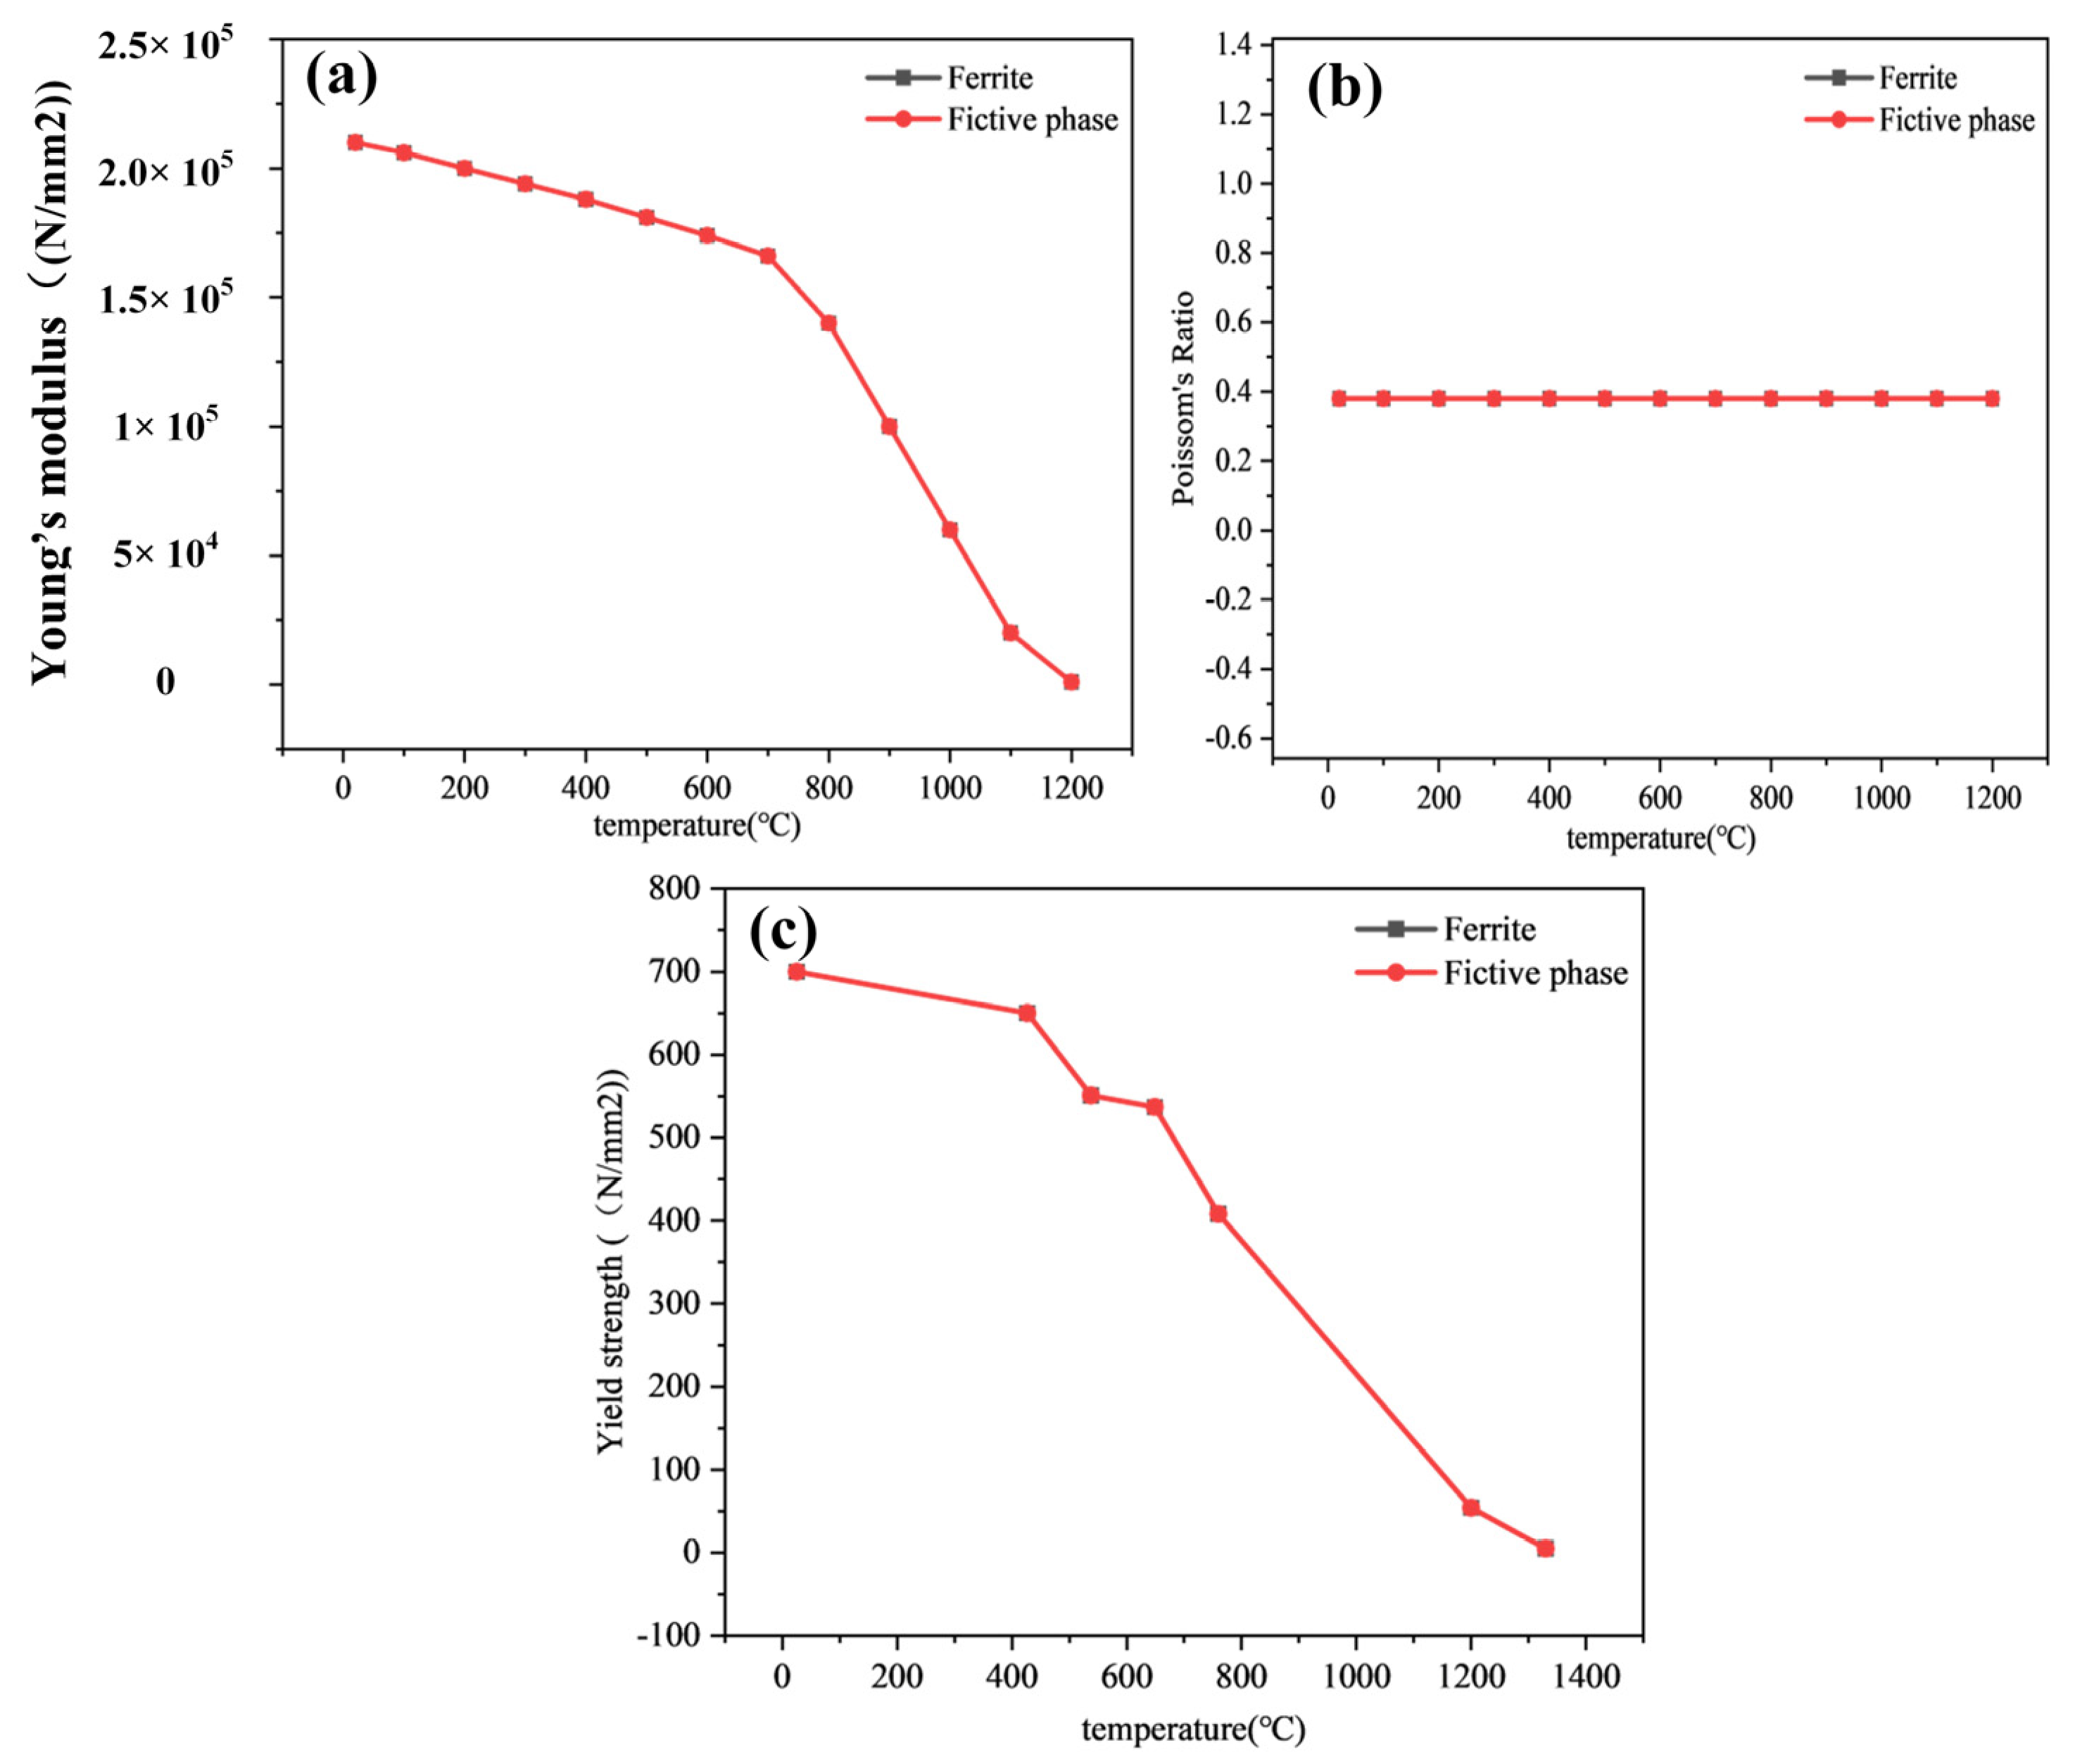
3.2.3. Definition of Material Parameters

According to the thermophysical and mechanical properties depicted in Figure 2, Figure 3, Figure 4 and Figure 5 for both materials, the material parameters were inputted into the material module of the SYSWELD software, which automatically generates a material parameter.mat file for the substrate and transition layer. The matrix material employed is 30CrMo, while CuNi alloy is utilized as both working and transition layer materials for the cutter head.

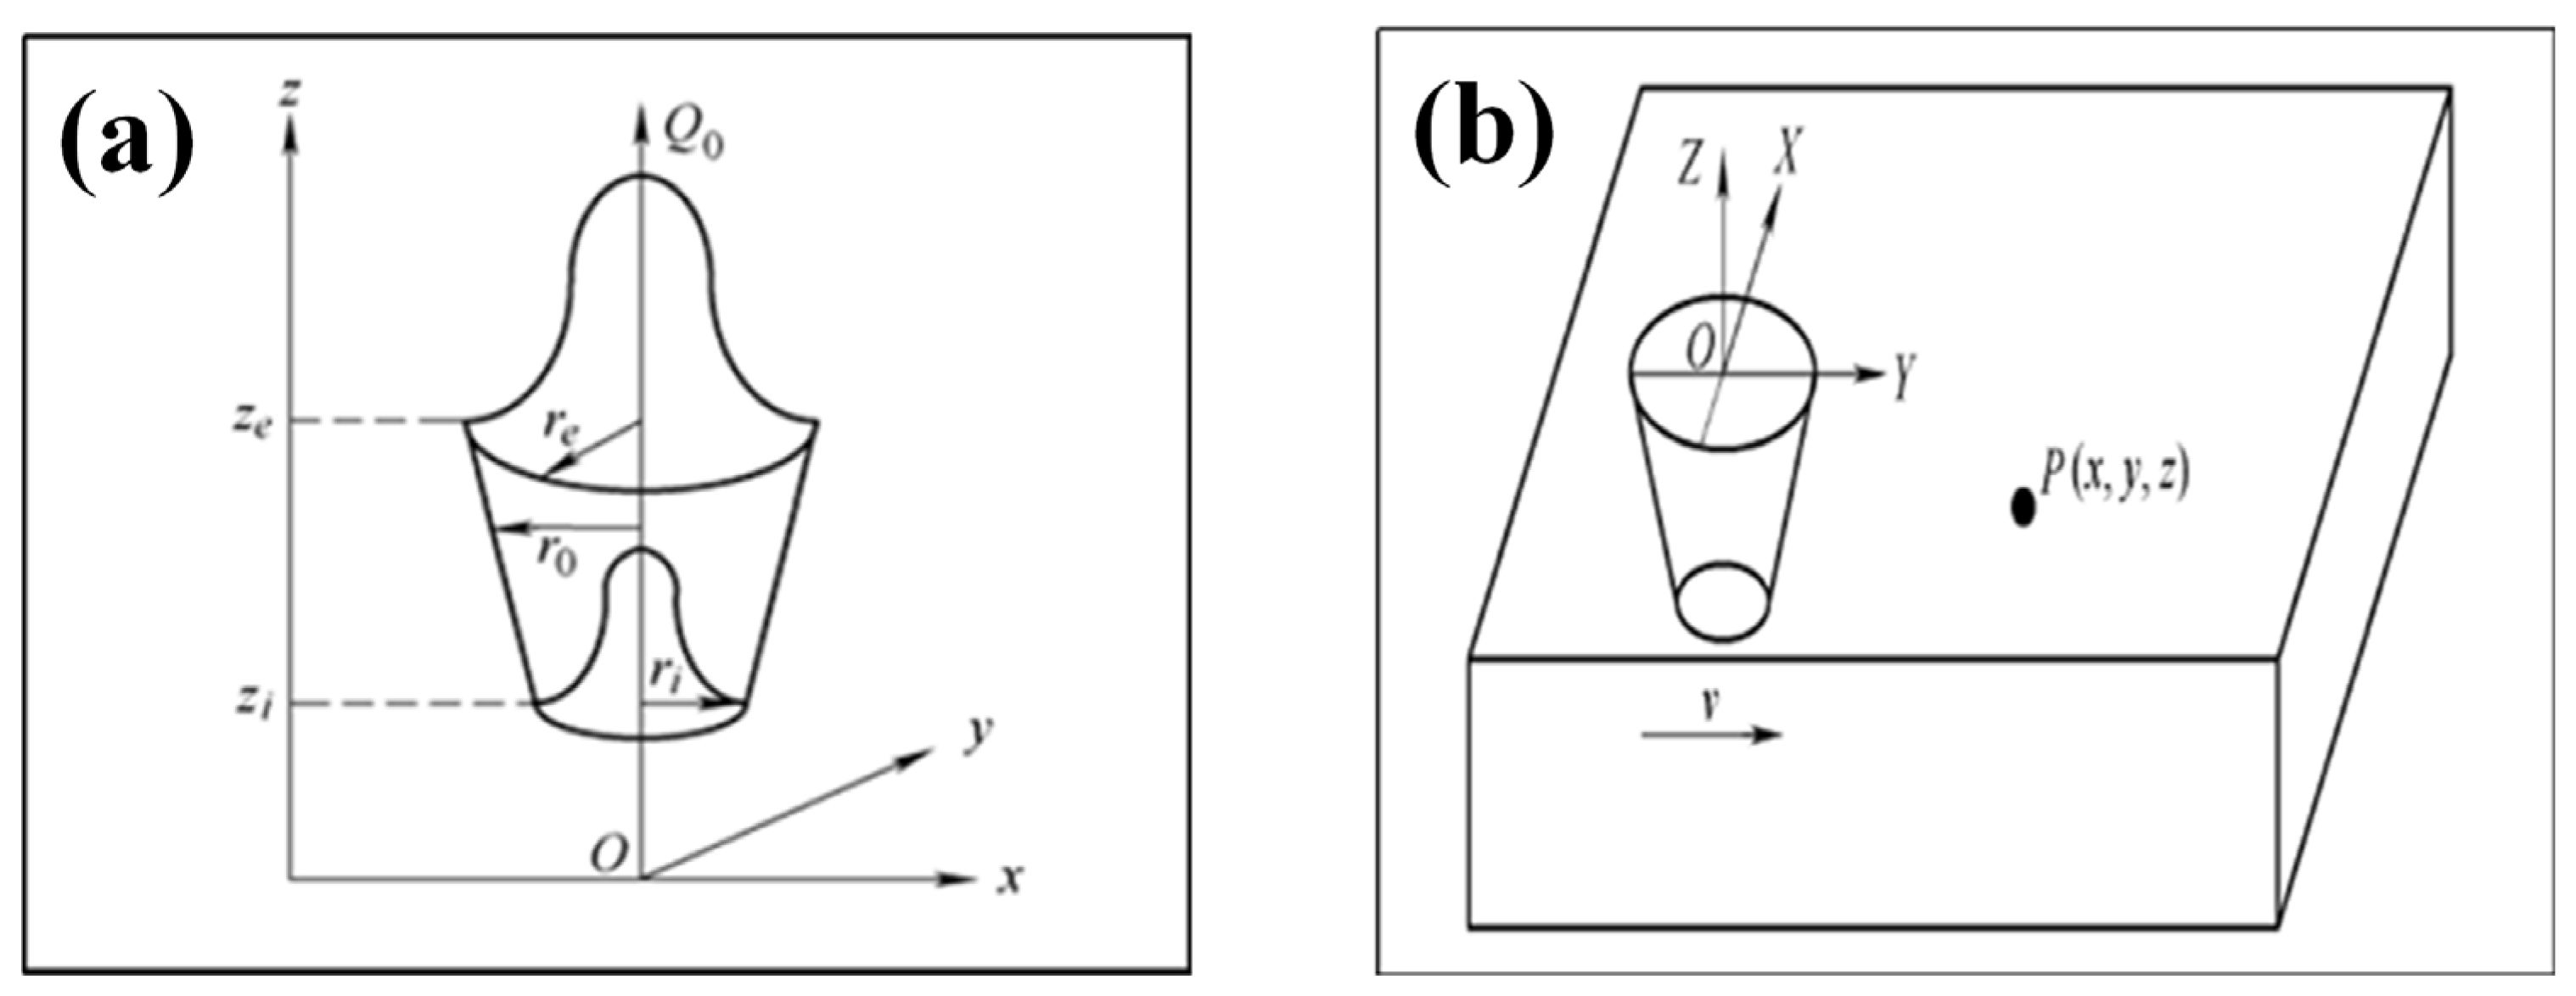
3.2.4. Definition and Characterization of Thermal Sources

The diamond saw blade is assembled using laser welding, while the heat source model adopts a 3D Gaussian heat source model. Relevant parameters of the heat source model are defined through SYSWELD software. The welding velocity is set at 26 mm/s, with a top weld diameter of 2 mm and a bottom diameter of 1.0mm. The penetration depth can reach up to 2 mm. When the welding power is adjusted to 1700 W, the resulting welding energy is measured at 65.4 J/mm with an energy utilization rate of 0.7. According to theoretical models of laser–material interaction, absorptivity depends on the physical properties of the material and the laser wavelength. For Cu+Ni+Fe alloy and 30CrMo substrate, the absorptivity typically ranges from 0.6 to 0.8 at specific laser wavelengths. Therefore, this paper uses an energy utilization rate of 0.7. Increasing the power to 1800 W yields a welding energy of 69.2 J/mm while maintaining an energy utilization rate of 0.7. Further increasing the power to 1900 W yields a welding energy of 73.1 J/mm while still maintaining an energy utilization rate of 0.7. Ultimately, setting the power to its maximum value of 2000 W results in a welding energy output measuring at 76.9 J/mm with an accompanying steady-state energy utilization rate of approximately 0.7. The heat source model is applied to the welding position of the grid model, with the thermal load concentrated on the volume element encompassing both the weld and heat-affected zone.
During the laser welding process, the absorptivity of materials can change significantly with temperature. For Cu+Ni+Fe alloy and 30CrMo substrate, there are notable differences between their solid and liquid states. In the solid state, the absorptivity of Cu+Ni+Fe alloy is approximately 0.65, while in the liquid state, it can reach 0.75. For the 30CrMo substrate, the absorptivity is around 0.6 in the solid state and about 0.7 in the liquid state. To improve simulation accuracy, we incorporated a temperature-dependent absorptivity function into the model, allowing the absorptivity to dynamically adjust with temperature changes.

3.2.5. Specification of Boundary Conditions

The boundary conditions for welding diamond saw blades primarily consist of the following: (1) the definition of the heat exchange surface of the diamond using a 2D shell element mesh model, and (2) the specification of tooling constraints for the joint. The tooling constraint definition aligns with the actual compression position during welding testing, and the tooling constraint types encompass rigid constraints in the X, Y, and Z directions. Upon the application of these restraints, please refer to Figure 8 for further details.

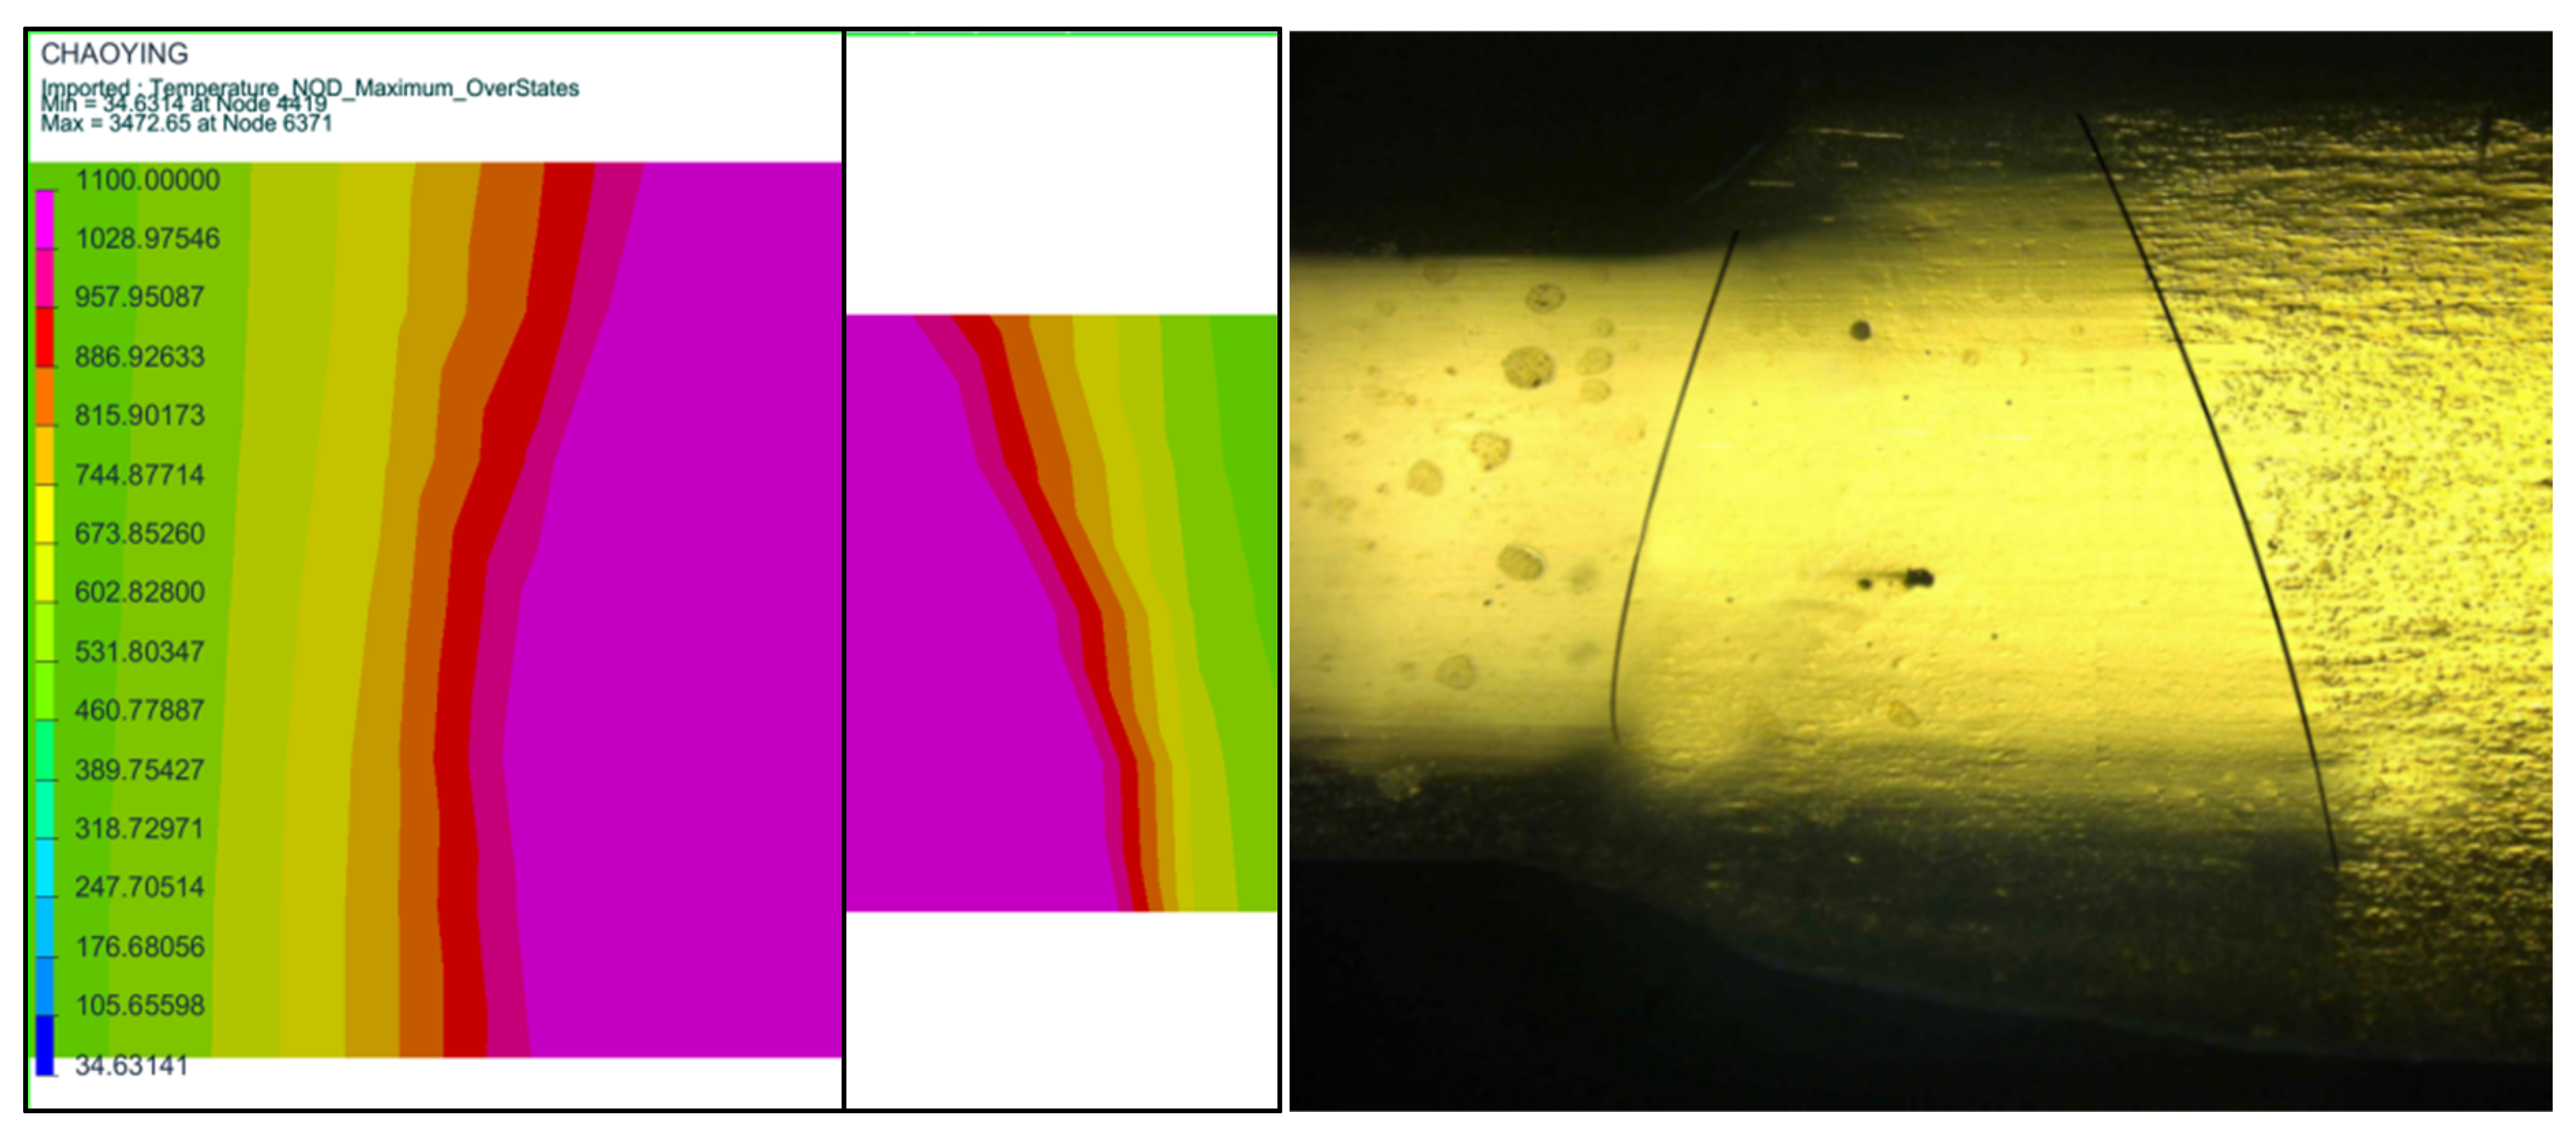
3.3. Verification of Heat Source

The LW230 laser-welded diamond saw blade is manufactured through the process of laser welding, and the cross-sectional profile of the weld pool is obtained by means of laser cutting. The actual morphology of the weld pool at the seam can be observed by grinding a crystal phase, as illustrated in Figure 9 below. The size of the weld pool is observed and measured using an ultra-depth-of-field microscope, with the upper width of the weld measuring 1003.4 μm and the lower fusion width measuring 2005.48 μm. The adjustment of the line capacity utilization ratio from 0.85 to 0.8 yields a calculated weld pool size that closely corresponds to the actual size. It is important to note that laser saw blade welding involves the composite material welding of both the transition layer and substrate, wherein the liquid phase temperature of CuNi alloy in the transition layer is 1100 °C, while that of 30CrMo in the substrate is 1500 °C. Therefore, it is crucial to separately calculate the fusion widths for each material and then combine them with the fusion width of the composite material. Figure 9 below illustrates the resulting weld pool morphology for both materials. The left side illustrates the weld pool morphology of the CuNi alloy transition layer, while the right side showcases that of the 30CrMo substrate. Measurements indicate that the lower and upper widths of the weld in the CuNi alloy transition layer are 0.70164 mm and 1.1179 mm, respectively. In contrast, the lower and upper widths in the 30CrMo substrate are 0.27288 mm and 0.97427 mm, respectively. By superimposing these values, the calculated upper and lower widths of the weld pool are determined to be 2.09217 mm and 0.97452 mm, respectively. These results closely align with the actual dimensions, thereby confirming the model’s accuracy.

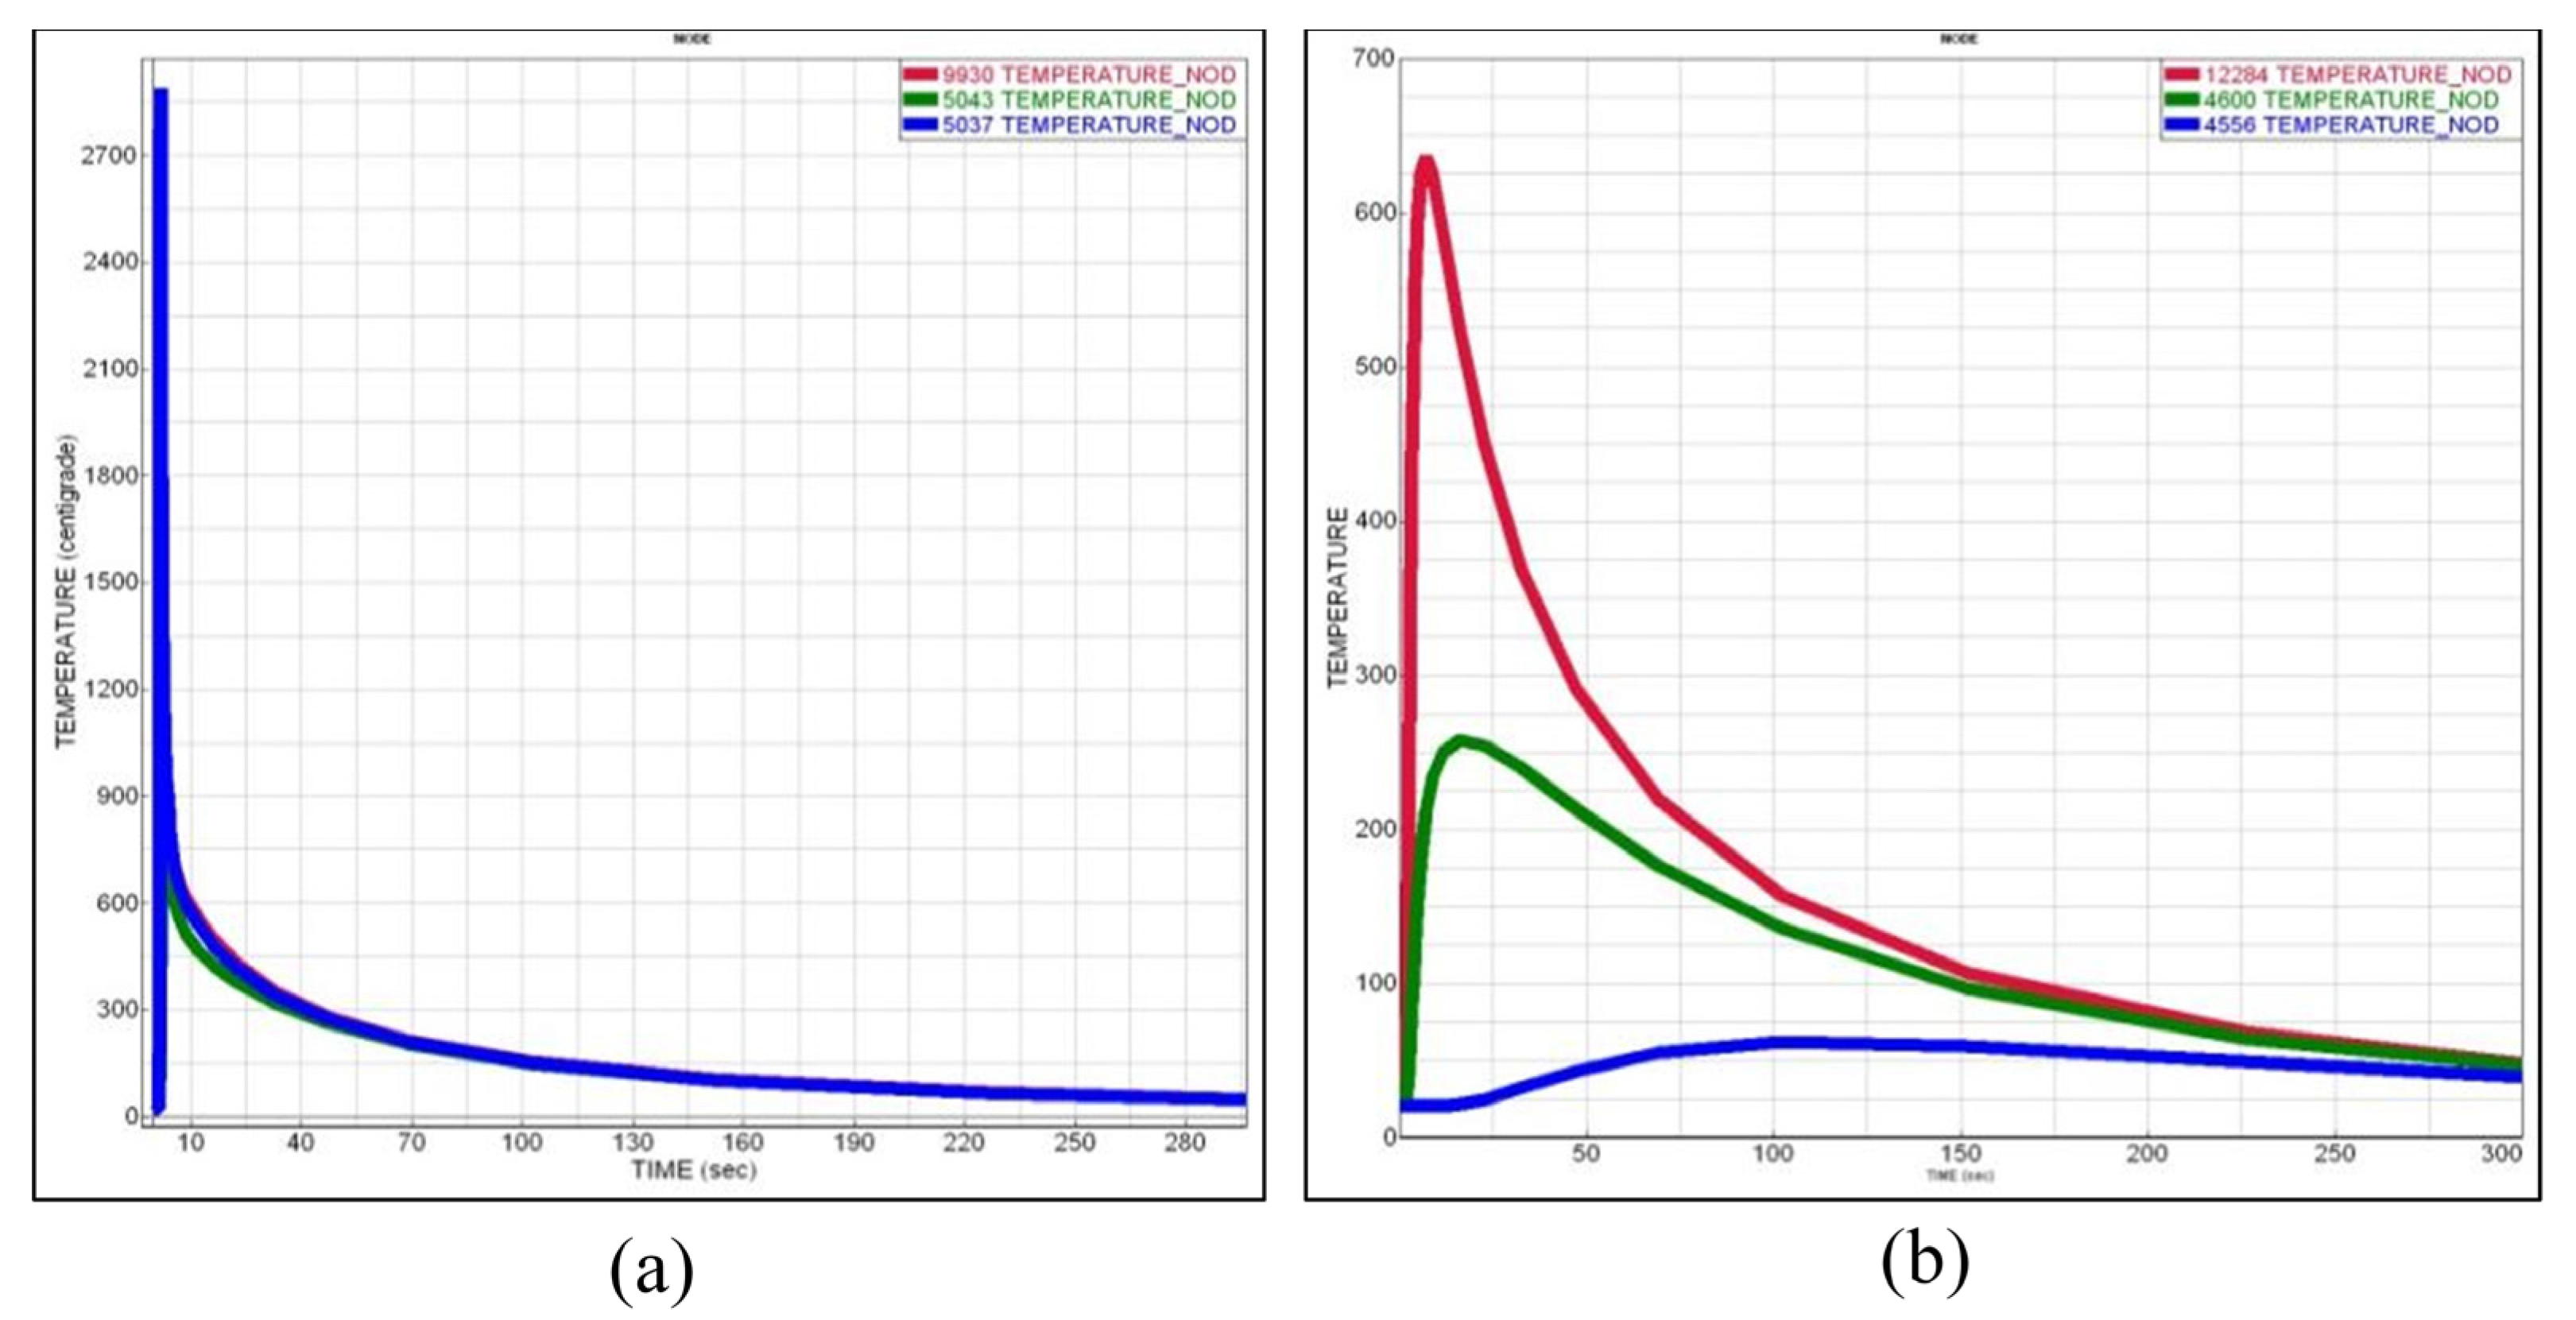
3.4. Results and Analysis of Temperature Field

The cloud diagram depicting the maximum temperature field of the saw blade model under welding powers of 1700 W, 1800 W, 1900 W, and 2000 W is presented in Figure 10. From the calculation results, it can be inferred that the weld joint reaches a maximum temperature of 3257 °C at a welding power of 1700 W, 3472 °C at 1800 W, 3616 °C at 1900 W, and 3799 °C at 2000 W. The temperature field nephogram under different welding powers confirms this. The heat-affected zone of laser welding is relatively small, with the highest temperature located at the center of the weld. The temperature distribution on both sides of the weld is symmetrical. A steep temperature gradient was observed near the weld zone, decreasing rapidly from the weld center to the base material.
At a welding power of 1700 W, temperature–time curves were generated for three points: point 5037, located at the center of the weld, and points 5043 and 9930, situated at both ends of the center. The resulting graph, as shown in Figure 11a, reveals the temperature change patterns over time for these three points. It is evident from the curve that the temperature at the laser’s center instantaneously rises to approximately 3000 °C while temperatures on either side remain lower. To generate temperature–time curves for three points, namely 11,284 from the working layer of the cutter head, 4600 from the middle of the substrate, and 4556 from the tail of the substrate, as shown in Figure 11b, it can be observed that initially, the temperature of the working layer rises to approximately 620 °C. After a duration of 200 s, however, this temperature gradually decreases until it reaches room temperature. Based on the temperature field analysis, 1700 W was identified as the optimal power setting, balancing peak temperature, temperature gradient, and cooling rate to achieve desirable weld quality.
The grain morphology of the weld cross-section in the saw blade welding model at 1700 W, 1800 W, 1900 W, and 2000 W welding power is illustrated in Figure 12. It can be observed from the figure that as the welding power increases, there is a corresponding increase in grain growth at the weld. Higher cooling rates, such as those observed at 1700 W, tend to produce finer grain structures due to rapid solidification. This results in improved mechanical properties but can also increase the tendency for residual stresses. Figure 12 shows the grain size distribution for different laser power settings. At 1500 W, the average grain size in the weld zone was measured to be around 10 μm, while at 1700 W, the grain size decreased to approximately 7 μm due to the higher cooling rate. At 1900 W, the grain size was slightly larger, averaging around 8 μm, which can be attributed to the reduced cooling rate compared to 1700 W. The temperature profile influences the phase transformations during welding. For example, at 1700 W, the cooling rate is sufficient to promote the formation of martensitic structures, which enhances hardness but may affect ductility.

3.5. Results and Analysis of Grain Calculations

3.5.1. Cross-Sectional Grain Morphology

Figure 13 illustrates the microstructural evolution across the weld zone. Regions with finer grains, such as those observed at 1700 W, exhibit higher hardness and strength due to the martensitic transformation. In contrast, coarser grains at 1500 W and 1900 W show a mixed microstructure with retained austenite and bainite.

3.5.2. Deviation in Grain Orientation

The grain orientation deviation of the saw blade welding model at different welding powers (1700 W, 1800 W, 1900 W, and 2000 W) is illustrated in Figure 13. As depicted by the histogram, it can be inferred that the minimum grain orientation deviation occurs when the welding power is set to 1700 W.

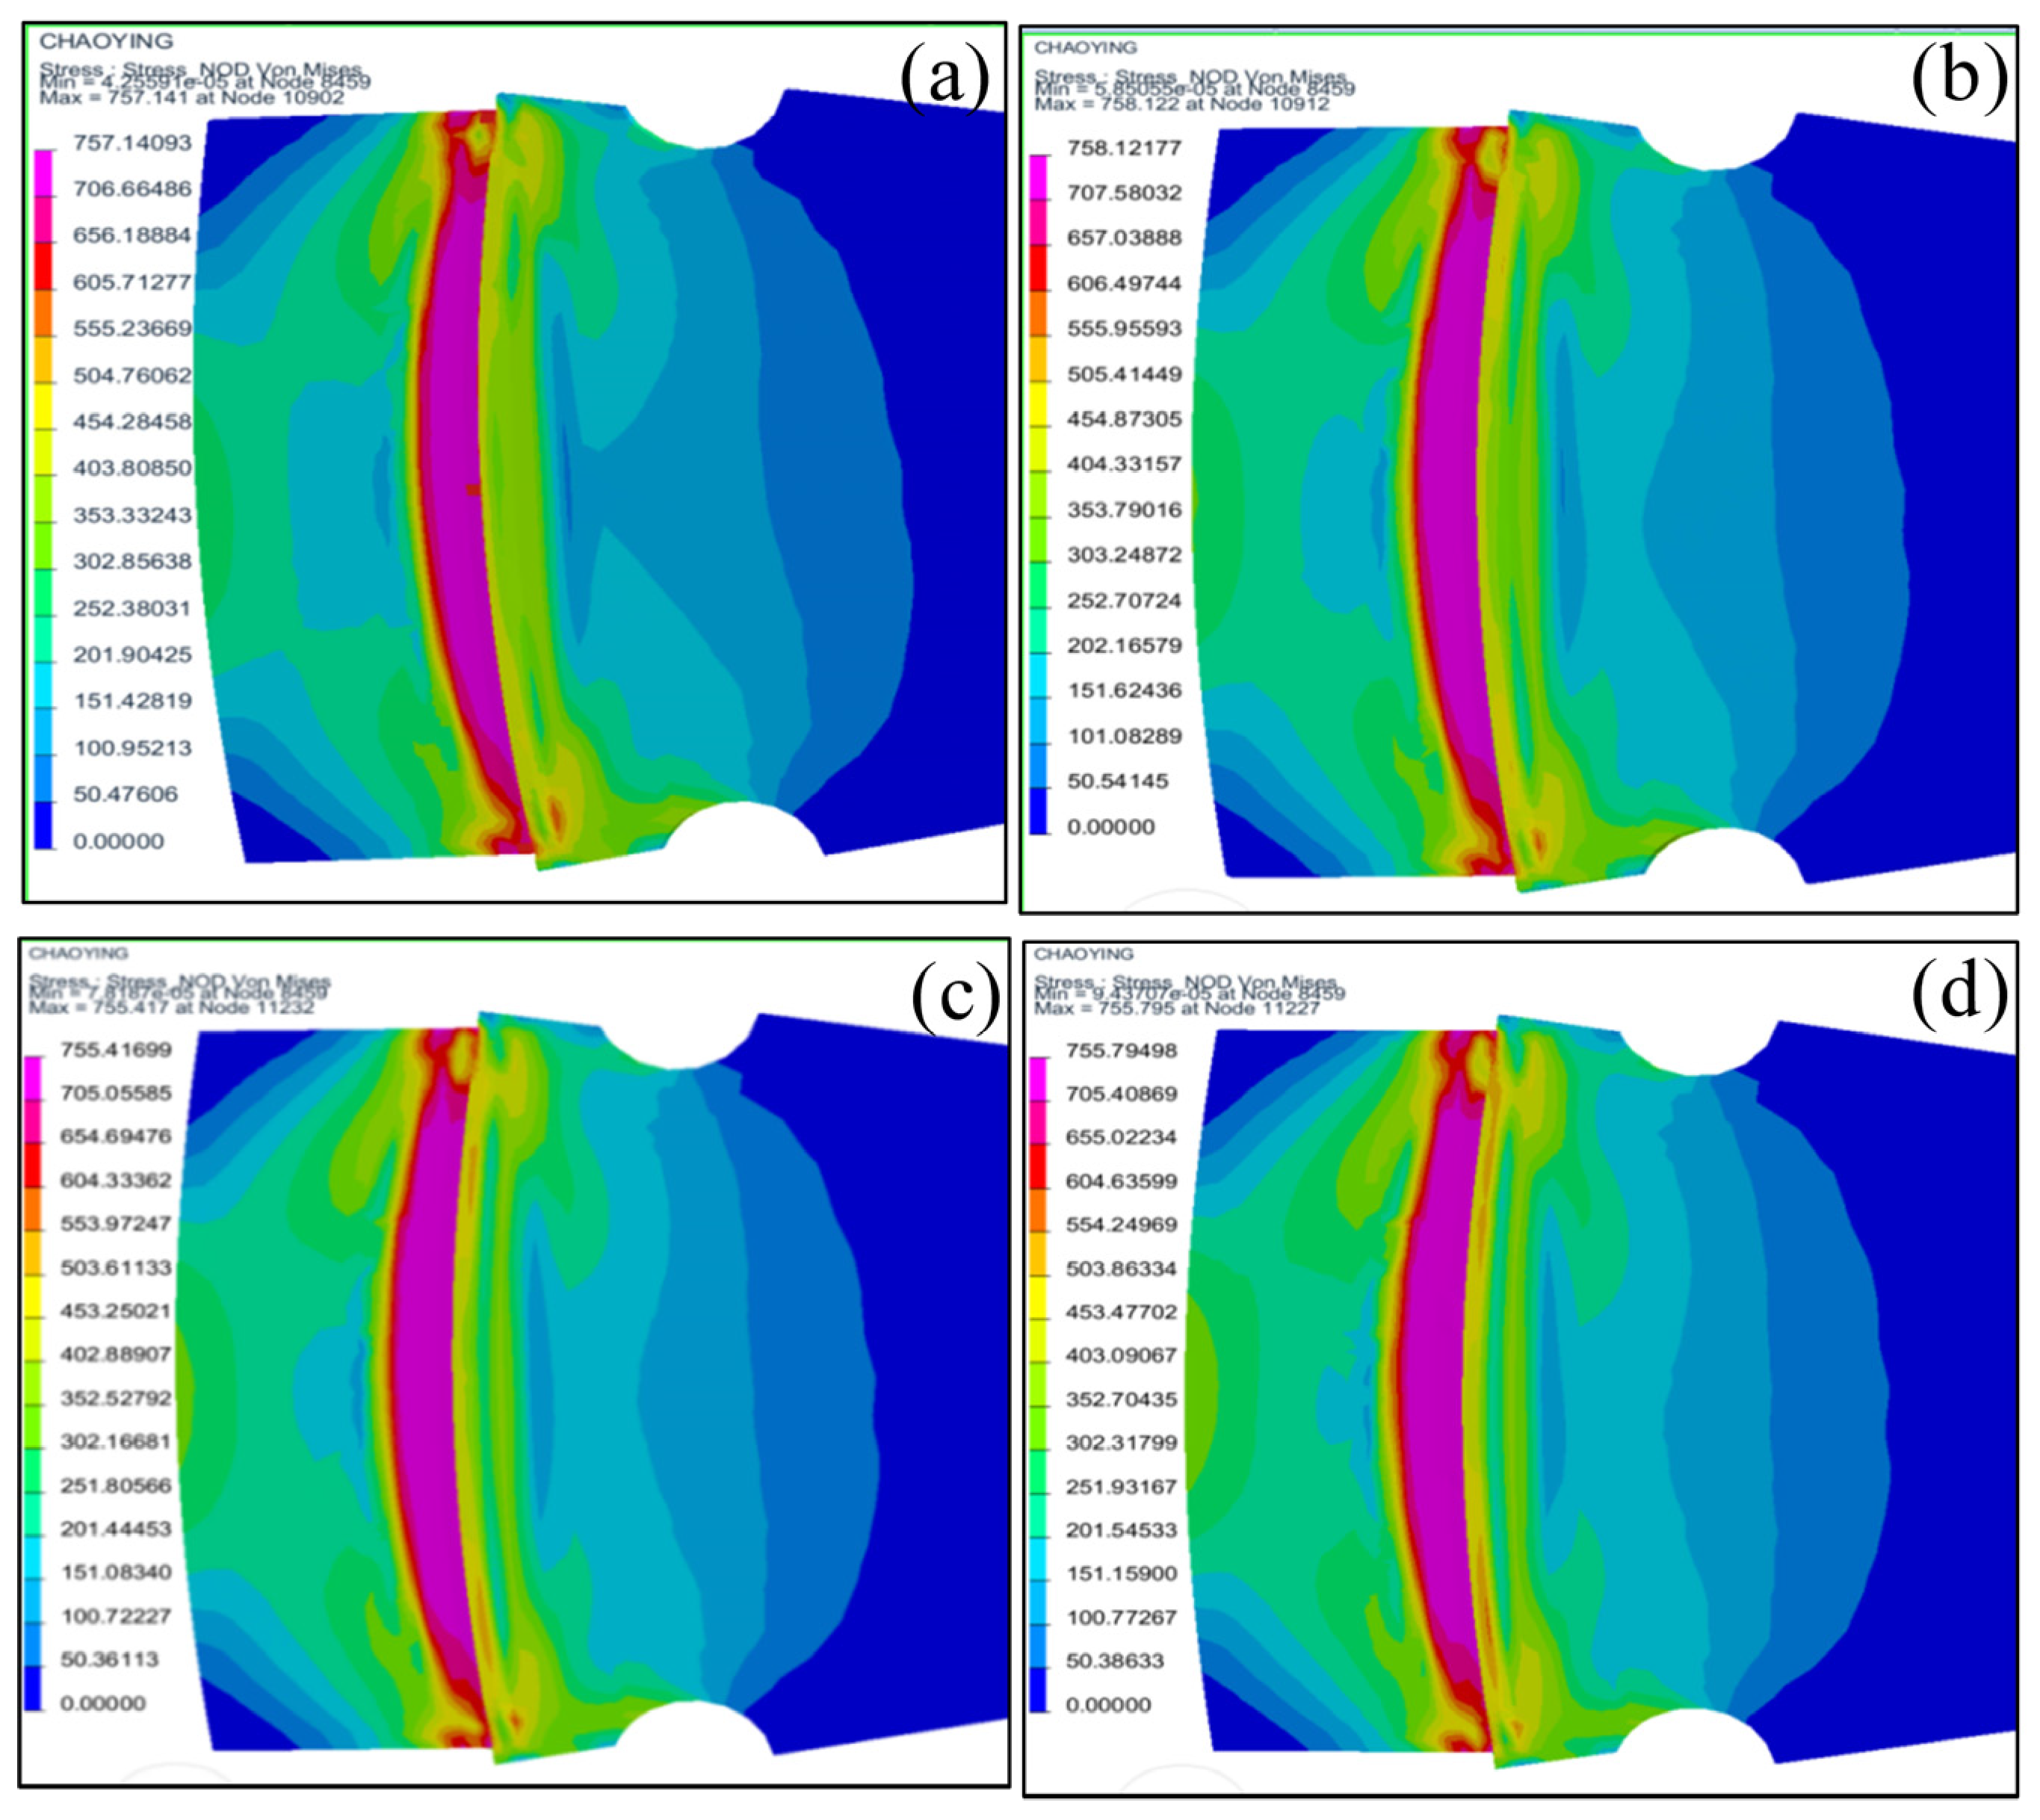
3.6. Results and Analysis of Stress Field Calculation

At a welding speed of 26 mm/s, the maximum stress nephogram at 500 S is presented in Figure 14a–d, corresponding to laser welding powers of 1700 W, 1800 W, 1900 W, and 2000 W, respectively. From the calculation results, it can be inferred that the maximum residual stress post-welding is 757.141 MPa at a welding power of 1700 W. At welding powers of 1800 W and 1900 W, the maximum residual stresses are, respectively, 758.122 MPa and 755.417 MPa. Similarly, with an increase in welding power to 2000 W, the maximum residual stress reaches its peak.

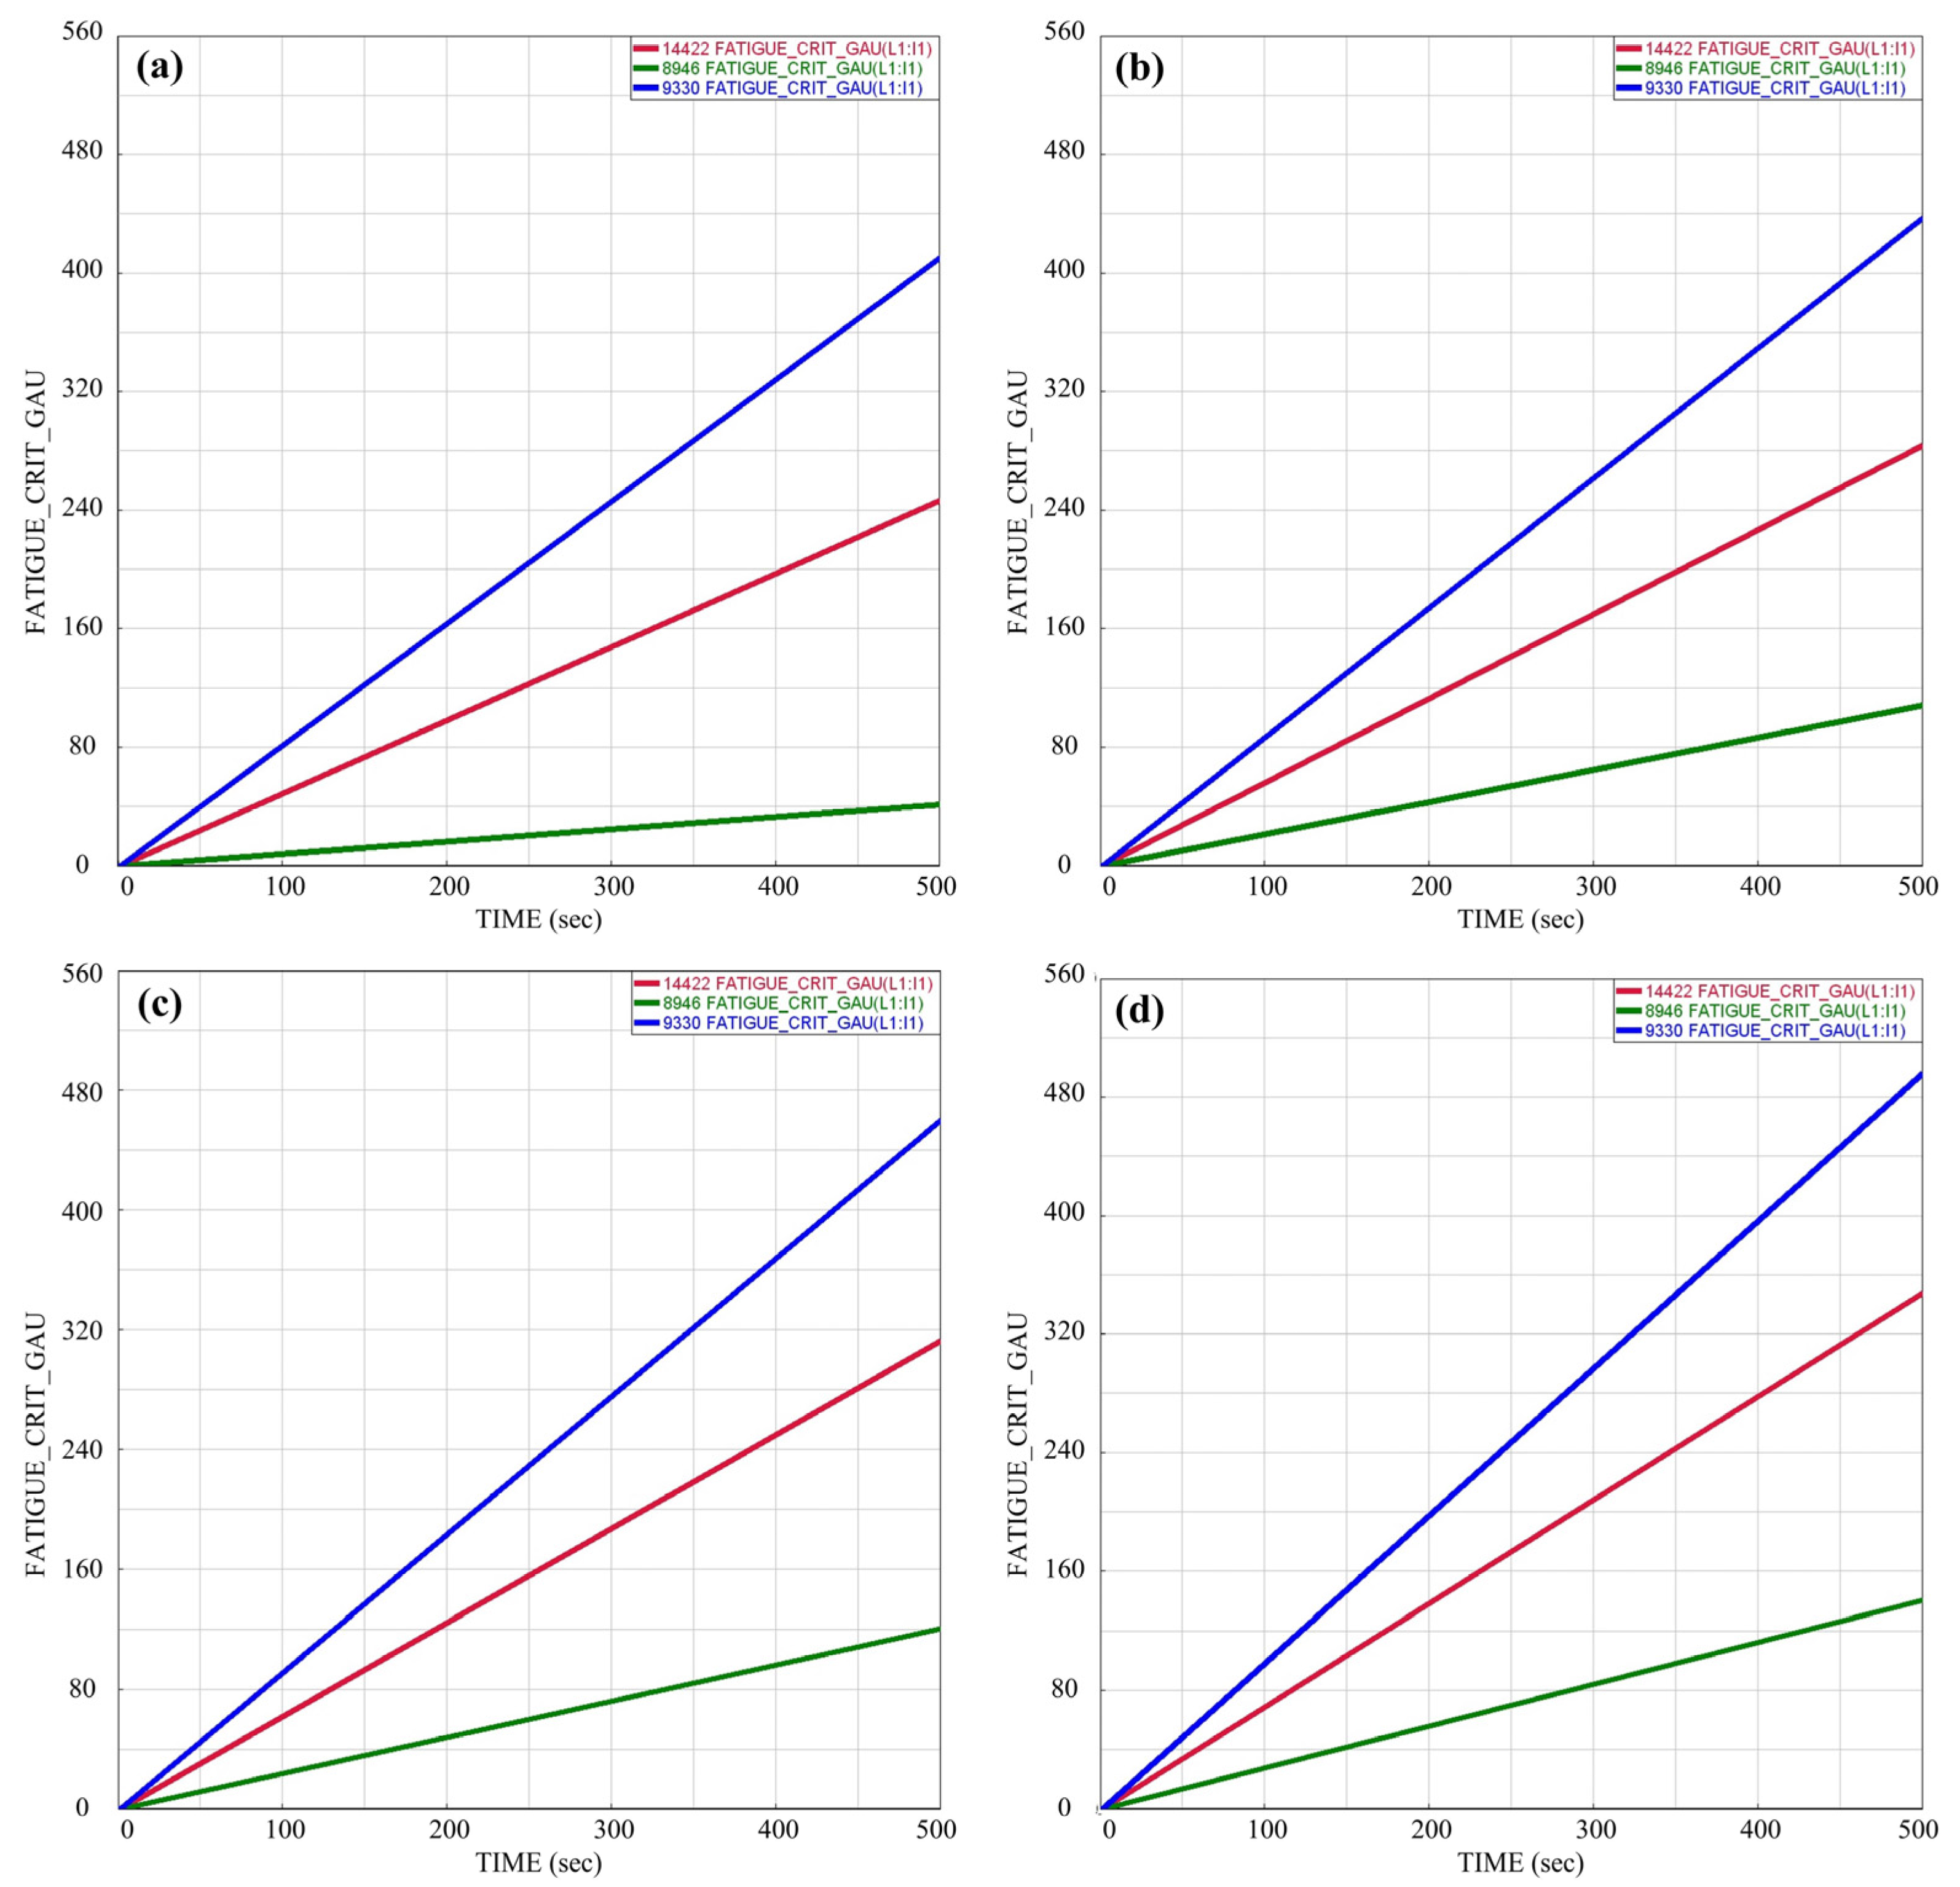
3.7. Calculation Results and Analysis of Fatigue

At a welding speed of 26 mm/s, the fatigue nephogram at 500 S is presented in Figure 15a–d, corresponding to laser welding powers of 1700 W, 1800 W, 1900 W, and 2000 W, respectively. From the calculation results, it can be inferred that the maximum digital volume correlation (DVC) value after welding was 495.61 when the welding power was set at 1700 W, while this value increased to 567.73 and 757.54, respectively, for welding powers of 1800 W and 1900 W; however, a decrease in DVC value to 754.19 occurred when using a higher power of 2000 W. It should be noted that higher DVC values indicate an increased susceptibility to fatigue fracture. Based on Figure 16, the optimal fatigue resistance of the saw blade is indicated by the minimum DVC value of the weld seam when laser welding power was set at 1700 W.
Take three points on the weld, namely 9330, 14,422, and 8946. The DVC values of these points at welding powers of 1700 W, 1800 W, 1900 W, and 2000 W over time are presented in Figure 17. It is evident from the figures that an increase in welding power leads to a corresponding rise in DVC values for all three points. When the welding power was set to 1700 W and the duration was 500 S, the DVC values obtained at three points along the weld seam were minimized. As cooling time increases, the growth slope decreases accordingly. Based on a macroscopic comparison of DVC values, it can be concluded that 1700 W yields superior fatigue resistance.

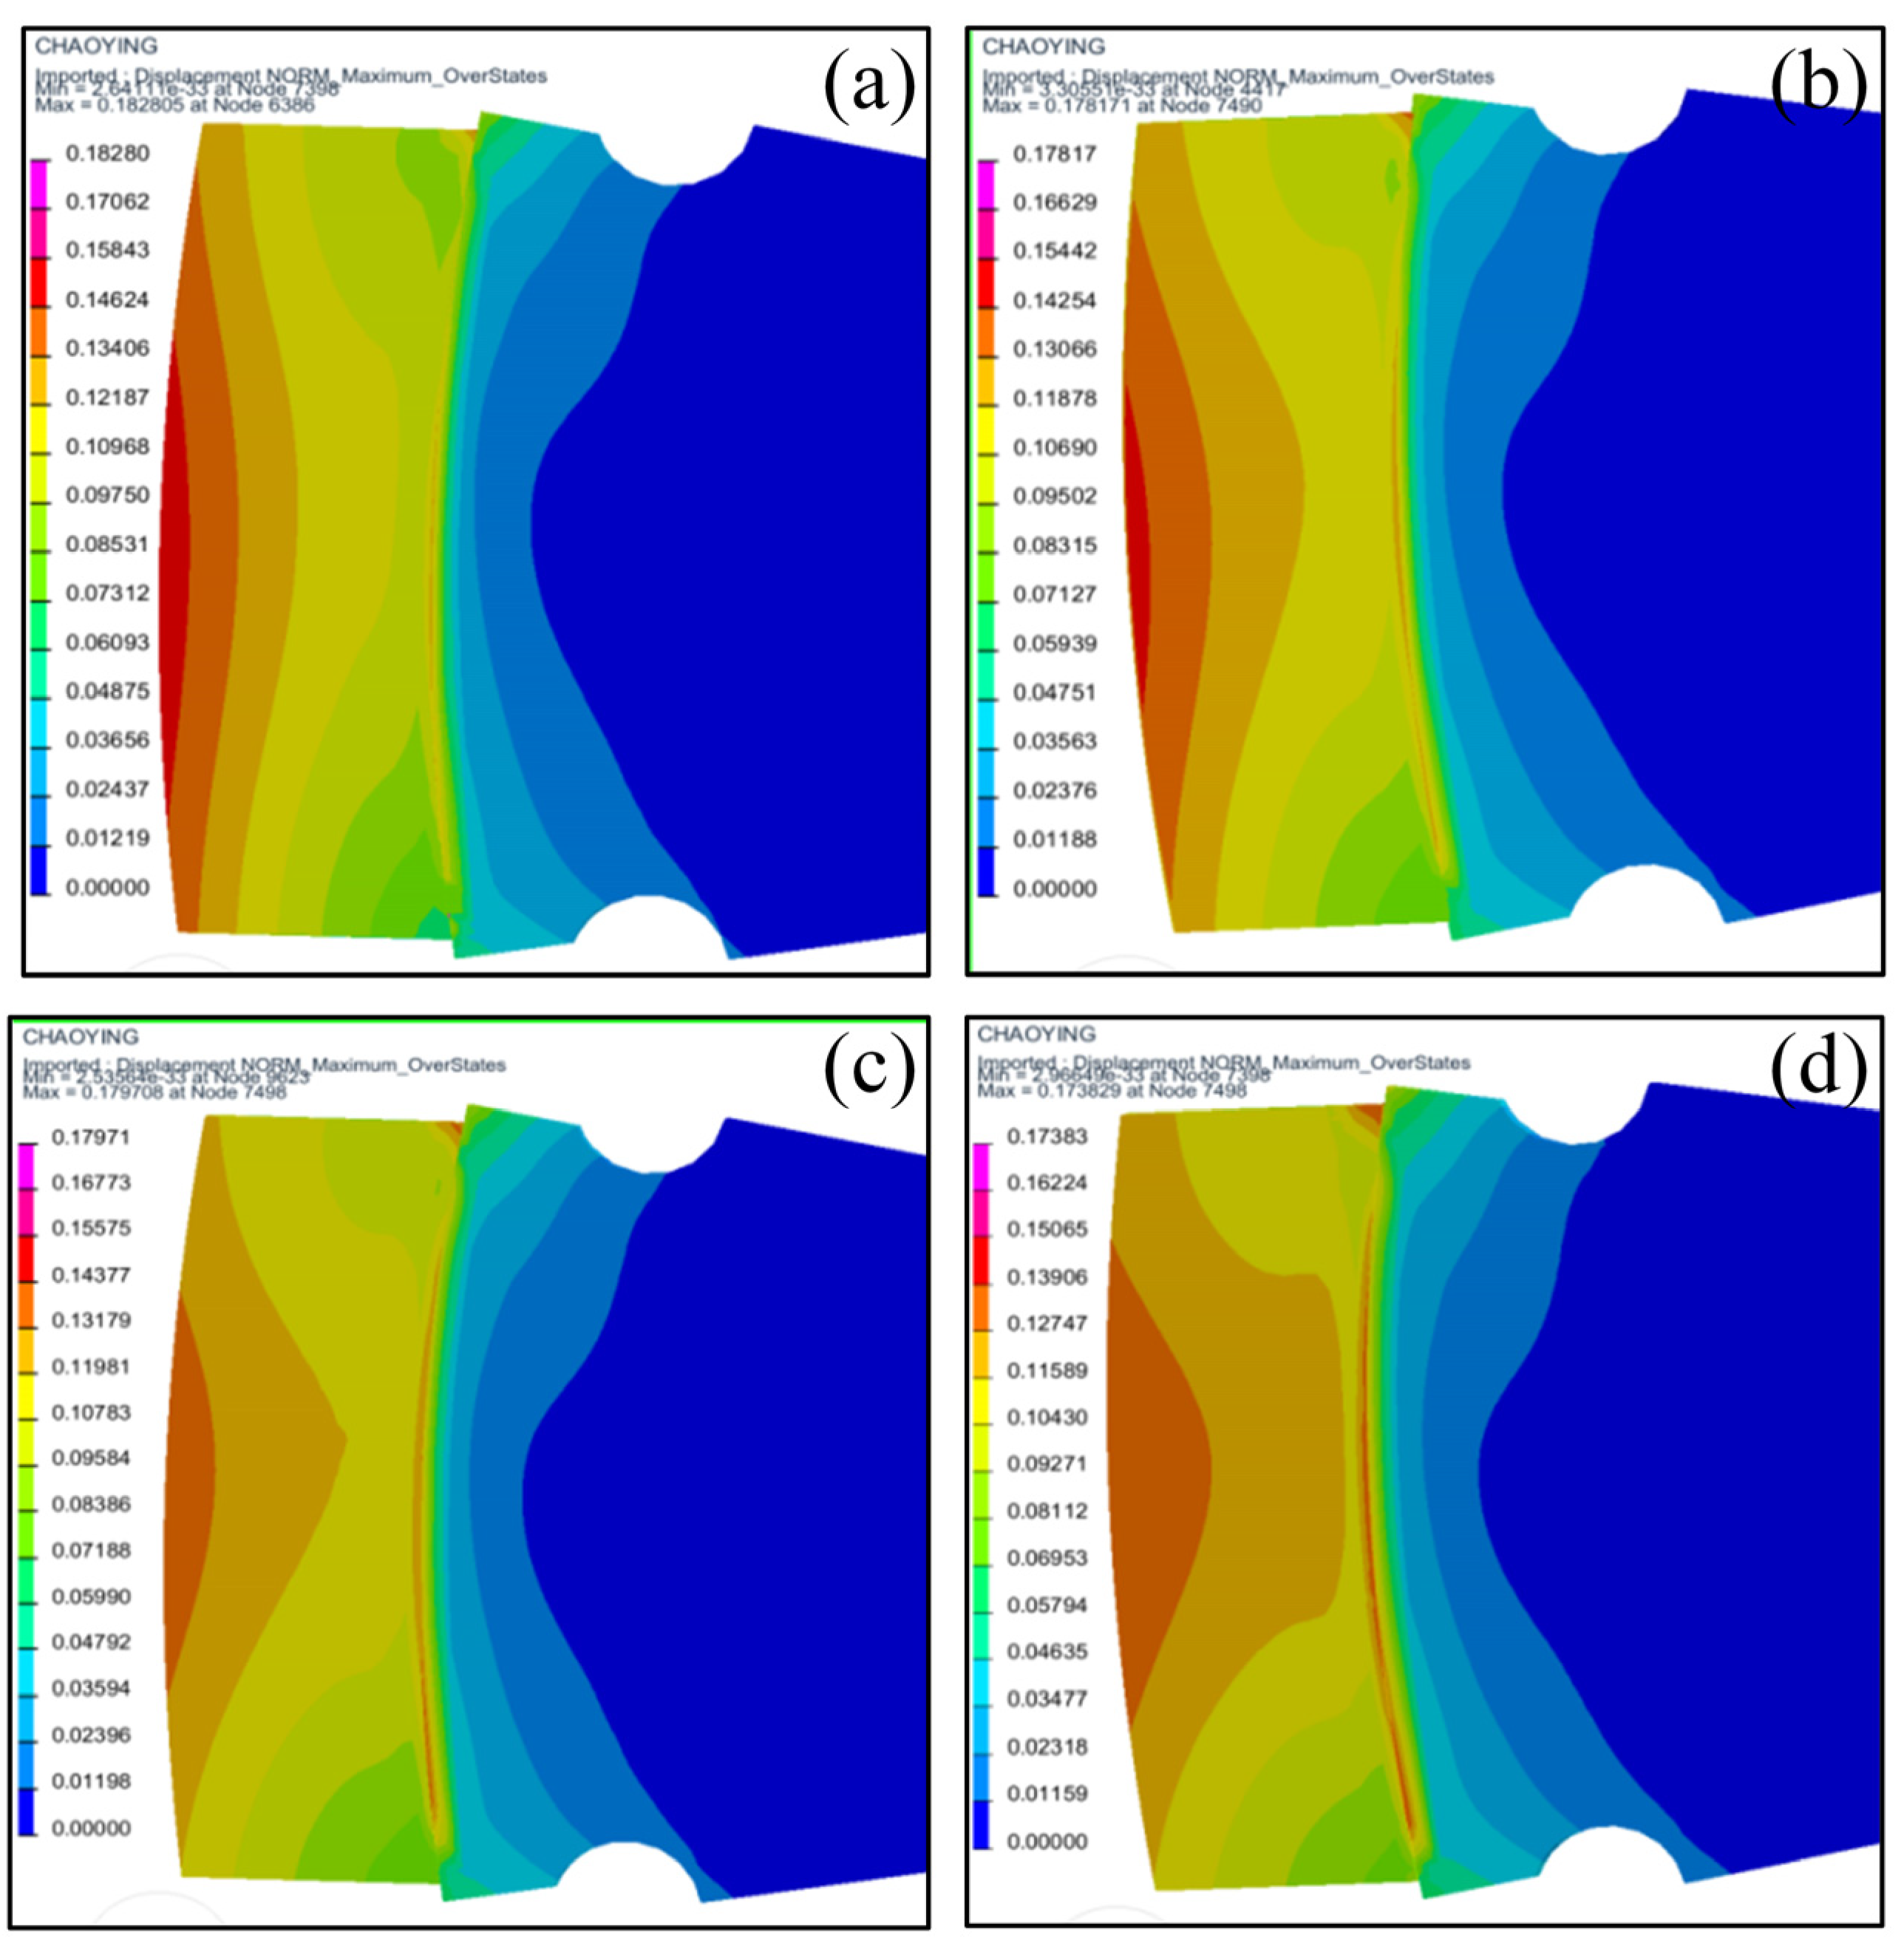
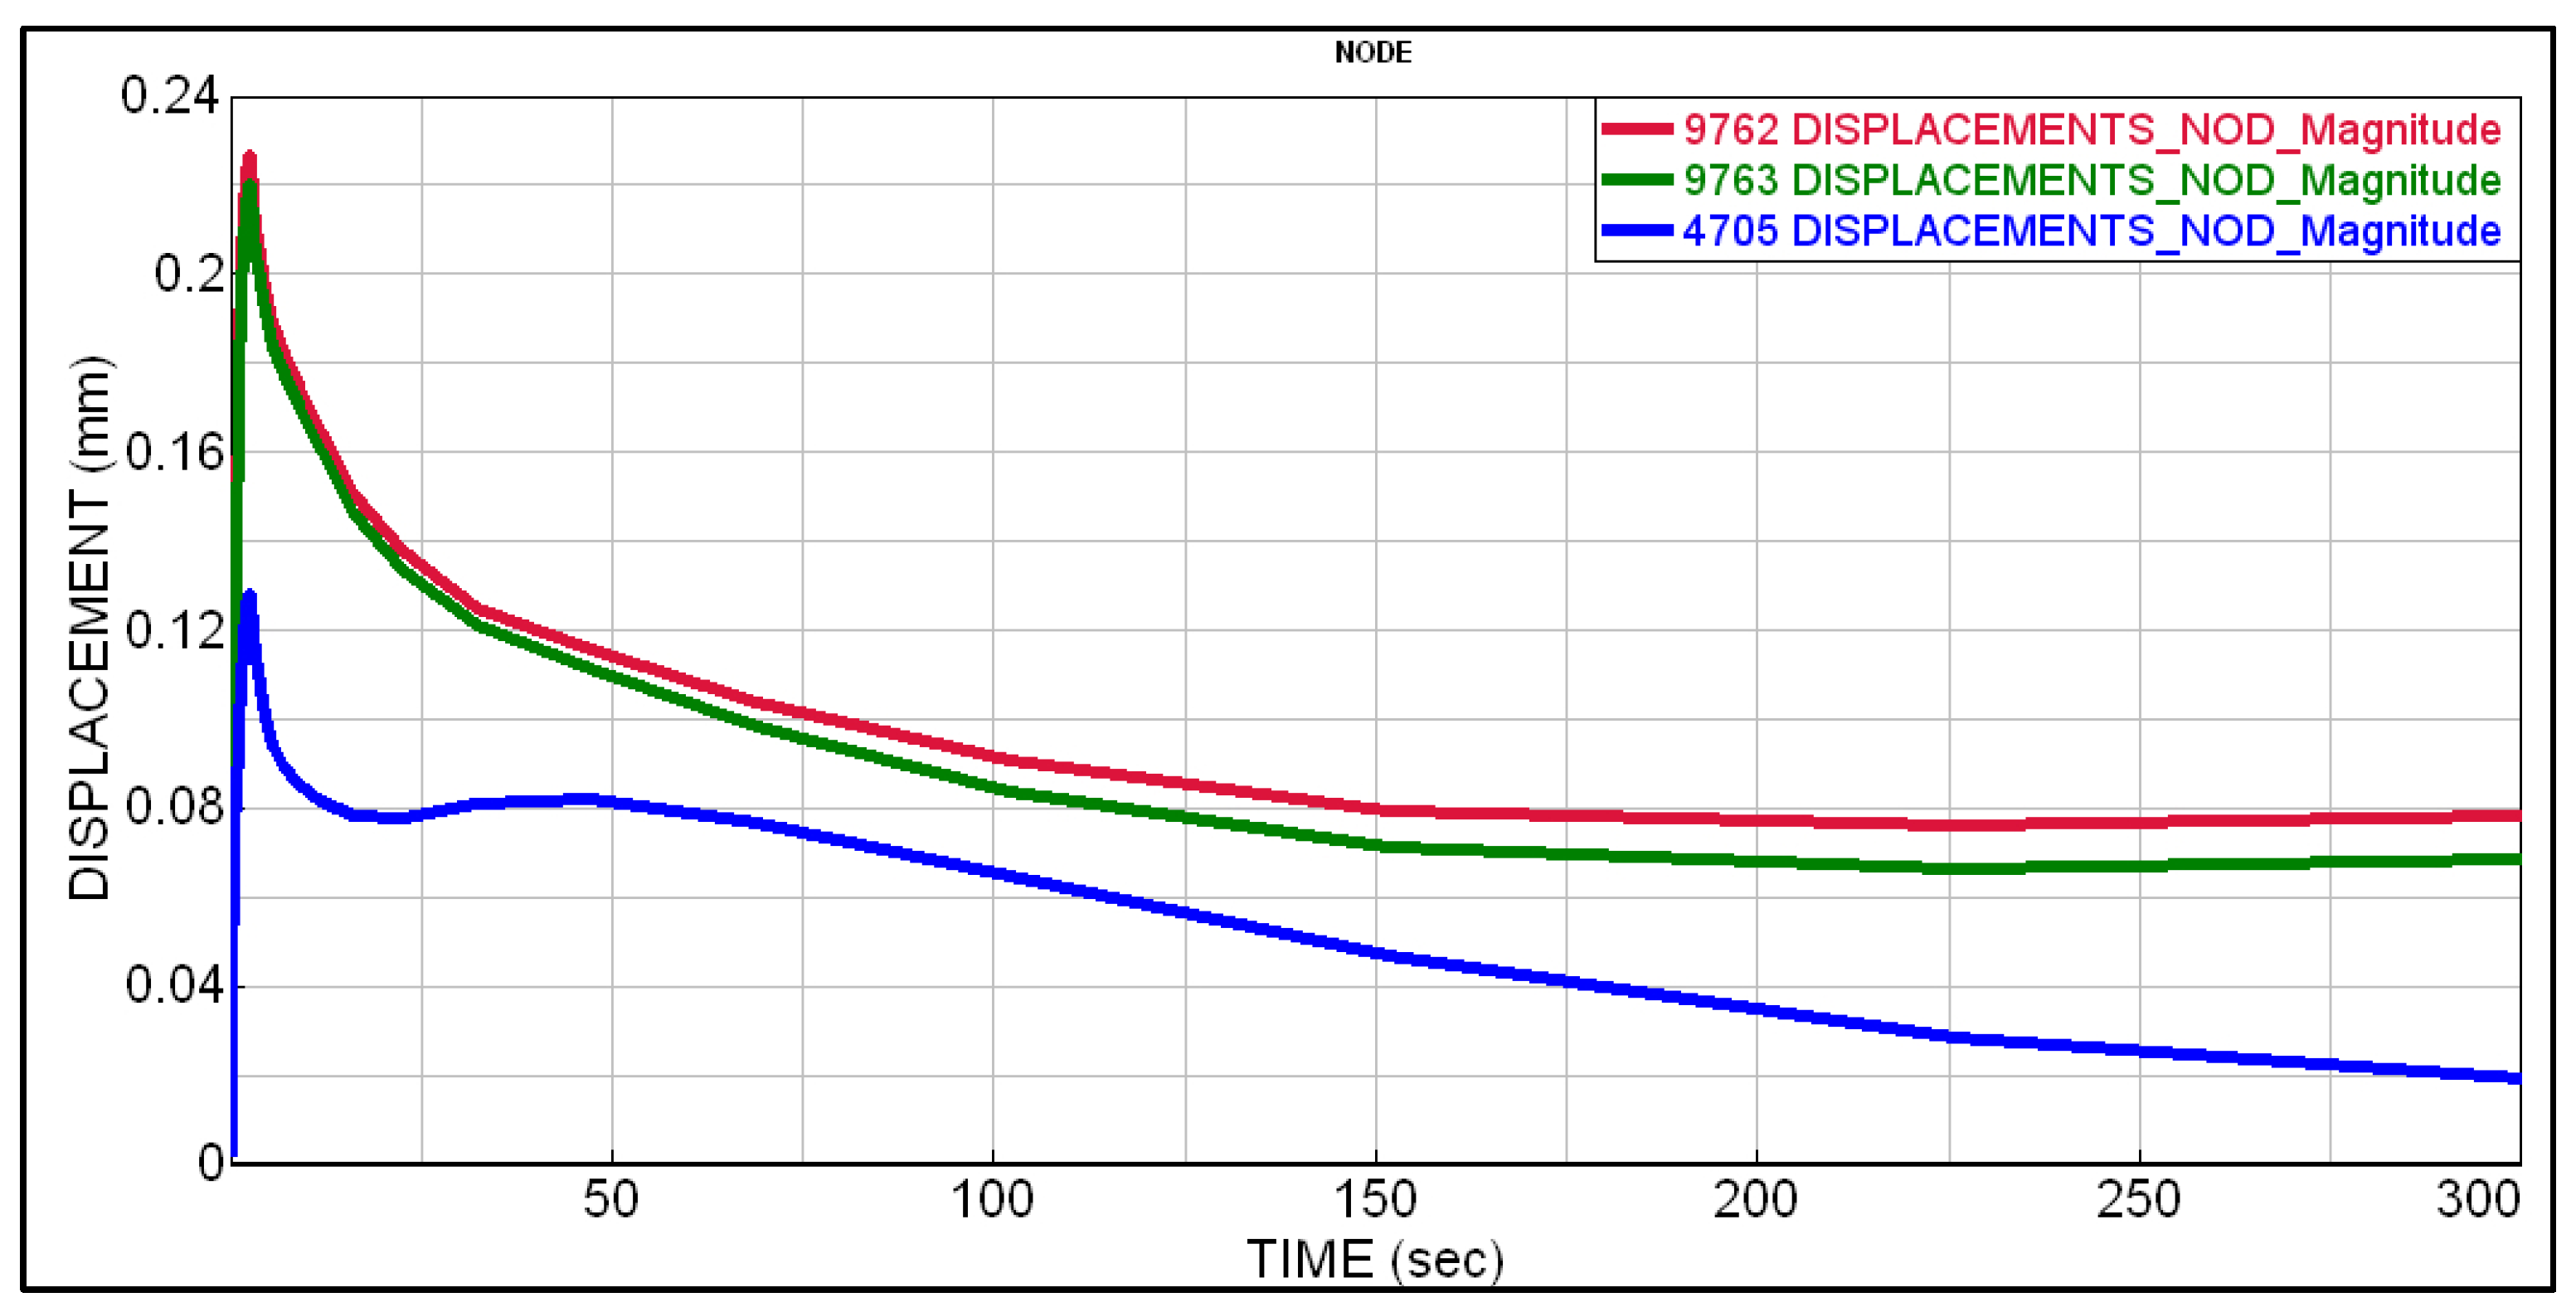
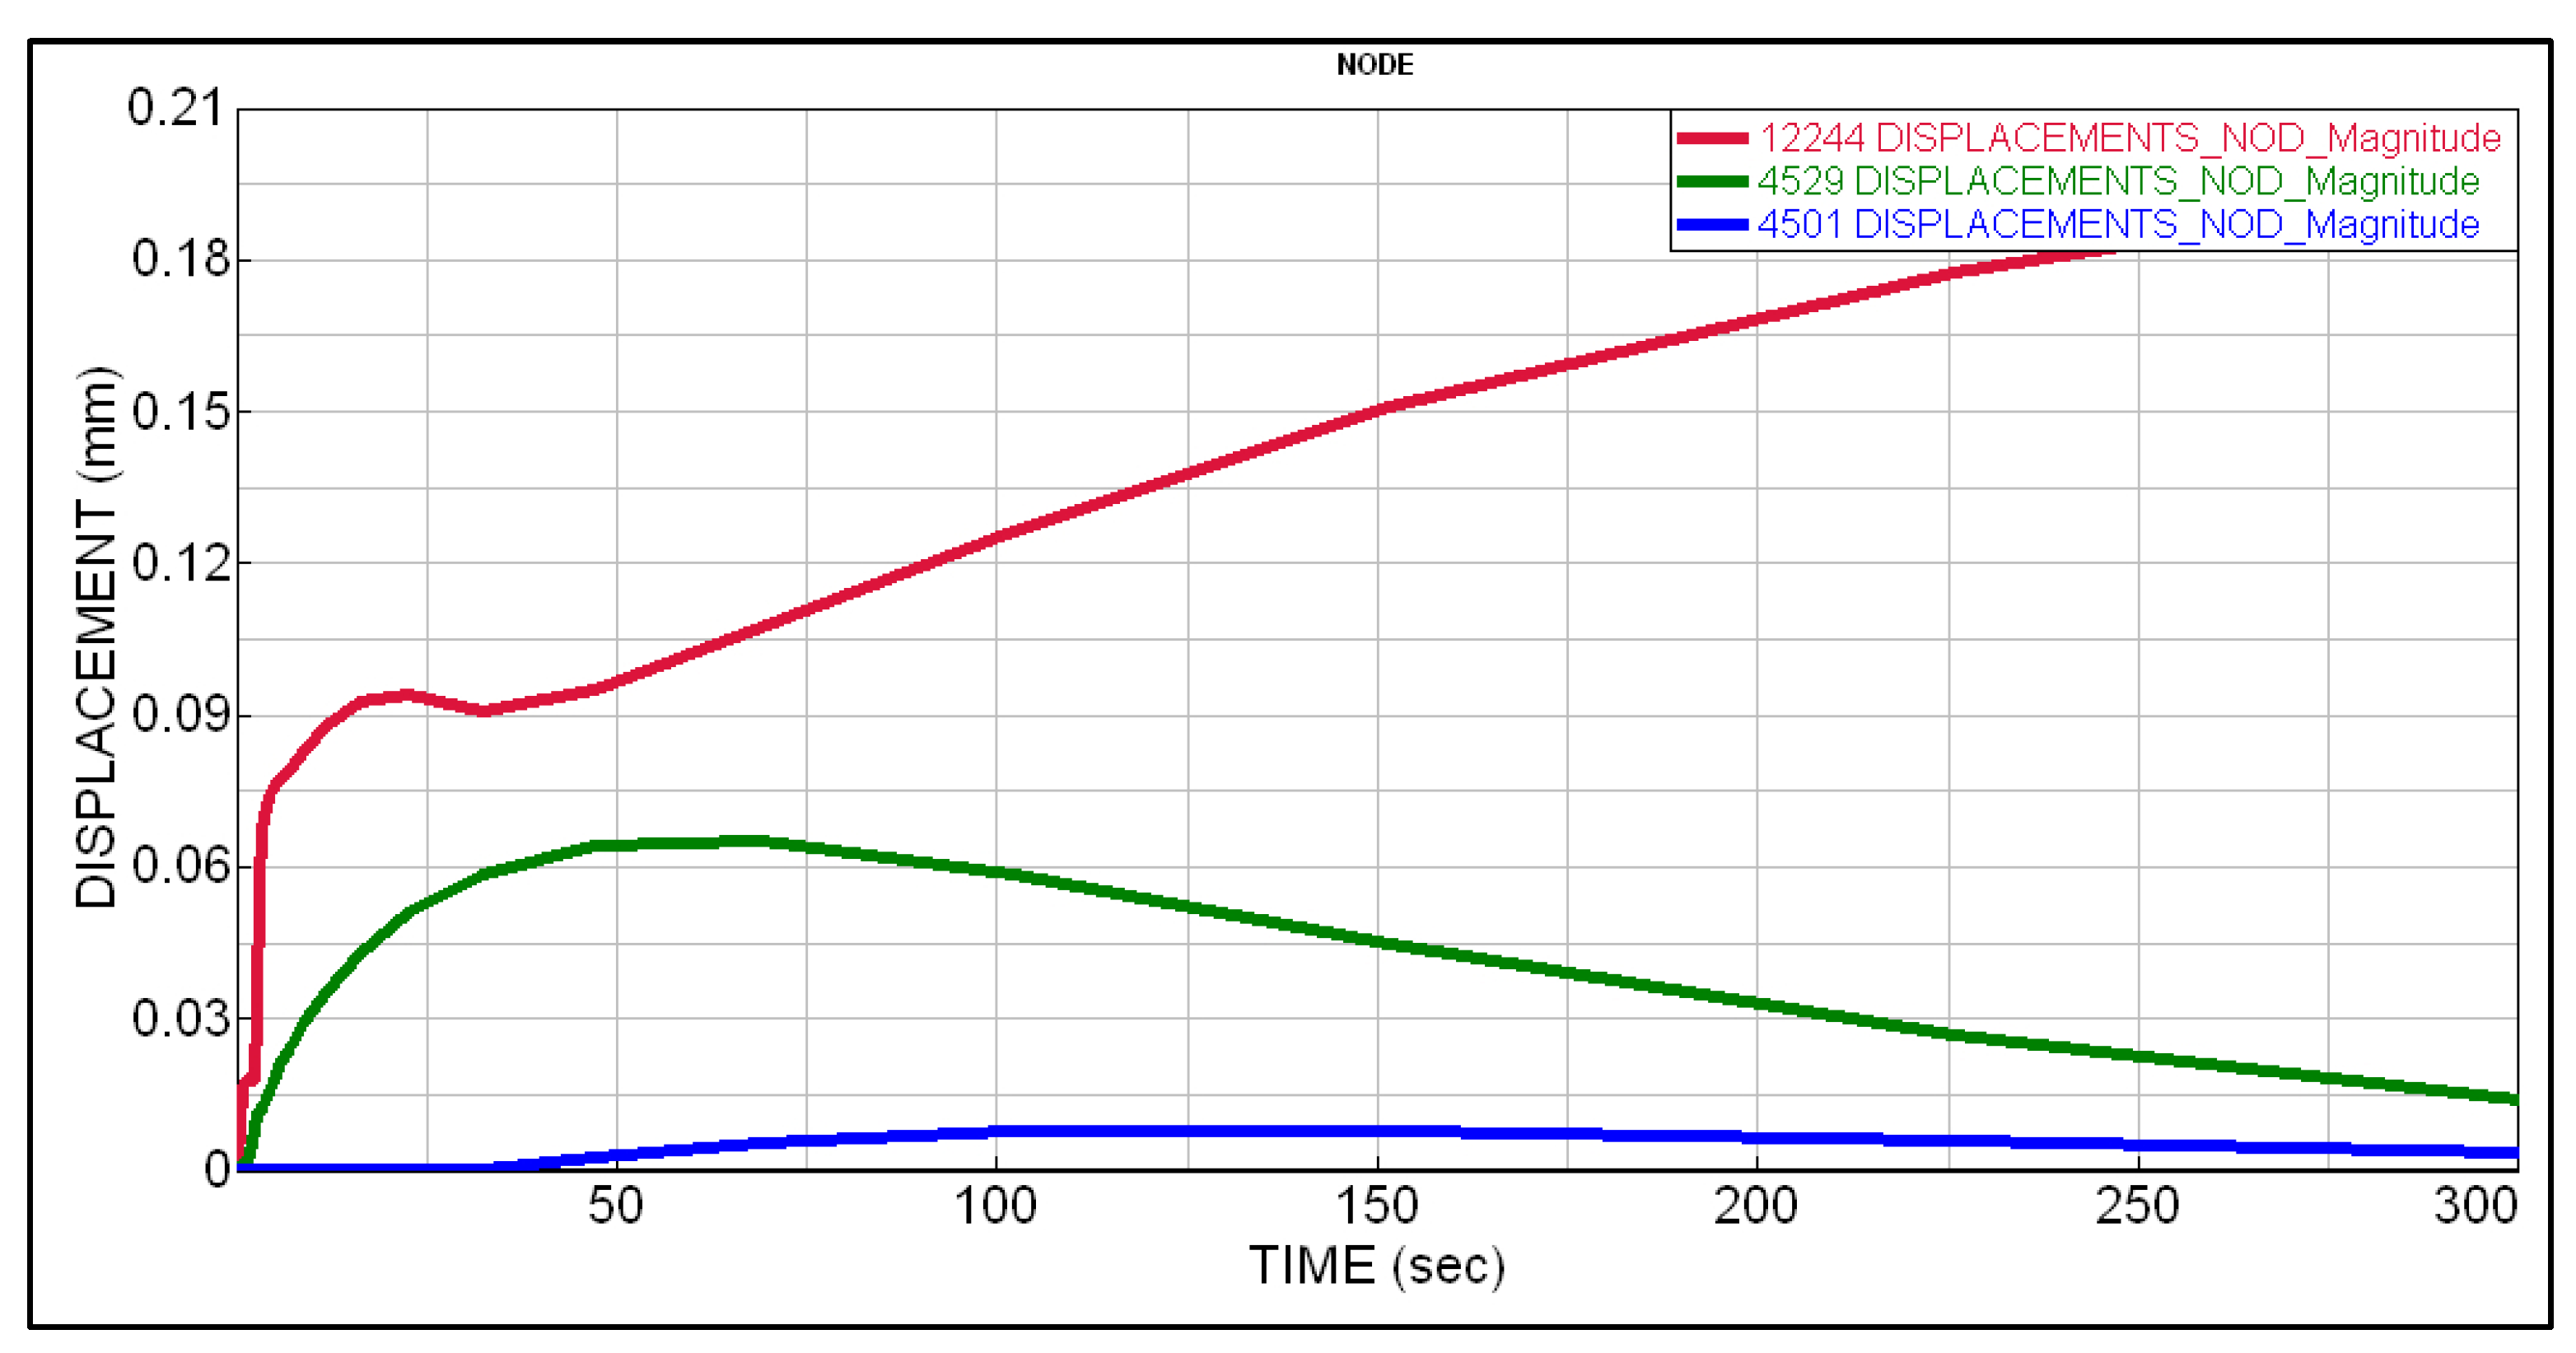
3.8. Calculation Results and Analysis of Deformation

The deformation contour of the saw blade model reaches its maximum when subjected to welding powers of 1700 W, 1800 W, 1900 W, and 2000 W, as depicted in Figure 18. The contour map clearly illustrates that an increase in laser welding power leads to a proportional increase in saw blade deformation, particularly at the topmost point of the blade tip, where it experiences its most significant distortion. Furthermore, there is also an observed rise in weld position deformation with higher laser power. The deformation analysis revealed significant insights into the mechanical response of the welded joint under thermal and mechanical loads. Additionally, the simulation highlighted asymmetrical deformation patterns near the weld edges, attributed to uneven cooling rates and localized residual stresses.
The time deformation curve for three points, namely 9762 from the center of the weld and 9763 and 4705 at both ends of the center, as depicted in Figure 19, can be generated. The graph provides the deformation pattern over time for these three points. It is evident from the curve that the maximum deformation occurs at the initiation of laser welding and in close proximity to the weld, reaching a peak value of 0.23. The deformation towards both ends was comparatively lower than that observed at the center. The time deformation curve for the working layer of the cutter head was generated by selecting the substrate’s middle and tail points at positions 12,244, 4529, and 4501, respectively. Figure 20 depicts the resulting graph illustrating the temporal deformation patterns observed at these three points. From this curve, it is evident that the maximum deformation of the working layer of the cutter head reached 0.2 during the welding process. The deformation of the central region of the substrate exhibits an initial increase followed by a gradual decrease, reaching a peak value of 0.07. Conversely, minimal and almost negligible deformation was observed at the trailing end of the substrate, indicating that laser welding had an insignificant thermal impact in this area. These findings underscore the necessity for optimized welding parameters and post-weld treatments to minimize deformation and enhance joint integrity.

3.9. Comparison between Simulated and Measured Results

We took four pieces of the same LW230 substrate and the same batch of sintered cutter heads and welded each piece using identical laser welding equipment at varying power levels (1700 W, 1800 W, 1900 W, and 2000 W) with a welding speed of 26 mm/s. Then, we conducted tooth-breaking experiments on each welded piece. The resulting weld image is depicted in Figure 21. At 1700 W, the weld exhibits a narrow and deep penetration profile, indicative of efficient energy use and high cooling rates. With increasing power to 1800 W and 1900 W, the weld width expanded, and the penetration depth increased due to higher heat input, leading to a more pronounced thermal gradient. At 2000 W, the weld showed signs of excessive heat input, including wider weld beads and potential overheating, which may compromise the mechanical properties by promoting coarser grain structures.
The recorded data can be found in Figure 22. The error bars in Figure 22 represent the standard deviation of each set of experimental data. To determine these error bars, we conducted multiple experiments and calculated the standard deviation for each data set, reflecting the variability and reliability of the data. Based on the actual welding tooth strength data, it is evident that 1700 W exhibits the highest average tooth strength, which aligns with the simulation results. The simulated temperature profiles and microstructural characteristics closely matched the experimental measurements, with peak temperatures and grain sizes within a 5% margin of error. Notably, the simulation accurately predicted the formation of fine martensitic structures at higher cooling rates observed in the experiments. These consistent results validate the reliability of the simulation model in replicating real-world welding scenarios.

4. Conclusions

This study employed the finite element method to establish a cross-scale, multi-field coupled calculation model, simulating the temperature field, phase transformation, grain morphology, stress field, and fatigue performance of laser-welded diamond saw blades. This enabled a comprehensive evaluation of material calculations, process simulations, and service simulations across the entire life cycle. The morphology of the weld pool calculated was highly consistent with the actual results, as confirmed through simulation using SYSWELD software and heat source validation.
(1) Through comprehensive analysis, the optimal welding process parameters for diamond saw blades were identified. A laser welding speed of 26 mm/s and welding power of 1700 W resulted in the smallest weld seam stress, the lowest DVC value, and the highest fatigue resistance.
(2) Reducing grain size at the weld seam decreased grain orientation deviation; 1700 W welding produced the highest wrench tooth strength of 1200 MPa, confirmed by actual welding torque strength comparisons.
(3) Numerical simulation is increasingly indispensable in industrial production and manufacturing. It significantly accelerates the research and development cycle, reduces testing costs, and enhances the success rate of product development.

Author Contributions

Conceptualization, Q.X., Y.X. and J.W.; methodology, X.C., Q.X., Y.X. and Y.L.; validation, Q.X. and Y.X.; formal analysis, Q.X., X.C., Y.L. and J.W.; investigation, X.C. and Q.X.; resources, Q.X. and X.C.; data curation, Y.L. and X.C.; writing—original draft preparation, Q.X., Y.L., X.C. and J.W.; writing—review and editing, Q.X., X.C. and Y.L.; visualization, Q.X., Y.X. and J.W.; supervision, Y.X. and J.W.; project administration, Y.X. and Q.X.; funding acquisition, J.W. All authors have read and agreed to the published version of the manuscript.

Funding

Funding for Wu’s contributions were provided the Guangdong Basic and Applied Basic Reaserch Foundation under grant number 2024A1515011011 and the Scientific Research Foundation of Shantou University under grant number NTF22001.

Institutional Review Board Statement

Not applicable.

Informed Consent Statement

Not applicable.

Data Availability Statement

All data supporting the conclusions of this manuscript are included within the manuscript.

Conflicts of Interest

Authors Qiang Xu, Yibo Liu and Yanjun Xu were employed by the Central Iron & Research Institute and Beijing Gang Yan Diamond Products Company. The remaining authors declare that the research was conducted in the absence of any commercial or financial relationships that could be construed as a potential conflict of interest.

References

  1. Tao, P.; Zhang, X.; Mi, G.; Wang, C. Research on fiber laser welding formation, microstructure, and mechanical properties of 7.5 mm 304 stainless steel. J. Mater. Res. Technol. 2023, 24, 236–249. [Google Scholar] [CrossRef]
  2. Liu, Z.; Jin, X.; Li, J.; Hao, Z.; Zhang, J. Numerical simulation and experimental analysis on the deformation and residual stress in trailing ultrasonic vibration assisted laser welding. Adv. Eng. Softw. 2022, 172, 103200. [Google Scholar] [CrossRef]
  3. Rominiyi, A.L.; Mashinini, P.M. Continuous wave laser welding of Ti6Al4V alloy joints: Microstructure and mechanical properties. Mater. Lett. 2023, 336, 133934. [Google Scholar] [CrossRef]
  4. Ma, X.; Wang, L.; Zhu, Z.; Su, L.; Guo, W.; Mi, G.; Xu, T. Planetary laser welding system induced equiaxed and refined grains in 2A12 aluminum alloy weldments. Opt. Laser Technol. 2023, 161, 109162. [Google Scholar] [CrossRef]
  5. Liu, G.; Zhang, Z.; Wang, H.; Gui, Y.; Huang, X.; Li, Y.; Tan, Y. Influence of laser welding defocus and penetration monitoring based on advanced optical sensors. Optik 2023, 280, 170811. [Google Scholar] [CrossRef]
  6. Ghosh, P.S.; Sen, A.; Chattopadhyaya, S.; Sharma, S.; Singh, J.; Li, C.; Krolczyk, G.; Rajkumar, S. Progressive developments and challenges in dissimilar laser welding of steel to various other light alloys (Al/Ti/Mg): A comprehensive review. Heliyon 2022, 8, e11710. [Google Scholar] [CrossRef] [PubMed]
  7. Chen, X.; Zhang, S.; Jiang, M.; Chen, Y.; Jiang, Y.; Wang, Z.; Jiang, N.; Chen, A.; Li, B.; Lei, Z.; et al. Microstructure and mechanical properties of laser welded hot-press-formed steel with varying thicknesses of Al–Si coatings cleaned by nanosecond pulsed laser. J. Mater. Res. Technol. 2023, 22, 2576–2588. [Google Scholar] [CrossRef]
  8. Kumar Goyal, D.; Yadav, R.; Kant, R. Laser transmission welding of polycarbonate sheets using electrolytic iron powder absorber. Opt. Laser Technol. 2023, 161, 109165. [Google Scholar] [CrossRef]
  9. Hao, K.; Gao, Z.; Huang, J.; Xu, L.; Liu, Y.; Han, Y.; Zhao, L.; Ren, W. Comparisons of laser and laser-arc hybrid welded carbon steel with beam oscillation. Opt. Laser Technol. 2023, 157, 108787. [Google Scholar] [CrossRef]
  10. Zubairuddin, M.; Ravi kumar, R.; Chaursaia, P.K.; Ali, B. Thermo-mechanical analysis of laser welding of Grade 91 steel plates. Optik 2021, 245, 167510. [Google Scholar] [CrossRef]
  11. Ramos, H.M.E.; Tavares, S.M.O.; de Castro, P.M.S.T. Numerical modelling of welded T-joint configurations using SYSWELD. Sci. Technol. Mater. 2018, 30, 6–15. [Google Scholar] [CrossRef]
  12. Lu, W.-L.; Sun, J.-L.; Su, H.; Chen, L.-J.; Zhou, Y.-Z. Experimental research and numerical analysis of welding residual stress of butt welded joint of thick steel plate. Case Stud. Constr. Mater. 2023, 18, e01991. [Google Scholar] [CrossRef]
  13. Hong, M.; Wang, S.; Sun, W.; Geng, Z.; Xin, J.; Ke, L. Effect of welding speed on microstructure and mechanical properties of selective laser melting Inconel 625 alloy laser welded joint. J. Mater. Res. Technol. 2022, 19, 2093–2103. [Google Scholar] [CrossRef]
  14. Heinze, C.; Schwenk, C.; Rethmeier, M. Effect of heat source configuration on the result quality of numerical calculation of welding-induced distortion. Simul. Model. Pract. Theory 2012, 20, 112–123. [Google Scholar] [CrossRef]
  15. Heinze, C.; Schwenk, C.; Rethmeier, M. Influences of mesh density and transformation behavior on the result quality of numerical calculation of welding induced distortion. Simul. Model. Pract. Theory 2011, 19, 1847–1859. [Google Scholar] [CrossRef]
  16. Chen, L.; Mi, G.; Zhang, X.; Wang, C. Numerical and experimental investigation on microstructure and residual stress of multi-pass hybrid laser-arc welded 316L steel. Mater. Des. 2019, 168, 107653. [Google Scholar] [CrossRef]
  17. Du, Z.; Sun, X.; Ng, F.L.; Chew, Y.; Tan, C.; Bi, G. Thermo-metallurgical simulation and performance evaluation of hybrid laser arc welding of chromium-molybdenum steel. Mater. Des. 2021, 210, 110029. [Google Scholar] [CrossRef]
  18. Zubairuddin, M.; Albert, S.K.; Reddy, M.S.; Ali, B.; Varaprasad, B.; Mishra, A.; Das, P.K.; Elumalai, P.V. Thermal analysis of thin P91 steel using FlexPDE and SYSWELD. Mater. Today Process. 2023, 72, 1550–1555. [Google Scholar] [CrossRef]
  19. Sun, J.; Dilger, K. Material hardening model effects on the calculated welding residual stresses in ultra-high strength steel S960. J. Mater. Res. Technol. 2023, 24, 557–570. [Google Scholar] [CrossRef]
  20. Zubairuddin, M.; Albert, S.K.; Vasudevan, M.; Mahadevan, S.; Chaudhari, V.; Suri, V.K. Numerical simulation of multi-pass GTA welding of grade 91 steel. J. Manuf. Process. 2017, 27, 87–97. [Google Scholar] [CrossRef]
  21. Zhang, W.; Fu, H.; Fan, J.; Li, R.; Xu, H.; Liu, F.; Qi, B. Influence of multi-beam preheating temperature and stress on the buckling distortion in electron beam welding. Mater. Des. 2018, 139, 439–446. [Google Scholar] [CrossRef]
  22. Zhang, H.; Wang, Y.; Han, T.; Bao, L.; Wu, Q.; Gu, S. Numerical and experimental investigation of the formation mechanism and the distribution of the welding residual stress induced by the hybrid laser arc welding of AH36 steel in a butt joint configuration. J. Manuf. Process. 2020, 51, 95–108. [Google Scholar] [CrossRef]
  23. Zhang, C.; Sun, J.; Li, Y.; Deng, D. Numerical simulation of residual stress of butt-welded joint involved in complex column-beam welded structure. J. Manuf. Process. 2022, 83, 458–470. [Google Scholar] [CrossRef]
  24. Zhan, H.-X.; Wang, Y.; Li, C.-W.; Han, T.; Han, B.; Zhao, W.-M. Computational and experimental study of a melt-hardened zone on a roller modified by wide-band laser treatment. Opt. Laser Technol. 2009, 41, 251–257. [Google Scholar] [CrossRef]
  25. Zain-ul-Abdein, M.; Nelias, D.; Jullien, J.-F.; Deloison, D. Prediction of laser beam welding-induced distortions and residual stresses by numerical simulation for aeronautic application. J. Mater. Process. Technol. 2009, 209, 2907–2917. [Google Scholar] [CrossRef]
  26. Zain-ul-abdein, M.; Nélias, D.; Jullien, J.-F.; Boitout, F.; Dischert, L.; Noe, X. Finite element analysis of metallurgical phase transformations in AA 6056-T4 and their effects upon the residual stress and distortion states of a laser welded T-joint. Int. J. Press. Vessel. Pip. 2011, 88, 45–56. [Google Scholar] [CrossRef]
  27. Yuan, K.; Sumi, Y. Simulation of residual stress and fatigue strength of welded joints under the effects of ultrasonic impact treatment (UIT). Int. J. Fatigue 2016, 92, 321–332. [Google Scholar] [CrossRef]
  28. Yeo, H.; Son, M.; Ki, H. Investigation of microstructure and residual stress development during laser surface melting of AH36 steel using 3-D fully coupled numerical model. Int. J. Heat Mass Transf. 2022, 197, 123366. [Google Scholar] [CrossRef]
  29. Yang, Z.; Wang, W.; Zhang, J.; Xu, L. Effect of fire exposure on residual stresses relief in welded high strength Q690 steel sections. J. Constr. Steel Res. 2021, 177, 106455. [Google Scholar] [CrossRef]
  30. Yaakoubi, M.; Kchaou, M.; Dammak, F. Simulation of the thermomechanical and metallurgical behavior of steels by using ABAQUS software. Comput. Mater. Sci. 2013, 68, 297–306. [Google Scholar] [CrossRef]
  31. Xu, J.J.; Gilles, P.; Duan, Y.G.; Yu, C. Temperature and residual stress simulations of the NeT single-bead-on-plate specimen using SYSWELD. Int. J. Press. Vessel. Pip. 2012, 99–100, 51–60. [Google Scholar] [CrossRef]
  32. Xie, X.; Zhou, J.; Long, J. Numerical study on molten pool dynamics and solute distribution in laser deep penetration welding of steel and aluminum. Opt. Laser Technol. 2021, 140, 107085. [Google Scholar] [CrossRef]
  33. Wang, Y.; Wang, L.; Di, X.; Shi, Y.; Bao, X.; Gao, X. Simulation and analysis of temperature field for in-service multi-pass welding of a sleeve fillet weld. Comput. Mater. Sci. 2013, 68, 198–205. [Google Scholar] [CrossRef]
Figure 1. The heat source model: (a) 3D Gaussian heat source model, and (b) movement diagram.
Photonics 11 00676 g001
Figure 2. Thermophysical properties of 30CrMo alloy: (a) density, (b) thermal conductivity, (c) specific heat.
Photonics 11 00676 g002
Figure 3. Mechanical properties of 30CrMo alloy: (a) Young’s modulus, (b) Poissom’s ratio, and (c) yield strength.
Photonics 11 00676 g003
Figure 4. Thermophysical parameters of transition layer material: (a) density, (b) thermal conductivity, and (c) specific Heat.
Photonics 11 00676 g004
Figure 5. Mechanical parameters of transition layer material: (a) Young’s modulus, (b) Poissom’s ratio, and (c) yield strength.
Photonics 11 00676 g005
Figure 6. The cutter head diagram: (a) LW23 and (b) LW230 (1/18 drawing).
Photonics 11 00676 g006
Figure 7. The 3D definition of material parameters.
Photonics 11 00676 g007
Figure 8. Constraints on tooling for welding with diamond tools.
Photonics 11 00676 g008
Figure 9. Comparison between the measured and simulated sizes of weld pools.
Photonics 11 00676 g009
Figure 10. Cloud chart of temperature field: (a) welding power 1700 W; (b) welding power 1800 W; (c) welding power 1900 W; (d) welding power 2000 W.
Photonics 11 00676 g010
Figure 11. Time–temperature curve.
Photonics 11 00676 g011
Figure 12. Grain morphology at the weld interface: (a) welding power 1700 W; (b) welding power 1800 W; (c) welding power 1900 W; (d) welding power 2000 W.
Photonics 11 00676 g012
Figure 13. Grain orientation deviation diagram: (a) welding power 1700 W; (b) welding power 1800 W; (c) welding power 1900 W; (d) welding power 2000 W.
Photonics 11 00676 g013
Figure 14. Cloud diagram of maximum stress: (a) welding power 1700 W; (b) welding power 1800 W; (c) welding power 1900 W; (d) welding power 2000 W.
Photonics 11 00676 g014
Figure 15. Calculation cloud chart of fatigue: (a) welding power 1700 W; (b) welding power 1800 W; (c) welding power 1900 W; (d) welding power 2000 W.
Photonics 11 00676 g015
Figure 16. Power-dependent variation curve of the DVC value.
Photonics 11 00676 g016
Figure 17. DVC Curve under different welding power: (a) welding power 1700 W; (b) welding power 1800 W; (c) welding power 1900 W; (d) welding power 2000 W.
Photonics 11 00676 g017
Figure 18. Cloud chart of deformation field: (a) welding power 1700 W; (b) welding power 1800 W; (c) welding power 1900 W; (d) welding power 2000 W.
Photonics 11 00676 g018
Figure 19. Time–deformation curve around the weld.
Photonics 11 00676 g019
Figure 20. Time–deformation curve of other regions.
Photonics 11 00676 g020
Figure 21. Actual weld diagram: (a) welding power 1700 W; (b) welding power 1800 W; (c) welding power 1900 W; (d) welding power 2000 W.
Photonics 11 00676 g021
Figure 22. Refining the data of tooth extraction under varying welding powers.
Photonics 11 00676 g022
Table 1. Structural geometric parameters of diamond circular saw blades.
Saw Blade Outer Diameter
/mm
Mesopore
/mm
Number of Teeth
/mm
Tooth Length
/mm
Depth of Tooth
/mm
Tooth Thickness
/mm
Matrix Thickness
/mm
23025.41832103.02.0
Disclaimer/Publisher’s Note: The statements, opinions and data contained in all publications are solely those of the individual author(s) and contributor(s) and not of MDPI and/or the editor(s). MDPI and/or the editor(s) disclaim responsibility for any injury to people or property resulting from any ideas, methods, instructions or products referred to in the content.

