Communication

A Reduction in the Rotational Velocity Measurement Deviation of the Vortex Beam Superposition State for Tilted Object

School of Physics, Harbin Institute of Technology, Harbin 150001, China
*
Author to whom correspondence should be addressed.
Photonics 2024, 11(7), 679; https://doi.org/10.3390/photonics11070679 (registering DOI)
Submission received: 29 May 2024 / Revised: 10 July 2024 / Accepted: 11 July 2024 / Published: 21 July 2024

Abstract

:
In measuring object rotational velocity using vortex beam, the incident light on a tilted object causes spectral broadening, which significantly interferes with the identification of the true rotational Doppler shift (RDS) peak. We employed a velocity decomposition method to analyze the relationship between the spectral extremum and the central frequency shift caused by the object tilt. Compared with the linear growth trend observed when calculating the object rotational velocity using the frequency peak with the maximum amplitude, the central frequency calculation method effectively reduced the deviation rate of the RDS and velocity measurement value from the true value, even at large tilt angles. This approach increased the maximum tilt angle for a 1% relative error from 0.221 to 0.287 rad, representing a 29.9% improvement. When the tilt angle was 0.7 rad, the velocity measurement deviation reduction rate can reach 5.85%. Our work provides crucial support for achieving high-precision rotational velocity measurement of tilted object.

1. Introduction

The vortex beam is a type of beam characterized by a spiral wavefront structure possessing orbital angular momentum (OAM) and carrying the phase factor exp(ilθ) [1]. When irradiated onto the surface of a rotating object, it induces a rotational Doppler frequency shift (RDS) proportional to the angular velocity of the object, known as the rotational Doppler effect (RDE) [2]. The RDE originates from the same principle as the linear Doppler effect [3], and it can detect the rotational velocity of an object in various scales [4,5,6]. This phenomenon has attracted considerable attention since its discovery. In recent years, researchers have made significant progress in understanding the RDE, investigating its underlying mechanisms, application scope, and optimizing rotational velocity measurement techniques [7,8,9,10,11,12,13]. Studies have explored scenarios involving non-uniform rotational velocity [10,14], off-axis incidence [7], circular precession [12], and various types of OAM-carrying incident beams [15,16,17]. The scope of the RDE currently extends to velocity direction [18,19], angular acceleration velocity detection [20,21], and vector Doppler effect [22]. These advancements provide a basis for expanding the comprehensive expansion of rotational Doppler velocity detection applications.
Notwithstanding the high sensitivity of RDE detection, only a single RDS signal exists in the spectrum when the propagation direction axis of the vortex beam coincides with the rotational axis of the object. However, in practical applications, the incident conditions are typically not ideal. When the beam is incident on a tilted object, the spectrum broadens. The energy of the RDS peak disperses to the surrounding peaks, decreasing in the amplitude of the RDS peak. Increased the tilt angle significantly interferes with the accurate determination of the RDS peak. In previous studies, Vasnetsov et al. [23] viewed the angular offset as a phase wedge during transmission through theoretical analyses of the angular spectrum dispersion. However, this approach is only meaningful for small tilt angles and is not applicable to larger angles. Subsequently, Qiu et al. [9] investigated the relationship between oblique incidence and spectral broadening using a local scattering model. Nonetheless, a comprehensive understanding of the intrinsic mechanism and impact of the object tilt on the RDS has not been fully achieved. In addition, a quantitative analysis of the reduction ability of velocity measurement deviation is lacking.
In this study, we analyzed the relationship between the spectral extremum and the center frequency shift caused by the tilted object using the velocity decomposition method. Compared with using the maximum amplitude frequency peak as the RDS to calculate the object velocity directly, the center frequency calculation method reduced the deviation rate of the RDS and the velocity measurement value from the real value, supporting a high-precision velocity measurement of the tilted object.

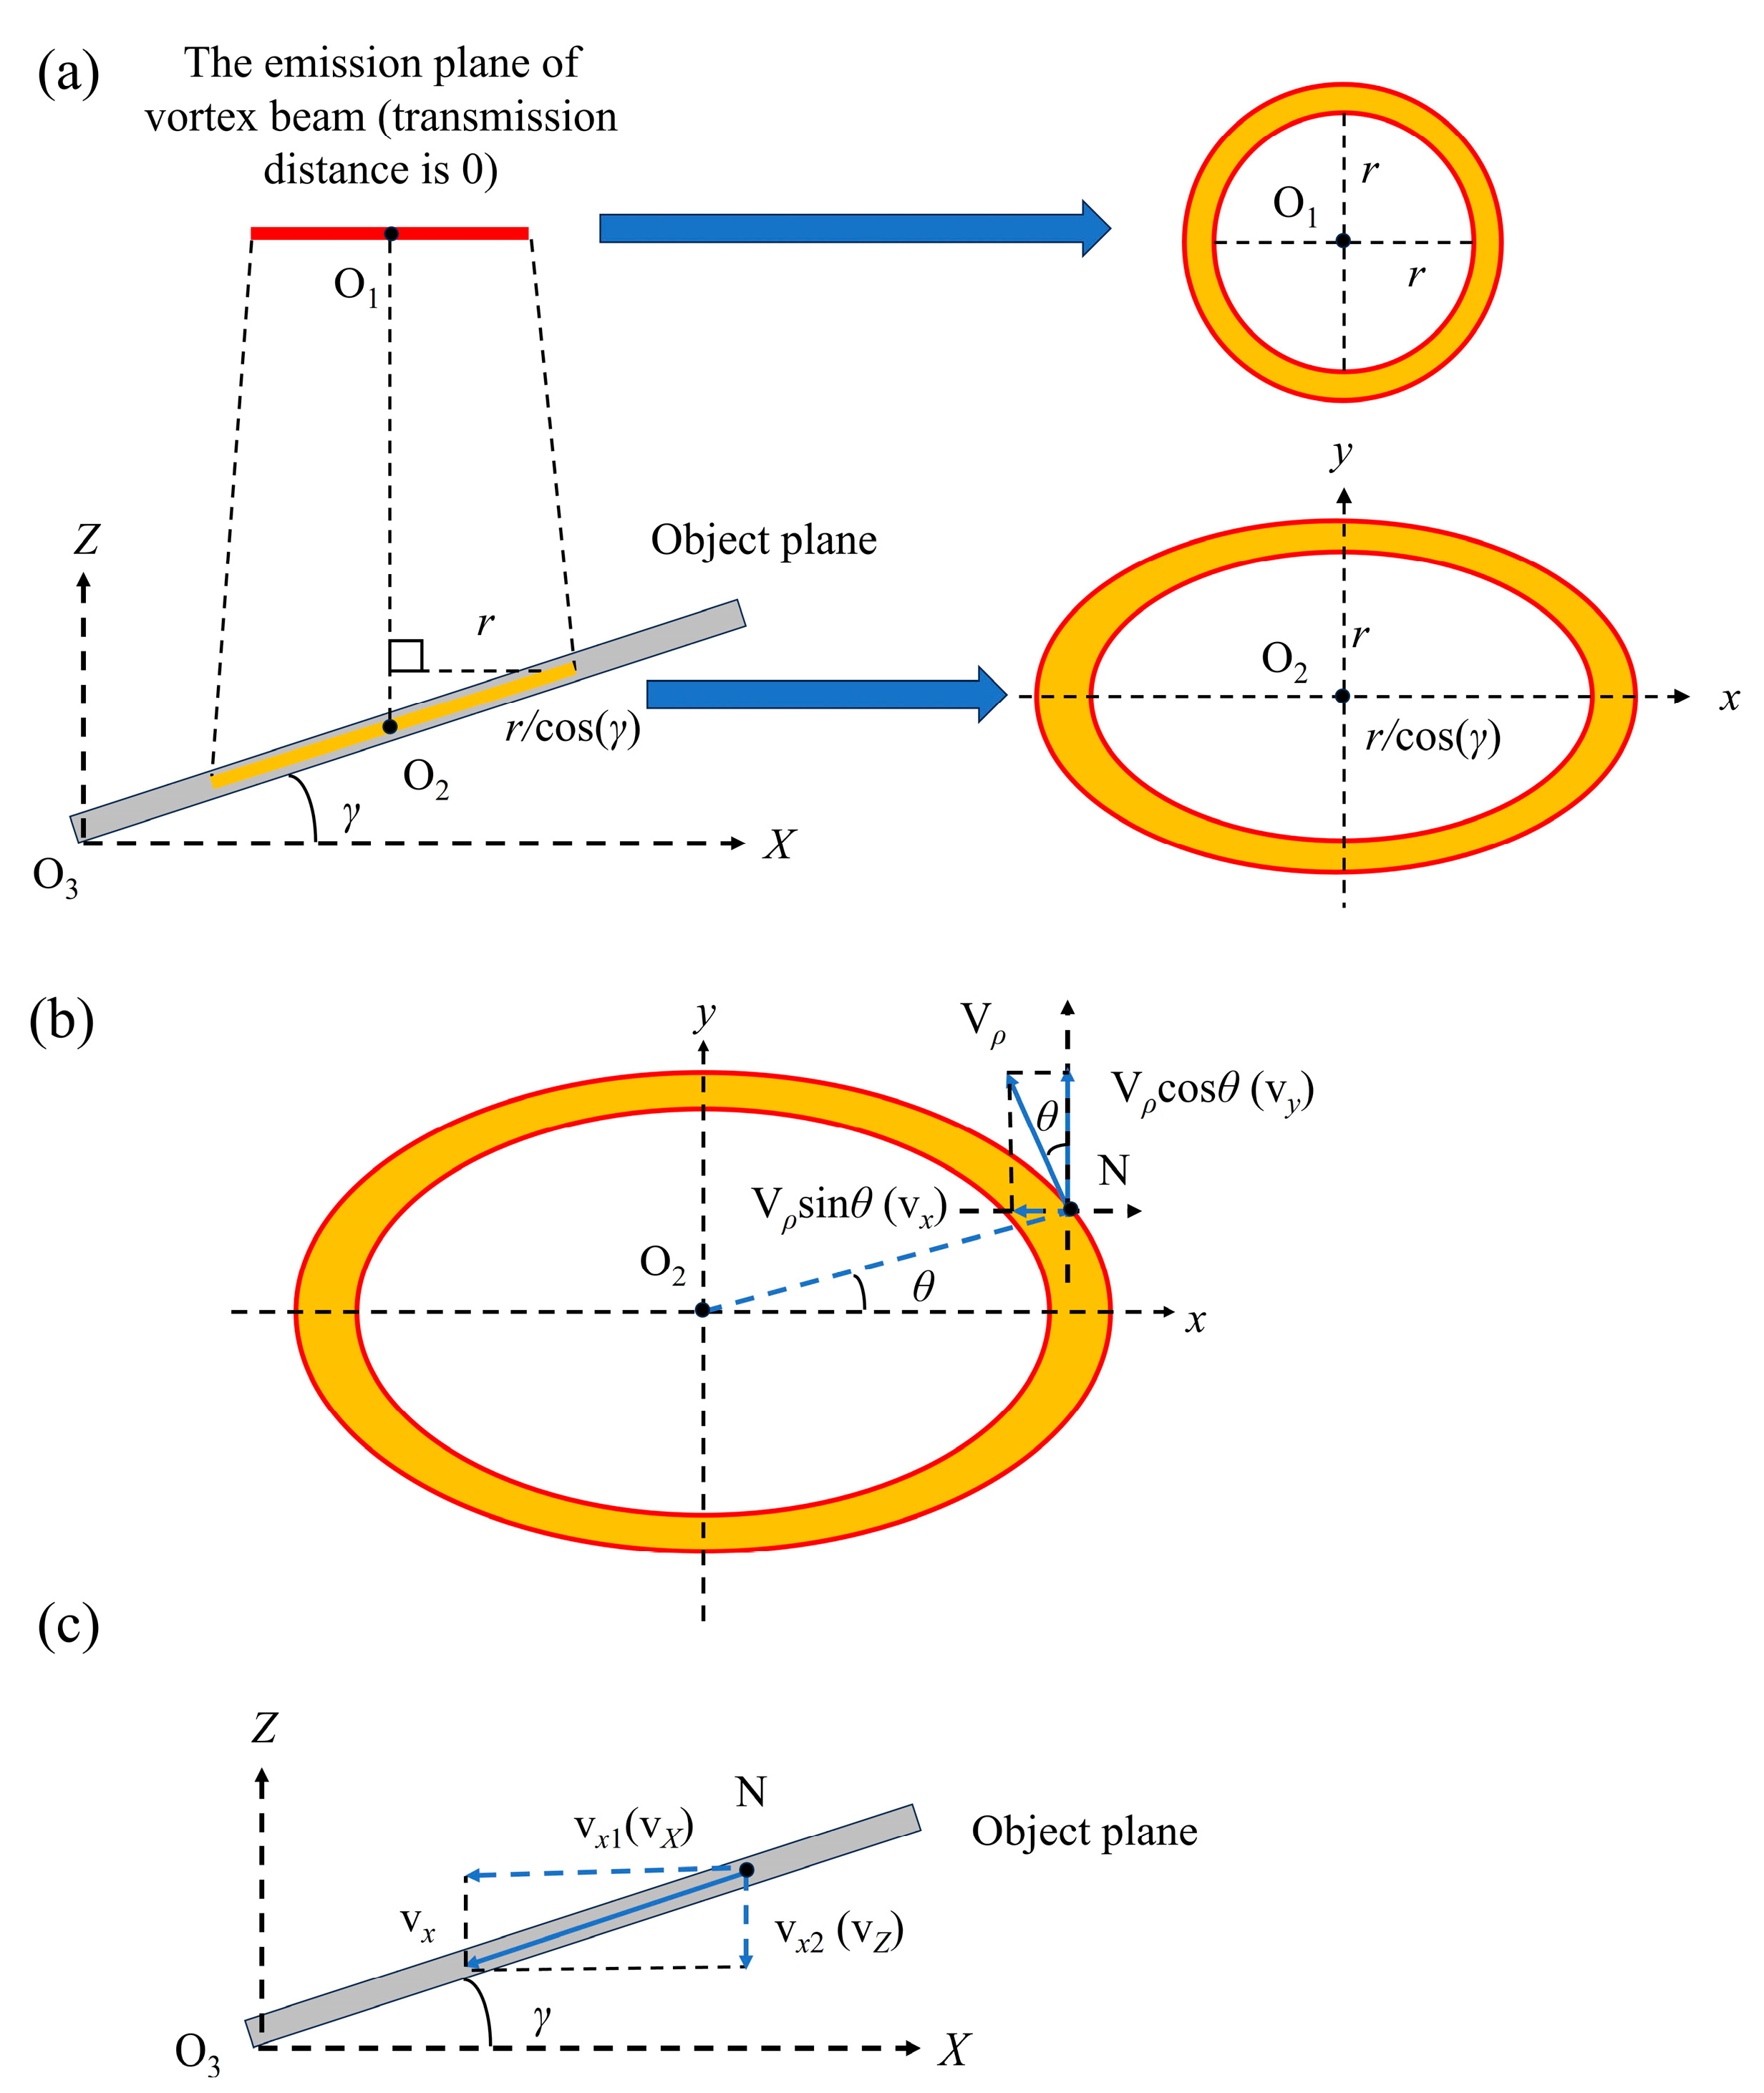
2. Principle and Theory

The complex amplitude of a Laguerre–Gaussian vortex beam in the emission plane (transmission distance is 0) can be represented as E 0 r ω 0 l exp r 2 ω 0 2 exp i l θ , wherein E0, (r, θ), ω0, and l denote the electric field amplitude, polar coordinates, waist radius, and topological charge, respectively [24]. Due to the phase factor exp ( i l θ ) containing OAM carried by the vortex beam, it has a unique spiral phase wavefront structure, and the beam exhibits a hollow, circular intensity structure. In actual RDE detection, a Gaussian mode laser can be efficiently modulated into a single-mode or superimposed vortex beam through a spatial light modulator (SLM). As shown in Figure 1a, when a single-mode vortex beam is emitted, the shape of the light spot is a circular ring, and the distance from the center O1 to each point of the circular ring is equal. In practical RDE detection, a rotating object is usually a rotor driven by an electrical motor, and it can be simplified in theoretical research. When the object surface is non-tilted, the beam incidence is vertical on the surface of a rotating object, and the distance from the center O1 to each point is the radius r of the circular ring. When the object surface is tilted, assuming that the x-axis of the tilted object plane is inclined at an angle γ with the X-axis direction in the global coordinate system, the beam is no longer perpendicular to the surface, the projection of the beam on the object surface changes, and the circular ring is stretched along the x-axis direction on the tilted object surface. Therefore, the interface between the light spot and the object plane becomes approximately an elliptical ring. Each point on the elliptical ring has a slightly different distance from the light spot center O2. In short, the elliptic ring appearance is a natural result of projection transformations in geometric optics. The distances from the light spot center O2 to the symmetrical position of the elliptical ring on the object surface can be approximated as equal. The minor axis of the elliptical ring is r. The major axis of the elliptical ring stretched due to inclination is related to the tilt angle γ and can be expressed as r/cos γ. As shown in Figure 1b, the linear velocity of the tangent point N is represented as vρ = Ωρ; Ω is the rotational velocity of object and ρ is the distance from center O2 to point N. Thus, the linear velocity of the tangent point N can be decomposed in the object plane coordinate system as follows:
v x = Ω ρ sin θ
v y = Ω ρ cos θ
where θ is the polar angle of the object plane coordinate system. The velocity component in the y-axis direction is independent of the tilt angle. The effect of the tilt on the y-axis direction only contributes to a translational y-axis direction velocity component. However, the velocity component vx in the x-axis direction is affected by the tilt angle. As shown in Figure 1c, this can be decomposed in the global coordinate system based on the tilt angle.
v x 1 = v x cos γ
v x 2 = v x sin γ
Therefore
v X = v x 1 = Ω ρ sin θ cos γ
v Y = v y = Ω ρ cos θ
v z = v x 2 = Ω ρ sin θ sin γ
where v x 1 represents the velocity component v X   of the global X-axis direction and v x 2 represents the velocity component v Z   of the global Z-axis direction. The Y direction is perpendicular to the X-Z plane. Given that the theoretical derivation approximates the light spot as a regular elliptical ring, the Doppler frequency shift in the Z-direction is counteracted at the symmetrical points of the ellipse ring. Therefore, the relative velocity between the light spot and object is given as follows:
V = v X 2 + v Y 2 = Ω ρ 1 s i n 2 θ s i n 2 γ
By substituting the major and minor axis into the equation of the ellipse in polar coordinates, we obtain
ρ 2 = r 2 1 c o s 2 θ s i n 2 γ
The RDE is caused by an offset angle β between the motion direction of the transmitted vortex beam photon and the optical axis [25,26] as follows:
sin β = l λ 2 π r
Combining Equations (8)–(10) with the classical Doppler velocity measurement principle, we obtain the following:
ω = 2 π c λ · ρ Ω 1 s i n 2 θ s i n 2 γ c · s i n β = l Ω 1 s i n 2 θ s i n 2 γ 1 c o s 2 θ s i n 2 γ
f = l Ω 2 π 1 s i n 2 θ s i n 2 γ 1 c o s 2 θ s i n 2 γ
Equation (12) shows that for a single-mode vortex beam, when θ = 0 or π , Δf reaches its maximum value. When θ = π / 2 or 3 π / 2 , Δf reaches its minimum value; hence
f m a x , s m = l Ω 2 π cos γ
f m i n , s m = l Ω cos γ 2 π
We can further derive the center frequency, fc,sm, as follows:
f c , s m = f m a x , s m · f m i n , s m = l Ω 2 π
The single-mode vortex beam needs to interfere with the reference light to obtain the difference frequency as the RDS, whereas the vortex beam superposition state can obtain the RDS by self-mixing frequency without the reference light. The two types of beams use different methods for obtaining the RDS. Considering that the vortex beam superposition state with the opposite OAM mode has twice the RDS value of the single-mode vortex beam, we can obtain
f = l Ω π 1 s i n 2 θ s i n 2 γ 1 c o s 2 θ s i n 2 γ
f m a x = l Ω π cos γ
f m i n = l Ω cos γ π
f c = f m a x · f m i n = l Ω π
As evident from the above derivation, under a fixed tilt angle γ , f is dependent on the polar angle θ . Therefore, after performing a Fourier transform on the scattered light signal and by reading the maximum and minimum frequency peaks from the spectrum and applying Equation (19) to calculate the center frequency, we can determine the rotational velocity of the object. Compared with directly reading the peak frequency of the highest amplitude, this method can effectively reduce the relative velocity measurement error.

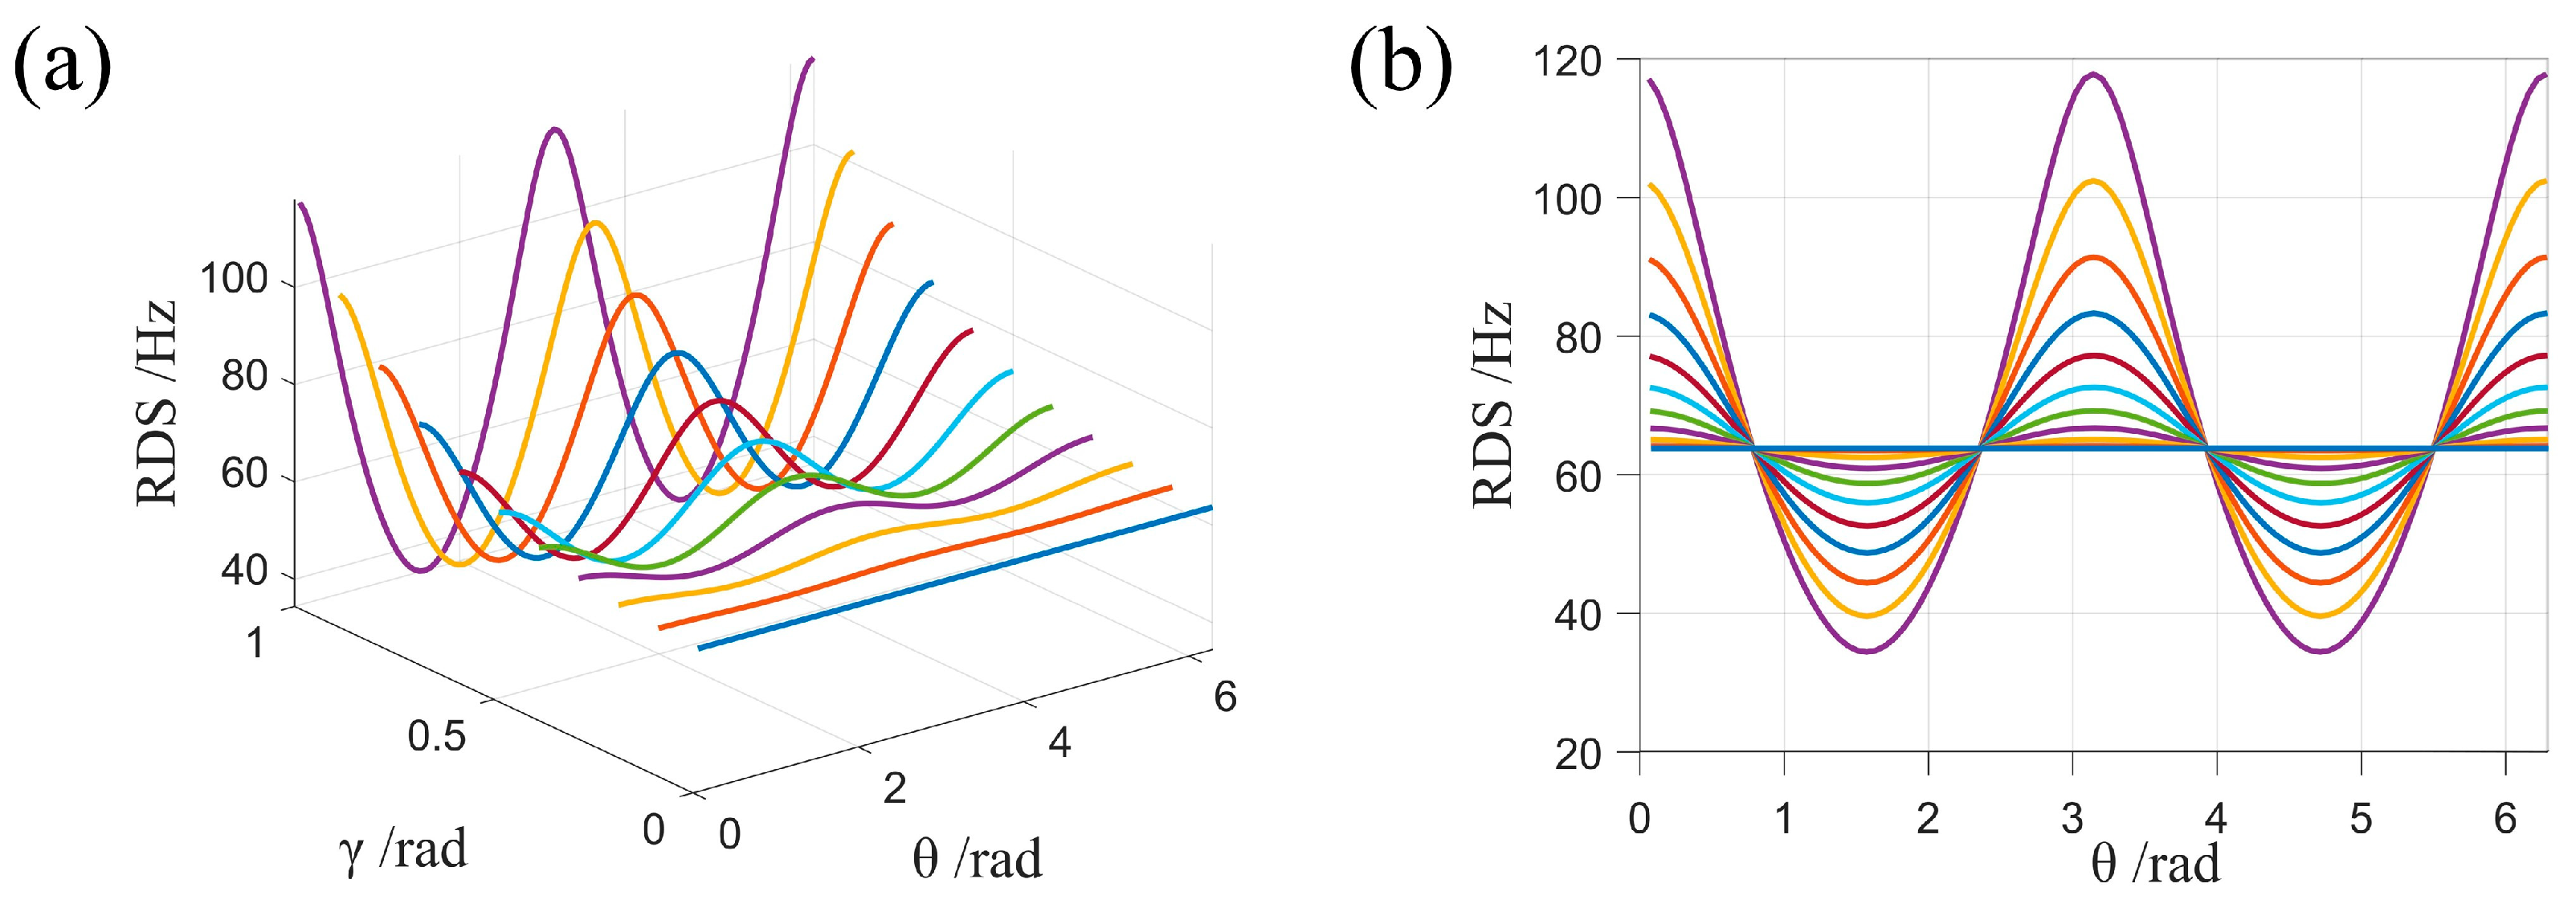
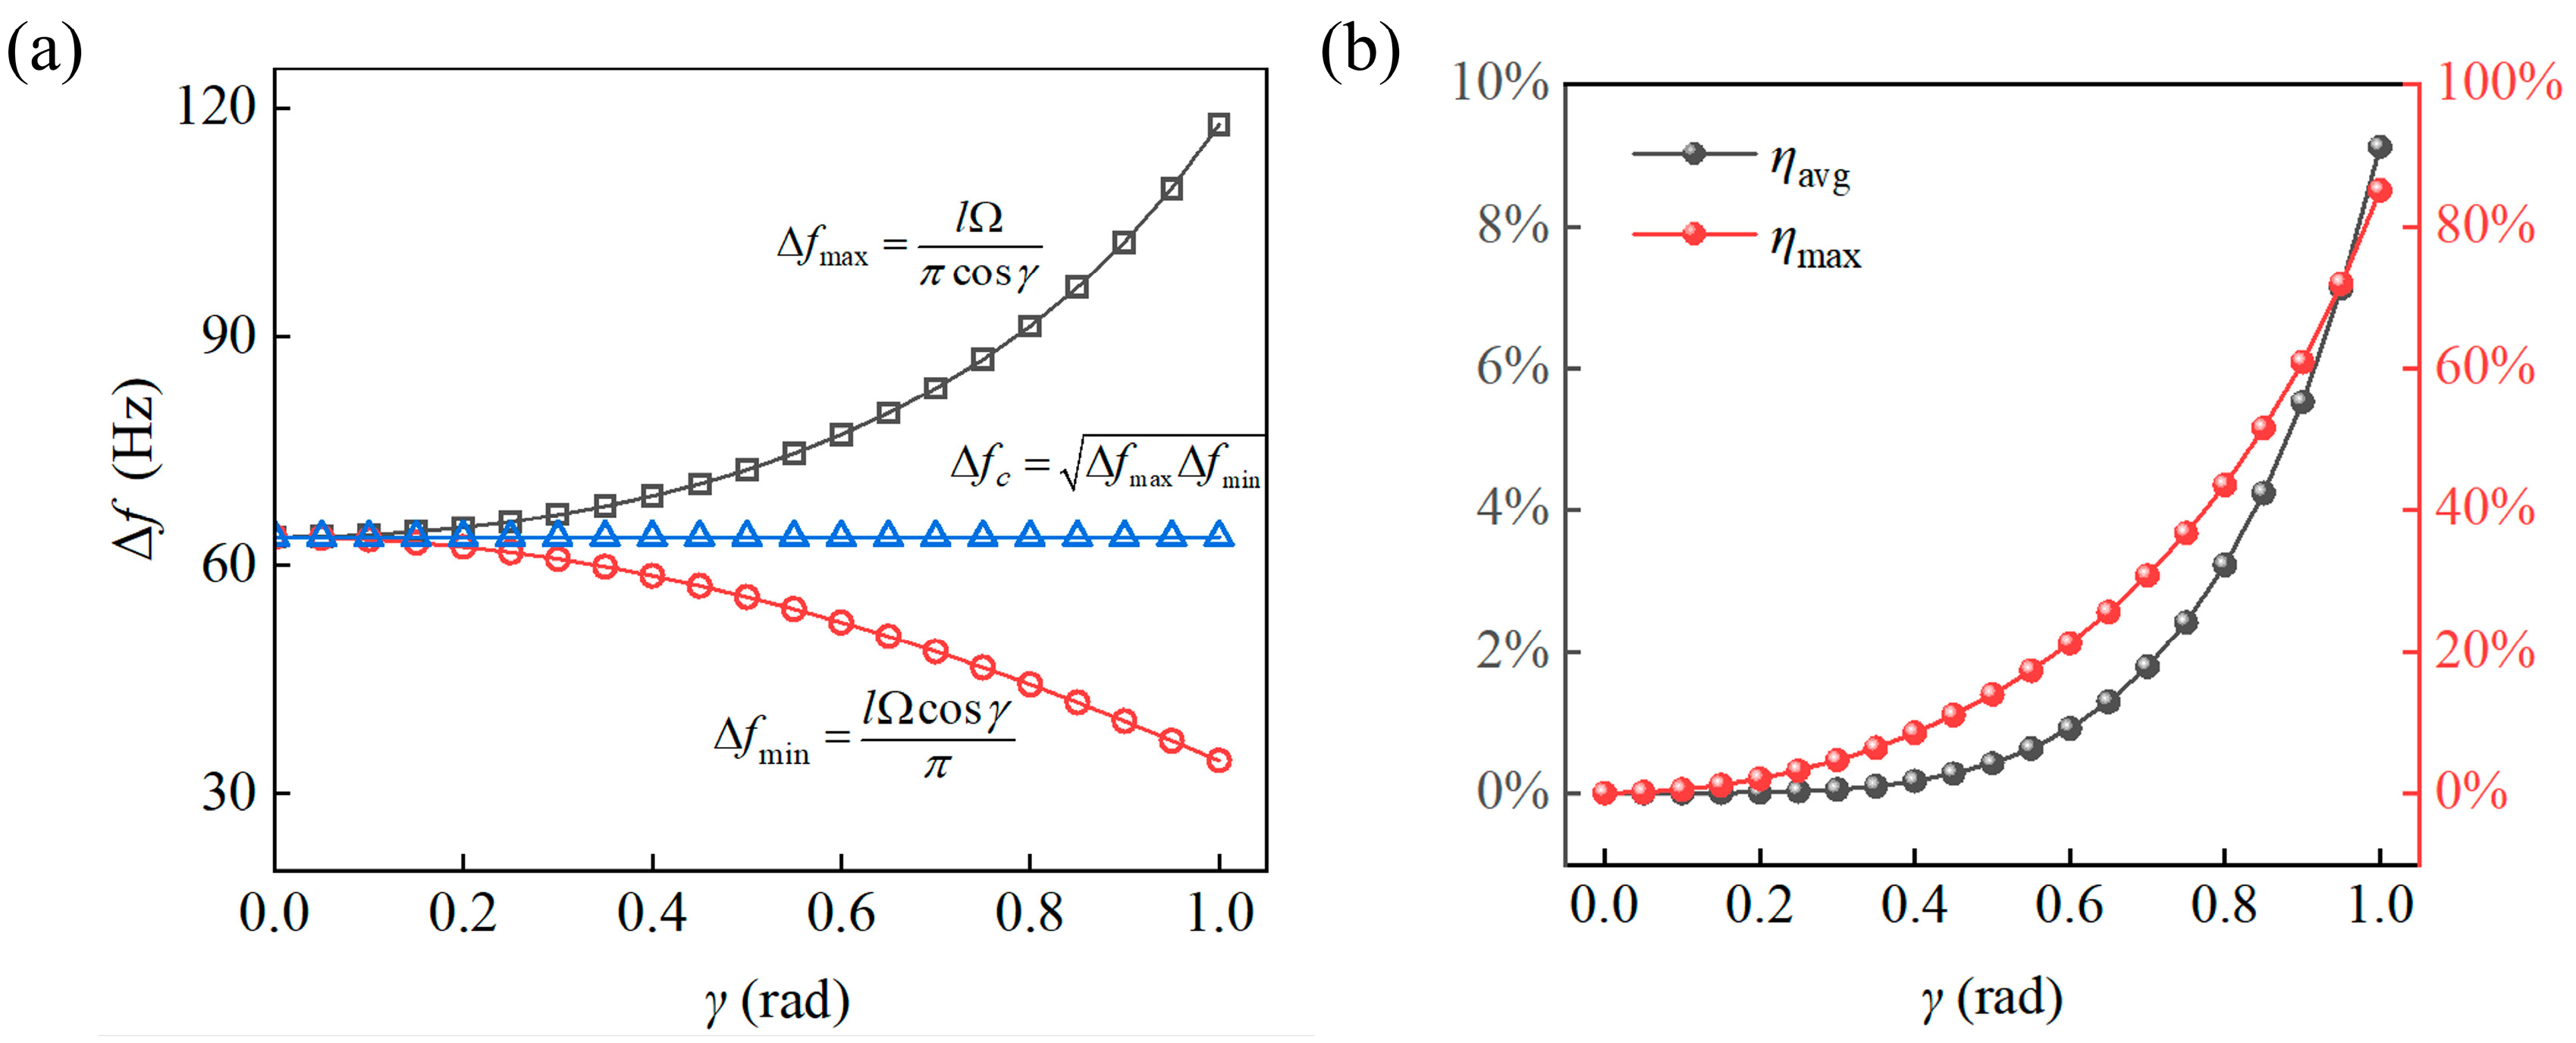
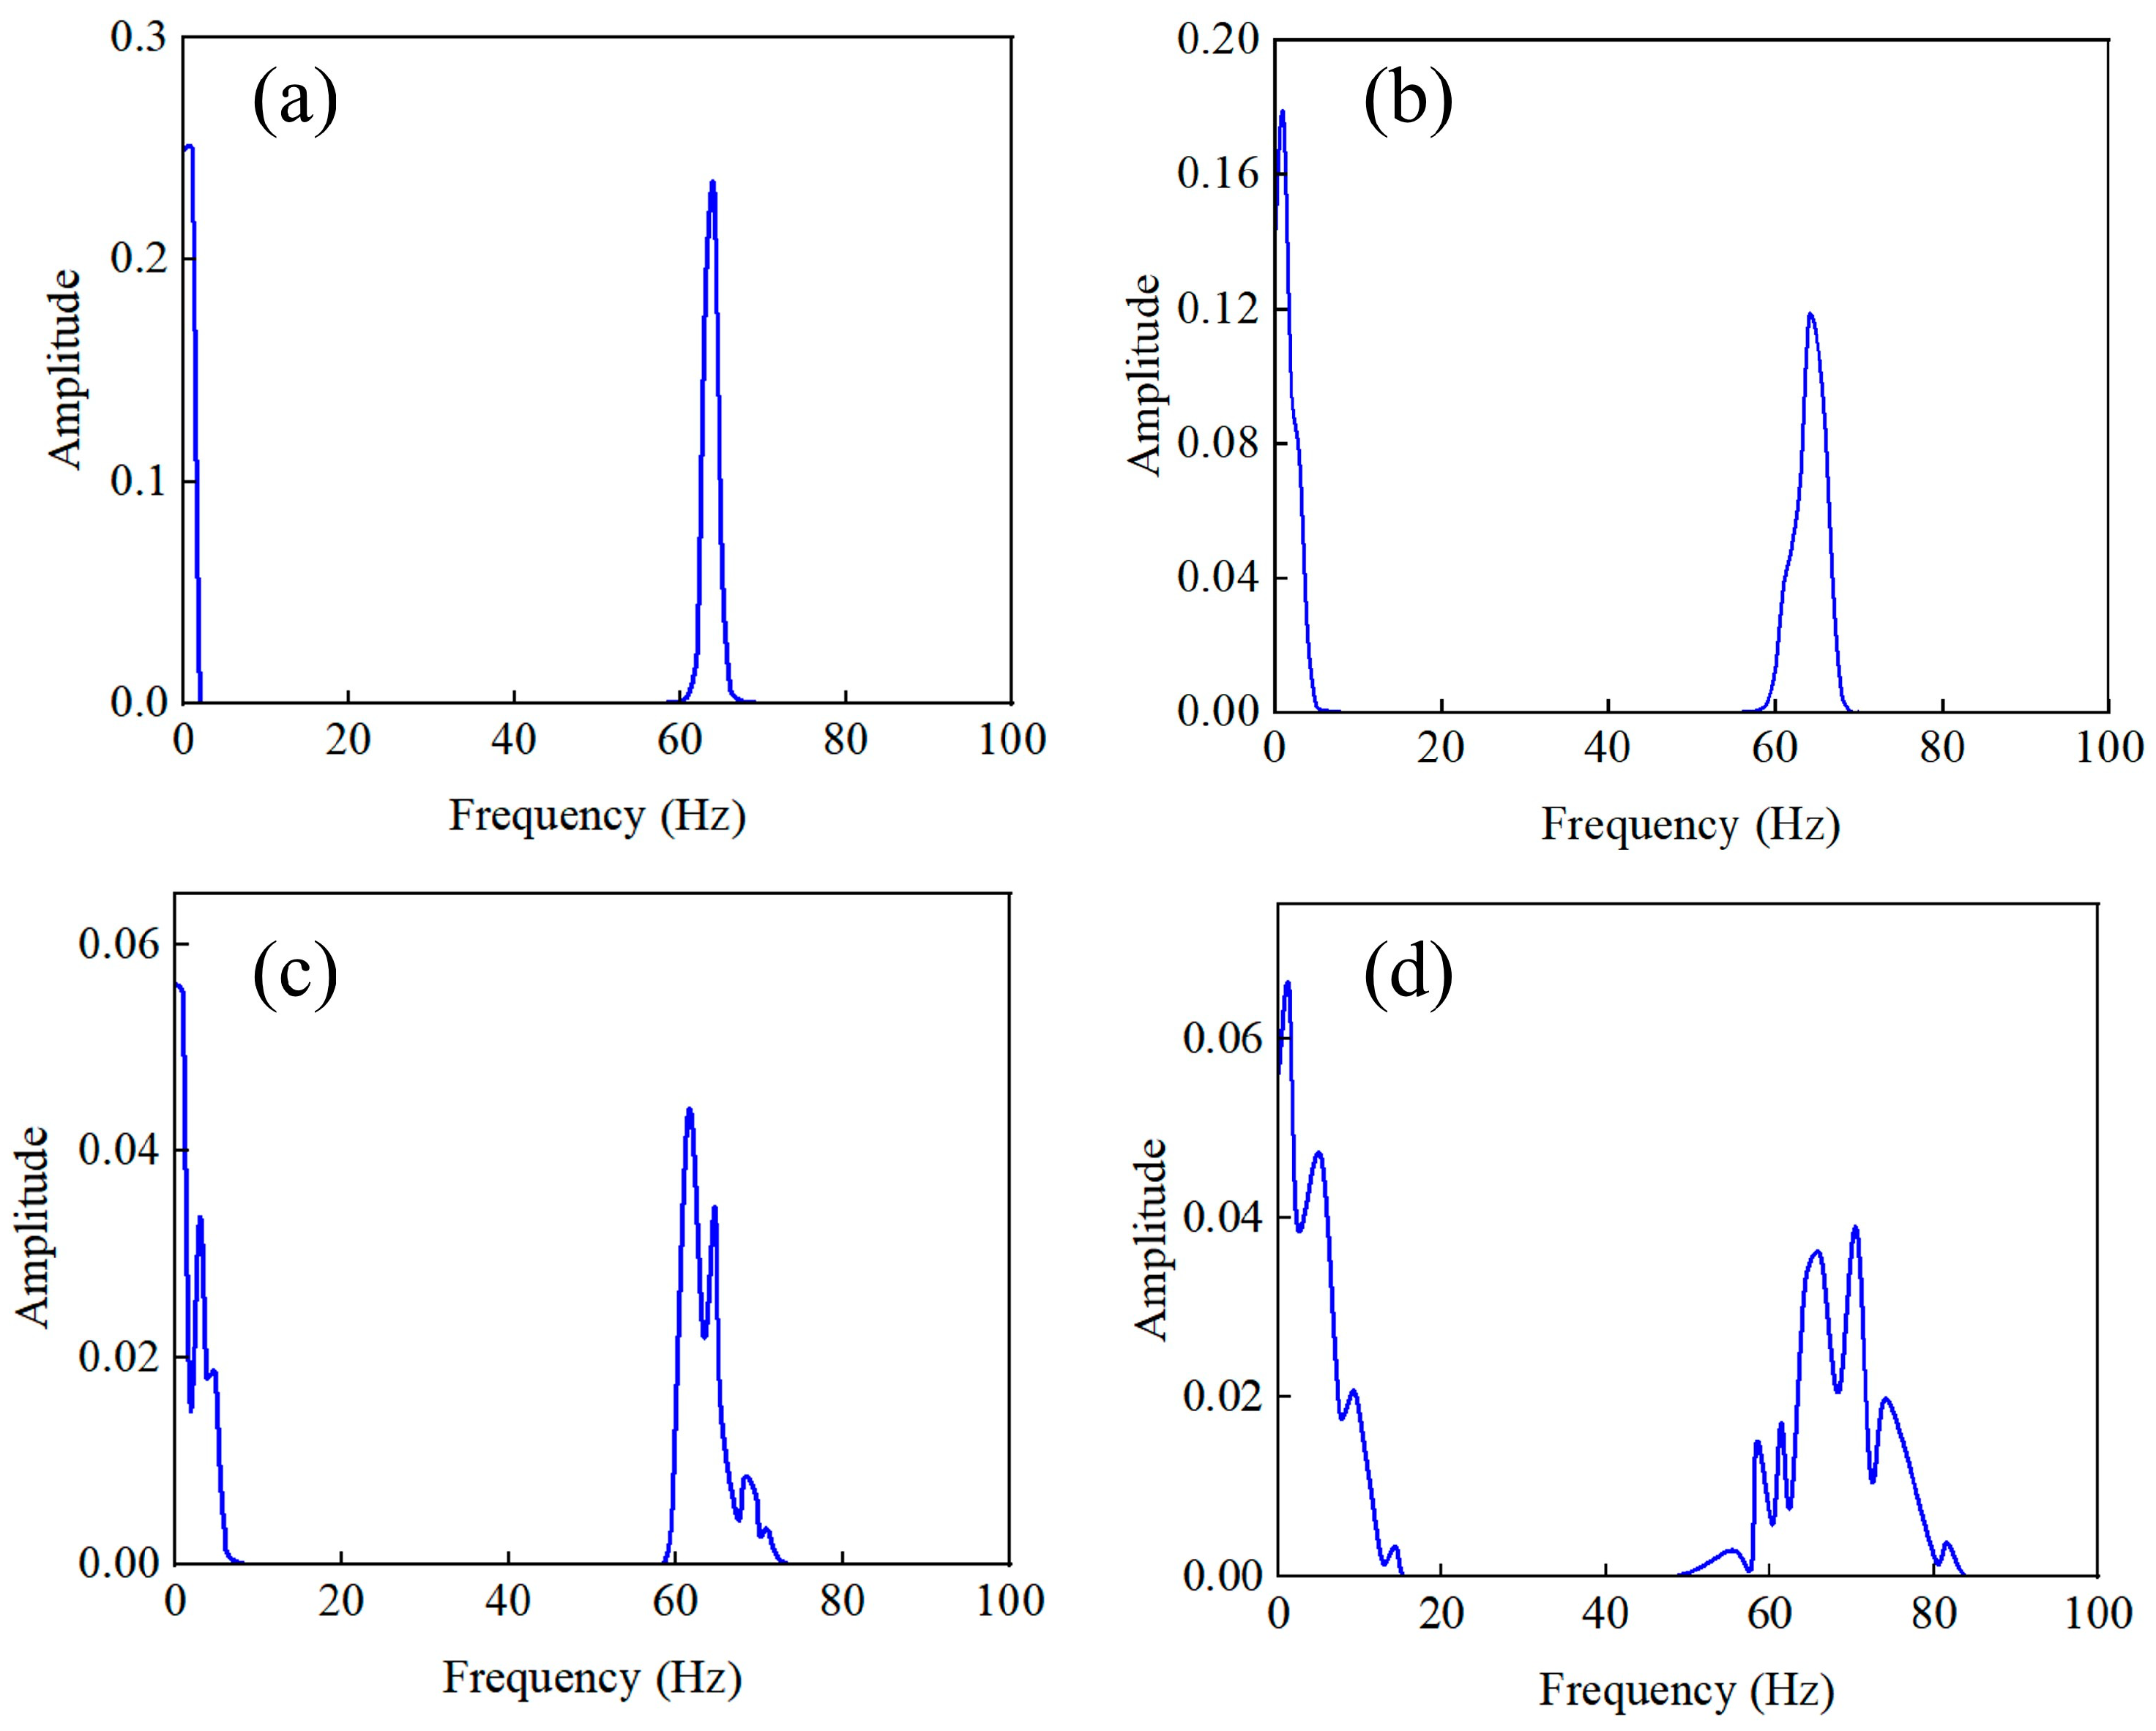
3. Results and Discussion

According to Equation (16), Figure 2a illustrates a three-dimensional curve graph depicting the RDS values at different tilt angles and polar coordinate positions. The simulation parameters are set to l = ±10 and Ω = 20 rad/s. Initially characterized by a single correct frequency shift value, it transforms into a varying value with the polar coordinate position, losing partial accurate spectral information. As the tilt angle increases, the range of extreme values also increases. Thus, when the vortex beam is incident on a tilted object, the spectrum broadens, the energy of the RDS peak disperses to the surrounding peaks, the amplitude of the RDS peak reduces, and the increased tilt angle interferes with the identification of the true RDS peak. When the tilt angle is fixed, the spectral curve follows a trend similar to the cosine function as the polar angle changes, as shown in Figure 2b. Figure 3a shows the curves depicting the maxima and minima with respect to the tilt angle. The increase/reduction rate of the extreme value gradually increases, implying that at large tilt angles, an increase in the unit tilt angle results in a larger extreme value deviation. Conversely, the center frequency shift value considering the maximum and minimum extrema based on Equation (19) remains stable.
Compared with the extreme value, the center frequency shift, therefore, has a more stable and lower error RDS, which is worthy of further quantitative analysis. With the increasing tilt angle, the average deviation ηavg and maximum deviation ηmax between the frequency shift values at different tilt angles and the center frequency shift gradually increase, as shown in Figure 3b. The deviation growth rate increases with the increase in the tilt angle. When the tilt angle reaches 1 rad, the frequency shift values fluctuating around the center frequency shift (fc = 63.66 Hz) reach a maximum of 54.16 Hz, representing 85.08% of fc. The average deviation rate over the entire polar angles range is 9.12%.
A simulated spectra example for different tilt angles is shown in Figure 4; tilt angles γ are set as 0, 0.17, 0.34, and 0.50 rad. With increasing tilt angles, the amplitude of the RDS peak gradually decreases. Several frequency peaks caused by the tilt begin to emerge around the RDS peak, and their number increases with larger tilt angles. The energy of the original RDS peak is dispersed into other frequency peaks, and the position of the peak with the maximum amplitude varies. Simply extracting the frequency peak with the maximum amplitude may result in errors compared to the actual values. Moreover, larger tilt angles result in greater deviation. Conversely, the center frequency shift value remains stable and exhibits smaller errors. More detailed simulation results are listed in Table 1. The center frequency shift values ( f c ) are compared with those obtained directly by reading the frequency shift value corresponding to the maximum amplitude from the spectrum ( f t o p ). The real RDS of the non-tilted object f r e a l is 63.69 Hz. The relative errors at γ = 0.34 rad and 0.5 rad are reduced from 4.22% and 9.91% to 1.11% and 4.78%, respectively. Consequently, the relative velocity measurement deviations are reduced by 3.11% and 5.13%, respectively.
Then, the growth trends of the two RDS discrimination methods with increasing tilt angles were compared in detail. As shown in Figure 5a, the relative error δ1 between the maximum amplitude peak and the true value basically shows a linear growth trend with increasing tilt angles, and the modified goodness of fit (modified R2) is 0.985 after fitting, indicating a good degree of fitting. δ2 increases slowly for γ < 0.4 rad, increases evenly until γ = 0.6 rad, and then gradually steadies at about 6.2%, indicating that the center frequency has higher stability and a lower velocity measurement deviation rate at a large tilt angle. Additionally, the frequency difference between the maximum and minimum frequency peaks, or the spectral broadening ΔfSD, increases with the increasing tilt angle in the overall trend. When the relative velocity error is less than 1%, the velocity measurement system can be considered to have a low velocity measurement deviation. The maximum tilt angle with a relative error of 1% increases from 0.221 to 0.287 rad, representing an improvement of 29.9%. Subsequently, the relative RDS error reduction rate δΔ = δ1 − δ2 is analyzed, as shown in Figure 5b. The reduction rate maintains an increasing trend in the range for γ < 0.4 rad and 0.6–0.7 rad. When γ = 0.7 rad, the velocity measurement deviation reduction rate δΔ reaches 5.85%. These detailed quantitative analyses show that the method of calculating the rotational velocity using the center frequency effectively reduces the RDS and velocity measurement deviation of the tilted object.

4. Conclusions

In this study, we employed a velocity decomposition method to analyze the relationship between the spectral extremum and central frequency shift induced by the tilted object. Compared with directly using the frequency peak with the maximum amplitude, employing the central frequency calculation method effectively reduced the deviation rate in the RDS and velocity measurement values from the true value. The frequency shift that fluctuated around the central frequency shift reached 85.08%, with an average deviation rate of 9.12% over the entire polar angle range. Despite this fluctuation, the central frequency shift obtained from the extrema remained stable. The maximum tilt angle with a relative error of 1% increased from 0.221 to 0.287 rad, representing a 29.9% improvement. In contrast to the linear growth trend of the maximum frequency peak method, the central frequency calculation method effectively reduced the RDS deviation rates for larger tilt angles. When the tilt angle γ = 0.7 rad, the reduction rate in velocity measurement deviation reached 5.85%. Our detailed quantitative analysis demonstrates the effectiveness of employing the central frequency calculation method to reduce the RDS and velocity measurement deviation rates for tilted object, providing crucial support for achieving high-precision rotational velocity measurements of tilted object.

Author Contributions

Conceptualization, H.W. and Y.Y.; methodology, H.W. and Y.Y.; software, H.W.; validation, H.W., Y.Y. and Z.Z.; formal analysis, H.W. and Y.Y.; investigation, H.W. and H.L.; resources, H.Y.; data curation, C.C., X.L., H.Y. and H.L.; writing—original draft preparation, H.W.; writing—review and editing, Z.Z. and X.L.; visualization, H.W.; supervision, C.C., R.F. and H.Y.; project administration, Z.Z. and Y.Z.; funding acquisition, Z.Z. and Y.Z. All authors have read and agreed to the published version of the manuscript.

Funding

This work was supported by the National Natural Science Foundation of China (No. 62075049), the Industry-University Research Cooperation Fund of the Eighth Research Institute of China Aerospace Science and Technology Corporation (SAST2022-081), the Joint Guiding Project of the Natural Science Foundation of Heilongjiang Province (No. LH2023A006), and the Fundamental Research Funds for Central Universities (FRFCU5710050722, FRFCU5770500522, FRFCU9803502223, and FRFCU5770600723).

Institutional Review Board Statement

Not applicable.

Informed Consent Statement

Not applicable.

Data Availability Statement

Data underlying the results presented in this paper are not publicly available at this time but may be obtained from the authors upon reasonable request.

Acknowledgments

We thank Yinyin Yan and Zhiyuan Wang for their meaningful suggestions regarding our research.

Conflicts of Interest

The authors declare no conflicts of interest.

References

  1. Allen, L.; Beijersbergen, M.W.; Spreeuw, R.; Woerdman, J. Orbital angular momentum of light and the transformation of Laguerre-Gaussian laser modes. Phys. Rev. A 1992, 45, 8185. [Google Scholar] [CrossRef]
  2. Lavery, M.P.; Speirits, F.C.; Barnett, S.M.; Padgett, M.J. Detection of a spinning object using light’s orbital angular momentum. Science 2013, 341, 537–540. [Google Scholar] [CrossRef] [PubMed]
  3. Fang, L.; Padgett, M.J.; Wang, J. Sharing a common origin between the rotational and linear Doppler effects. Laser Photonics Rev. 2017, 11, 1700183. [Google Scholar] [CrossRef]
  4. Rosales-Guzmán, C.; Hermosa, N.; Belmonte, A.; Torres, J.P. Measuring the translational and rotational velocities of particles in helical motion using structured light. Opt. Express 2014, 22, 16504–16509. [Google Scholar] [CrossRef]
  5. Lavery, M.P.; Barnett, S.M.; Speirits, F.C.; Padgett, M.J. Observation of the rotational Doppler shift of a white-light, orbital-angular-momentum-carrying beam backscattered from a rotating body. Optica 2014, 1, 1–4. [Google Scholar] [CrossRef]
  6. Neo, R.; Leon-Saval, S.; Bland-Hawthorn, J.; Molina-Terriza, G. OAM interferometry: The detection of the rotational Doppler shift. Opt. Express 2017, 25, 21159–21170. [Google Scholar] [CrossRef]
  7. Zhang, Z.; Cen, L.; Zhang, J.; Hu, J.; Wang, F.; Zhao, Y. Rotation velocity detection with orbital angular momentum light spot completely deviated out of the rotation center. Opt. Express 2020, 28, 6859–6867. [Google Scholar] [CrossRef]
  8. Deng, J.; Li, K.F.; Liu, W.; Li, G. Cascaded rotational Doppler effect. Opt. Lett. 2019, 44, 2346–2349. [Google Scholar] [CrossRef] [PubMed]
  9. Qiu, S.; Liu, T.; Ren, Y.; Li, Z.; Wang, C.; Shao, Q. Detection of spinning objects at oblique light incidence using the optical rotational Doppler effect. Opt. Express 2019, 27, 24781–24792. [Google Scholar] [CrossRef]
  10. Zhai, Y.; Fu, S.; Yin, C.; Zhou, H.; Gao, C. Detection of angular acceleration based on optical rotational Doppler effect. Opt. Express 2019, 27, 15518–15527. [Google Scholar] [CrossRef]
  11. Wang, H.; Zhang, Z.; Wang, Q.; Feng, R.; Zhao, Y. Enhanced Measurement of Vortex Beam Rotation Using Polarization-Assisted Particle Swarm Optimization for Phase Retrieval. Photonics 2023, 10, 1293. [Google Scholar] [CrossRef]
  12. Ding, Y.; Liu, T.; Liu, Z.; Qiu, S.; Xu, L.; Ren, Y. Detection of a spinning object with circular procession using an optical vortex beam. Opt. Lett. 2022, 47, 2398–2401. [Google Scholar] [CrossRef] [PubMed]
  13. Qiu, S.; Ding, Y.; Liu, T.; Liu, Z.; Ren, Y. Rotational object detection at noncoaxial light incidence based on the rotational Doppler effect. Opt. Express 2022, 30, 20441–20450. [Google Scholar] [CrossRef] [PubMed]
  14. Zhang, Z.; Zhang, Y.; Wang, F.; Zhao, Y. Measuring the rotational velocity and acceleration based on orbital angular momentum modulation and time–frequency analysis method. Opt. Commun. 2022, 502, 127414. [Google Scholar] [CrossRef]
  15. Zhao, M.; Gao, X.; Xie, M.; Zhai, W.; Xu, W.; Huang, S.; Gu, W. Measurement of the rotational Doppler frequency shift of a spinning object using a radio frequency orbital angular momentum beam. Opt. Lett. 2016, 41, 2549–2552. [Google Scholar] [CrossRef] [PubMed]
  16. Fu, S.; Wang, T.; Zhang, Z.; Zhai, Y.; Gao, C. Non-diffractive Bessel-Gauss beams for the detection of rotating object free of obstructions. Opt. Express 2017, 25, 20098–20108. [Google Scholar] [CrossRef]
  17. Qiu, S.; Ren, Y.; Sha, Q.; Ding, Y.; Wang, C.; Li, Z.; Liu, T. Observation of the rotational Doppler shift of the ring Airy Gaussian vortex beam. Opt. Commun. 2021, 490, 126900. [Google Scholar] [CrossRef]
  18. Rosales-Guzmán, C.; Hermosa, N.; Belmonte, A.; Torres, J.P. Direction-sensitive transverse velocity measurement by phase-modulated structured light beams. Opt. Lett. 2014, 39, 5415–5418. [Google Scholar] [CrossRef] [PubMed]
  19. Li, Z.; Liu, T.; Ren, Y.; Qiu, S.; Wang, C.; Wang, H. Direction-sensitive detection of a spinning object using dual-frequency vortex light. Opt. Express 2021, 29, 7453–7463. [Google Scholar] [CrossRef]
  20. Guo, K.; Lei, S.; Lei, Y.; Zhou, H.; Guo, Z. Research on detecting targets’ accelerations based on vortex electromagnetic wave in non-line-of-sight scenario. IEEE Sens. J. 2023, 23, 4078–4084. [Google Scholar] [CrossRef]
  21. Guo, K.; Lei, S.; Lei, Y.; Zhou, H.-P.; Guo, Z.-Y. Detection accuracy of target accelerations based on vortex electromagnetic wave in keyhole space. Chin. Phys. B 2024, 33, 020603. [Google Scholar] [CrossRef]
  22. Fang, L.; Wan, Z.; Forbes, A.; Wang, J. Vectorial doppler metrology. Nat. Commun. 2021, 12, 4186. [Google Scholar] [CrossRef] [PubMed]
  23. Vasnetsov, M.; Pas’ Ko, V.; Soskin, M. Analysis of orbital angular momentum of a misaligned optical beam. New J. Phys. 2005, 7, 46. [Google Scholar] [CrossRef]
  24. Arlt, J.; Dholakia, K.; Allen, L.; Padgett, M. The production of multiringed Laguerre–Gaussian modes by computer-generated holograms. J. Mod. Opt. 1998, 45, 1231–1237. [Google Scholar] [CrossRef]
  25. Padgett, M.; Allen, L. The Poynting vector in Laguerre-Gaussian laser modes. Opt. Commun. 1995, 121, 36–40. [Google Scholar] [CrossRef]
  26. Belmonte, A.; Torres, J.P. Optical Doppler shift with structured light. Opt. Lett. 2011, 36, 4437–4439. [Google Scholar] [CrossRef]
Figure 1. (a) Side view of a tilted object illuminated by a vortex beam. Two schematic diagrams of the vortex beam at the emission plane and tilted object plane. (b) Velocity decomposition diagram of point N in the object plane coordinate system. (c) Velocity decomposition diagram of point N in the global coordinate system. The vY direction is perpendicular to the X-Z plane.
Photonics 11 00679 g001
Figure 2. (a) Three-dimensional graph of the RDS at varying tilt angles γ and polar angles θ. (b) The graph of the RDS at varying polar angles θ. θ is in the range of [0, 2π].
Photonics 11 00679 g002
Figure 3. (a) Curve of the frequency extremum and center frequency shift varying with the tilt angle. (b) Curve of the average and maximum frequency shift deviation rates ηavg and ηmax varying with the tilt angle.
Photonics 11 00679 g003
Figure 4. Spectrum graph corresponding to tilt angles: γ = (a) 0, (b) 0.17, (c) 0.34, and (d) 0.50 rad.
Photonics 11 00679 g004
Figure 5. (a) Growth curve of δ1, δ2, and extreme value difference (ΔfSD) with increasing tilt angles. The purple dotted line represents a 1% relative error. (b) The RDS or velocity measurement relative error reduction rate δΔ with increasing tilt angles.
Photonics 11 00679 g005
Table 1. Simulation results of frequency shifts at varying tilt angles.
γ f m a x f m i n f t o p δ1 f c δ2
0.176464640.48%640.48%
0.346861614.22%64.401.11%
0.508155709.91%66.744.78%
Note: δ1 and δ2 are the relative errors between f t o p , f c   , and f r e a l , respectively.
Disclaimer/Publisher’s Note: The statements, opinions and data contained in all publications are solely those of the individual author(s) and contributor(s) and not of MDPI and/or the editor(s). MDPI and/or the editor(s) disclaim responsibility for any injury to people or property resulting from any ideas, methods, instructions or products referred to in the content.

