Article

In-Fiber Hybrid Structure Sensor Based on the Vernier Effect for Vector Curvature and Temperature Measurement

1
Chongqing Research Institute, Changchun University of Science and Technology, Chongqing 401135, China
2
College of Opto-Electronic Engineering, Changchun University of Science and Technology, Changchun 130022, China
*
Author to whom correspondence should be addressed.
Photonics 2024, 11(8), 703; https://doi.org/10.3390/photonics11080703
Submission received: 23 June 2024 / Revised: 24 July 2024 / Accepted: 26 July 2024 / Published: 28 July 2024
(This article belongs to the Section Lasers, Light Sources and Sensors)

Abstract

:
A vector curvature and temperature sensor based on an in-fiber hybrid microstructure is proposed and experimentally demonstrated. The proposed scheme enables the dimensions of the Fabry–Perot and Mach–Zehnder hybrid interferometer to be adjusted for the formation of the Vernier effect by simply changing the length of a single optical fiber. The sensor is fabricated using a fiber Bragg grating (FBG), multimode fiber (MMF), and a single-hole dual-core fiber (SHDCF). The sensor exhibits different curvature sensitivities in four vertical directions, enabling two-dimensional curvature sensing. The temperature and curvature sensitivities of the sensor were enhanced to 100 pm/°C and −25.55 nm/m−1, respectively, and the temperature crosstalk was minimal at −3.9 × 10⁻³ m−1/°C. This hybrid microstructure sensor technology can be applied to high-sensitivity two-dimensional vector curvature and temperature detection for structural health monitoring of buildings, bridge engineering, and other related fields.

1. Introduction

The benefits of fiber-optic sensors are their resistance to corrosion, anti-electromagnetic interference, and lightweight and compact size. As a result, much research has been carried out on various curvature and temperature sensors based on fiber Bragg gratings and fiber-optic interferometers [1] to meet the needs of the biomedical, intelligent robotics, aerospace, and structural monitoring industries. FBG sensors [2,3], Fabry–Perot interferometers (FPI) [4], Mach–Zehnder interferometers (MZI) [5], Sagnac interferometers (SI) [6], and Michelson interferometers (MI) [7] are a few examples.
The Vernier effect is an effective way to increase the sensitivity of measurements. Examples of these structures include cascaded MI sensors [8], cascaded fiber rings [9,10], cascaded FPIs [11,12], cascaded MZIs [13], and cascaded Sagnac interferometers [14]. The Vernier microwave frequency comb envelope detection system, which applies the Vernier effect directly to the microwave signals and increases the sensor sensitivity by creating the Vernier effect in the frequency domain, is the basis for the fiber optic sensor that Zuowei Xu et al. [15] suggested. In recent years, there has been a great deal of interest in compact Vernier effect curvature sensors, which have benefited from advances in processing technology. For instance, a compact microstructure vector curvature sensor was constructed by Zhang et al. [16] from a single-mode, triple-core, and double-side-hole fiber. The single-mode fiber and the bias core of the three-core fiber are bonded together using a bias fusion process and then tapped near the fusion point. The core of the dual side-hole fiber and the two biased cores of the triple-core fiber form two parallel MIs, respectively, which create the Vernier effect. The structure of the consecutive MIs exhibits an opposite sensitivity to curvature, resulting in an amplification factor of curvature sensitivity that is twice that of the conventional Vernier effect. AI Zhou et al. [17] proposed and validated a sensor based on two Fabry–Perot interferometers, which enables simultaneous temperature and vector curvature measurement. The sensor comprises a bias-core optical fiber and a double side-hole optical fiber. The bias-core and double side-hole fibers were connected sequentially to form two cascaded Fabry–Perot interferometers (FPIs), producing the Vernier effect. The maximum curvature sensitivity was −88.15 pm/m−1, while the maximum temperature sensitivity was 57.2 pm/°C. However, the fabrication process of existing compact vector curvature sensors generally requires treatments such as fusion splicing of bias cores and pulling cones. It is challenging to fabricate them because it is necessary to control the dimensions of multiple segments of optical fibers.
In this study, a vector curvature and temperature sensor based on an in-fiber hybrid microstructure is proposed and experimentally demonstrated. The proposed scheme enables the dimensions of the Fabry–Perot and Mach–Zehnder hybrid interferometer to be adjusted for the formation of the Vernier effect by simply changing the length of a single optical fiber. The sensor is fabricated using a fiber Bragg grating (FBG), multimode fiber (MMF), and a single-hole dual-core fiber (SHDCF). The sensor exhibits different curvature sensitivities in four vertical directions, enabling two-dimensional curvature sensing. The temperature and curvature sensitivities of the sensor were enhanced to 100 pm/°C and −25.55 nm/m−1, respectively, and the temperature crosstalk was minimal at −3.9 × 10⁻³ m−1/°C. This hybrid microstructure sensor technology can be applied to high-sensitivity two-dimensional vector curvature and temperature detection for structural health monitoring of buildings, bridge engineering, and more.

2. Fabrication and Operating Principle

2.1. Sensor Fabrication

The fiber used in this work is a silica fiber with a diameter of 125 μm. It is a single-hole dual-core fiber (SHDCF) with a circular air hole and two arranged fiber cores. The cross-section of the fiber is shown in Figure 1b. The SHDCF has an internal air hole diameter of 40.6 μm, and both cores are 8 μm in diameter. The Multimode fiber (MMF) has a core diameter of 105 μm and a cladding diameter of 125 μm and it is manufactured by Wuhan Yangzi Optoelectronics Technology Co. (Wuhan, Hubei Province, China). Zhixing Technology Nantong Co. (Nantong, Jiangsu Province, China). provides the fiber Bragg grating (FBG) used in this paper. The length of the fiber Bragg grating is 10 mm, the central resonance wavelength is 1550 nm, the 3 dB bandwidth is 0.11 nm, and the peak reflectance reaches 12 dB. In the sensor manufacturing process, a 300 μm multimode fiber and a 750 μm single-mode dual-core fiber are sequentially fused at one end of the FBG. The second step fuses the single-mode fiber and a 300 μm multimode fiber. Finally, the multimode fiber is fused to the other end of the single-hole dual-core fiber to complete the sensor probe. Simply put, FBG-PAHM is the structure of parallel asymmetric hybrid microcavity cascading an FBG within a fiber.

2.2. Operating Principle

The interferometric envelope spectrum of the sensor is formed by the hybrid superposition of the Fabry–Perot interferometer (FPI) and the Mach–Zehnder interferometer (MZI). The FPI is the FP cavity formed by the air cavity of the multimode fiber and the SHDCF, as illustrated by the red arrows in Figure 1a. The MMF1/air cavity interface forms the initial reflective surface at M1, while the MMF2/air cavity interface forms the second reflective surface at M2. The formation of the FPI is initiated when a portion of the detected light exits the multimode fiber and enters the air cavity. The yellow arrow in Figure 1a indicates the MZI, whereby part of the light enters the cladding and core of the SHDCF for dual path transmission, thus forming the MZI. These two microstructures are parallel to each other, thus forming a parallel FPI/MZI structure.
According to the interference theory, the resonance wavelength of FPI and MZI can be expressed as follows:
λ F P I = 4 n 1 L 2 a + 1
λ M Z I = 2 n 2 L 2 b + 1
where n1 is the effective refractive indices of the air hole, n2 is the effective refractive indices of the cladding and the core of the SHDCF, a is the FPI resonance order, and b is the MZI resonance order. L is the length of the SHDCF. λ is the operating wavelength. The FSRs of FPI and MZI are as follows:
F S R F P I = λ 2 2 n 1 L
F S R M Z I = λ 2 2 n 2 L
To satisfy the conditions that produce the Vernier effect, we designed FSRFPI to be close to, but not equal to, FSRMZI. The envelope formula for the FSRE is as follows [18]:
F S R E = F S R F P I F S R M Z I | F S R F P I F S R M Z I |
The magnification factor is as follows:
M M Z I ( F P I ) = F S R M Z I ( F P I ) | F S R F P I F S R M Z I |
Temperature has a negligible effect on the refractive index of the air, so the Mach-Zehnder interference effect plays a vital role in the temperature sensitivity of the hybrid structure. The temperature sensitivity of the structure can be expressed as follows [19]:
S T = M M Z I S M Z I = M M Z I 2 b ( n 2 T L + L T n 2 ) = M M Z I λ b ( n 2 T 1 n 2 + L T 1 L ) = M M Z I λ b ( k + ξ )
where k and ξ are constants expressed as thermo-optic and expansion coefficients, respectively. This structure is made of pure silicon dioxide with a small coefficient of thermal expansion; therefore, the temperature sensitivity of this sensor is mainly related to the thermo-optic effect, and Equation (7) is rewritten to regain the temperature sensitivity equation:
S T = M M Z I λ b n 2 T 1 n 2 = M M Z I λ b k
Air cavity deformation and elastic-optical effects affect the interference spectrum during curvature sensing. The elastic-optical effect is weak within a slight curvature variation, and the curvature sensing sensitivity is mainly related to the FPI involved in the air cavity deformation. Therefore, the wavelength of the interference drift caused by the change in the FPI cavity length can be derived as follows [20]:
Δ λ E = M F P I Δ λ F P I = M F P I Δ L L λ a = M F P I h C λ a
where ΔL is the change in length of the FPI chamber before and after bending, h is the distance between the center of the FP cavity and the bottom of the fiber, and C is the curvature value to be measured. The FP cavity in this structured sensor is located at a non-centrosymmetric position on the cross-section with different values of h in different bending directions, thus having different sensitivities in the curvature sensing. In addition, the blue or red shift of the interference spectrum depends on the bending direction. When the sensor is bent in the 180° and 270° directions, ΔL is less than 0, so Δ λ a and C are negatively proportional, and the interference spectrum is shifted towards the short wavelength. Conversely, Δ λ a and C are proportional in the 0° and 90° directions, and the interference pattern is correspondingly shifted in the long-wavelength direction.
When transmitted light passes through an FBG, some of its energy is reflected. The Bragg resonance wavelength can be written as follows:
λ F B G = 2 n n e f f F B G Λ
where n n e f f F B G is the effective refractive index of the mode propagating in the FBG region, and Λ is the grating period. The resonant wavelength of the FBG shifts as the temperature increases or the grating curvature changes [21,22].

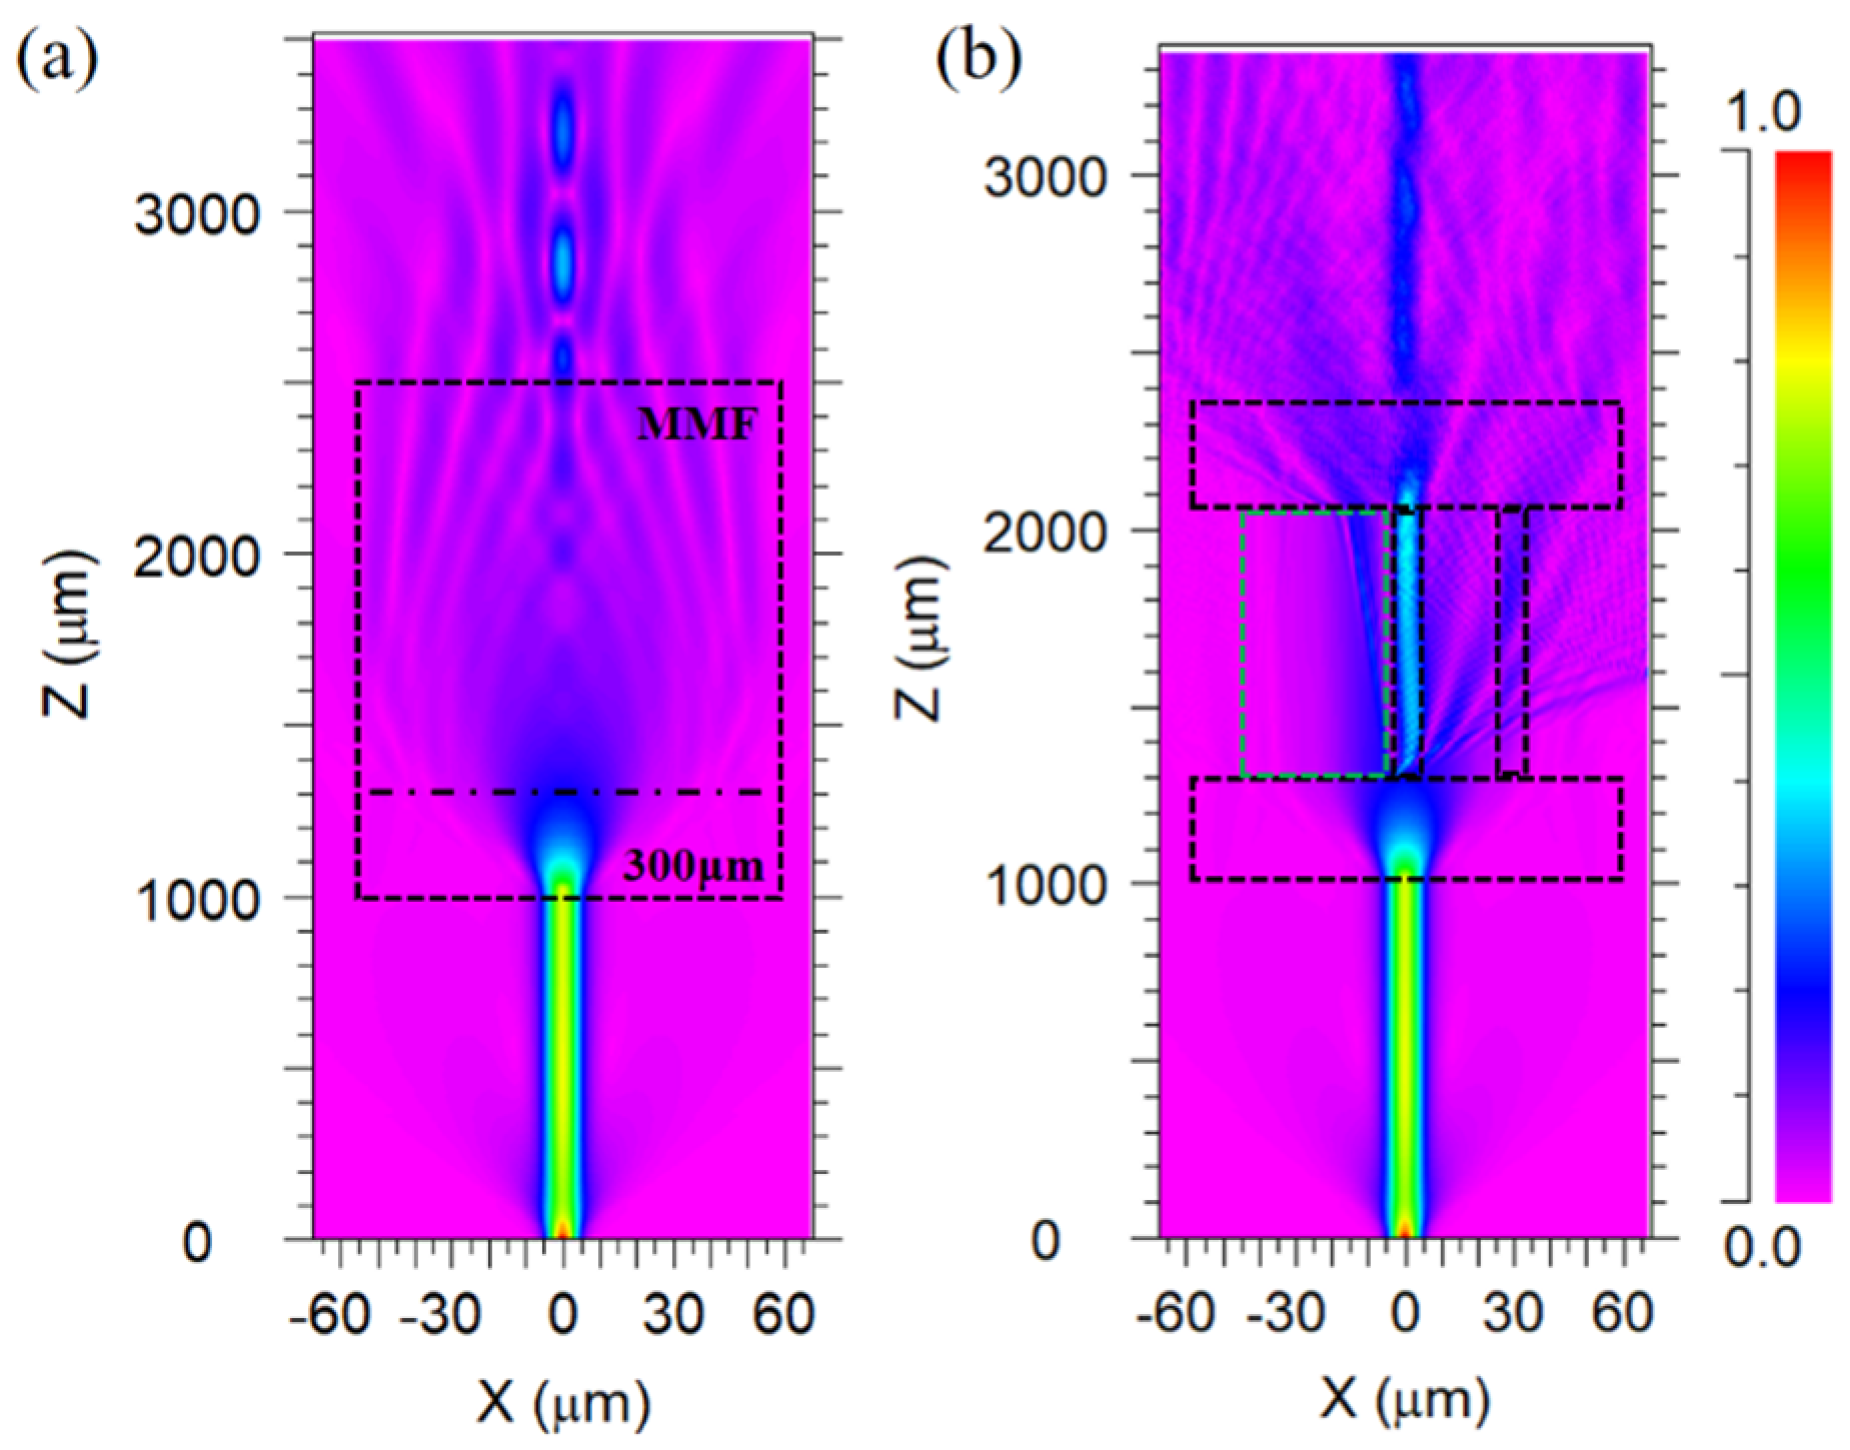
2.3. Simulation and Spectral Analysis

The Beam Propagation Method (BPM) was used to model the multimode fiber and sensor beam transmission characteristics to investigate the beam transmission in the sensing structure, as shown in Figure 2a,b. The multimode optical fiber in the sensor mainly plays the role of a beam expander and beam combiner. Too short a length is not conducive to the beam spreading and combining effect, while too long will affect the interference spectrum in the hybrid microcavity. The RSOFT simulation shows that when the multimode fiber is 300 μm, the beam spreading and combining effects are more satisfactory, and we set the length of the multimode fiber to 300 μm in the sensor design. As a result, there is no need to set up a reference unit outside the test region, unlike many cascade structure sensors based on the Vernier effect [23]. This makes it easier to miniaturize the sensing structure and allows us to tune the sensor properties by changing only one length.
To investigate the effect of different SHDCFs on the transmission spectra of the sensors, we kept the length of the multimode optical fibers unchanged. We fabricated the sensors with SHDCF with lengths of 500 μm, 700 μm, 750 μm, and 850 μm, respectively, and the transmission spectra are shown in Figure 3a. From Figure 3a, we can see that we obtain a better superposition interference spectrum at the length of 750 μm of the SHDCF, which creates the Vernier effect. Figure 3b shows the FFT-transformed spatial frequency spectrum corresponding to the interference spectrum of Figure 3a. It can be seen that a better Vernier effect is formed when the interference between the FPI and the MZI plays a dominant role. The following work is based on parallel FPI/MZI cavities of 750 μm length. When using the Vernier effect sensor for two-parameter detection, the sensitivities of different interference envelopes are closer, which can cause errors in the demodulation process. Therefore, we cascade an FBG with the Bragg resonance wavelength around 1550 nm on top of the parallel hybrid cavity for two-parameter vector curvature and temperature detection. The transmission spectra of the fabricated composite structure sensor at 0° angle and 0 m−1 curvature are shown in Figure 4. Measuring the temperature and curvature requires two observation points, dip1 and dip2. Dip1 denotes the interference envelope’s trough, and dip2 is the Bragg resonance wavelength.

3. Results and Analysis

Figure 5 shows a schematic of the experimental setup that uses the Vernier effect to detect curvature. Yokogawa measuring Technologies (Shanghai, China) provided the spectrometer, model AQ6370D, which has a wavelength measuring range of 600–1700 nm. It has a power range of −90 dBm to 20 dBm and a spectral resolution of 0.02 nm. The broadband light source (YSL, SC-5-FC) can operate in the wavelength range 480–2200 nm with a total output power of 800 mW. The optical fiber is attached to the bracket by two rotating clamps. The rotational angle scale of both rotators enables the sensor to detect various four-directional curvatures. The sensing probe is affixed to the center of a steel straight edge, and a push-pull gauge is employed to induce a minor displacement in the vertical direction of the steel straight edge, which subsequently alters the curvature of the sensor. One branch is connected to a broadband light source, while the other is connected to a spectrometer. The resulting transmission spectrum data were observed on the spectrometer. The curvature can be obtained from the following formula:
C = 2 d ( d 2 + s 2 )
where d is the downward distance from the end of the sensor, and s is half the distance between the fixtures at each end of the metal sheet. In the bending tests, the distance between the two fixtures was 74 mm, and the micrometer screw was moved 0.1 mm at a time to increase the curvature from 0 m−1 to 0.865 m−1.

3.1. Curvature Sensing Experiment

The curved response spectra of FBG-PAHM at 0°, 90°, 180°, and 270° (0 m−1–0.865 m−1 curvature change range) are shown in Figure 6. The wavelength shifts of the interference envelopes are different for the different directions of change of the angle of curvature. As the curvature increases, the interferometric envelope produces a red shift in the 0° and 90° direction. The interference envelope produces a blue shift in the 180° and 270° direction as the curvature increases. At the end of each angle of the curvature test, the sensor was reattached after both sides of the fixture had been rotated clockwise at 90° simultaneously to stabilize it. The design of a parallel asymmetric hybrid cavity allows for generating different sensitivity cases for different angular curvature tests. As the FP is positioned further away from the fiber center plane, the curvature sensitivity increases, as demonstrated by the results obtained at 0° and 180°. Conversely, the sensitivity diminishes as the FP cavity approaches the fiber center plane, for instance, at 90° and 270°. This phenomenon is consistent with theoretical analyses of the sensor structure and with the literature [17]. Both the wavelength drift direction and the sensitivity effectively discriminate the curve direction. The curvature sensitivity of the sensor in the four vertical directions was found to be 0°: 20.23 nm/m−1, 90°: 10.87 nm/m−1, 180°: −25.55 nm/m−1, and 270°: −6.425 nm/m−1 in Figure 7a. The experimental results demonstrate that the FBG-PAHM structure exhibits enhanced capability for measuring vector curvature. The FBG is situated on the central axis of the sensor, thereby ensuring that the sensitivity for detecting curvature at different angles remains unaltered. Figure 7b illustrates the fitted line of wavelength shift versus curvature change of the FBG, with the curvature change sensitivity of the FBG being 0.24 nm/m−1.
Five consecutive repeatability tests were performed at different angles where the curvature gradually increased from 0 m−1 to 0.865 m−1. Figure 8a shows the repeatability of the sensor’s curvature monitoring at various orientations. The results show that while the repeatability of curvature monitoring varies in different directions with a narrow range of variation, the repeatability of curvature monitoring is approximately constant. The color bars in Figure 8a show the standard deviations of the measured points of the envelope interference trough for different amounts of curvature, and the most significant standard deviation (SD) is less than 0.17 nm/m−1. This indicates that the sensor’s curvature detection method has a high degree of repeatability, which meets the requirements of many curvature monitoring applications.
Figure 8b shows the stability test spectra of the FBG-PAHM structure. Eight sets of recordings were made, with the spectra recorded and scanned every thirty minutes, to accurately track the offsets for the wavelength domain light intensity fluctuations. A maximum wavelength shift of less than 6 pm and an integrated light intensity fluctuation value of less than 1 dB demonstrate the instrument’s improved stability performance. This consistent stability improves the application situations of the curvature testing experiment for long-term structural health monitoring.

3.2. Temperature Sensing Experiment

The hybrid structure sensor was immersed in a temperature-controlled water bath, and the temperature was increased from 33 °C to 113 °C at 10 °C intervals to test its temperature sensing capability. The reflectance spectra of the fiber Bragg grating and hybrid microstructure were red-shifted with increasing temperature in Figure 9. The Vernier effect formed an envelope with a temperature sensitivity of 100 pm/°C. The reflectance spectra also showed that the resonant wavelength of the FBG had a temperature sensitivity of 13 pm/°C. The linear fit for dip1 and dip2 were 0.999 and 0.992, respectively, as shown in Figure 10. Conversely, this sensor’s curvature and temperature crosstalk are relatively low at −3.9 × 10⁻³ m−1/°C. This phenomenon can be attributed to two main reasons. One reason for this is that the temperature weakens the change of the effective refractive index of the air cavity during the temperature sensing process. The temperature response of the sensor is mainly due to the thermo-optic effect, which changes the effective refractive index of the fiber core and cladding in the MZI. Additionally, during curvature sensing, the deformation of the air cavity and the fiber core is considerable, and the interference wave valley produces a significant translation due to the elastic-optical effect. The response of the interferometric troughs to temperature and curvature sensing has been found to vary significantly. Consequently, a lower temperature crosstalk is formed. Simultaneously, temperature and curvature monitoring can be achieved using the sensor’s curvature sensitivity.

3.3. Simultaneous Measurement of Curvature and Temperature

It can be demonstrated that the spectra of the hybrid structure exhibit a linear response to changes in curvature or temperature, respectively. This implies that the spectra will also change linearly if the curvature and temperature change simultaneously. The analysis above employed the dip1 and dip2 points as curvature and temperature detection points, respectively. Consequently, the sensitivities of the two detection points can be combined to yield a matrix equation, as illustrated in the subsequent equation:
[ Δ λ 1 Δ λ 2 ] = [ W C 1 W T 1 W C 2 W T 2 ] [ Δ C Δ T ]
where W T 1 , W T 2 , W C 1 and W C 2 are the sensitivities of temperature and curvature to dip1 and dip2, and ∆λ1 and ∆λ2 are the values of wavelength drift at the two monitoring points. ∆C and ∆T are the variation values of curvature and temperature, respectively. Equation (12) can be converted into a computational expression as follows:
{ Δ λ 1 = W T 1 Δ T + W C 1 Δ C Δ λ 2 = W T 2 Δ T + W C 2 Δ C
The tests above demonstrate that the structure can monitor curvature in four directions. The angles in question are 0°, 90°, 180° and 270°. In this instance, we will consider the 0° curvature change as a case study for the simultaneous analysis of curvature and temperature sensing. In the case of a 0° curvature change, the sensitivities of dip1 and dip2 to curvature and temperature are known to be 100 pm/°C, 20.23 nm/m−1, and 13 pm/°C, 240 pm/m−1, respectively. The coefficients above can be employed to rectify Equation (13), thereby yielding the following expression:
{ Δ T = 89.65 Δ λ 2 1.005 Δ λ 1 Δ C = 0.0544 Δ λ 1 0.4184 Δ λ 2
Equation (14) was utilized in the test to examine the sensing data and derive specific values for the curvature and temperature parameter sensing processes. The method can also be employed to simultaneously sense curvature and temperature for other angles.
We measured four sets of transmission spectra of the sensor under different conditions: Q1 [C = 0°:0.108 m−1, T = 43 °C], Q2 [C = 0°:0.216 m−1, T = 53 °C], Q3 [C = 0°:0.324 m−1, T = 63 °C] and Q4 [C = 0°:0.433 m−1, T = 73 °C]. The transmission spectra of the sensors were measured at a temperature of 33 °C with 0 m−1 as the reference group. By comparing the four sets of spectra with the reference group, the wavelength shifts for the different cases can be derived. The derived values are shown in Table 1 and Table 2. The sensor’s measurement errors manifest as differences between the measured and actual values. The lack of accuracy of the curvature shift is one of the reasons for this, in addition to the resolution limitations of the spectra, which also lead to test results and affect the accuracy of the data demodulation. In the following work, the sensor’s sensitivity can be further improved to solve this problem.

3.4. Comparison with Other Sensors

In this experiment, we use a single-hole dual-core optical fiber to construct a non-centrosymmetric optical fiber microstructure, which achieves higher curvature sensitivity detection in four vertical directions with low temperature crosstalk. The performance comparison of this sensor with existing sensors is shown in Table 3. The curvature sensors constructed with single optical Bragg grating or special optical fibers have low sensitivity, can only achieve one-dimensional curvature sensing, and have considerable temperature crosstalk [24,25,26,27]. Special processing, over fusion and polishing of optical fibers can improve the sensor’s sensitivity, but these methods are difficult to process and have poor repeatability. Moreover, sensors relying on these methods can only achieve unidirectional curvature sensing [28,29]. Two-dimensional curvature sensing has been accomplished in the literature [30] by employing a femtosecond laser in a single-mode fiber cladding with variable area sizes of refractive index modification. The significant disparity in curvature sensitivity in different directions makes multi-angle curvature sensing impractical, and this approach necessitates sophisticated and costly processing equipment. The authors of [17] constructed a Vernier effect to improve curvature sensitivity by cascading biased core fiber and double-edged hole fibers. Still, the sensitivity difference in different directions of this structured sensor is obvious, and it cannot achieve two-dimensional curvature sensing, and the temperature crosstalk is large. Compared with other structural sensors, the sensor proposed in this paper has the advantages of simple fabrication, compact structure, higher curvature sensitivity, and low-temperature crosstalk, and it can achieve two-dimensional vector curvature detection in four directions. The maximum sensitivity in one direction is −25.55 nm/m−1.

3.5. Discussion

The experimental results show that the curvature sensor based on single-hole dual-core optical fiber composite interference has lower temperature crosstalk, more compact size, and higher curvature sensitivity in all four vertical monitoring directions than the traditional structural curvature sensor. Conventional curvature sensors are usually made by fusion bonding, polishing, and cone pulling, which have poor structural robustness, are challenging to process, and are not easy to cascade other optical devices to build a Vernier effect. On the other hand, due to the single interference structure of traditional curvature sensors, it is not easy to improve the curvature sensitivity while maintaining a low-temperature crosstalk during the sensing process. In contrast, the curvature sensor proposed in this paper avoids the complex fabrication process. By constructing parallel FPI and MZI composite interferences within the optical fiber, the size of the sensor structure is further reduced, providing a new method to build a curvature and temperature sensor with a Vernier effect. During the measurement process, a two-dimensional curvature sensing with low crosstalk and high sensitivity is achieved by taking advantage of the different responsiveness of the microstructures to curvature and temperature. In practical application scenarios, such as structural health monitoring of buildings and bridges, curvature sensors’ sensitivity and low crosstalk characteristics are highly required. In addition, the location of potential hazards and the direction of deformation where safety occurs in buildings, bridges, and other structures have uncertainties and must be monitored from multiple angles. Therefore, the two-dimensional curvature sensor proposed in this paper has a specific potential for application in structural health monitoring.

4. Conclusions

In summary, we present an experimental demonstration of a vector curvature and temperature sensor based on a hybrid microstructure inside an optical fiber. The proposed scheme enables the dimensions of the Fabry–Perot and Mach–Zehnder hybrid interferometer to be adjusted for the formation of the Vernier effect by simply changing the length of a single optical fiber. The sensor was fabricated using a fiber Bragg grating (FBG), multimode fiber (MMF), and a single-hole dual-core fiber (SHDCF). The sensor has different sensitivities in four vertical directions, thus enabling two-dimensional curvature sensing. The temperature and curvature sensitivities of the sensors were improved to 100 pm/°C and −25.55 nm/m−1, respectively, with a low-temperature crosstalk of −3.9 × 10⁻³ m−1/°C. Cascading the FBG reduces the detection error due to the similarity of the sensitivities of the envelope interference slots. Hybrid microstructures that produce the Vernier effect are used as sensing cells in the sensing region. These sensors offer adaptable and flexible production processes with very compact sensing structures. This hybrid microstructure sensor technology can be applied to high-sensitivity two-dimensional vector curvature and temperature detection for structural health monitoring of buildings, bridge engineering, and more.

Author Contributions

Conceptualization, S.W. and D.L. (Dongmei Liu); methodology, S.W. and T.W.; software, S.W. and B.L.; validation, D.L. (Deqi Li) and S.D.; formal analysis, S.D. and T.Z.; investigation, S.W. and T.Z.; resources, T.W.; data curation, S.D. and B.L.; writing—original draft preparation, S.W.; writing—review and editing, T.W. and B.L.; visualization, D.L. (Deqi Li) and B.L.; supervision, T.W.; project administration, T.W.; funding acquisition, S.D. and B.L. All authors have read and agreed to the published version of the manuscript.

Funding

Natural Science Foundation of Chongqing City (CSTB2022NSCQ-MSX1342), and the Natural Science Foundation of Jilin Province (20220508134RC, 222619JC010598973, YDZJ202201ZYTS418).

Institutional Review Board Statement

Not applicable.

Informed Consent Statement

Not applicable.

Data Availability Statement

All data generated in this study are shown in this manuscript.

Conflicts of Interest

The author declares that he has no known competing financial interests or personal relationships that could have appeared to influence the work reported in this paper.

References

  1. Ran, Z.; He, X.; Rao, Y.; Sun, D.; Qin, X.; Zeng, D.; Chu, W.; Li, X.; Wei, Y. Fiber-optic microstructure sensors: A review. Photonic Sens. 2021, 11, 227–261. [Google Scholar] [CrossRef]
  2. Xu, R.; Yurkewich, A.; Patel, R.V. Curvature, torsion, and force sensing in continuum robots using helically wrapped FBG sensors. IEEE Robot. Autom. Lett. 2016, 1, 1052–1059. [Google Scholar] [CrossRef]
  3. Bronnikov, K.; Wolf, A.; Yakushin, S.; Dostovalov, A.; Egorova, O.; Zhuravlev, S.; Semjonov, S.; Wabnitz, S.; Babin, S. Durable shape sensor based on FBG array inscribed in polyimide-coated multicore optical fiber. Opt. Express 2019, 27, 38421–38434. [Google Scholar] [CrossRef] [PubMed]
  4. Zhu, C.; Zheng, H.; Alsalman, O.; Naku, W.; Ma, L. Simultaneous and Multiplexed Measurement of Curvature and Strain Based on Optical Fiber Fabry–Perot Interferometric Sensors. Photonics 2023, 10, 580. [Google Scholar] [CrossRef]
  5. Tang, Z.; Lou, S.; Wang, X.; Zhang, W.; Yan, S.; Xing, Z. High-performance bending vector and strain sensor using a dual-tapered photonic crystal fiber Mach–Zehnder interferometer. IEEE Sens. J. 2019, 19, 4062–4068. [Google Scholar] [CrossRef]
  6. Shao, L.-Y.; Luo, Y.; Zhang, Z.; Zou, X.; Luo, B.; Pan, W.; Yan, L. Sensitivity-enhanced temperature sensor with cascaded fiber optic Sagnac interferometers based on Vernier-effect. Opt. Commun. 2015, 336, 73–76. [Google Scholar] [CrossRef]
  7. Zhang, S.; Yin, L.; Zhao, Y.; Zhou, A.; Yuan, L. Bending sensor with parallel fiber Michelson interferometers based on Vernier-like effect. Opt. Laser Technol. 2019, 120, 105679. [Google Scholar] [CrossRef]
  8. Roesthuis, R.J.; Misra, S. Steering of multisegment continuum manipulators using rigid-link modeling and FBG-based shape sensing. IEEE Trans. Robot. 2016, 32, 372–382. [Google Scholar] [CrossRef]
  9. Xu, R.; Liu, S.; Sun, Q.; Lu, P.; Liu, D. Experimental characterization of a Vernier strain sensor using cascaded fiber rings. IEEE Photonics Technol. Lett. 2012, 24, 2125–2128. [Google Scholar]
  10. Zhang, Y.; Xu, B.; Wang, D.N.; Gong, H.; Li, Y.; Zhao, C.-L. Sensitivity-enhanced fiber strain sensing system based on microwave frequency scanning with the Vernier effect. Opt. Fiber Technol. 2018, 43, 175–179. [Google Scholar] [CrossRef]
  11. Li, J.; Zhang, M.; Wan, M.; Lin, C.; Huang, S.; Liu, C.; He, Q.; Qiu, X.; Fang, X. Ultrasensitive refractive index sensor based on enhanced Vernier effect through cascaded fiber core-offset pairs. Opt. Express 2020, 28, 4145–4155. [Google Scholar] [CrossRef] [PubMed]
  12. Tian, J.; Li, Z.; Sun, Y.; Yao, Y. High-sensitivity fiber-optic strain sensor based on the Vernier effect and separated Fabry–Perot interferometers. J. Light. Technol. 2019, 37, 5609–5618. [Google Scholar] [CrossRef]
  13. Xie, M.; Gong, H.; Zhang, J.; Zhao, C.-L.; Dong, X. Vernier effect of two cascaded in-fiber Mach–Zehnder interferometers based on a spherical-shaped structure. Appl. Opt. 2019, 58, 6204–6210. [Google Scholar] [CrossRef] [PubMed]
  14. Liu, L.; Ning, T.; Zheng, J.; Pei, L.; Li, J.; Cao, J.; Gao, X.; Zhang, C. High-sensitivity strain sensor implemented by hybrid cascaded interferometers and the Vernier-effect. Opt. Laser Technol. 2019, 119, 105591. [Google Scholar] [CrossRef]
  15. Xu, Z.; Shu, X. Fiber Optic Sensor Based on Vernier Microwave Frequency Comb. J. Light. Technol. 2019, 37, 3503–3509. [Google Scholar] [CrossRef]
  16. Zhang, S.; Liu, Y.; Guo, H.; Zhou, A.; Yuan, L. Highly Sensitive Vector Curvature Sensor Based on Two Juxtaposed Fiber Michelson Interferometers with Vernier-Like Effect. IEEE Sens. J. 2019, 19, 2148–2154. [Google Scholar] [CrossRef]
  17. Zhang, S.; Zhou, A.; Yuan, L. Simultaneous temperature and bending sensor based on Fabry–Perot interferometer with Vernier effect. Opt. Fiber Technol. 2021, 66, 102657. [Google Scholar] [CrossRef]
  18. Claes, T.; Bogaerts, W.; Bienstman, P. Experimental characterization of a silicon photonic biosensor consisting of two cascaded ring resonators based on the Vernier-effect and introduction of a curve fitting method for an improved detection limit. Opt. Express 2010, 18, 22747–22761. [Google Scholar] [CrossRef] [PubMed]
  19. Wu, C.; Fu, H.Y.; Qureshi, K.K.; Guan, B.-O.; Tam, H.Y. High-pressure and high-temperature characteristics of a Fabry–Perot interferometer based on photonic crystal fiber. Opt. Lett. 2011, 36, 412–414. [Google Scholar] [CrossRef]
  20. Sun, Y.; Zhou, X.; Yan, X.; Zhang, X.; Wang, F.; Cheng, T. A Temperature-Insensitive Bidimensional Curvature Sensor Employing C-Fiber-Based Fabry–Pérot Air Cavity. IEEE Trans. Instrum. Meas. 2022, 71, 7007806. [Google Scholar] [CrossRef]
  21. Kersey, A.D.; Davis, M.A.; Patrick, H.J.; LeBlanc, M.; Koo, K.P.; Askins, C.G.; Putnam, M.A.; Friebele, E.J. Fiber grating sensors. J. Light. Technol. 1997, 15, 1442–1463. [Google Scholar] [CrossRef]
  22. Shu, X.; Liu, Y.; Zhao, D.; Gwandu, B.; Floreani, F.; Zhang, L.; Bennion, I. Dependence of temperature and strain coefficients on fiber grating type and its application to simultaneous temperature and strain measurement. Opt. Lett. 2002, 27, 701–703. [Google Scholar] [CrossRef] [PubMed]
  23. Liu, X.; Nan, P.; Zhu, J.; Li, Z.; Dan, J.; Dang, W.; Lim, K.-S.; Udos, W.; Ahmad, H.; Liu, X. Ultrasensitive parallel double-FPIs sensor based on Vernier effect and Type II fiber Bragg grating for simultaneous measurement of high temperature and strain. Opt. Commun. 2022, 508, 127717. [Google Scholar] [CrossRef]
  24. Zhao, Y.; Wang, C.; Yin, G.; Jiang, B.; Zhou, K.; Mou, C.; Liu, Y.; Zhang, L.; Wang, T. Simultaneous directional curvature and temperature sensor based on a tilted few-mode fiber Bragg grating. Appl. Opt. 2018, 57, 1671–1678. [Google Scholar] [CrossRef] [PubMed]
  25. Zhou, Y.; Zhou, W.; Chan, C.C.; Wong, W.C.; Shao, L.-Y.; Cheng, J.; Dong, X. Simultaneous measurement of curvature and temperature based on PCF-based interferometer and fiber Bragg grating. Opt. Commun. 2011, 284, 5669–5672. [Google Scholar] [CrossRef]
  26. Liu, H.; Yang, H.; Qiao, X.; Wang, Y.; Liu, X.; Lee, Y.-S.; Lim, K.-S.; Ahmad, H. Curvature and temperature measurement based on a few-mode PCF formed MZI and an embedded FBG. Sensors 2017, 17, 1725. [Google Scholar] [CrossRef] [PubMed]
  27. Tian, Y.; Chai, Q.; Tan, T.; Mu, B.; Liu, Q.; Liu, Y.; Ren, J.; Zhang, J.; Oh, K.; Lewis, E. Directional bending sensor based on a dual side-hole fiber Mach–Zehnder interferometer. IEEE Photonics Technol. Lett. 2017, 30, 375–378. [Google Scholar] [CrossRef]
  28. Huang, J.; Huang, S.; Shen, C.; Jin, Y. Simultaneous bending-curvature and temperature measurements based on a fiber Bragg grating and a Mach–Zehnder interferometer. Opt. Eng. 2018, 57, 20501. [Google Scholar] [CrossRef]
  29. Jiang, B.; Bai, Z.; Wang, C.; Zhao, Y.; Zhao, J.; Zhang, L.; Zhou, K. In-line Mach–Zehnder interferometer with D-shaped fiber grating for temperature-discriminated directional curvature measurement. J. Light. Technol. 2018, 36, 742–747. [Google Scholar] [CrossRef]
  30. Kong, Y.; Shu, X. In-Fiber Hybrid Cladding Waveguide by Femtosecond Inscription for Two-Dimensional Vector Bend Sensing. J. Light. Technol. 2021, 39, 2194–2204. [Google Scholar] [CrossRef]
Figure 1. (a) Structure diagram of the sensor. (b) The cross-section of the SHDCF.
Photonics 11 00703 g001
Figure 2. (a) Energy distribution in multimode fiber. (b) Energy distribution in the PAHM structure.
Photonics 11 00703 g002
Figure 3. (a) Transmission spectra of the PAHM sensor under different SHDCF lengths. (b) The spatial frequency spectrum of the PAHM sensor under different SHDCF lengths.
Photonics 11 00703 g003
Figure 4. Transmission spectrum of the FBG-PAHM structured sensor.
Photonics 11 00703 g004
Figure 5. Schematic diagram of the experimental system.
Photonics 11 00703 g005
Figure 6. The sensor structure’s response to curvature: (a) 0°, (b) 90°, (c) 180°, and (d) 270°.
Photonics 11 00703 g006
Figure 7. (a) At various rotational azimuth angles, as a function of dip wavelength-curvature. (b) Relationship between the resonant wavelength of FBG and curvature with curvature increasing.
Photonics 11 00703 g007
Figure 8. (a) The vector curve repeatability test characterization. (b) Sensor stability measurement for four hours.
Photonics 11 00703 g008
Figure 9. The wavelength shifts of the envelope and the FBG with the temperature change: (a) three-dimensional image, (b) two-dimensional image and a magnified view of the wavelength shift of the FBG resonance in the inset.
Photonics 11 00703 g009
Figure 10. Response of the sensor structure to the different temperatures.
Photonics 11 00703 g010
Table 1. Simultaneous measurement of two parameters.
The Spectrum Datum of Actual
Measurement and Calculation
Dip1 (nm)Dip2 (nm)
RC = 0°:0 m−1, T = 33 °C
Experiment1386.281549.7
Calculation
Q1C = 0°:0.108 m−1, T = 43 °C
Experiment1392.121549.92
Calculation1391.921549.86
Q2C = 0°:0.216 m−1, T = 53 °C
Experiment1395.281550.06
Calculation1394.961550.02
Q3C = 0°:0.324 m−1, T = 63 °C
Experiment1397.761550.22
Calculation1397.11550.16
Q4C = 0°:0.433 m−1, T = 73 °C
Experiment1401.121550.40
Calculation1400.061550.32
Table 2. Difference between experimental results and theoretical calculation results.
The Condition Datum of Calculation and
Actual Measurement
ΔCΔT
Ractual00
measured
Q1actual0.108 m−1 10 °C
measured0.116 m−111.5 °C
Q2actual0.216 m−120 °C
measured0.231 m−121.7 °C
Q3actual0.324 m−130 °C
measured0.337 m−131.2 °C
Q4actual0.433 m−140 °C
measured0.479 m−142.1 °C
Table 3. Comparison of sensing performance of different sensors developed to date.
StructureCurvature
Sensitivity
Curvature Detection
Range
Temperature
Crosstalk
Add. FBGVernier Effect
Tilted few-mode FBG [24]−2.67 dB/m−14.883–7.625 m−15.618 × 10⁻⁴ m−1/°CNONO
SMF-PCF-SMF (air-holes) [25]4.06 nm/m−10–2.91 m−11.552 × 10⁻³ m−1/°CYESNO
SMF-MMF-PCF-MMF-SMF [26]−1.03 nm/m−110–22.4 m−1−5.85 × 10⁻² m−1/°CYESNO
SMF-DSHF-SMF [27]90°: −1.8 nm/m−1
270°: 1.49 nm/m−1
0–1 m−1−2.28 × 10⁻² m−1/°C
2.752 × 10⁻² m−1/°C
YESNO
Peanut-shaped structure [28]−27.58 nm/m−10.299–0.733 m−1−1.41 × 10⁻³ m−1/°CYESNO
SMF-D-shaped Fiber-SMF [29]87.7 nm/m−10–0.3 m−19.806 × 10⁻⁴ m−1/°CYESNO
Fs-written-CWG-SMF [30]0°: −14.25 nm/m−1
90°: 1.012 nm/m−1
180°: 14.8 nm/m−1
270°: −1.013 nm/m−1
0–8 m−11.72 × 10⁻³ m−1/°C
24.27 × 10⁻³ m−1/°C
−1.66 × 10⁻³ m−1/°C
−24.24 × 10⁻³ m−1/°C
NONO
SMF-ECF-DSHF-ECF- DSHF [17]0°: 86.2 pm/m−1
90°: 3.6 pm/m−1
180°: −88.15 nm/m−1
270°: −5.39 nm/m−1
0–4.75 m−10.6636 m−1/°C
15.89 m−1/°C
−0.649 m−1/°C
−10.61 m−1/°C
NOYES
This work: hybrid FP/MZI structure0°: 20.23 nm/m−1
90°: 10.87 nm/m−1
180°: −25.55 nm/m−1
270°: −6.425 nm/m−1
0–0.865 m−14.9 × 10⁻³ m−1/°C
9.2 × 10⁻³ m−1/°C
−3.9 × 10⁻³ m−1/°C
−1.55 × 10⁻² m−1/°C
YESYES
MMF: Multi-mode fiber, ECF: Eccentric-core fiber, and DSHF: Dual side-hole fiber.
Disclaimer/Publisher’s Note: The statements, opinions and data contained in all publications are solely those of the individual author(s) and contributor(s) and not of MDPI and/or the editor(s). MDPI and/or the editor(s) disclaim responsibility for any injury to people or property resulting from any ideas, methods, instructions or products referred to in the content.

