Article

Human Vital Signs Signal Monitoring and Repairment with an Optical Fiber Sensor Based on Deep Learning

1
Department of Electrical and Electronic Engineering, The Hong Kong Polytechnic University, Hong Kong 999077, China
2
Shenzhen Research Institute, The Hong Kong Polytechnic University, Shenzhen 518057, China
*
Authors to whom correspondence should be addressed.
Photonics 2024, 11(8), 707; https://doi.org/10.3390/photonics11080707
Submission received: 20 June 2024 / Revised: 26 July 2024 / Accepted: 27 July 2024 / Published: 29 July 2024
(This article belongs to the Special Issue Editorial Board Members’ Collection Series: Photonics Sensors)

Abstract

:
Optical fiber sensors have been widely applied for their advantages such as small size, lightweight, and strong electronic interference robustness. Compared with current electronic sensors, optical fiber sensors perform better in measuring parameters in harsh environments, which makes them suitable for more and more applications, such as target tracing and detection and monitoring of health signs in medical services. However, due to fiber optic sensor failure, improper transmission and storage, or other reasons, missing data occur from time to time. Therefore, effective missing value processing methods are desirable as they can be used to facilitate data processing or analysis. In the present study, gated recurrent unit (GRU) interpolation is performed by using the generative adversarial network (GAN) model to process the irregular delay relationship between the data before and after the collection of incomplete vital signs data. Furthermore, a data interpolation model based on VS-E2E-GAN is proposed to reconstruct vital signs signals. The ROC curve (AUC), metrics including mean squared error (MSE), and accuracy (ACC) of experiments reach 0.901, 0.777, and 0.908, respectively, which indicates that the proposed VS-E2E-GAN model performs well in terms of vital signs data imputation and repairment, has strong robustness when compared with other works, and has potential clinical application in health monitoring, smart home, and so on.

1. Introduction

Recently, the optical fiber communication industry has experienced rapid development. An optical fiber communication system is characterized by a larger channel bandwidth and more reliable information service [1,2,3,4,5]. At the same time, there are also various applications for optical fiber sensors, especially medical monitoring [6,7,8,9]. Currently, the incidence and mortality of various high-risk diseases show an increasing trend. With the progress in modern medicine and the shift of priority from treatment to prevention, daily assessment and detection of human health have become requisite for preventing and controlling the development of high-risk diseases [10]. For example, the vital signs of patients are an important piece of data needed for the treatment and care of patients, especially when the continuous monitoring of heart rate is required. Various vital signs, such as respiration, body temperature, blood sugar, lipids heartbeat, pulse, and blood pressure (BP), are the main health indicators of human physiological activities. Therefore, in addition to assisting in the evaluation of daily health status for individuals, monitoring of vital signs can also support the early of certain diseases like cardiovascular diseases [10,11]. Among them, heartbeat and respiratory signals are the most common ones, which are closely related to health status [12,13,14,15]. However, the method commonly used to monitor vital signs, namely, five-lead detection, requires direct contact with the patient’s skin to collect vital signs data. In different situations, this measurement causes inconvenience, and it performs poorly in efficiency and accuracy, thus causing disruption to timely and effective treatment. This is a problem that can be effectively solved by using optical fiber sensors [15,16].
However, it is a common problem to encounter in practice that data missing and data anomalies result from the use of optical fiber sensors to collect vital signs signals, which is due to terminal data collectors, network communication failures, or other human factors, such as subject body flipping [17,18,19]. There are different methods available to perform data repair but they vary in the extent to which accuracy is improved. With regard to dealing with the outliers and missing and error values in the existing literature, there are three main methods used. The first one is the direct deletion method, which often ignores the important information in the data, and a higher missing rate influences the subsequent data analysis more significantly. The other one is the simple imputation method, which usually involves mean imputation, median imputation, and other methods of mathematical imputation, focusing only on the relationship between values. The last one includes various imputation methods based on machine learning, such as the interpolation based on the interpolation method and the k-nearest neighbors (KNN) based on matrix factorization. However, these methods focus narrowly on the statistical characteristics of the data itself, thus ignoring the time-series signal characteristics. Furthermore, the imputation accuracy is poor [20,21,22,23,24].
In an era of artificial intelligence, the technology of deep learning is being applied widely to achieve data processing and pattern recognition. Generative adversarial network (GAN) is a generative learning algorithm that has emerged in recent years [25,26,27]. Due to the advantage of GAN in model-free reconstruction to perform data generation tasks, it has been applied to deal with time series data generation. By following the adversarial training process, the quality of samples generated via GAN is significantly improved compared with traditional methods [28,29,30,31,32]. Moreover, the framework of GAN shows flexibility. The generator or discriminator can be any differentiable function, which is conducive to the further application of GAN. At present, recurrent neural networks (RNNs) are being used widely for sequence learning, with excellent achievement in digital image signal processing, video signal processing, and natural language processing (NLP) [33,34,35,36,37,38,39]. Some representative modules, such as gated recurrent unit (GRU) and long short-term memory (LSTM), are applicable to alleviate the problem of gradient disappearance caused by introducing gating units and applying information-locking strategies. Alternatively, extra modules can be used to solve problems in LSTM [40,41].
In the present study, to improve the completeness of the acquired heart rate (HR) and respiration rate (RR) data and the effectiveness of medical monitoring, a vital sign data imputation and end-to-end GAN-based data imputation model (VS-E2E-GAN) is proposed, which relies on the new gated recurrent unit interpolation (GRUI) module to accurately fill the missing values (missing values and outliers to be filled) in vital signs data, so as to improve the integrity and quality of data, thus compensating for the missing and incomplete signals collected by optical fiber sensors. The experimental results obtained on the real dataset demonstrate the effectiveness of the missing value imputation model of vital signs data as proposed in this paper. The main contributions of this study are summarized as follows:
(1)
An optical fiber sensor based on a fiber interferometer is proposed to monitor the vital signs effectively.
(2)
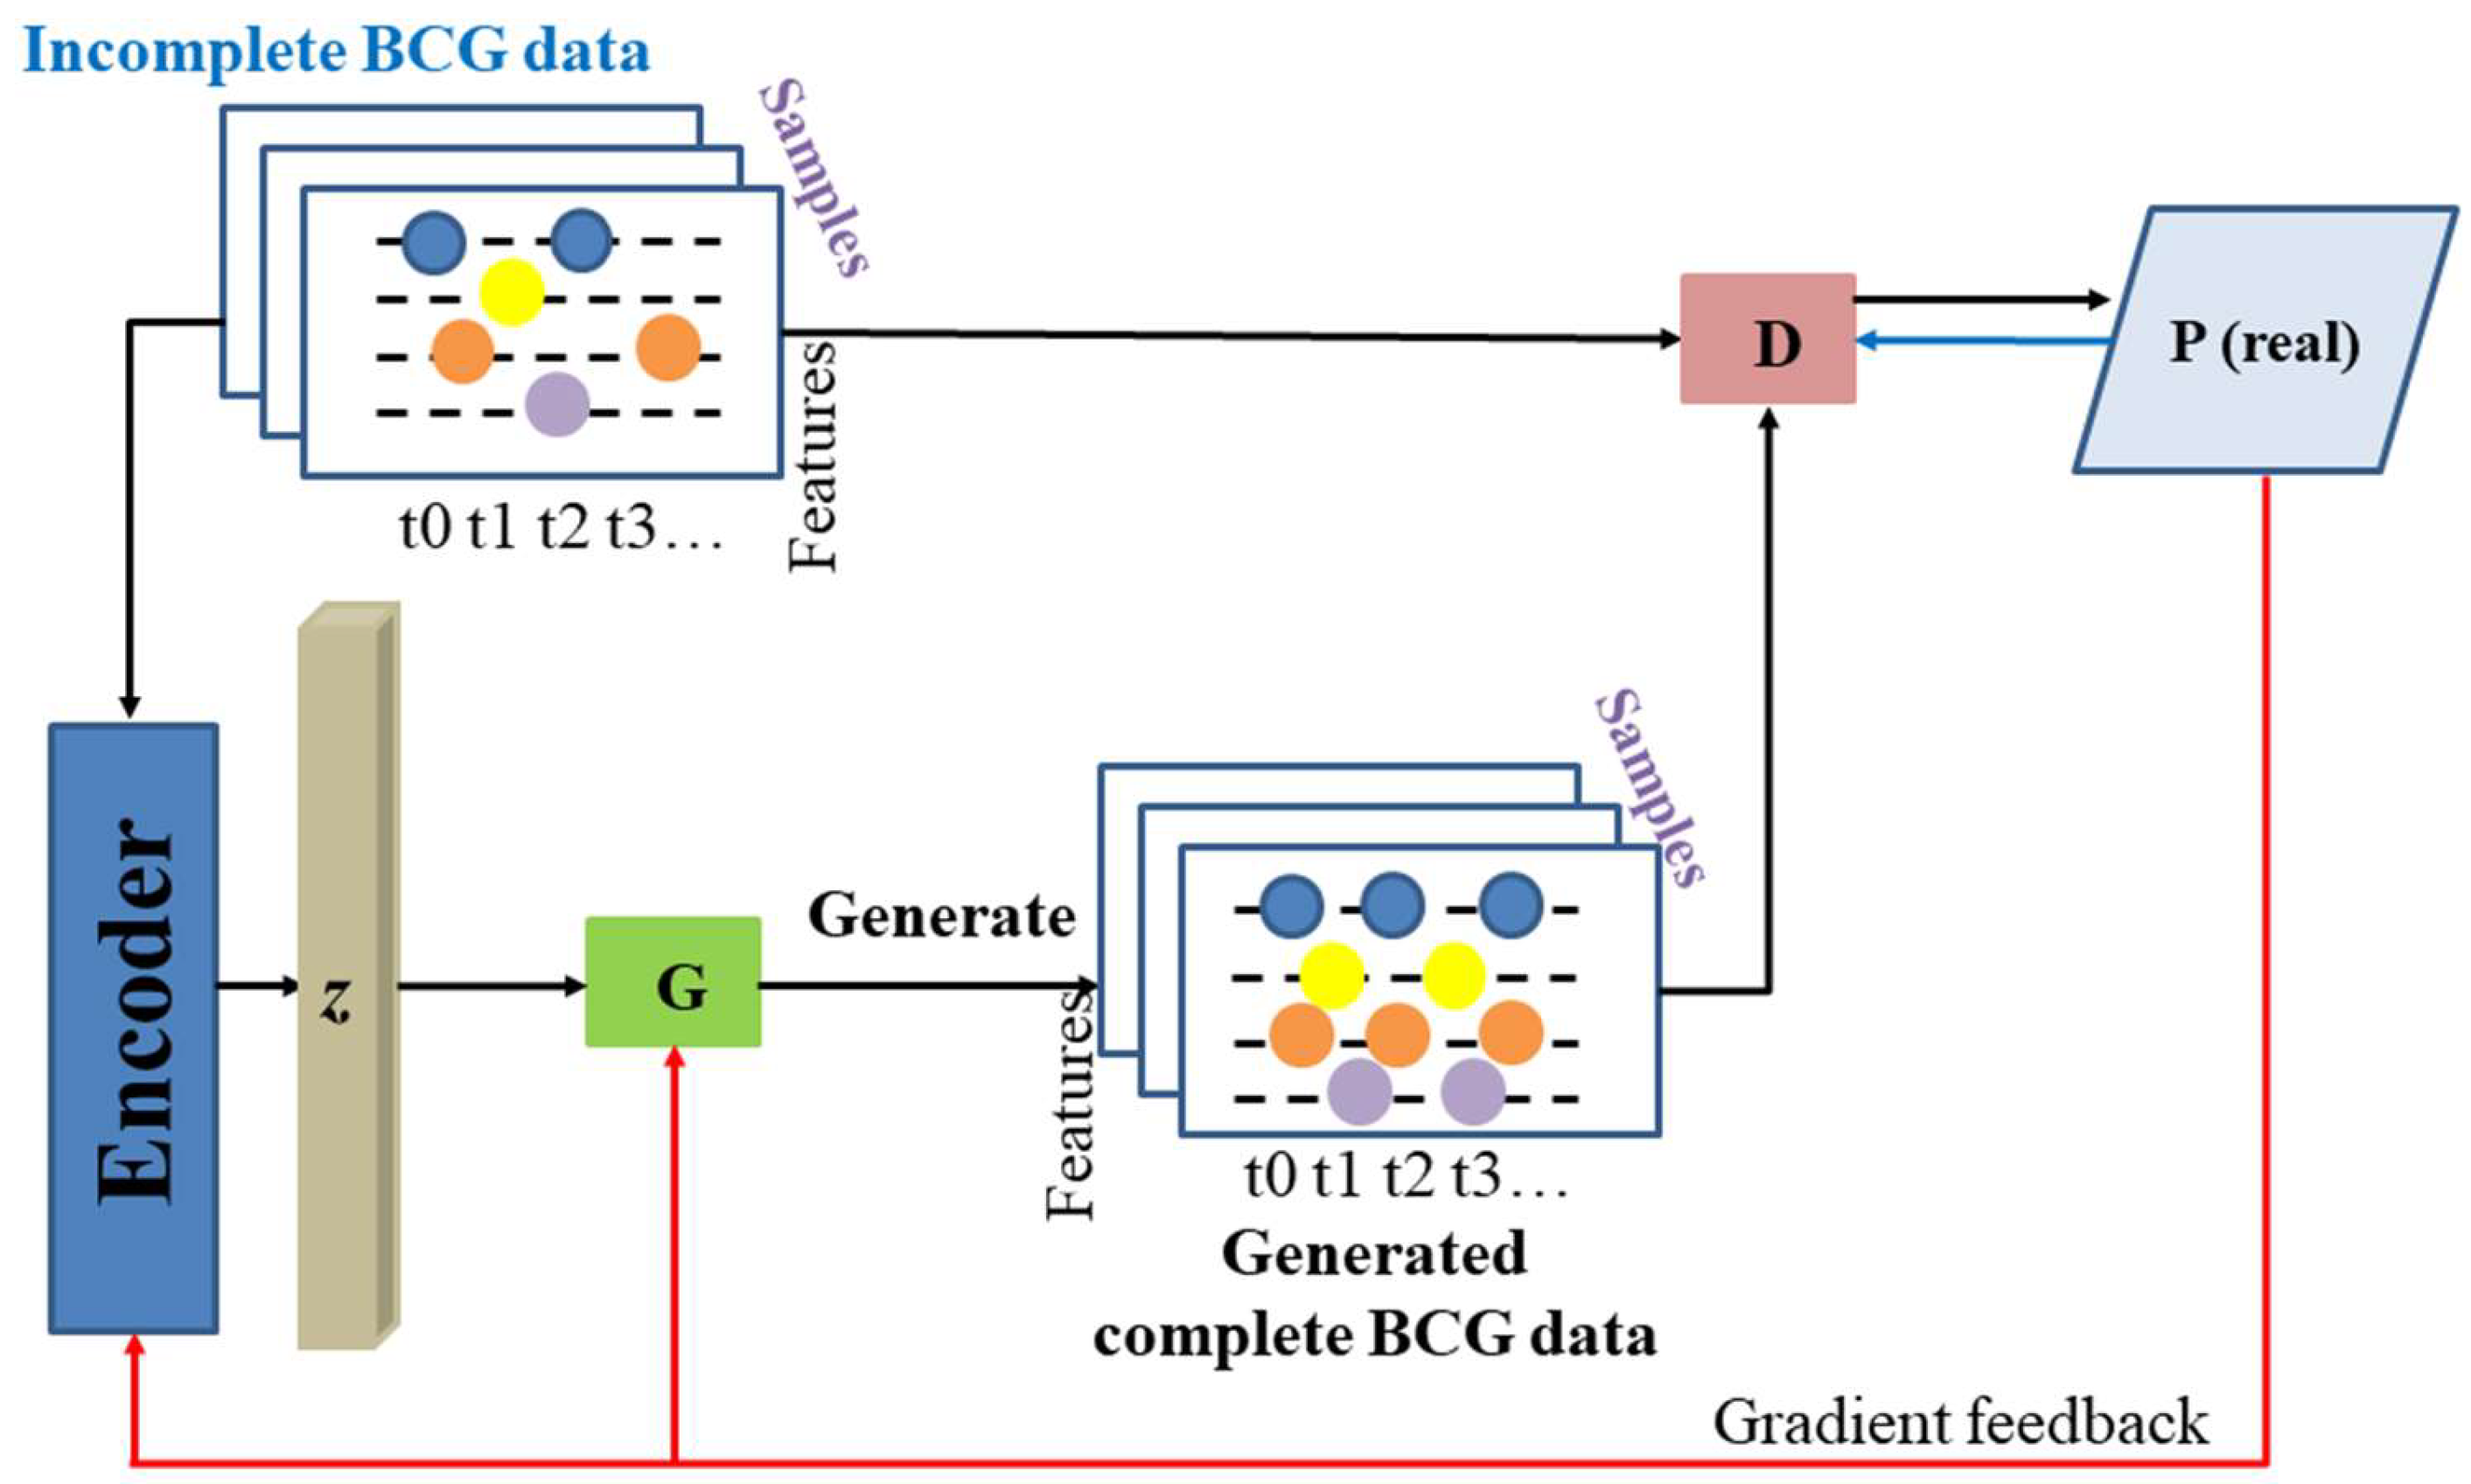
To deal with the missing values of vital signs data, a novel deep learning model (VS-E2E-GAN), which is based on de-noising autoencoder and GAN, is proposed to extract the distribution features of the vital signs data obtained from the optical fiber sensor.
(3)
Multiple experiments are conducted by using three common evaluation metrics to verify how well the model performs, with the experimental results obtained to confirm its better imputation performance.
(4)
In combination with the VS-E2E-GAN model, the optical fiber sensor is more effective in non-intrusive physiological monitoring under clinical settings.
The content of this paper is structured as follows. The related works are introduced in Section 2. In Section 3, a discussion is conducted about some methods and the proposed model structure. Section 4 elaborates on different experiments. Furthermore, we also compared the performances between the proposed model and other models. The experimental results are analyzed and researched. In Section 5, the conclusion is drawn and the outlook is outlined.

2. Related Works

In this section, a brief introduction is made to some related works, covering the optical fiber sensor in measurement and time series data processing with some deep learning techniques.

2.1. Optical Fiber Sensing and Measurement

According to the specific application requirements, optical fiber sensors can be categorized into many types, including distributed sensors, bending vector sensors, liquid level sensors, temperature sensors, pressure sensors, and so on. Based on the capability for continuous monitoring over increasing sensing distances, they are further classified as quasi-distributed (QD) optical fiber sensors and point-distributed optical fiber sensors [41]. Additionally, they can also be distinguished as interference and non-interference types based on their susceptibility to interference. There are various advantages to optical fiber sensors due to the unique properties of optical fibers compared to traditional metal wires. These include small size, eco-friendly, safety, lightweight, and reliability; resistance to electromagnetic interference and corrosion; wide applicability across different objects with minimal impact; among others. As a result of these benefits, optical fiber sensors find applications in many fields, such as industry, agriculture, aerospace, petroleum exploration, aviation, medical and health, national defense, and security [42].
Simultaneously, it demonstrates substantial potential in augmenting capabilities for micro-manufacturing, thereby finding wide-ranging applications in biomedical services and the monitoring of vital signs, particularly in the development of minimally invasive surgical instruments. Takeuchi et al. conducted a significant study in 2007 exploring the application of optical fiber sensors in pharyngeal manometry [43]. The study employed a pharynx pressure sensor based on Fabry–Perot interferometry technology (FOP-MIV, FISO technology), which exhibited a strong correlation with conventional catheter-based reference sensors (p37-4109c05, zinatics). The sensor has a compact 2.08 mm diameter conduit, measuring pressures from −30 kPa to 30 kPa at 250 Hz sampling frequency. Furthermore, its resistance to electromagnetic interference enhances its suitability for operation in environments with significant electromagnetic challenges. For instance, microbend optical fiber sensors can effectively operate in the presence of conditions such as nuclear magnetic resonance, enabling the measurement of various vital signs including HR, blood pressure (BP), and respiratory rate (RR), among others.

2.2. Time Series Data Processing

As a group of continuous series data with time tags, time series data usually reflect the laws of development and characteristics of change to things over time. The typical forms of time series data include commodity transaction prices, the temperature in a specific region at a certain time, electrocardiogram (ECG) trends, house price trends, and the solution concentration data in the process of chemical reaction. Time series prediction aims to identify the pattern of changes in the time series data by analyzing the distribution characteristics of historical time series data for quantitative prediction of the possible future values of related variables in the time series.
At the same time, time series data loss is a common problem. In different contexts of data collection, there are different causes for data loss, such as interference with data collection equipment, the population lost in social surveys like population censuses, and the limitations of existing technology like deoxyribonucleic acid (DNA) sequencing. With respect to incomplete data analysis, the missing value imputation method can be used to find a reasonable substitute value for each missing value by exploring the distribution law of the remaining data, so as to obtain a dataset with the same size and dimension as the original dataset. This method has attracted the attention of many researchers as it can not only maintain the size of the original dataset but also make reasonable inferences about the missing values. In the course of scientific research or various industrial applications such as machine learning and data mining, data preprocessing consumes more than 60% of the time and energy for researchers. Therefore, incomplete data processing is the key work to perform. For the analysis and prediction of time series, it is necessary to effectively deal with the missing values of time series data. In general, data loss mechanisms are divided into three categories, and different methods should be adopted for different loss mechanisms. These three mechanisms are detailed as follows [44]:
(1)
Missing completely at random (MCAR), which means the data may be lost in some dimensions or completely. These deletions are completely random and irrelevant to any other external factors.
(2)
Missing at random (MAR), which means deletion of data is related to known variables only and irrelevant to any unobservable variables.
(3)
Missing not at random (MNAR), which means the missing value of the data is related to both observable and unobservable variables if the missing data are neither MCAR nor MAR.
The incompleteness of time series tends to cause deviation in the modeling of time series and even renders the results of subsequent time series data analysis incorrect. Therefore, the primary emphasis in time series research revolves around effectively addressing missing values within the data. Approaches to handling missing data are categorized into two main methods based on their data processing techniques: direct deletion and imputation. Imputation methods, in turn, branch into statistical imputation, machine learning-based imputation, and deep neural network-based imputation techniques.

2.3. Generative Adversarial Network (GAN)

The Generative Adversarial Network (GAN), introduced by Ian et al. in 2014 [45], between the generator and the discriminator is used to capture the distribution characteristics of the original dataset. In recent years, GAN has achieved outstanding performance in the field of computer vision and natural language processing, becoming a cornerstone in generating sequential data. For instance, Mogren et al. employed a C-RNN-GAN model to synthesize sequential melody data, utilizing an enhanced recurrent neural network within the model to accurately replicate musical styles [46]. Similarly, Yoon et al. explored GANs for generating time series data in 2019, focusing primarily on modeling historical trends rather than predicting future data trajectories [47].
The idea of creating a confrontation network is inspired by the “two-person zero-sum game” theory. In a space where the sum of interests is fixed, two people fight for their own benefits. The increase in benefits received by one party must be accompanied by the decrease in benefits received by the other party. The two parties constantly strive for their own benefits through competition. The whole game process can be described as that with one side’s strategy determined, the other side will make the decision that is most favorable to its own side under the current conditions [48]. If both sides of the game choose to be optimal when the other side’s strategy is determined, this group of strategic choices will reach Nash equilibrium. The generator (G) and discriminator (D) in the generated confrontation network represent the two sides of the game. Fighting for their own interests through the game, they learn and progress together in the game process [49].
In practice, the mutual objective of the generator and discriminator is quantified by the probability value outputted by the discriminator, which signifies the likelihood of the discriminator classifying the current input as real data. In the network training process, the generator will be interfered by the false but new samples similar to the real sample data, which will be interfered with by the discriminator by constantly generating. When these false samples are taken as the input, the discriminator should protect its own interests by outputting a probability value that is as low as possible. In the process of confrontation training between the two, the generator constantly improves its ability to generate false samples, and the discriminator constantly improves its ability to identify them. Finally, network training is completed when the “Nash equilibrium” similar to that in game theory is reached. There are no restrictions on the selection of the internal network structure of the generator and discriminator. A fully connected network (FCN) and cyclic neural network can all be treated as a generator and a discriminator, respectively.

3. Materials and Methods

This section proposes an optical fiber sensor and vital sign interpolation model. Specifically, the fiber interferometer-based optical sensor is developed to monitor vital signs. Furthermore, we construct a new model of deep learning (VS-E2E-GAN) in order to fill in the missing values in vital sign data.

3.1. Proposed Optical Fiber Sensor

In this study, ballistocardiogram (BCG) monitoring is performed non-invasively using a smart cushion. The monitoring system consists of a proportional–integral–derivative (PID) controller, a phase shifter, as well as a Mach–Zehnder interferometer (MZI) BCG monitor. The system for monitoring consists of a low-speed photodetector (PD), a DFB laser, a phase shifter, as well as the MZI-based BCG monitor. Comprising two 3 dB couplers that operate as optical splitters as well as couplers, correspondingly, the MZI is positioned atop a plastic substrate to enable smart cushion packing. The MZI along with the phase shifter have been parallelly fixed as well as located beyond the sensing area. The BCG signal is transformed by the PD into an electrical signal that splits between the CH1 and CH2 channels. The low-pass filter (LPF) processed data as an input for the PID controller is included in CH2, whereas CH1 represents the raw data. To keep the system running at a quadrature point, the controller adjusts for phase drift. A data acquisition (DAQ) card (National Instrument, USB6001) records the unprocessed information from CH1.
The two arms of the MZI design employed in this investigation are roughly 40 cm long and varied by 5 mm. Two bent arms that are placed together within a semicircle shape as well as are not overlapping make up the integrated cushion made of plastic substrate. When a subject sits upon the cushion, their body recoils from heartbeats, which causes a variation in phase within the interferometer. Via the degree of variability, this phase variation may be utilized to identify the BCG signal. Figure 1 shows the monitoring system that makes use of the optical fiber sensor. Equation (1) represents the system’s optical fiber interferometer’s mean output light intensity, where D is the mean output intensity of light, the interference fringes peak intensity is denoted by I0, the total amount of output light routes is denoted by k, the variation in the phase of the signal generated by the sensor is represented by φ(t), as well as the variation in phase brought on by shifts in the environment is indicated by ψ(t).
I k = D + I 0 c o s [ φ t k 1 2 π / 3 ]

3.2. Data Acquisition and Processing

As an important vital sign, RR reflects the physiological function of the lung, oxygen input, and carbon dioxide output. When abnormal RR is detected, it may be associated with many symptoms such as asthma and anemia [8]. At present, it is widely used to evaluate the physical and mental conditions of the human body, and the measurement of this parameter is the focus of vital signs detection. HR is detected by examining the characteristics of the BCG signal. The body will recoil when the heart pumps blood into the vascular system. Such pressure changes and microchanges in the human body can be detected simultaneously by using fiber-optic sensors embedded in the mattress for non-invasive detection. The original signal filtered respiration signal and filtered BCG signal as obtained by the fiber optic sensor are shown in Figure 2, in which HR and RR are shown as typical time series signals.
To extract HR and RR from the raw BCG signal, the RR is calculated as (60 × 6/12) = 30 rpm when the raw BCG signal exhibits 6 distinct waveforms within a 12 s interval. Utilizing time-domain data and the Fast Fourier Transform (FFT) algorithm facilitates noise mitigation in the raw BCG signal through linear trend removal and filtering. Consequently, if the filtered signal exhibits 9 clear waveforms over a 6 s span, the HR can be determined as 90 bpm.

3.3. Proposed Model (VS-E2E-GAN)

In practice, it is common that sensor failure or body turnover of the subject makes the collection of vital sign signals incomplete and causes the loss of some key values. There are two main problems with the current methods of time series data missing value imputation. On the one hand, most data-imputation methods ignore the particularity of time series. On the other hand, a complete dataset is required by the time series data imputation method based on a recurrent neural network. In this paper, the VS-E2E-GAN model is proposed which can directly interpolate missing time series data. The model relies on a bidirectional gated recurrent neural network to model the time series and fully learn the implicit information contained in the remaining data. Vital signs data are usually collected continuously by sensors and show significant temporality, while the time series collected by the sensor can be lost due to the failure or interference of the sensor. Therefore, it is necessary to prevent the missing part from affecting the subsequent data analysis by processing the missing time series. Based on the observed characteristics of missing time series data, the idea of auto-encoder is introduced to propose a filled recurrent neural network model that can be applied to process time series data. However, the model requires complete time series data during training, so that it is used as a generator network to construct a GAN-based time series missing value imputation model called VS-E2E-GAN. The model starts by learning the distribution law of time series on the missing dataset. After the completion of network training, the new time series data conforming to the original data distribution are generated. Also, the network-generated time series data are used to impute missing values. The overall model structure is shown in Figure 3.
For a given d-dimensional time series containing vacancies (x = [x0, x1, …, xn−1]) and corresponding time nodes (t = [t0, t1, …, tn−1]), the vacancies are filled in. Firstly, it is necessary to obtain the specific position of the vacancy value in the time series. To achieve this purpose, and to define the position matrix of the vacancy value (S), the 0~1 variable is used to determine whether there is any vacancy in the observation value data at the time node. For a better understanding, a three-dimensional time series with null values is assigned, with each row representing the observed value of each feature quantity at the time of 0, 1, 2, and 3, as shown in Equation (2):
x = 1 , 5 , N o n e , 8 N o n e , 7 , 6 , N o n e 4 , N o n e , N o n e , 2 S = 1 , 1 , 0 , 1 0 , 1 , 1 , 0 1 , 0 , 0 , 1
where None represents the data vacancy value. It can be clearly seen from above that the time delay between two adjacent effective observations changes due to the existence of None, which also shows the distribution characteristics between vacancy values. At the same time, different time delays have different effects on subsequent observations. If an observation is missing for some time, its effect is supposed to diminish over time. To record the time delay between two adjacent valid observations, a time delay matrix δ is introduced to describe the change in time delay. Its elements are expressed as follows:
δ t i , j = t i t i 1 , ( s t i 1 , j = 1 , i > 0 ) δ t i 1 , j + t i t i 1 , ( s t i 1 , j = 0 , i > 0 ) 0 i = 0
The delay matrix corresponding to the aforementioned three-dimensional time series with vacancies is as follows:
δ = 0 , 1 , 2 , 1 0 , 1 , 1 , 2 0 , 1 , 2 , 1
Since most GAN frameworks are intended mainly for image processing, they are not adaptive to time series imputation. Differently, RNN is a model applicable for processing time series, but the traditional RNN is prone to gradient explosion and gradient disappearance when a longer time series is processed. In recent years, many of its variants have emerged, such as LSTM and GRU, all of which are effective in solving this problem. To simplify the construction of GAN, it is proposed in this paper to construct the basic network structure of the generator and discriminator by adopting the GRU with higher computational efficiency and scalability. Due to the incompleteness of data and the significant variation in the time lag between two consecutive valid observations, the traditional GRU structure is not applicable to data imputation. Therefore, a GRU-based GRUI is proposed to deal with such irregular time delays more efficiently and learn implicit information from the time delays; Figure 4 shows the basic structure of GRUI.
In order to reflect the impact on the observed value, the time decay vector β is introduced. The size of β is supposedly related to the delay matrix δ. If δ is large, β becomes smaller. The elements in β are expressed as follows:
β t i = 1 e max ( 0 , W β δ t i + b β )
δ t i = ( δ t i , j ) 1 × n
where Wβ and bβ are the parameters that need to be learned.
To ensure β ∈ (0, 1], a negative exponential function is used as a constraint. Meanwhile, Wβ is introduced as a full-weight matrix for the interaction of the δ matrix. After the attenuation vector is obtained, the attenuation vector β is multiplied by elements to update the hidden state of the GRU. Since data preprocessing is often conducted through the normalization method, the hidden state is updated in this study by multiplying it with the attenuation vector. Therefore, the value of the updated hidden state is not overly small. The formula used for GRUI is expressed as follows:
h t i 1 = β t i h t i 1
μ t i = σ W μ h t i 1 , x t i + b μ
r t i = σ W r h t i 1 , x t i + b r
h ˜ t i = tan h ( W h ˜ r t i h t i 1 , x t i + b h ˜ )
h t i = 1 u t i h t i 1 + u t i h ˜ t i
Since the auto-encoder is designed to reconstruct the target samples, the auto-encoder and GRUI structure in the generator are adopted in this paper. To make the auto-encoder learn more useful information, this paper adopts the idea of denoising auto-encoders, removing some original samples (destroying the original samples), and reconstructing the original samples. However, considering the small amount of data available, removing samples will further reduce the amount of data, which hinders the self-encoder from learning more information. Therefore, it is proposed in this paper to introduce the random noise η sampled from the normal distribution N (0, 0.01) into the original sample for destroying the original sample. The generator function G (⋅) is expressed as follows:
G x + η = x
where x represents the real data and x’ refers to the fake data.
To make the generator generate the complete time series x’, which is the closest to x, the squared error loss function is incorporated into the loss function of the generator. The loss function L2 (x) of the generator is expressed as follows:
L 2 x = x S G x + η S 2
L G = λ L 2 x D x
where λ represents a hyper-parameter, which is used to control the weight of the discriminator loss and variance loss, and D (⋅) refers to a function of the discriminator.
Functioning as a decoder, the network structure of the discriminator consists of a completed connected layer and a GRUI layer. The discriminator is ordered to distinguish the forged data x’ from the real data x, and its output indicates the probability that the generated x’ is real data. Therefore, it is necessary to find a series of parameters such that a higher probability is outputted when real data x is inputted and a lower probability is outputted when false data x’ is inputted. In order to achieve this purpose, the loss function LD of the discriminator can be defined as follows:
L D = D x + D x
Both the discriminator and the generator are trained against the min–max game according to Equation (14), which ends up leading to the equilibrium.
m i n G m a x D V D , G = E x ~ P x x D x E x ~ P x x D x
where E (⋅) represents the mathematical expectation; Px (x) and Px (x’) denote the probability distributions of the real data x and the fake data x’, respectively.
In this paper, the following methods of data quality improvement are proposed. Firstly, the −1 value is used to replace the vacancy value in the original data to obtain the marked sequence x of the vacancy value, while the corresponding position matrix S and delay matrix δ are constructed according to the distribution of the −1 value. Secondly, in the data-loading stage, the data are constructed into a three-dimensional array in various forms (batch number of samples, sequence length, sequence feature number) and inputted into the GRUI-GAN model after zero-mean normalization. Thirdly, in the generator, the sequence x and its time-delay matrix δ that are labeled and added with noise η are inputted into the cells of GRUI. After processing by the GRUI layer, a hidden state corresponding to the input sequence is generated. The state is further fed into a fully connected layer to generate a low-dimensional vector z. Then, z is sent to the next GRUI layer for processing through another fully connected layer, with all the outputs of this GRUI layer combined into a new full sequence x’. Fourthly, in the discriminator, the incomplete sequence x or the complete sequence x’ and its corresponding delay matrix δ are also effectively processed by the GRUI. The last hidden state of the GRUI layer in the discriminator is fed into a fully connected layer, whose output is the probability of being discriminated as real data. Lastly, after multiple rounds of adversarial training between the discriminator and the generator, the generator can be used to get a new sequence x’ that is closest to x. Then, x’ is used to fill in the vacancies in x. The equation is expressed as follows:
x i m = x S + 1 S x
where xim is the x obtained after the imputation.
The imputation framework proposed in this thesis is shown in Figure 5. In order to improve the performance of the generator in fitting the original sequence, the generator is updated N times, and the discriminator is updated once in one iteration in the GAN proposed in this paper.

4. Experiments and Results

This section presents a series of experiments designed to validate the VS-E2E-GAN model. It includes detailed descriptions of experimental parameters and various evaluation metrics employed. In addition, baseline methods are utilized to assess the effectiveness and performance of the proposed model.

4.1. Experiment Setup

During the experiment, the ADAM optimizer was employed with a batch size of 10 and 50 iterations. The experiments were conducted on a computational platform featuring the high-performance NVIDIA GeForce GTX1080Ti graphics card and the formidable Intel i7-8700 CPU. The model was implemented utilizing the PyTorch framework and the Python programming language.
The performance of the proposed model is assessed through the area under the ROC curve (AUC), metrics including mean squared error (MSE), and accuracy (ACC). The MSE can be defined as follows:
M S E = 1 n i = 1 n y ^ i y i 2
where yi denotes the observed value and y i ^ signifies the predicted value.
Additionally, the proposed method is comparatively verified against several vacancy value imputation methods commonly used in traditional load forecasting (mean value imputation, piecewise linear interpolation, and KNN imputation). Given the incomplete dataset, it is impossible to directly evaluate the gap imputation accuracy of different algorithms. Also, it is inappropriate to train and test GAN models for experiments in this paper by dividing training and testing sets. Therefore, all data are trained in the proposed VS-E2E-GAN model. The training set is the entire dataset. As for the imputation performance of the VS-E2E-GAN model on the dataset after training on the entire dataset, it can be evaluated only by the subsequent prediction results. Therefore, to validate the proposed method, the experiment conducted in this paper involves the following two parts:
(1)
Part of the complete data is selected from the dataset (not including missing values and not considering outliers), and the incomplete data with different proportions of random missing data for experiments are constructed to verify the imputation performance of the model trained with a complete dataset on small datasets.
(2)
By using the above experimental methods, the complete incomplete dataset is obtained again, and the different complete datasets obtained by different methods are used for subsequent HR (RR) prediction. The final HR (RR) prediction results are used to indirectly verify the proposed imputation method.

4.2. Results and Analysis

The experimental results are as follows. Firstly, among all the classification results obtained by the simple binary classifier, the data filled by the proposed method lead to the best classification performance, which indicates that this method achieves the best results. Secondly, the classifier based on the simple recurrent neural network produces the best outcome of classification on the dataset filled by various methods, which shows that the recurrent neural network outperforms other networks in learning the distribution characteristics of time series data, reflecting the advantages of recurrent neural network in time series modeling. Thirdly, the GAN-based method performs better than other methods, indicating that it is achievable to produce better results by training the data filled by the GAN missing value imputation method. Furthermore, the effect of epoch and learning rate (lr) on the model performance is verified. As shown in Figure 6, the model performs best when the epoch is 30 and the lr is 0.012.
As for neural networks, the training time of neural networks is affected by the selection of software and hardware configuration, dataset size, training rounds, network layers, and other factors. For this reason, it is practically difficult to evaluate the training time. In the comparative experiment, the time efficiency of various methods was compared by fixing the hardware and software parameters, dataset size, training set, cross-validation method, test set, and other factors. The experimental results are shown in Table 1. We can see clearly from the table that the method (VS-E2E-GAN) proposed in this paper is applicable to achieve optimal imputation accuracy, because the network model is more complicated and the time cost is higher. In some tasks requiring high accuracy (such as vital signs signal imputation), the proposed method is much more effective.

5. Discussion

As information science and technology advance, computer technology has played an irreplaceable role in every aspect of life. With the popularization of global information, the Internet has given rise to a large amount of data around the world, which makes information highly valuable. However, these data suffer quality problems due to various reasons, of which the incompleteness of data is a major one. Because of a large amount of missing data, it is inevitable for incomplete data to have a negative impact on data mining or other technical applications.
There is plenty of hidden information contained in a massive amount of data, which requires the corresponding techniques for exploration, such as data mining technology. However, most data mining algorithms are incapable of processing incomplete data because the data are often incomplete in practice. Moreover, incomplete data also affect the quality of the final results. Based on optical fiber sensors, vital signs measurement is an important research topic, which is essential for the noninvasive monitoring of human health. However, in the measurement process, the measured data are often lost due to various reasons. In this paper, the imputation of incomplete data is studied for analysis, including data loss. By analyzing the particularity of time series data, a countermeasure network and a de-noising self-encoder are created. On this basis, an imputation model for the missing values of time series data (VS-E2E-GAN) is constructed to directly fill the missing dataset. We use a bidirectional gated recurrent neural network to capture the dependencies of time series data from the past to the future and from the future to the past and to fully learn the distribution patterns of time series data. Furthermore, a new generator loss function is proposed to make the model perform better in accomplishing the missing value imputation task of the time series. In case of a significant sample missing rate, the method can still get a better achievement in imputation. In addition, multiple experiments are conducted to compare them with other methods, which demonstrates that this method can achieve better results.
Vital signs signals are highly valuable for maintaining physical health. Despite some remarkable results achieved by the time series prediction model based on GAN and the time series data imputation model based on GAN as proposed in this paper, there are still some shortcomings. Therefore, improvement can be made in the future from the following perspectives:
(1)
The time series prediction model proposed in this paper only considers the accuracy of the design of the loss function. In the future, the loss function can be designed by combining the downstream tasks to deal with specific problems.
(2)
The time series data imputation model proposed in this paper incurs substantial time costs. In the future, it is worthwhile to consider simplifying the network structure, such as model distillation.
(3)
In this paper, the accuracy of the model is verified by using the real vital signs data collected by optical fiber sensors. In the future, new data can be used to validate the proposed model.

6. Conclusions

In this paper, time series data are extensively distributed in the real world, of which heart rate and respiration signals are two typical time series signals. The analysis and accurate prediction of these time series data play an important impact in production and life for people. Therefore, establishing an effective time-series signal processing model is necessary. Meanwhile, missing time series is ubiquitous, and these missing data are related to the mining of time series data. That is the reason why an urgent need to reasonably deal with the loss of time series data. In this paper, a VS-E2E-GAN-based load data imputation method is proposed, and the GRUI structure is built by introducing a time decay vector into the traditional GRU structure to understand the impact of different time intervals on the measurement results. After adversarial training, the GAN of this structure is capable to process incomplete time series data and generate higher-precision data for interpolation. In this way, the quality of data can be improved and the lack of optical fiber sensors can be solved to capture vital sign signals, which is a convenient and efficient solution to medical monitoring.

Author Contributions

Writing—original draft preparation, H.G.; writing—review and editing, Q.W.; validation, J.Z.; supervision and funding acquisition, C.Y. All authors have read and agreed to the published version of the manuscript.

Funding

The authors gratefully acknowledge the financial support of the non-wearable and noninvasive photonic sleep monitoring system-based optical fiber sensor with machine learning (HKPU 1-WZ01) and non-wearable and non-invasive photonic smart health monitoring system for atrial fibrillation diagnosis based on optical fiber sensor with machine learning (HKPU 1-CD8N).

Data Availability Statement

The original contributions presented in the study are included in the article; further inquiries can be directed to the corresponding authors.

Conflicts of Interest

The authors declare no conflicts of interest.

References

  1. Zhang, J.; Jiang, W.; Zhou, J.; Zhao, X.; Huang, X.; Yu, Z.; Yi, X.; Qiu, K. An iterative BP-CNN decoder for optical fiber communication systems. Opt. Lett. 2023, 48, 2289–2292. [Google Scholar] [CrossRef] [PubMed]
  2. Zhu, K.N.; Liu, S.; Wei, S.; Li, Y.; Zhao, Y.; Li, Y.; Wang, W.; Zhang, J. Physical layer secure key generation and distribution based on noise variances in optical fiber communications systems. Opt. Laser Technol. 2023, 165, 109576. [Google Scholar] [CrossRef]
  3. Wang, F.; Gao, R.; Li, Z.; Liu, J.; Cui, Y.; Xu, Q.; Pan, X.; Zhu, L.; Wang, F.; Guo, D.; et al. 400 Gbit/s 4 mode transmission for IM/DD OAM mode division multiplexing optical fiber communication with a few-shot learning-based AffinityNet nonlinear equalizer. Opt. Express. 2023, 31, 22622–22634. [Google Scholar] [CrossRef] [PubMed]
  4. Nagarajan, R.; Lyubomirsky, I.; Agazzi, O. Low power DSP-based transceivers for data center optical fiber communications (Invited Tutorial). J. Light. Technol. 2021, 39, 5221–5231. [Google Scholar] [CrossRef]
  5. Chen, B.; Alvarado, A.; van der Heide, S.; van den Hout, M.; Hafermann, H.; Okonkwo, C. Analysis and experimental demonstration of orthant-symmetric four-dimensional 7 bit/4D-sym modulation for optical fiber communication. J. Light. Technol. 2021, 39, 2737–2753. [Google Scholar] [CrossRef]
  6. Kim, C.S.; Ober, S.L.; McMurtry, M.S.; Finegan, B.A.; Inan, O.T.; Mukkamala, R.; Hahn, J.O. Ballistocardiogram: Mechanism and potential for unobtrusive cardiovascular health monitoring. Sci. Rep. 2016, 6, 31297. [Google Scholar] [CrossRef]
  7. Wen, X.; Huang, Y.; Wu, X.; Zhang, B. A feasible feature extraction method for atrial fibrillation detection from BCG. IEEE J. Biomed. Health Inform. 2019, 24, 1093–1103. [Google Scholar] [CrossRef] [PubMed]
  8. Wang, Q.; Zhang, Y.; Chen, G.; Chen, Z.; Hee, H.I. Assessment of heart rate and respiratory rate for perioperative infants based on ELC model. IEEE Sens. J. 2021, 21, 13685–13694. [Google Scholar] [CrossRef]
  9. Chen, Z.; Hu, J.; Yu, C. Fiber senor for long-range and biomedical measurements. In Proceedings of the 2013 12th International Conference on Optical Communications and Networks (ICOCN), Chengdu, China, 26–28 July 2013. [Google Scholar]
  10. Yu, C.; Xu, W.; Zhang, N.; Yu, C. Non-invasive smart health monitoring system based on optical fiber interferometers. In Proceedings of the 2017 16th International Conference on Optical Communications and Networks (ICOCN), Wuzhen, China, 7–10 August 2017. [Google Scholar]
  11. Wang, Q.; Lyu, W.; Cheng, Z.; Yu, C. Noninvasive measurement of vital signs with the optical fiber sensor based on deep learning. J. Light. Technol. 2023, 41, 4452–4462. [Google Scholar] [CrossRef]
  12. Chen, W.; Zhang, Y.; Yang, H.; Qiu, Y.; Li, H.; Chen, Z.; Yu, C. Non-invasive measurement of vital signs based on seven-core fiber interferometer. IEEE Sens. J. 2021, 21, 10703–10710. [Google Scholar] [CrossRef]
  13. Wang, S.; Ni, X.; Li, L.; Wang, J.; Liu, Q.; Yan, Z.; Zhang, L.; Sun, Q. Noninvasive monitoring of vital signs based on highly sensitive fiber optic mattress. IEEE Sens. J. 2020, 20, 6182–6190. [Google Scholar] [CrossRef]
  14. Lyu, W.; Xu, W.; Yang, F.; Chen, S.; Tan, F.; Yu, C. Non-invasive measurement for cardiac variations using a fiber optic sensor. IEEE Photonics Technol. Lett. 2021, 33, 990–993. [Google Scholar] [CrossRef]
  15. Chen, S.; Tan, F.; Lyu, W.; Yu, C. Ballistocardiography monitoring system based on optical fiber interferometer aided with heartbeat segmentation algorithm. Biomed. Opt. Express 2020, 11, 5458–5469. [Google Scholar] [CrossRef] [PubMed]
  16. Yang, F.; Lyu, W.; Pan, C.; Yang, S.; Tan, F.; Chen, S.; Yu, C. Contactless vital signs monitoring based on optical fiber Mach-Zehnder interferometer aided with passive homodyne demodulation methods. In Proceedings of the Asia Communications and Photonics Conference/International Conference on Information Photonics and Optical Communications 2020 (ACP/IPOC), Beijing, China, 24–27 October 2020. [Google Scholar]
  17. Wang, Y.; You, M.; Zhang, Y.; Wu, S.; Zhang, Y.; Yang, H.; Zheng, T.; Chen, X.; Chen, Z.; Xie, X.; et al. Noninvasive measurement of the vital signs of cancer patients with a dual-path microbend fiber sensor. Biomed. Opt. Express 2022, 13, 982–994. [Google Scholar] [CrossRef] [PubMed]
  18. Tahir, S.; Sadek, I.; Abdulrazak, B. A CNN-ELM-Based Method for Ballistocardiogram Classification in a Clinical Environment. In Proceedings of the 2021 IEEE Canadian Conference on Electrical and Computer Engineering (CCECE), Virtual Conference, 12–17 September 2021; pp. 1–6. [Google Scholar] [CrossRef]
  19. Wang, Q.; Lyu, W.; Zhou, J.; Yu, C. Sleep. Condition detection and assessment with optical fiber interferometer based on machine learning. iScience 2023, 26, 107244. [Google Scholar] [CrossRef] [PubMed]
  20. Zhu, C.; Chan, E.A.; Wang, Y.; Peng, W.; Guo, R.; Zhang, B.; Soci, C.; Chong, Y. Image reconstruction through a multimode fiber with a simple neural network architecture. Sci. Rep. 2021, 11, 896. [Google Scholar] [CrossRef] [PubMed]
  21. Borhani, N.; Kakkava, E.; Moser, C.; Psaltis, D. Learning to see through multimode fibers. Optica 2018, 5, 960–966. [Google Scholar] [CrossRef]
  22. Bahrami, M.; Forouzanfar, M. Sleep apnea detection from single-lead ECG: A comprehensive analysis of machine learning and deep learning algorithms. IEEE Trans. Instrum. Meas. 2022, 71, 4003011. [Google Scholar] [CrossRef]
  23. Wang, K.; Xiao, L.; Yi, W.; Ran, S.J.; Xue, P. Experimental realization of a quantum image classifier via tensor-network-based machine learning. Photonics Res. 2021, 9, 2332–2340. [Google Scholar] [CrossRef]
  24. Yan, Q.; Deng, Q.; Zhang, J.; Zhu, Y.; Yin, K.; Li, T.; Wu, D.; Jiang, T. Low-latency deep-reinforcement learning algorithm for ultrafast fiber lasers. Photonics Res. 2021, 9, 1493–1501. [Google Scholar] [CrossRef]
  25. von Rueden, L.; Mayer, S.; Beckh, K.; Georgiev, B.; Giesselbach, S.; Heese, R. Informed Machine Learning—A Taxonomy and Survey of Integrating Knowledge into Learning Systems. arXiv 2019, arXiv:1903.12394. [Google Scholar] [CrossRef]
  26. Mohr, F.; Wever, M.; Tornede, A.; Hüllermeier, E. Predicting machine learning pipeline runtimes in the context of automated machine learning. IEEE Trans. Pattern Anal. Mach. Intell. 2021, 43, 3055–3066. [Google Scholar] [CrossRef]
  27. Yang, Z.; Zhang, T.; Bozchalooi, I.S.; Darve, E. Memory-Augmented Generative Adversarial Networks for Anomaly Detection. IEEE Trans. Neural Netw. Learn. Syst. 2021, 33, 2324–2334. [Google Scholar] [CrossRef]
  28. Guo, Z.; Song, J.K.; Barbastathis, G.; Glinsky, M.E.; Vaughan, C.T.; Larson, K.W.; Alpert, B.K.; Levine, Z.H. Physics-assisted generative adversarial network for X-ray tomography. Opt. Express 2022, 30, 23238–23259. [Google Scholar] [CrossRef]
  29. Wang, Q.; Liu, W.; Chen, X.; Wang, X.; Chen, G.; Zhu, X. Quantification of scar collagen texture and prediction of scar development via second harmonic generation images and a generative adversarial network. Biomed. Opt. Express 2021, 12, 5305–5319. [Google Scholar] [CrossRef]
  30. Hou, B.; Yan, R. Triplet-Classifier GAN for Finger-Vein Verification. IEEE Trans. Instrum. Meas. 2022, 71, 2505112. [Google Scholar] [CrossRef]
  31. Wang, Q.; Liu, W.; Wang, X.; Chen, X.; Chen, G.; Wu, Q. A Spatial-Temporal Graph Model for Pronunciation Feature Prediction of Chinese Poetry. IEEE Trans. Neural Netw. Learn. Syst. 2022, 34, 10294–10308. [Google Scholar] [CrossRef]
  32. An, Y.; Huang, L.; Li, J.; Leng, J.; Yang, L.; Zhou, P. Learning to decompose the modes in few-mode fibers with deep convolutional neural network. Opt. Express 2019, 27, 10127–10137. [Google Scholar] [CrossRef]
  33. Rothe, S.; Zhang, Q.; Koukourakis, N.; Czarske, J. Intensity-only mode decomposition on multimode fibers using a densely connected convolutional network. J. Light. Technol. 2021, 39, 1672–1679. [Google Scholar] [CrossRef]
  34. Li, H.; Chen, C.-H. Effects of Affordance State and Operation Mode on a Smart Washing Machine Touch Sensitive User Interface Design. IEEE Sens. J. 2021, 21, 21956–21967. [Google Scholar] [CrossRef]
  35. Isola, P.; Zhu, J.Y.; Zhou, T.; Efros, A.A. Image-to-image translation with conditional adversarial networks. In Proceedings of the IEEE Conference on Computer Vision and Pattern Recognition, Honolulu, HI, USA, 21–26 July 2017. [Google Scholar]
  36. Wang, Q.; Lyu, W.; Chen, S.; Yu, C. Non-Invasive Human Ballistocardiography Assessment Based on Deep Learning. IEEE Sens. J. 2023, 23, 13702–13710. [Google Scholar] [CrossRef]
  37. Mirza, M.; Osindero, S. Conditional generative adversarial nets. arXiv 2014, arXiv:1411.1784. [Google Scholar]
  38. Xu, B.; Wang, N.; Chen, T.; Li, M. Empirical evaluation of rectified activations in convolutional network. arXiv 2015, arXiv:1505.00853. [Google Scholar]
  39. Venugopalan, J.; Chanani, N.; Maher, K.; Wang, M.D. Novel data imputation for multiple types of missing data in intensive care units. IEEE J. Biomed. Health Inform. 2019, 23, 1243–1250. [Google Scholar] [CrossRef]
  40. Chen, C.; Lu, N.; Jiang, B.; Xing, Y.; Zhu, Z.H. Prediction interval estimation of aeroengine remaining useful life based on bidirectional long short-term memory network. IEEE Trans. Instrum. Meas. 2021, 70, 3527213. [Google Scholar] [CrossRef]
  41. Bucaro, J.A.; Dardy, H.D.; Carome, E.F. Optical fiber acoustic sensor. Appl. Opt. 1977, 16, 1761–1762. [Google Scholar] [CrossRef]
  42. Reja, M.I.; Nguyen, L.V.; Peng, L.; Ebendorff-Heidepriem, H.; Warren-Smith, S.C. Temperature-Compensated Interferometric High-Temperature Pressure Sensor Using a Pure Silica Microstructured Optical Fiber. IEEE Trans. Instrum. Meas. 2022, 71, 7002612. [Google Scholar] [CrossRef]
  43. Takeuchi, S.; Tohara, H.; Kudo, H.; Otsuka, K.; Saito, H.; Uematsu, H.; Mitsubayashi, K. An optic pharyngeal manometric sensor for deglutition analysis. Biomed. Microdevices 2007, 9, 893–899. [Google Scholar] [CrossRef]
  44. Miao, X.; Wu, Y.; Wang, J.; Gao, Y.; Mao, X.; Yin, J. Generative semi-supervised learning for multivariate time series imputation. Proc. AAAI Conf. Artif. Intell. 2021, 35, 8983–8991. [Google Scholar] [CrossRef]
  45. Goodfellow, I.; Pouget-Abadie, J.; Mirza, M.; Xu, B.; Warde-Farley, D.; Ozair, S.; Courville, A.; Bengio, Y. Generative adversarial networks. Commun. ACM 2020, 63, 139–144. [Google Scholar] [CrossRef]
  46. Mogren, O. C-RNN-GAN: Continuous recurrent neural networks with adversarial training. arXiv 2016, arXiv:1611.09904. [Google Scholar]
  47. Yoon, J.; Jarrett, D.; Van der Schaar, M. Time-series generative adversarial networks. Adv. Neural Inf. Process. Syst. 2019, 32, 5508–5518. [Google Scholar]
  48. He, W.; He, Y.; Li, B. Generative adversarial networks with comprehensive wavelet feature for fault diagnosis of analog circuits. IEEE Trans. Instrum. Meas. 2020, 69, 6640–6650. [Google Scholar] [CrossRef]
  49. Huang, Z.; Zhang, J.; Zhang, Y.; Shan, H. DU-GAN: Generative adversarial networks with dual-domain U-Net-based discriminators for low-dose CT denoising. IEEE Trans. Instrum. Meas. 2021, 71, 4500512. [Google Scholar] [CrossRef]
Figure 1. The proposed optical fiber sensor-based monitoring system.
Photonics 11 00707 g001
Figure 2. (a) The extracted heartbeat signal, respiration signal, and acquired BCG signal by the optical fiber sensor. (b) Detailed information of the original BCG signal framed by a red box of (a).
Photonics 11 00707 g002
Figure 3. Architecture of the VS-E2E-GAN model.
Photonics 11 00707 g003
Figure 4. Basic structure of the GRUI module.
Photonics 11 00707 g004
Figure 5. Basic structure of the generator.
Photonics 11 00707 g005
Figure 6. The model performance between different epochs and learning rates. (ac) ACC and AUC performance with different epochs and (df) ACC and AUC performances with different learning rates.
Photonics 11 00707 g006
Table 1. The average results of different methods.
MethodMSEAUCACCTime (min)
C-RNN-GAN [46]0.8010.8330.84017
KNN0.8350.7990.83219
TGAN [47]0.9240.7070.80218
GAN [48]0.8110.8300.83817
DU-GAN [49]0.7900.8680.88517
VS-E2E-GAN0.7770.9010.90810
Disclaimer/Publisher’s Note: The statements, opinions and data contained in all publications are solely those of the individual author(s) and contributor(s) and not of MDPI and/or the editor(s). MDPI and/or the editor(s) disclaim responsibility for any injury to people or property resulting from any ideas, methods, instructions or products referred to in the content.

