Article

Localized Surface Plasmon Resonances of AgAl Alloy Nanoparticles Self-Organized by Annealing of Ag/Al Bilayer Films

by
Dimitrios Ntemogiannis
1,*,
Nikolaos C. Diamantopoulos
1,
Maria Papaggeli
1,
Spyridon Grammatikopoulos
1,2,
Mihail Sigalas
1 and
Panagiotis Poulopoulos
1,*
1
Department of Materials Science, University of Patras, 26504 Patras, Greece
2
Department of Mechanical Engineering, University of Peloponnese, M. Alexandrou 1, 26334 Patras, Greece
*
Authors to whom correspondence should be addressed.
Photonics 2024, 11(8), 713; https://doi.org/10.3390/photonics11080713
Submission received: 8 July 2024 / Revised: 26 July 2024 / Accepted: 29 July 2024 / Published: 30 July 2024
(This article belongs to the Section Optoelectronics and Optical Materials)

Abstract

:
Plasmonic applications have traditionally relied on noble metals such as gold (Au) and silver (Ag) for their excellent plasmonic performance in the visible and near-infrared spectrum. However, these metals are costly, scarce, and have limitations such as low stability (Ag) and interband transition losses, which restrict their spectral range. To address these issues, alternative plasmonic materials have been explored. One such material is aluminum (Al), which is inexpensive, abundant, and exhibits remarkable plasmonic properties in the UV region as well as wide tunability. Al is also compatible with complementary metal–oxide semiconductor (CMOS) fabrication processes and is very stable due to its ultrathin native oxide layer. Alloying different metals can combine their advantageous properties, resulting in enhanced tunable optical characteristics. This study investigates the LSPR properties of AgAl alloy nanoparticles grown after the annealing of precursor AgAl bilayer films. Interestingly, LSPRs were also observed in some cases for the as-deposited bilayers. The experimental results were complemented with simulations conducted via the rigorous coupled-wave analysis (RCWA) method. The investigated materials could be potentially useful for applications in energy harvesting or color printing.

1. Introduction

Plasmonics is a highly dynamic field that focuses on the manipulation and control of light at the nanoscale. A key phenomenon within plasmonics is localized surface plasmon resonance (LSPR), which occurs when conduction electrons on the surface of metallic nanoparticles (NPs) or other nanostructures oscillate collectively in resonance with incident light. This resonance can lead to confinement and significant enhancement of the local electromagnetic field in the vicinity of a metallic nanostructure, resulting in the intense absorption and scattering of light [1]. These unique properties have enabled a plethora of applications, including sensing [2,3,4,5,6], catalysis [7,8,9], optoelectronics [10,11,12], and photovoltaics [13,14,15], as well as biomedical applications such as imaging, drug delivery, and photothermal therapy, [16,17,18] among others [19,20,21].
Traditionally, noble metals such as silver (Ag) and gold (Au) have dominated research in the field of plasmonics due to their remarkable dielectric properties in the visible and near-infrared spectral regions. Silver, in particular, has high electrical conductivity and low optical losses, resulting in sharp and intense LSPRs in the visible spectrum. However, silver is prone to oxidation and sulfur contamination, which limits its long-term utility. Additionally, nanoparticles of noble metals such as silver can be fabricated via numerous methods [22,23,24], yet they are incompatible with traditional silicon fabrication processes such as complementary metal–oxide semiconductors (CMOS), and their high cost inhibits their practical applications on a large scale. Lastly, interband transition losses restrict the use of Ag nanostructures for applications in the UV region [25,26,27].
These limitations have sparked the exploration of alternative plasmonic materials [25,26,28,29]. In this context, aluminum has emerged as a promising alternative due to its abundance, low cost, and tunable plasmonic resonances that span from the ultraviolet to the visible spectrum and even into the near-infrared. Furthermore, Al is more resistant to oxidation compared to Ag, offering better stability due to the formation of a self-limiting native oxide layer (Al2O3). Moreover, Al can improve the adhesion of silver in the substrate, and it is also compatible with complementary metal–oxide semiconductor (CMOS) processes, which allow for cost-effective, large-scale production [20,25,27,30,31,32,33,34,35,36,37,38,39]. Aluminum nanostructures have been utilized for various applications, including biosensing [5], deep-UV LEDs [12], light harvesting [27,35], UV surface-enhanced Raman spectroscopy [40], metal-enhanced fluorescence in the UV [41], plasmonic color filters [30], color printing surface-enhanced Raman spectroscopy (SERS) [42] and more, as described in references [5,12,19,25,26,27,28,30,31,32,33,34,35,36,37] and the references therein.
However, despite the aforementioned benefits, Al has some limitations in terms of plasmonic performance compared to noble metals, primarily due to higher intrinsic losses and lower carrier density.
To overcome the limitations associated with single-metal plasmonic nanoparticles, alloying has emerged as an effective approach to enhance and tailor plasmonic properties. Alloying can combine the advantageous characteristics of different metals, leading to materials with tunable optical properties and improved chemical stability, which are also sustainable and cost-effective. The fabrication of plasmonic alloy nanoparticles can be useful for various applications such as energy harvesting, sensing, and catalysis [43,44].
In this context, our study focuses on AgAl alloy nanoparticles. By combining Ag and Al nanoparticles, it is possible to harness the superior plasmonic performance of Ag while benefiting from the extended spectral range and affordability of Al. Such materials could be useful for energy harvesting and color printing applications. AgAl alloy nanoparticles have been previously utilized to produce tunable LSPRs, with Al acting as a dopant element to Ag nanoparticles [27,45,46,47]. However, the fundamental LSPR properties of the specific alloy have not received significant attention in the literature.
Here, we investigate the LSPR response of AgAl alloy NPs grown by the initial deposition and subsequent thermal annealing of Ag/Al bilayers. We examined a range of alloy compositions (16.6% Al–33.3% Al), which could be determined by the individual layer thicknesses. Because Ag and Al have FCC structures with very similar lattice constants (1% difference), the ratio of layer thicknesses is the same as the ratio of atoms, so one can directly determine the at. % concentrations with satisfactory accuracy. This study aims to offer insights into the LSPR properties of a materials system that has tunable optical properties and is more economical than traditional plasmonic materials such as pure noble metals. Our goal was to provide a general overview of the LSPR behavior of AgAl NPs using a wide range of NP sizes and alloy compositions rather than investigating specific parameter dependencies. Interestingly, LSPRs were observed over a broad spectral range. Finally, theoretical calculations conducted using the rigorous coupled-wave analysis (RCWA) complement and support the experimental findings.

2. Materials and Methods

2.1. Experimental Details

AgAl bilayers of various thicknesses were deposited by radio frequency magnetron sputtering under high vacuum conditions (base pressure 4 × 10⁻⁷ mbar). During deposition, argon was inserted into the chamber, increasing the total pressure to 3 × 10⁻³ mbar. Ag and Al targets were placed on two sputtering heads (the Torus 2 HV circular sputtering source of Kurt J. Lesker Company, Jefferson Hills, PA, USA). The deposition rates have been calibrated from previous experiments based on the deposition time; however, to ensure precision, we verified the thickness values by utilizing atomic force microscopy (AFM) images of the profile of a narrow scratch made intentionally on an as-deposited Ag film surface [48]. Al layers were deposited first in all cases, followed by the deposition of Ag layers on top of them. Subsequently, all specimens were thermally annealed at 440 °C in a muffle furnace (model Linn 63 Elektronik VMK 22) in air. The furnace was preheated to 440 °C for 30 min to ensure stable and uniform heating. The annealing temperature (440 °C) remained stable for the specified duration for each case. The annealing duration for each specimen was selected based on its total thickness according to previous studies [48,49,50,51,52]. In these studies, self-assembled silver, gold, or alloy (AgPd) NPs were grown after the annealing of films or multilayers of similar thicknesses under similar conditions. Thinner bilayers have smaller diffusion barriers compared to thicker ones, making short-time annealing more effective for them. Conversely, short-time annealing in thicker bilayers could result in incomplete dewetting. Therefore, to ensure complete dewetting, we annealed the thicker bilayers for longer periods.
The morphology of the bilayers was studied before and after annealing by atomic force microscopy (AFM) using a multimode microscope with a Nanoscope IIIa controller and a 120 µm × 120 µm magnet-free scanner (Model AS-130 VMF) developed by Digital Instruments (Chapel Hill, NC, USA). The microscope was operated in the non-contact (tapping) mode.
Finally, the ultraviolet–visible (UV–vis) spectra were recorded at room temperature using a Shimadzu UV–Vis Spectrophotometer, Model UV 1800 (Shimadzu, Kyoto, Japan), in the wavelength range of 200–1100 nm. Table 1 summarizes the bilayers deposited, their total thickness, individual layer thicknesses, and annealing times, providing a clear summary of the investigated specimens. Additionally, we present the nominal values of their composition based on the individual layer thicknesses.

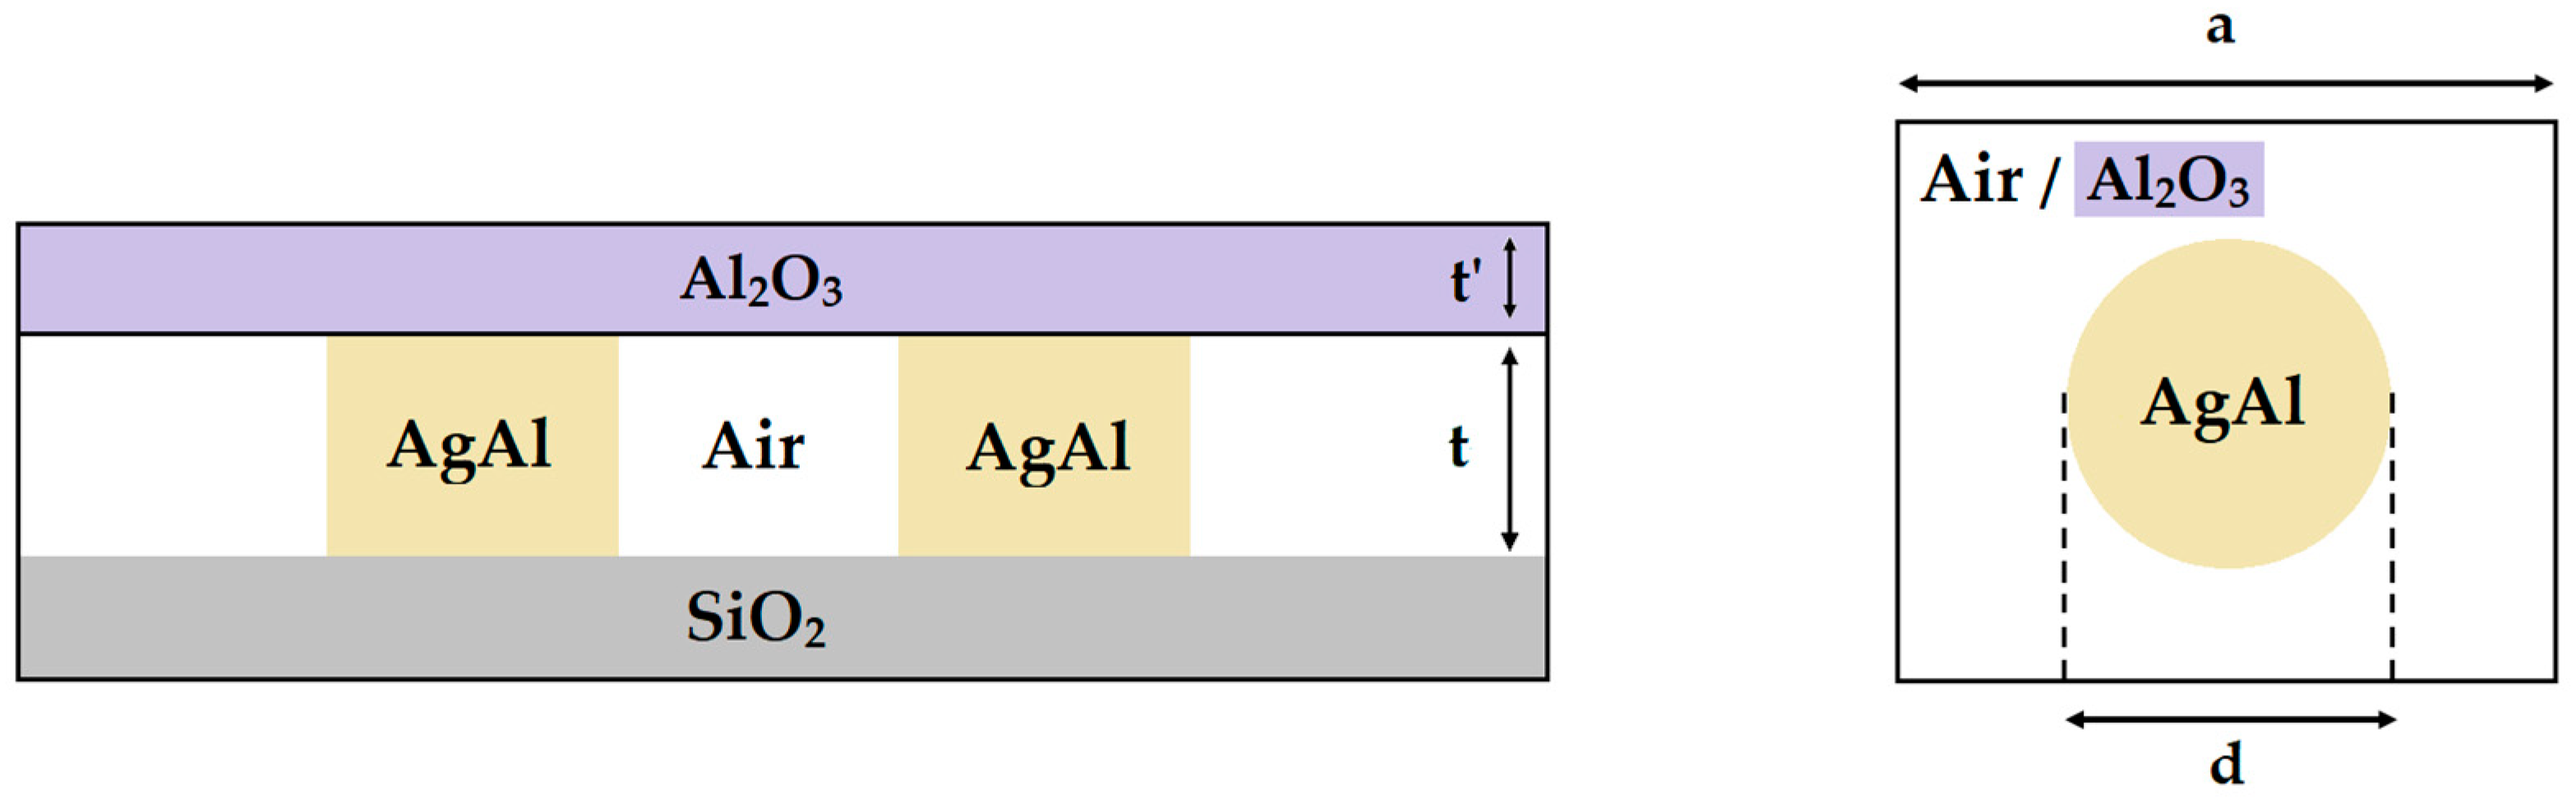
2.2. Theoretical Model

The system under investigation is depicted in Figure 1. The NPs are represented as cubes and cylinders, as this approach reduces computational time when employing the RCWA method [49]. Further details regarding the theoretical model used in this study can be found in previous works [48,50,51,53], with reference [50] specifically explaining the calculation approach for alloyed NPs. The AgAl NPs were situated on a SiO2 substrate surrounded by air. For the cases where the Al2O3 native oxide layer was also considered, it was located on top of the NPs.
Previous studies [52,53] have indicated that, despite the non-periodical behavior of experimentally fabricated materials, there is a good agreement between the theoretical and experimental results. Calculating experimentally observed disordered structures is very challenging, if not impossible, as it involves performing computations within a large supercell, which requires significant time and memory resources. Here, a periodic array between nanoparticles was employed since the experimental findings indicate that nanoparticles are typically positioned in close proximity to each other. Therefore, calculating an individual metal nanoparticle would be unreliable.

3. Results and Discussion

3.1. Experimental Results

The ultrathin Ag/Al bilayers deposited had total thicknesses ranging from 7 to 18 nm. Figure 2a,b shows the UV–vis absorbance spectra as a function of photon energy for all bilayers, both before (Figure 2a) and after annealing (Figure 2b).
Figure 2a reveals that the as-deposited bilayers exhibited pronounced LSPRs for the three thinner specimens (Ag/Al #2, #3, and #4), located at 1.63, 2.25, and 2.50 eV, respectively. The intensity of these LSPRs appears to be larger, and their resonance position shifts to lower energy values with increasing thickness. On the contrary, the thickest specimen (Ag/Al #1) showed a typical absorbance curve characteristic of a continuous film. Although there is a slight curvature in its absorbance curve around 1.75 eV, it cannot be considered a resonance. The above observations could indicate that the bilayer films (Ag/Al #2, #3, and #4) were nanostructured due to their very small thickness, while the thicker bilayer grew as a continuous film instead, most probably owing to its much larger total thickness. This assumption is further supported by Figure 3a,b for the Ag/Al #3 bilayer, which shows an AFM image of its surface in the as-deposited state, revealing the formation of NPs. On the other hand, Figure 3d shows the growth of a semi-continuous film for Ag/Al #1. We use this term because, although small NPs can be observed, there is also a continuous layer between them. Figure 3a–f shows AFM images of the surface of the as-deposited bilayers Ag/Al #1 and #3, along with their respective NP diameter distributions. Additionally, in Figure 4a,b, we provide some indicative line profiles of randomly selected NPs for each specimen. The NP shape appears to be distorted and flattened hemispheres.
Based on the absorbance spectra, we could argue that the other two as-deposited specimens, Ag/Al #2 and #4, have a nanostructured surface morphology similar to Ag/Al #3.
After annealing, all LSPRs obtained were broader, dampened, and blue-shifted compared to those of the as-deposited specimens. This obviously concerns the three thinner bilayers since the thickest (Ag/Al #1) did not present LSPRs in the as-deposited state. For Ag/Al #1, #2, #3, and #4, the LSPRs were located at 1.74, 2.63, 2.68, and 2.56 eV, respectively. Notably, a secondary peak was observed at 3.43 eV for Ag/Al #2. These LSPR position values are similar to the ones observed in Ag-nanostructured films of comparable thickness and annealing conditions [48,49,51,52]. However, the LSPR intensity of the alloy AgAl NPs is significantly lower. This could be attributed to losses introduced by the Al.
The resonance position and intensity followed a similar dependence on thickness, as observed for the as-deposited bilayers. However, there were some differences. More specifically, for the very thick Ag/Al #1, even though its LSPR position was located at lower energy, its intensity was lower than Ag/Al #2. This is probably due to the very large diameter of its NPs and their non-perfectly spherical shape. Additionally, the NPs appeared interconnected in some cases. In contrast, the Ag/Al #2 sample contained several large NPs with significant height, which could justify the higher resonance intensity. Furthermore, for the thinnest Ag/Al #4, while its absorbance was the lowest, its peak was located at 2.56 eV, a lower energy value than the ones of the initially thicker Ag/Al #2,3 bilayers. The Ag/Al #4 had a very sparse NP distribution with the smallest average NP diameter. Furthermore, the height of its NPs was low, with some exceptions of a few elongated NPs. These characteristics might be responsible for the resulting weak and broad absorbance curve. The NP shape was disordered similarly to Ag/Al #1, possibly explaining the position of its peak. Figure 5a–l shows the AFM images of the surface of the thermally annealed bilayers at 440 °C, along with their respective NP diameter distributions. Following, Figure 6a–d shows some indicative line profiles of randomly selected NPs for all annealed specimens. This provides better insights into the NP shape, which appears to be distorted and flattened hemispheres, similar to what was observed for the as-deposited ones in Figure 4a,b.
Interestingly, for the Ag/Al #1 #4 specimens, annealing resulted in very broad and weak absorbance curves. In contrast, for the Ag/Al #2 and #3 bilayers, the LSPRs were better defined, especially for the Ag/Al #2. However, their intensity was also low. The NP morphology of these specimens could justify this behavior. The Ag/Al #1 and #4 bilayers resulted in disordered nanostructures and interconnected particles in some cases (Figure 5a,b,j,k), which could explain their inferior LSPR quality. Conversely, the other two bilayers (Ag/Al #2, #3) had better-defined NPs (Figure 5d,e,g,h). Notably, several very large NPs with significant heights were present among smaller ones in these two specimens. This morphology might be responsible for the pronounced LSPRs, which were more evident for Ag/Al #2.
According to the aforementioned, one could conclude that the Al-rich samples tend to result in nanostructures with distorted shapes and small heights, exhibiting broader and weaker resonances. However, we cannot unambiguously claim this since this result could be influenced by a combination of factors. These include the total bilayer thickness, the individual layer thickness (which by extension determines the alloy composition), as well as the annealing conditions and the substrate used. However, investigating the effect of each individual parameter was out of the scope of this study. Instead, as stated in the introduction, our goal was to provide a general overview of the LSPR behavior of AgAl NPs using a wide range of NP sizes and alloy compositions.
At this point, we have to take into consideration that upon annealing in air, Al migrates from the bottom to the top of the Ag layer, where it reacts with residual oxygen to form an Al2O3 passivation layer [54,55,56,57]. When the annealing takes place in a different ambient, for example, NH3, at specific temperatures, an Al-oxynitride can be formed instead [56,57]. However, this does not apply to our case. This phenomenon is observed after annealing, but it could also occur even at room temperature [54]. The Al2O3 overlayer can offer stability to the nanostructured system, but it also affects its LSPR properties due to the change in the refractive index of the surrounding environment.
Furthermore, the formation of the Al2O3 layer, can be controlled through annealing parameters, as its thickness depends both on the annealing time and temperature. Additionally, Al segregation becomes faster with increased annealing temperatures [54], consequently accelerating the formation of the oxide overlayer. The Al layer thickness also influences the Ag/Al bilayer system, as it can reduce the SiO2 substrate, leading to free O that reacts with the diffused Al. This reaction can cause the increased trapping of Al inside the Ag instead of diffusing to the surface, thus limiting the surface oxide thickness [56]. However, in our study, this effect can be neglected since all individual Al layers were very thin (≤6 nm). Furthermore, the overall oxide layer thickness in the studied specimens is expected to be very low, with only minor differences, despite the significant variations in annealing times. This is due to the stable annealing temperature and the very thin Al layers with a minimal thickness variation among the specimens. Further details on the formation mechanism of the aluminum oxide surface layer can be found in references [54,55,56,57].
It is important to note that the LSPRs observed in our results span from 1.63 eV up to 2.68 eV, a range that covers most of the visible spectrum up until the beginning of the near-infrared. Considering the above, by carefully adjusting the annealing parameters, bilayer thickness, and composition, one can obtain LSPRs across a wide spectral range. Therefore, the simple and cost-effective approach utilized here has significant optimization potential to fabricate tailored Ag/Al bilayers and AgAl NP systems with the desired LSPR response. Such materials could be very useful for various plasmonic applications, including energy harvesting and color printing.

3.2. Theoretical Results

In this section, we present the theoretical findings of our study. Based on the experimental data, we simulated the LSPR behavior of the experimentally grown AgAl alloy NPs. The geometry parameters were determined from the NP morphology observed in the AFM images of each specimen. The simulations include all the thermally annealed bilayers.
We have to take into consideration the fact that theoretical studies on Al nanoparticles produce results with big discrepancies compared to the experimental ones [33]. Additionally, as we mentioned in Section 2.2, it is very difficult to simulate the experimentally fabricated disordered structures. Therefore, we did not expect an exact reproduction of the plasmonic behavior of the disordered nanostructures that were fabricated experimentally, but we tried to reproduce the experimental trends.
Figure 7a–d show the calculated absorbance spectra of AgAl alloy NPs for every fabricated specimen. Additionally, the experimental absorbance spectra are also plotted to compare them directly with the simulated results. In all simulations, we considered a case where a thin Al2O3 layer was present on top of the alloy NPs and a case where it was replaced by air. An indicative thickness of t’ = 0.5 nm was selected since the Al layers were very thin (≤6 nm). For increased annealing times and thicker Al layers, this oxide layer was expected to be thicker. However, this increased thickness could only slightly increase its effect on the overall absorbance. Figure 7a concerns the Ag/Al #1 specimen. The diameter (d) was set at d = 60 nm, the lattice constant (a) was a = 80 nm, and the NP height (t) was t = 20 nm. The calculated LSPRs showed significant differences in terms of the LPSR position and intensity. However, a very broad absorbance curve was observed, as was also the case in the experimental results. The disordered nanostructures with not perfectly spherical shapes and interconnected particles that were obtained after annealing of this specimen might be responsible for these large deviations.
Figure 7b concerns the Ag/Al #2 specimen. The NP geometry parameters were d = 45 nm, a = 90 nm, and t = 11 nm. The calculated LSPR position and intensity were very close to the experimental one, with only a 4% deviation for both calculated cases. The calculated LSPRs were found at slightly lower energies and were more intense compared to the experimental ones. For the case where Al2O3 was included, it resulted in a small redshift, accompanied by a small increase in the intensity compared to the net AgAl NPs. Similarly, for Ag/Al #3, where d = 35 nm, a = 105 nm, and t = 11 nm, there was a good agreement between the experimental and theoretical results, as Figure 7c revealed. The calculated absorbance curves had slightly bigger intensities, and the addition of the Al2O3 layer resulted in the typical redshift and intensity increase. For Ag/Al #4, however, the calculated absorbance had larger discrepancies compared to the experimental ones. In this case, d was 32 nm, a = 120 nm, and t = 13 nm. The calculated peak intensity was 0.787 compared to the experimental 0.439. However, we have to consider the morphology of the Ag/Al #4 specimen (Figure 5j,k), which shows a very sparse NP distribution with some areas with closely packed NPs and other wide areas without any NPs or only a few NPs present. This randomness in the arrangement of the NPs is likely to have caused bigger deviations when compared to the previous cases. For the Al2O3-covered one, the peak was once more slightly red-shifted, and the intensity slightly increased. However, the absorbance position had a much smaller discrepancy, of 14.6% and 14% for the net AgAl NPs and the Al2O3-covered NPs, respectively.
Overall, the theoretical results reflected the experimentally observed trends with minor deviations. Notably, for the Al-rich Ag/Al #1 and #4 specimens, discrepancies were larger, while the calculations for the specimens with reduced Al content showed a better alignment with the experimental findings. The AgAl alloy NPs with reduced Al content exhibited sharper plasmonic resonances, as the experimental findings showed, and their LSPRs could be easier reproduced by simulations. This could be a consequence of the fact that, after annealing, these NPs were well-defined (Figure 5d,e,g,h), as discussed in Section 3.1. Conversely, the Al-rich bilayers produced disordered nanostructures with not perfectly spherical shapes and interconnected particles in some cases (Figure 5a,b,j,k). The absorbance of this complex morphology is very difficult to simulate with the employed model.
Finally, to provide a more comprehensive overview of the plasmonic behavior of the system, we performed additional calculations for different values of d over a (d/a). This allows us to study the size distribution of the NPs since it is not possible to incorporate the effect of the particle size distribution into the model. In a previous study [53], we demonstrated that the LSPR position has a negligible dependence on the lattice constant. Therefore, we maintained constant values for the lattice constant (a = 90 nm) and NP height (t = 15 nm) and calculated the absorbance spectra for an indicative alloy composition of 71.4 % Ag, 28.6 % Al, and d/a values of 0.75, 0.50, 0.33, and 0.27. These ratios were selected based on the experimental data. Figure 8 shows the calculated spectra for the different d/a values.
The calculated spectra revealed that denser NP distributions of larger NPs result in more pronounced LSPRs located at lower energies. Interestingly, the sparser distributions (d/a = 0.33, 0.27) of smaller NPs exhibited a behavior similar to that of Ag/Al #4, which had the sparsest distribution and smallest NPs observed experimentally. However, because the Al2O3 layer was not considered here, we understand that these absorbance curves would be slightly red-shifted and enhanced in terms of intensity. The latter results show good alignment with the experimental findings. To gain even further insights into this system, we simulated the effect of the alloy composition. Figure 9 shows the calculated absorbance for the three nominal alloy compositions used experimentally. The geometrical parameters remained constant in all cases (d = 45 nm, a = 90nm, and t = 15 nm).
Al-rich NPs resulted in broader and weaker resonances located at smaller energies. Based on this, we can partially interpret the experimental results shown in Figure 2b (which showed broader and weaker LSPRs for the Al-rich specimens and more pronounced ones for the others). However, the fact that our experimentally grown NPs had distorted shapes in the cases of the Al-rich specimens has contributed significantly to their observed LPSR behavior. This morphology, however, seems to not be directly correlated only with the alloy composition but rather a combination of parameters, as discussed in the experimental results. Therefore, further research focusing on parameter dependencies is recommended to understand the plasmonic behavior of this promising materials system fully.

4. Conclusions

In this study, the LSPR properties of AgAl alloy nanoparticles grown after the annealing of AgAl bilayer films were investigated. The LSPR intensity and position of the annealed specimens showed a dependence on the initial bilayer thickness and NP morphology. Interestingly, LSPRs were, in some cases, observed for the as-deposited bilayers as well, displaying a similar dependence to the annealed ones. LSPRs were obtained in a large spectral range (1.63–2.68 eV), covering most of the visible spectrum up until the near-infrared. The experimental results were complemented with theoretical calculations performed via the rigorous coupled-wave analysis (RCWA) method. The simulations also considered the existence of an Al2O3 layer on top of the alloy NPs, reproducing the experimentally observed LSPR behavior with minor discrepancies. However, for some specimens, we observed larger deviations. This materials system shows significant tunability potential based on the bilayer thickness, composition, and annealing parameters. The investigated materials could be useful for plasmonic applications, including energy harvesting and color printing. Future research could focus on examining each adjustable parameter of this system individually to gain a deeper understanding of its LSPR behavior. Finally, future work could involve testing these materials in functional devices and evaluating their performance.

Author Contributions

Conceptualization, P.P. and D.N.; methodology, N.C.D.; software, D.N. and M.S.; formal analysis, N.C.D. and M.P.; investigation, M.P.; resources, P.P. and M.S.; data curation, N.C.D. and D.N.; writing—original draft preparation, D.N.; writing—review and editing, D.N. and P.P.; visualization, S.G.; supervision, P.P.; project administration, S.G. and M.S. All authors have read and agreed to the published version of the manuscript.

Funding

This research received no external funding.

Institutional Review Board Statement

Not applicable.

Informed Consent Statement

Not applicable.

Data Availability Statement

Data are contained within the article.

Acknowledgments

V. Karoutsos is acknowledged for their AFM experiments.

Conflicts of Interest

The authors declare no conflicts of interest.

References

  1. Hutter, E.; Fendler, J.H. Exploitation of Localized Surface Plasmon Resonance. Adv. Mater. 2004, 16, 1685–1706. [Google Scholar] [CrossRef]
  2. Mayer, K.M.; Hafner, J.H. Localized Surface Plasmon Resonance Sensors. Chem. Rev. 2011, 111, 3828–3857. [Google Scholar] [CrossRef] [PubMed]
  3. Kim, D.M.; Park, J.S.; Jung, S.-W.; Yeom, J.; Yoo, S.M. Biosensing Applications Using Nanostructure-Based Localized Surface Plasmon Resonance Sensors. Sensors 2021, 21, 3191. [Google Scholar] [CrossRef] [PubMed]
  4. Takimoto, Y.; Monkawa, A.; Nagata, K.; Gessei, T.; Kobayashi, M.; Kinoshita, M.; Mori, T.; Kagi, H. Localized Surface Plasmon Resonance Sensing of SO2 and H2S Using Zeolitic Imidazolate Framework-8. Sens. Actuators B Chem. 2023, 383, 133585. [Google Scholar] [CrossRef]
  5. Li, W.; Ren, K.; Zhou, J. Aluminum-Based Localized Surface Plasmon Resonance for Biosensing. TrAC Trends Anal. Chem. 2016, 80, 486–494. [Google Scholar] [CrossRef]
  6. Boruah, B.S.; Ojah, N.; Biswas, R. Bio-Inspired Localized Surface Plasmon Resonance Enhanced Sensing of Mercury Through Green Synthesized Silver Nanoparticle. J. Light. Technol. 2020, 38, 2086–2091. [Google Scholar] [CrossRef]
  7. Li, S.; Miao, P.; Zhang, Y.; Wu, J.; Zhang, B.; Du, Y.; Han, X.; Sun, J.; Xu, P. Recent Advances in Plasmonic Nanostructures for Enhanced Photocatalysis and Electrocatalysis. Adv. Mater. 2021, 33, 2000086. [Google Scholar] [CrossRef] [PubMed]
  8. Lemos De Souza, M.; Pereira Dos Santos, D.; Corio, P. Localized Surface Plasmon Resonance Enhanced Photocatalysis: An Experimental and Theoretical Mechanistic Investigation. RSC Adv. 2018, 8, 28753–28762. [Google Scholar] [CrossRef]
  9. Zhao, J.; Xue, S.; Ji, R.; Li, B.; Li, J. Localized Surface Plasmon Resonance for Enhanced Electrocatalysis. Chem. Soc. Rev. 2021, 50, 12070–12097. [Google Scholar] [CrossRef]
  10. Liang, Z.; Sun, J.; Jiang, Y.; Jiang, L.; Chen, X. Plasmonic Enhanced Optoelectronic Devices. Plasmonics 2014, 9, 859–866. [Google Scholar] [CrossRef]
  11. Kunwar, S.; Pandit, S.; Jeong, J.-H.; Lee, J. Improved Photoresponse of UV Photodetectors by the Incorporation of Plasmonic Nanoparticles on GaN Through the Resonant Coupling of Localized Surface Plasmon Resonance. Nano-Micro Lett. 2020, 12, 91. [Google Scholar] [CrossRef] [PubMed]
  12. Lee, J.W.; Ha, G.; Park, J.; Song, H.G.; Park, J.Y.; Lee, J.; Cho, Y.-H.; Lee, J.-L.; Kim, J.K.; Kim, J.K. AlGaN Deep-Ultraviolet Light-Emitting Diodes with Localized Surface Plasmon Resonance by a High-Density Array of 40 Nm Al Nanoparticles. ACS Appl. Mater. Interfaces 2020, 12, 36339–36346. [Google Scholar] [CrossRef] [PubMed]
  13. Atwater, H.A.; Polman, A. Plasmonics for Improved Photovoltaic Devices. Nat. Mater. 2010, 9, 205–213. [Google Scholar] [CrossRef] [PubMed]
  14. Fei Guo, C.; Sun, T.; Cao, F.; Liu, Q.; Ren, Z. Metallic Nanostructures for Light Trapping in Energy-Harvesting Devices. Light. Sci. Appl. 2014, 3, e161. [Google Scholar] [CrossRef]
  15. Huang, C.-L.; Kumar, G.; Sharma, G.D.; Chen, F.-C. Plasmonic Effects of Copper Nanoparticles in Polymer Photovoltaic Devices for Outdoor and Indoor Applications. Appl. Phys. Lett. 2020, 116, 253302. [Google Scholar] [CrossRef]
  16. Kim, M.; Lee, J.; Nam, J. Plasmonic Photothermal Nanoparticles for Biomedical Applications. Adv. Sci. 2019, 6, 1900471. [Google Scholar] [CrossRef] [PubMed]
  17. Sharifi, M.; Attar, F.; Saboury, A.A.; Akhtari, K.; Hooshmand, N.; Hasan, A.; El-Sayed, M.A.; Falahati, M. Plasmonic Gold Nanoparticles: Optical Manipulation, Imaging, Drug Delivery and Therapy. J. Control. Release 2019, 311–312, 170–189. [Google Scholar] [CrossRef] [PubMed]
  18. Li, Z.-H.; Chen, Y.; Sun, Y.; Zhang, X.-Z. Platinum-Doped Prussian Blue Nanozymes for Multiwavelength Bioimaging Guided Photothermal Therapy of Tumor and Anti-Inflammation. ACS Nano 2021, 15, 5189–5200. [Google Scholar] [CrossRef] [PubMed]
  19. Zhou, L.; Tan, Y.; Wang, J.; Xu, W.; Yuan, Y.; Cai, W.; Zhu, S.; Zhu, J. 3D Self-Assembly of Aluminium Nanoparticles for Plasmon-Enhanced Solar Desalination. Nat. Photon 2016, 10, 393–398. [Google Scholar] [CrossRef]
  20. Tan, S.J.; Zhang, L.; Zhu, D.; Goh, X.M.; Wang, Y.M.; Kumar, K.; Qiu, C.-W.; Yang, J.K.W. Plasmonic Color Palettes for Photorealistic Printing with Aluminum Nanostructures. Nano Lett. 2014, 14, 4023–4029. [Google Scholar] [CrossRef]
  21. Ta, N.; Huang, J.-Y.; He, S.; Hanggai, W.; Chao, L.-M. Applications of Optical Control Materials Based on Localized Surface Plasmon Resonance Effect in Smart Windows. Tungsten 2024, 1–21. [Google Scholar] [CrossRef]
  22. Nguyen, N.P.U.; Dang, N.T.; Doan, L.; Nguyen, T.T.H. Synthesis of Silver Nanoparticles: From Conventional to ‘Modern’ Methods—A Review. Processes 2023, 11, 2617. [Google Scholar] [CrossRef]
  23. Huang, C.-L.; Ji Huang, H.; Chen, S.-H.; Huang, Y.-S.; Kao, P.-C.; Chou Chau, Y.-F.; Chiang, H.-P. Localized Surface Plasmon Resonance Enhanced by the Light-Scattering Property of Silver Nanoparticles for Improved Luminescence of Polymer Light-Emitting Diodes. J. Ind. Eng. Chem. 2021, 103, 283–291. [Google Scholar] [CrossRef]
  24. Chen, S.-H.; Yu, C.-F.; Wang, C.-J.; Chen, S.-H.; Chen, Y.-D.; Chen, T.-C.; Lin, C.-F. Light Enhancement of Plasmonic Nano-Structure for PLEDs at RGB Wavelengths. Org. Electron. 2016, 38, 337–343. [Google Scholar] [CrossRef]
  25. West, P.R.; Ishii, S.; Naik, G.V.; Emani, N.K.; Shalaev, V.M.; Boltasseva, A. Searching for Better Plasmonic Materials. Laser Photon. Rev. 2010, 4, 795–808. [Google Scholar] [CrossRef]
  26. Naik, G.V.; Shalaev, V.M.; Boltasseva, A. Alternative Plasmonic Materials: Beyond Gold and Silver. Adv. Mater. 2013, 25, 3264–3294. [Google Scholar] [CrossRef]
  27. Parashar, P.K.; Komarala, V.K. Engineered Optical Properties of Silver-Aluminum Alloy Nanoparticles Embedded in SiON Matrix for Maximizing Light Confinement in Plasmonic Silicon Solar Cells. Sci. Rep. 2017, 7, 12520. [Google Scholar] [CrossRef] [PubMed]
  28. Hopper, E.R.; Boukouvala, C.; Asselin, J.; Biggins, J.S.; Ringe, E. Opportunities and Challenges for Alternative Nanoplasmonic Metals: Magnesium and Beyond. J. Phys. Chem. C 2022, 126, 10630–10643. [Google Scholar] [CrossRef] [PubMed]
  29. Zhu, X.; Imran Hossain, G.M.; George, M.; Farhang, A.; Cicek, A.; Yanik, A.A. Beyond Noble Metals: High Q-Factor Aluminum Nanoplasmonics. ACS Photonics 2020, 7, 416–424. [Google Scholar] [CrossRef]
  30. Shrestha, V.R.; Lee, S.-S.; Kim, E.-S.; Choi, D.-Y. Aluminum Plasmonics Based Highly Transmissive Polarization-Independent Subtractive Color Filters Exploiting a Nanopatch Array. Nano Lett. 2014, 14, 6672–6678. [Google Scholar] [CrossRef]
  31. Sobhani, A.; Manjavacas, A.; Cao, Y.; McClain, M.J.; García De Abajo, F.J.; Nordlander, P.; Halas, N.J. Pronounced Linewidth Narrowing of an Aluminum Nanoparticle Plasmon Resonance by Interaction with an Aluminum Metallic Film. Nano Lett. 2015, 15, 6946–6951. [Google Scholar] [CrossRef]
  32. Knight, M.W.; Liu, L.; Wang, Y.; Brown, L.; Mukherjee, S.; King, N.S.; Everitt, H.O.; Nordlander, P.; Halas, N.J. Aluminum Plasmonic Nanoantennas. Nano Lett. 2012, 12, 6000–6004. [Google Scholar] [CrossRef] [PubMed]
  33. Knight, M.W.; King, N.S.; Liu, L.; Everitt, H.O.; Nordlander, P.; Halas, N.J. Aluminum for Plasmonics. ACS Nano 2014, 8, 834–840. [Google Scholar] [CrossRef] [PubMed]
  34. Lecarme, O.; Sun, Q.; Ueno, K.; Misawa, H. Robust and Versatile Light Absorption at Near-Infrared Wavelengths by Plasmonic Aluminum Nanorods. ACS Photonics 2014, 1, 538–546. [Google Scholar] [CrossRef]
  35. Lee, M.; Kim, J.U.; Lee, K.J.; Ahn, S.; Shin, Y.-B.; Shin, J.; Park, C.B. Aluminum Nanoarrays for Plasmon-Enhanced Light Harvesting. ACS Nano 2015, 9, 6206–6213. [Google Scholar] [CrossRef] [PubMed]
  36. Shimanoe, K.; Endo, S.; Matsuyama, T.; Wada, K.; Okamoto, K. Localized Surface Plasmon Resonance in Deep Ultraviolet Region below 200 Nm Using a Nanohemisphere on Mirror Structure. Sci. Rep. 2021, 11, 5169. [Google Scholar] [CrossRef] [PubMed]
  37. Maidecchi, G.; Gonella, G.; Proietti Zaccaria, R.; Moroni, R.; Anghinolfi, L.; Giglia, A.; Nannarone, S.; Mattera, L.; Dai, H.-L.; Canepa, M.; et al. Deep Ultraviolet Plasmon Resonance in Aluminum Nanoparticle Arrays. ACS Nano 2013, 7, 5834–5841. [Google Scholar] [CrossRef] [PubMed]
  38. Olson, J.; Manjavacas, A.; Liu, L.; Chang, W.-S.; Foerster, B.; King, N.S.; Knight, M.W.; Nordlander, P.; Halas, N.J.; Link, S. Vivid, Full-Color Aluminum Plasmonic Pixels. Proc. Natl. Acad. Sci. USA 2014, 111, 14348–14353. [Google Scholar] [CrossRef] [PubMed]
  39. Gérard, D.; Gray, S.K. Aluminium Plasmonics. J. Phys. D Appl. Phys. 2015, 48, 184001. [Google Scholar] [CrossRef]
  40. Raja, S.S.; Cheng, C.-W.; Gwo, S. Low-Loss Aluminum Epitaxial Film for Scalable and Sustainable Plasmonics: Direct Comparison with Silver Epitaxial Film. Nanoscale 2020, 12, 23809–23816. [Google Scholar] [CrossRef]
  41. Chowdhury, M.H.; Ray, K.; Gray, S.K.; Pond, J.; Lakowicz, J.R. Aluminum Nanoparticles as Substrates for Metal-Enhanced Fluorescence in the Ultraviolet for the Label-Free Detection of Biomolecules. Anal. Chem. 2009, 81, 1397–1403. [Google Scholar] [CrossRef] [PubMed]
  42. Chang, Y.-L.; Su, C.-J.; Lu, L.-C.; Wan, D. Aluminum Plasmonic Nanoclusters for Paper-Based Surface-Enhanced Raman Spectroscopy. Anal. Chem. 2022, 94, 16319–16327. [Google Scholar] [CrossRef] [PubMed]
  43. Rebello Sousa Dias, M.; Leite, M.S. Alloying: A Platform for Metallic Materials with On-Demand Optical Response. Acc. Chem. Res. 2019, 52, 2881–2891. [Google Scholar] [CrossRef] [PubMed]
  44. Coviello, V.; Forrer, D.; Amendola, V. Recent Developments in Plasmonic Alloy Nanoparticles: Synthesis, Modelling, Properties and Applications. ChemPhysChem 2022, 23, e202200136. [Google Scholar] [CrossRef] [PubMed]
  45. Lee, D.-J.; Yim, H.-D.; Kim, Y.-G.; Jeong, Y.-B.; Kim, T.Y.; Hwangbo, C.K.; Jun, Y.C.; Park, S.-G.; Lee, S.-G.; Beom-Hoan, O. Resonant Wavelength Tuning of Localized Plasmons in Silver-Aluminum Nanoparticles. J. Korean Phys. Soc. 2013, 63, 2098–2101. [Google Scholar] [CrossRef]
  46. Sun, W.; Hong, R.; Liu, Q.; Li, Z.; Shi, J.; Tao, C.; Zhang, D. SERS-Active Ag–Al Alloy Nanoparticles with Tunable Surface Plasmon Resonance Induced by Laser Ablation. Opt. Mater. 2019, 96, 109298. [Google Scholar] [CrossRef]
  47. Hong, R.; Sun, W.; Liu, Q.; Li, Z.; Tao, C.; Zhang, D.; Zhang, D. Al-Induced Tunable Surface Plasmon Resonance of Ag Thin Film by Laser Irradiation. Appl. Phys. Express 2019, 12, 085503. [Google Scholar] [CrossRef]
  48. Ntemogiannis, D.; Tsarmpopoulou, M.; Stamatelatos, A.; Grammatikopoulos, S.; Karoutsos, V.; Anyfantis, D.I.; Barnasas, A.; Alexopoulos, V.; Giantzelidis, K.; Ndoj, E.A.; et al. ZnO Matrices as a Platform for Tunable Localized Surface Plasmon Resonances of Silver Nanoparticles. Coatings 2024, 14, 69. [Google Scholar] [CrossRef]
  49. Ntemogiannis, D.; Tsarmpopoulou, M.; Moularas, C.; Deligiannakis, Y.; Stamatelatos, A.; Maratos, D.M.; Ploumis, N.G.; Karoutsos, V.; Grammatikopoulos, S.; Sigalas, M.; et al. Temperature-Dependent Localized Surface Plasmon Resonances of Noble Nanoparticles Covered with Polymers. Photonics 2024, 11, 618. [Google Scholar] [CrossRef]
  50. Tsarmpopoulou, M.; Ntemogiannis, D.; Stamatelatos, A.; Geralis, D.; Karoutsos, V.; Sigalas, M.; Poulopoulos, P.; Grammatikopoulos, S. Silver Nanoparticles’ Localized Surface Plasmon Resonances Emerged at Polymeric Environments by Theory and Experiment. Micro 2024, 4, 318–333. [Google Scholar] [CrossRef]
  51. Stamatelatos, A.; Tsarmpopoulou, M.; Chronis, A.G.; Kanistras, N.; Anyfantis, D.I.; Violatzi, E.; Geralis, D.; Sigalas, M.M.; Poulopoulos, P.; Grammatikopoulos, S. Optical Interpretation for Plasmonic Adjustment of Nanostructured Ag-NiO Thin Films. Int. J. Mod. Phys. B 2021, 35, 2150093. [Google Scholar] [CrossRef]
  52. Ntemogiannis, D.; Tsarmpopoulou, M.; Chronis, A.G.; Anyfantis, D.I.; Barnasas, A.; Grammatikopoulos, S.; Sigalas, M.; Poulopoulos, P. On the Localized Surface Plasmonic Resonances of AgPd Alloy Nanoparticles by Experiment and Theory. Coatings 2021, 11, 893. [Google Scholar] [CrossRef]
  53. Chronis, A.G.; Stamatelatos, A.; Grammatikopoulos, S.; Sigalas, M.M.; Karoutsos, V.; Maratos, D.M.; Lysandrou, S.P.; Trachylis, D.; Politis, C.; Poulopoulos, P. Microstructure and Plasmonic Behavior of Self-Assembled Silver Nanoparticles and Nanorings. J. Appl. Phys. 2019, 125, 023106. [Google Scholar] [CrossRef]
  54. Aswal, D.K.; Muthe, K.P.; Joshi, N.; Debnath, A.K.; Gupta, S.K.; Yakhmi, J.V. In Situ X-ray Photoelectron Spectroscopy of Ag/Al Bilayers Grown by Molecular Beam Epitaxy. J. Cryst. Growth 2003, 256, 201–205. [Google Scholar] [CrossRef]
  55. Debnath, A.K.; Joshi, N.; Muthe, K.P.; Vyas, J.C.; Aswal, D.K.; Gupta, S.K.; Yakhmi, J.V. Surface and Electrical-Transport Studies of Ag/Al Bilayer-Structures Grown by Molecular Beam Epitaxy. Appl. Surf. Sci. 2005, 243, 220–227. [Google Scholar] [CrossRef]
  56. Malgas, G.F.; Adams, D.; Alford, T.L.; Mayer, J.W. A Study of the Factors Influencing the Kinetics in Ag/Al Bilayer Systems. Thin Solid Film. 2004, 467, 267–274. [Google Scholar] [CrossRef]
  57. Malgas, G.F.; Adams, D.; Nguyen, P.; Wang, Y.; Alford, T.L.; Mayer, J.W. Investigation of the Effects of Different Annealing Ambients on Ag/Al Bilayers: Electrical Properties and Morphology. J. Appl. Phys. 2001, 90, 5591–5598. [Google Scholar] [CrossRef]
Figure 1. The examined system of alloy AgAl NPs on glass substrate. Side view (left) and top view (right). “a” is the lattice constant, “d” the diameter of the NPs, “t” their height, and “t’” is the oxide layer thickness.
Photonics 11 00713 g001
Figure 2. UV–vis absorbance spectra as a function of photon energy for all bilayers before (a) and after annealing (b).
Photonics 11 00713 g002
Figure 3. The 500 nm × 500 nm AFM images of the surface of the as-deposited bilayers along with their NP diameter distributions (ac) concern Ag/Al #3 and (df) Ag/Al #1.
Photonics 11 00713 g003
Figure 4. Line profiles of NPs in as-deposited bilayers: (a) Ag/Al #1 and (b) Ag/Al #3.
Photonics 11 00713 g004
Figure 5. The 1 μm × 1 μm 2D and 3D AFM images of the surface of the thermally annealed bilayers at 440 °C along with their NP diameter distributions (ac) concern Ag/Al #1, (df) Ag/Al #2, (gi) Ag/Al #3, and (jl) Ag/Al #4.
Photonics 11 00713 g005aPhotonics 11 00713 g005b
Figure 6. Line profiles of NPs in annealed bilayers: (a) Ag/Al #1, (b) Ag/Al #2, (c) Ag/Al #3, and (d) Ag/Al #4.
Photonics 11 00713 g006
Figure 7. Calculated absorbance spectra of AgAl alloy NPs for every fabricated specimen. Experimental absorbance spectra are also included for comparison. (a) Concerns Ag/Al #1, (b) Ag/Al #2, (c) Ag/Al #3, and (d) Ag/Al #4.
Photonics 11 00713 g007
Figure 8. Calculated absorbance spectra for an alloy composition of 71.4% Ag, 28.6% Al, and d/a values of 0.75, 0.50, 0.33, and 0.27.
Photonics 11 00713 g008
Figure 9. Calculated absorbance spectra for different alloy compositions for d = 45 nm, a = 90 nm, and t = 15 nm.
Photonics 11 00713 g009
Table 1. Summary of the bilayers deposited, along with information about their thickness and annealing time.
SpecimenBilayer
Total Thickness
(nm)
Individual Layer Thickness (nm)Nominal
Composition
(at. %)
Annealing Time at 440 °C
AgAlAgAl
Ag/Al #11812666.733.3120 min
Ag/Al #21210283.316.720 min
Ag/Al #38.471.483.316.710 min
Ag/Al #475271.428.65 min
Disclaimer/Publisher’s Note: The statements, opinions and data contained in all publications are solely those of the individual author(s) and contributor(s) and not of MDPI and/or the editor(s). MDPI and/or the editor(s) disclaim responsibility for any injury to people or property resulting from any ideas, methods, instructions or products referred to in the content.

