Communication

Multiphysics Coupling Simulation of Off-Axis Integrated Cavity Optical Sensing System

1
The First Affiliated Hospital of Anhui University of Science and Technology (Huainan First People’s Hospital), Anhui University of Science and Technology, Huainan 232001, China
2
School of Artificial Intelligence, Anhui University of Science and Technology, Huainan 232001, China
3
State Key Laboratory of Mining Response and Disaster Prevention and Control in Deep Coal Mines, Anhui University of Science and Technology, Huainan 232001, China
*
Authors to whom correspondence should be addressed.
Photonics 2024, 11(8), 720; https://doi.org/10.3390/photonics11080720
Submission received: 2 July 2024 / Revised: 22 July 2024 / Accepted: 30 July 2024 / Published: 31 July 2024

Abstract

:
The optical properties of an off-axis integrated cavity system are influenced by both structural deformation and thermal deformation. In this paper, the finite element simulation and analysis software COMSOL multiphysics was used to numerically simulate the optical system. By coupling geometric optics, solid mechanics, and solid heat transfer and conducting parametric temperature scanning, a multiphysics simulation of the off-axis integrated cavity optical sensing system was achieved. The effects of different temperature conditions on the stress field, displacement field, and optical mirrors were analyzed, and changes in optical properties were assessed using ray trajectories and point diagrams. Additionally, optical simulation software was used to simulate and optimize the experimental optical path, obtaining the distribution of light spots on the detector surface. This provides a theoretical basis for the subsequent optimization of the off-axis integrated cavity optical system.

1. Introduction

In recent years, with the rapid development of laser absorption spectroscopy trace gas detection technology, off-axis integrated cavity output spectroscopy (OA-ICOS) has emerged as a derivative technology of cavity-enhanced spectroscopy. Due to the advantages of this simple device, including ease of operation, strong anti-interference ability, and high detection sensitivity, it has important research significance in the fields of energy, environment, safety, and public health [1,2,3,4,5]. In off-axis integrated cavity output spectroscopy technology, the optical cavity is composed of two or three high-reflecting mirrors. After the off-axis incident laser is coupled into the optical cavity, it will reflect back and forth between the two mirrors, effectively stimulating the higher-order mode of the optical cavity, making the cavity mode denser, and significantly reducing the free spectral range. The effective light path can reach tens or hundreds of kilometers by using mirrors with a reflectance of 99.999%, thus improving the detection sensitivity of the system [6,7]. Yuan et al. [8] proposed a novel V-shaped off-axis integrated cavity output spectroscopy (V-OA-ICOS) device. They achieved a more uniform square beam spot distribution on the high-reflectivity mirror surfaces within the V-shaped resonant cavity. By selecting an appropriate incident angle, they could better enhance the utilization efficiency of the mirror surfaces. Gao et al. [9] proposed a type of integrated cavity using a direct injection method. This structure, under equivalent mirror conditions, can maintain an effective absorption optical path very close to the original off-axis integrated cavity while also increasing the output light intensity hundreds of times. To address the challenges of changing field environments for open-path configurations, the influence of pressure on the OA-ICOS sensor system was studied. He et al. [10] proposed a linewidth enhancement factor (delta) to measure the ambient pressure, and a pressure correction method was developed to improve the measurement accuracy. On the other hand, the use of finite element software is useful for the simulation analysis of optical sensors, as it can evaluate the performance of optical fiber sensors and other aspects. Therefore, in this paper, COMSOL software will be used to analyze the off-axis integrated cavity optical sensor.
The off-axis integrated cavity optical sensing system has high requirements for the surface shape accuracy and space attitude of the reflecting mirror, and the off-axis integrated cavity optical system sometimes needs to operate in a harsh environment with significant temperature changes, which will inevitably cause changes in the surface shape and space attitude of the mirror, and ultimately prevent the optical performance of the off-axis integrated cavity optical system from reaching the design goal. Therefore, it is necessary to research the structure–thermal–optical properties of the off-axis integrated cavity optical system, analyze its deformation and optical properties in various external environments, and optimize its design to improve the stability of the optical system under extreme conditions [11,12,13,14].
In order to predict the deformation and change in the optical properties of the off-axis integrated cavity optical system, this paper carried out integrated simulation analyses of the structural, thermal, and optical multiphysical fields based on the multiphysics finite element simulation software COMSOL Multiphysics 6.2 (referred to as COMSOL hereafter) [15,16]. The influence of the optical system on the stress field, displacement field, and optical mirror under different temperature conditions was obtained, and the changes in optical performance were judged by ray trajectory and point diagram, which provides an effective method for the subsequent design optimization of the optical sensing system.

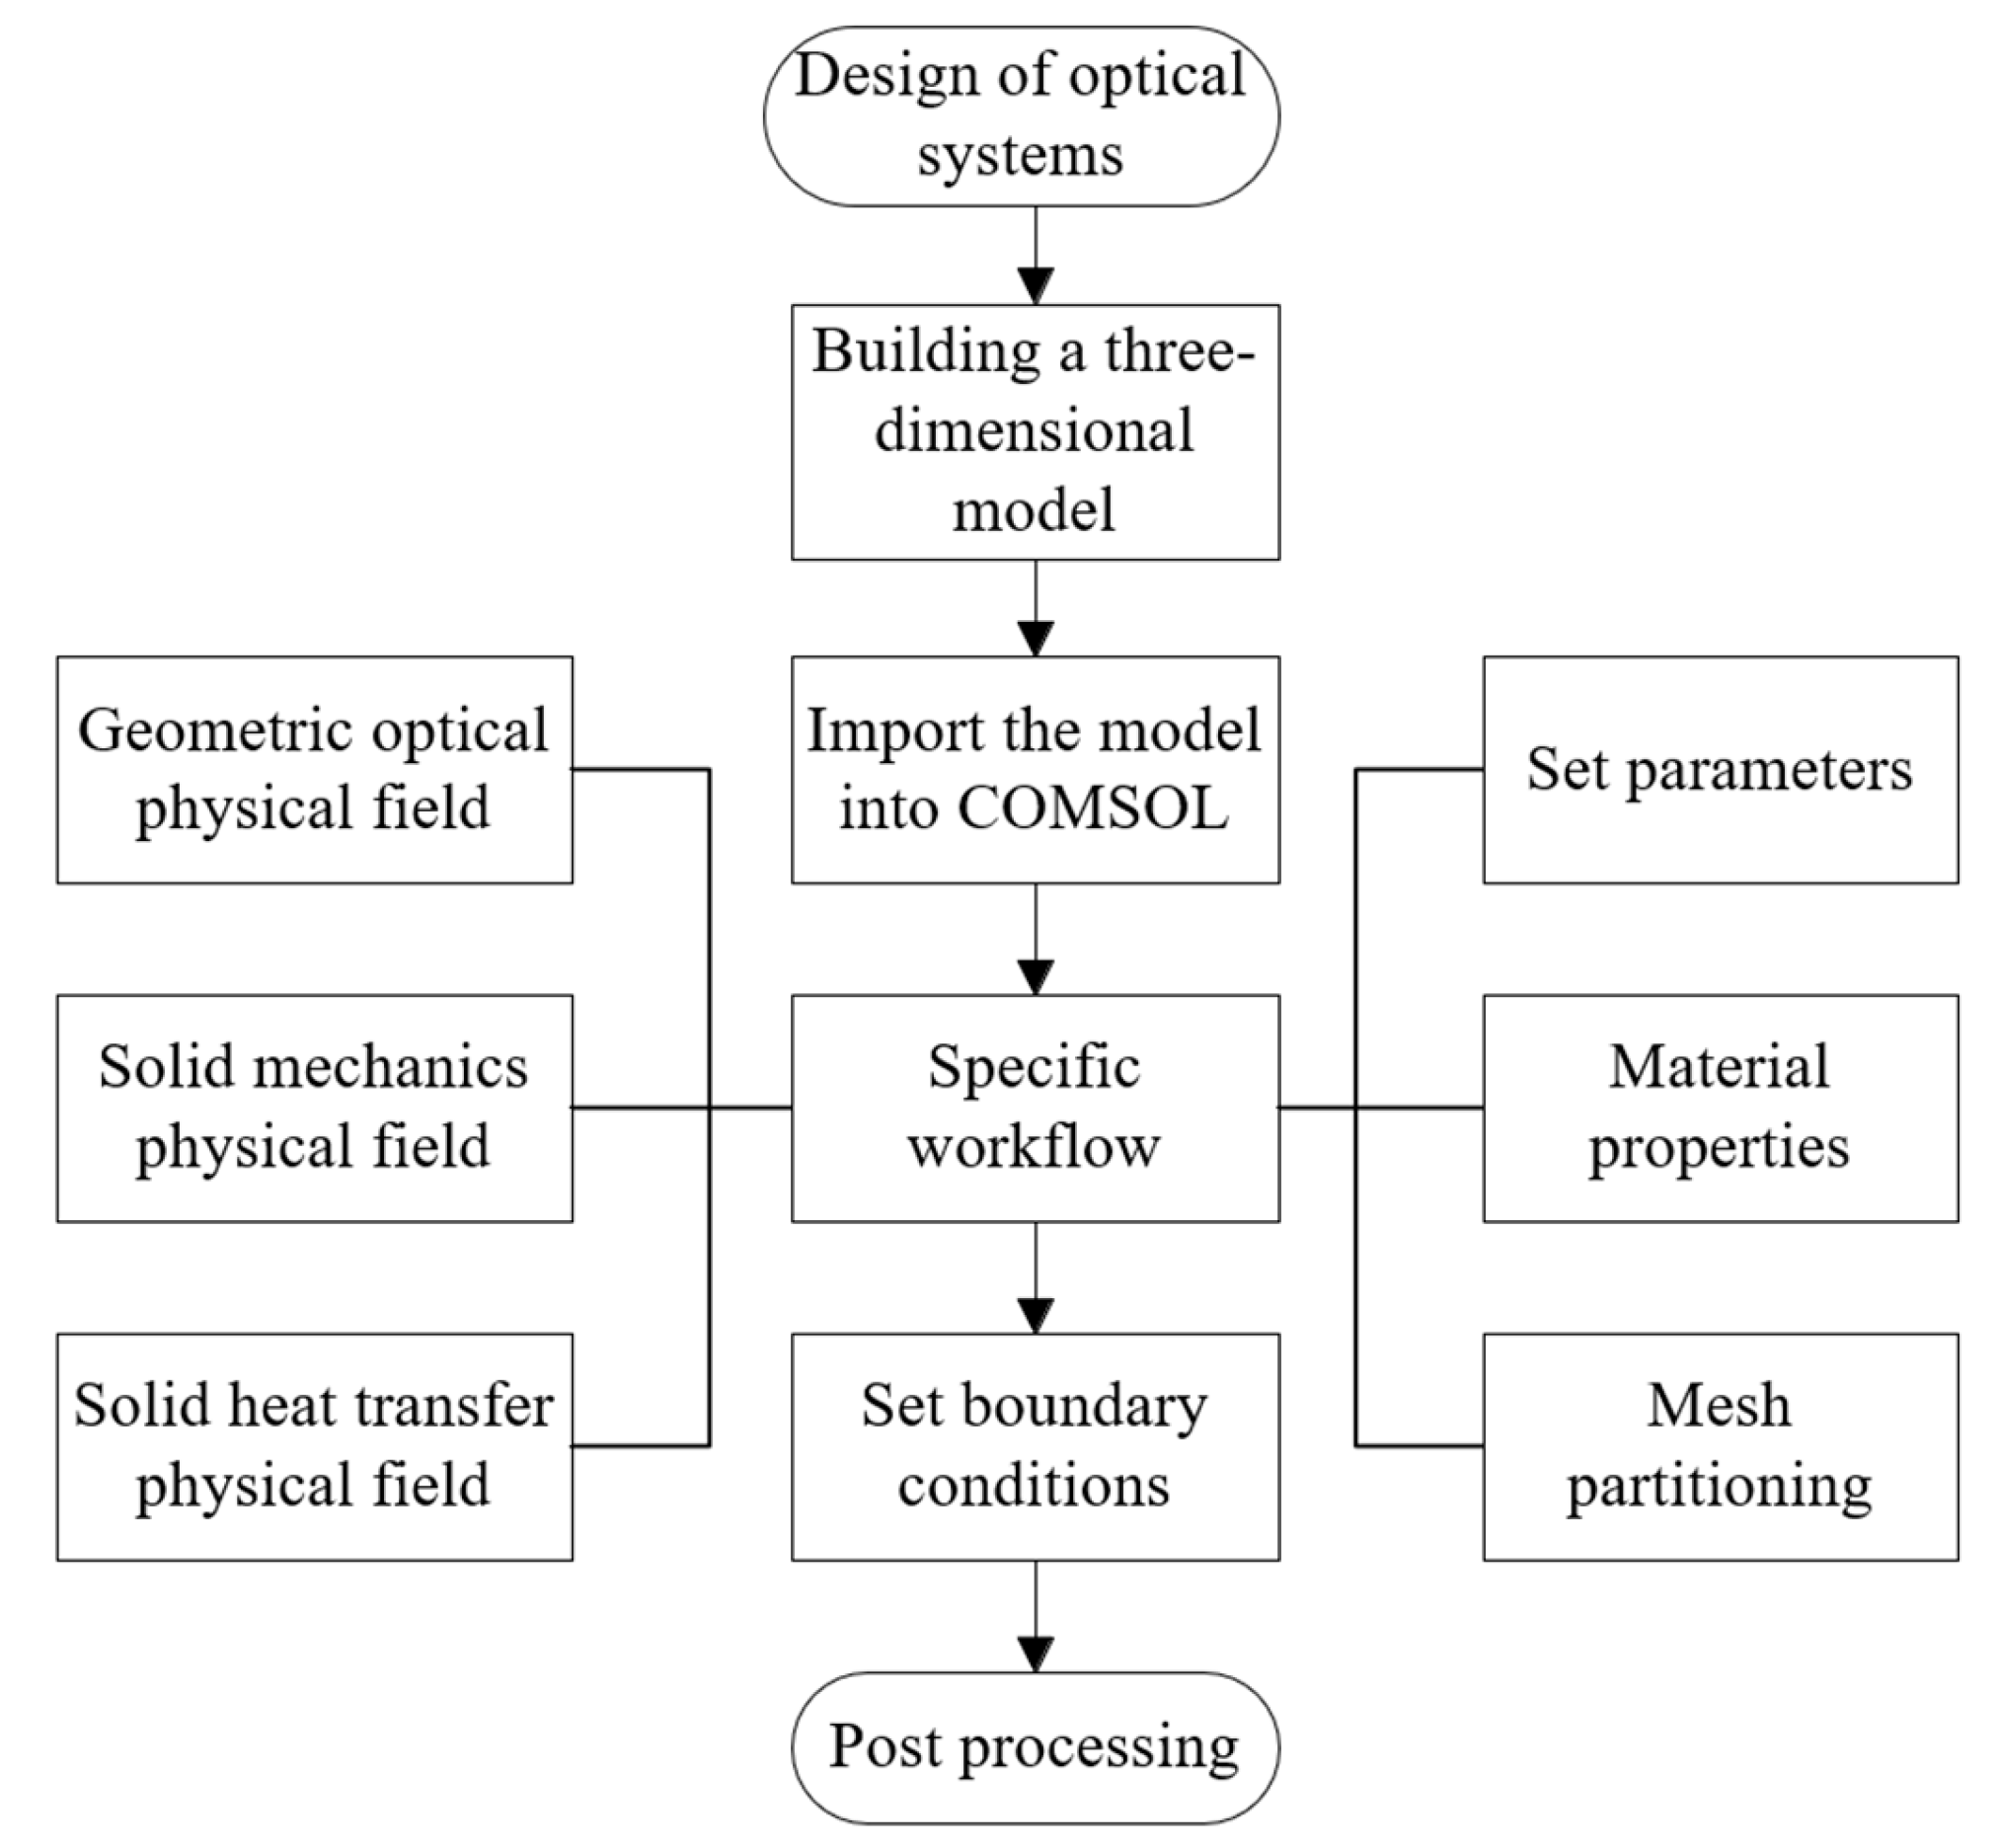
2. Optical Mechanical Thermal Simulation Analysis Process

The analysis flow of the simulation model of the off-axis integrated cavity optical system is shown in Figure 1.
According to the principle of optical design and the results of the mechanical mechanism, the three-dimensional optical machine model was established by using three-dimensional modeling software, and then the model was imported into the finite element simulation analysis software COMSOL for simplification so as to improve the convergence and timeliness of the model. The properties of each material were set, and the geometric optical physical field, solid mechanics physical field, and solid heat transfer physical field were added for multiphysical field coupling simulation, and mesh generation was carried out. The final result was obtained by selecting the appropriate solver for analysis and research. The simulation model can simulate the deformation and stress distribution of the optical structure of the off-axis integrated cavity at different temperatures.

3. Modeling and Simulation of Multiphysics Coupling Model

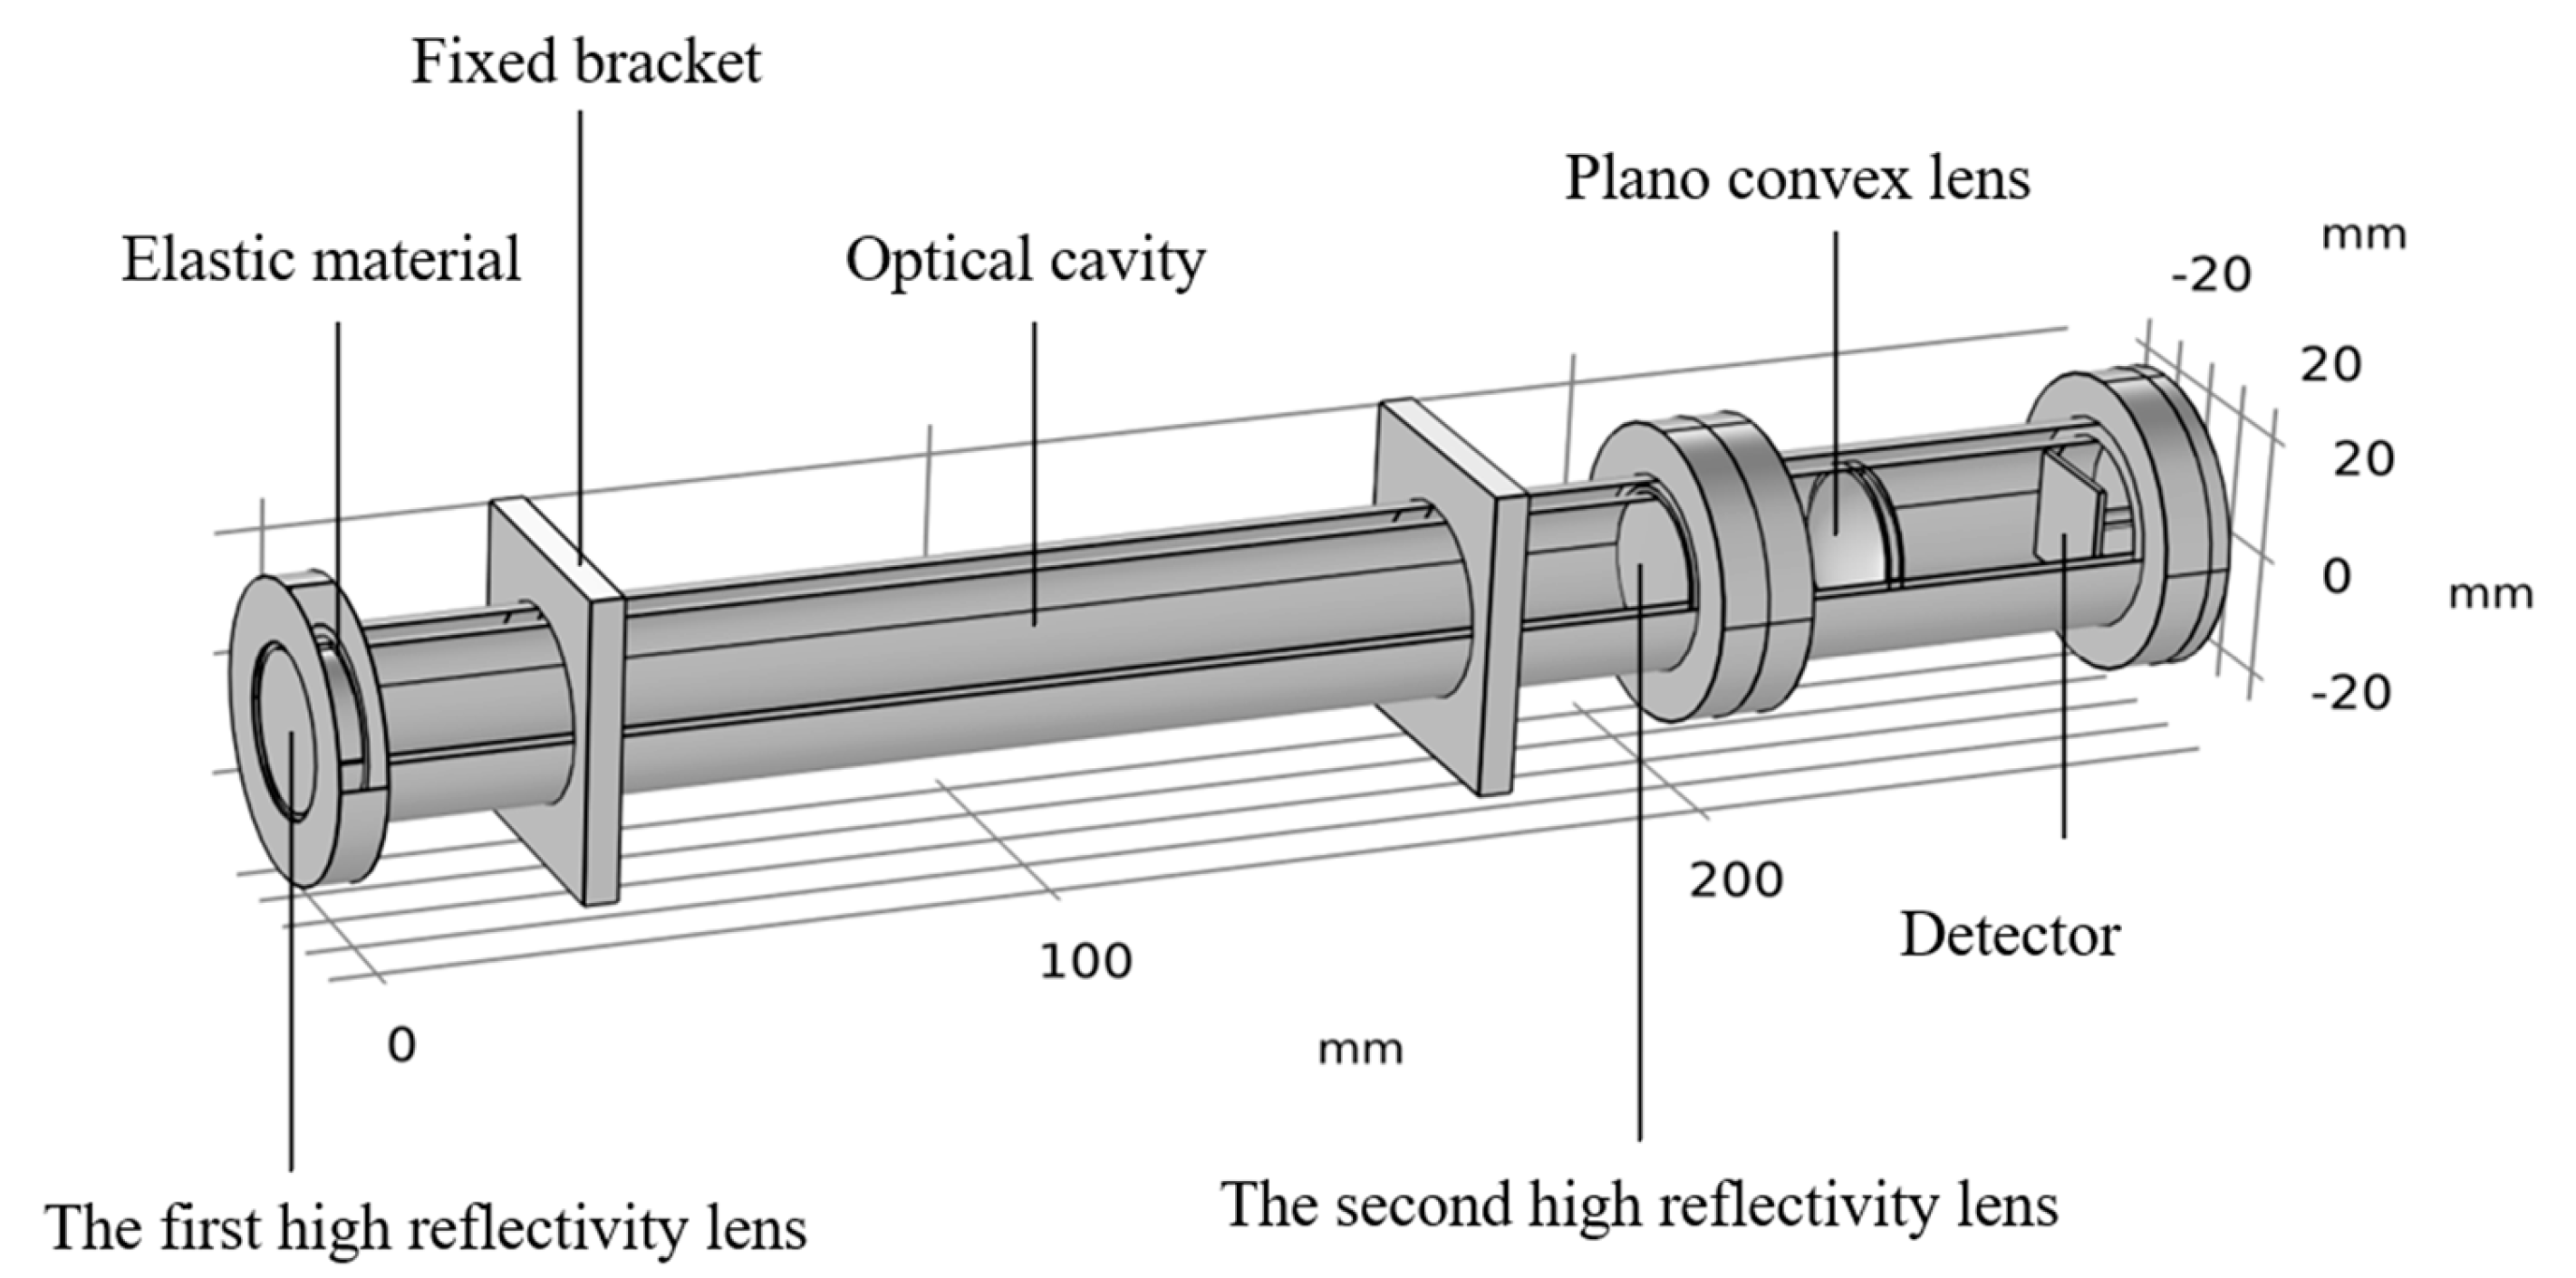
3.1. Geometric Model
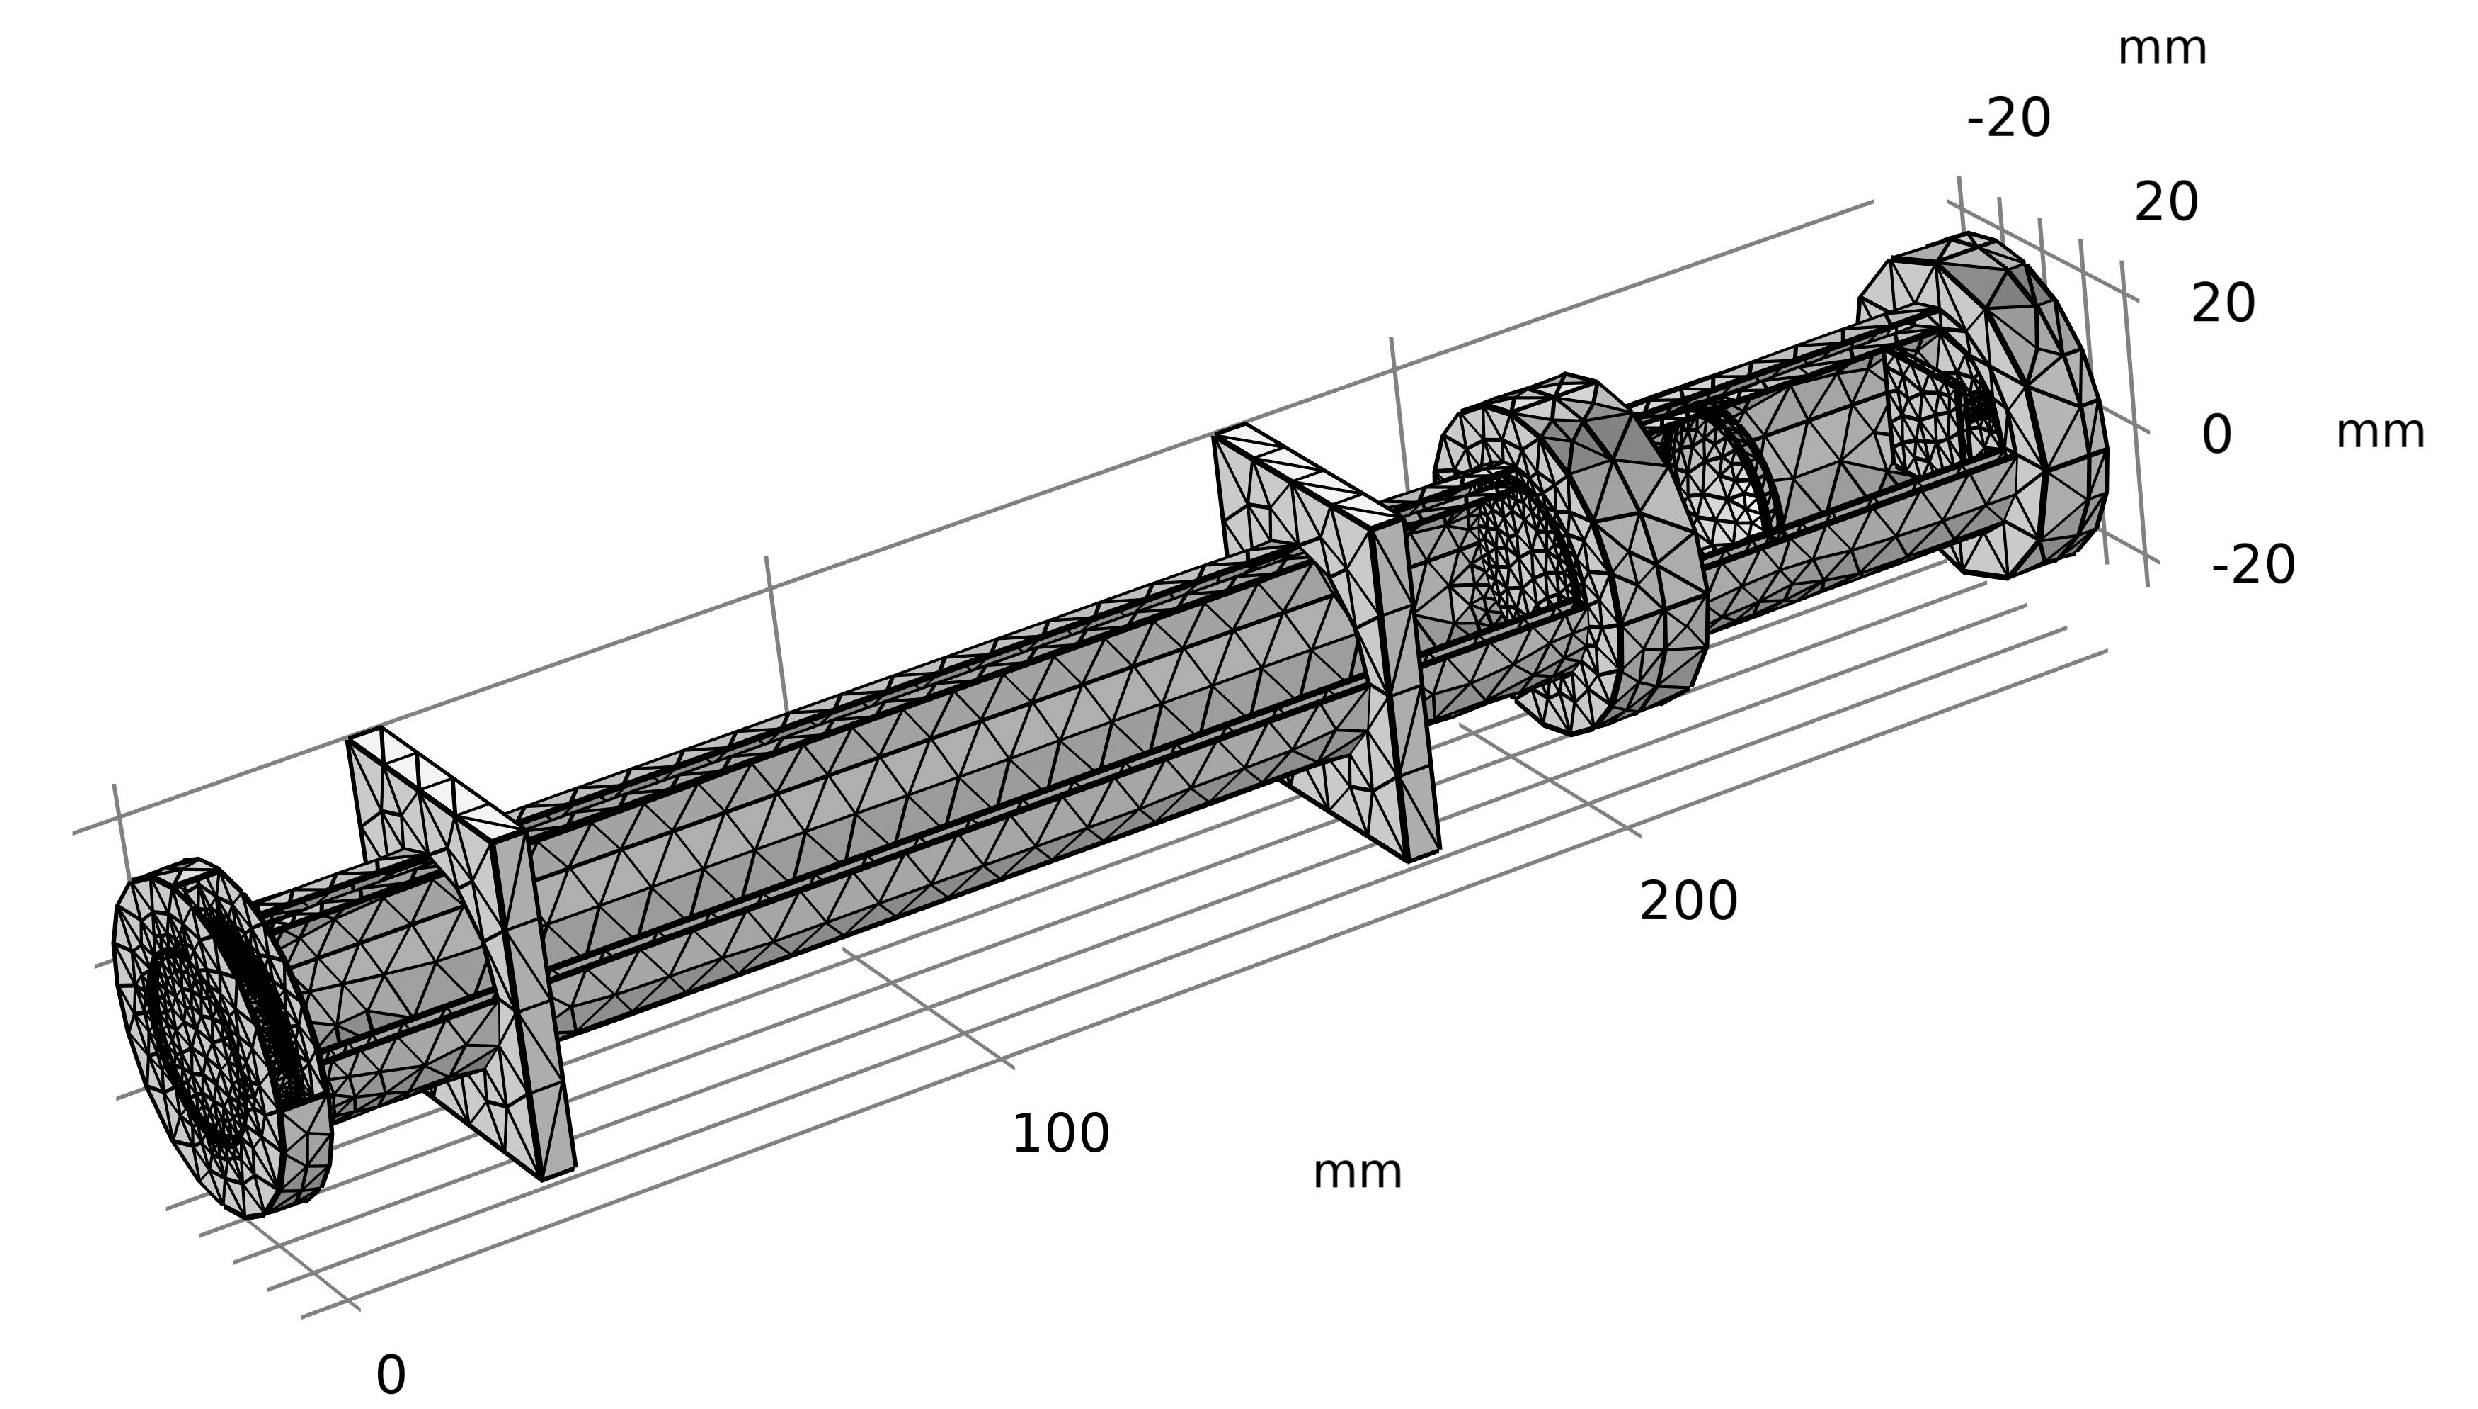
The structure of the off-axis integrated cavity optical sensing system is shown in Figure 2. The system mainly consists of two high mirrors, a convex lens, a detector, an optical cavity, two supports, and elastic materials. The model involves solid mechanics, solid heat transfer, and geometric optics [17]. Solid mechanics provide a certain position constraint, while solid heat transfer provides a specified temperature of the model and leads to thermal expansion deformation of the model. Geometric optics determine the changes in the optical properties of the system after structural–thermal deformation through ray trajectories. The material of the optical system is Steel AISI 4340, and its properties are shown in Table 1. The default initial temperature for this model is 293.15 K.

3.2. Grid

COMSOL offers two types of meshing methods: free meshing and mapped meshing [18,19]. Free meshing utilizes tetrahedrons, quadrilaterals, or triangles to create the mesh, adjusting mesh quality through edge length curvature and the number of mesh elements. This approach is typically employed for meshing free-form surfaces and complex geometries. In contrast, mapped meshing strictly controls mesh quality by specifying parameters such as the number of mesh elements and edge lengths. In the off-axis integrated cavity optical system, different regions employ free triangular and free tetrahedral meshes to balance computational efficiency and precision. Using the mesh information statistics tool, we analyzed the mesh quality, revealing that there are 57,944 tetrahedrons and 19,851 triangles. The average element quality of the entire optical system is 0.5985, while the average element quality of the optical mirror surface is 0.7468. This indicates that high-quality meshes are used on the optical lens surface, whereas larger volume meshes are employed in other parts to reduce computational costs. As a result, we have obtained a relatively optimized mesh structure model. The results of the meshing process are illustrated in Figure 3.

3.3. Multiphysical Field

This model utilizes the geometrical optics interface to trace the paths of rays through the mirror and lens system and employs the solid heat transfer and solid mechanics interfaces to model the thermal expansion and deformation of the mirrors and lenses. By integrating these three physical fields—geometrical optics, solid mechanics, and solid heat transfer—a coupled multiphysics system is constructed [20,21]. Assuming the lens assembly remains isothermal, a parametric sweep is conducted over a specified temperature range to calculate and analyze the impact on image quality at each temperature.

3.3.1. Geometrical Optics Physics Field

The geometrical optics physics field is employed to simulate the optical characteristics of the system [22]. The results are then compared with the optical characteristics before and after thermal deformation to assess whether the system meets the design requirements. This comparison lays the foundation for further optimization of the optomechanical system. The ray-tracing method in geometrical optics determines the position and direction of each ray using geometrical optics principles and then evaluates the properties of the measured object based on the interactions between the rays and the object. The governing equations are as follows:
d q d t = ω k
d k d t = ω q
where q represents the spatial position of the ray, t represents time, k represents the wave vector, and w represents the angular frequency.
This model simulates the imaging performance of monochromatic light. Thus, the wavelength distribution of the rays in the geometrical optics physics field is set to a single wavelength, specified as 1064 nm. The light dispersion model is set to air, with the external domain temperature set to T0 and the external domain pressure set to 1 atm. Additionally, the reflectivity of the two mirrors is set to 0.99. Since the model neglects stray light during ray propagation, a wall attribute is added to the detector surface and set to frozen, meaning that rays are completely absorbed upon reaching the detector surface. The model also includes a hexagonal ring-shaped grid light source, with its central position, cylindrical axis, and radius adjustable according to the model requirements to control the position, direction, and size of the incident rays. The direction vector of the rays can be used to control the incidence direction of the laser.

3.3.2. Solid Mechanics Physics Field

The solid mechanics physics field is capable of simulating the mechanical performance of the system, laying the foundation for subsequent thermal expansion and thermal stress calculations [23]. The solid mechanics simulation in this model is based on steady-state studies at various temperatures. The displacement and deformation of the object are represented through spatial coordinates ( x , y , z ) , where the spatial coordinates in the initial state are fully consistent with the material coordinates ( X , Y , Z ) . During displacement or deformation, the displacement and deformation are expressed by the following equations:
x = x ( X , t ) = X + u ( X , t )
where x represents the component of the space coordinate x , X represents the X component of the material coordinate, u represents the deformation of the material coordinate in the X direction, and t represents the time scale.
The model established in this study is a structural analysis model with a small deformation scale. Therefore, its analysis process follows the Lagrangian equations of motion [24]. These equations are as follows:
0 = F S T + F v
F = I + u = I + u X
where F represents the deformation gradient of the model, S represents the displacement field of the model, v represents velocity, and I represents the model tensor.
Since the off-axis integrated cavity optical system has no motion or rotation, its cavity is fixed by two supports, with fixed constraints providing the position of the supports. Therefore, only a quasi-static analysis is required. Thermal expansion properties are added to the linear elastic material to lay the foundation for subsequent coupled simulations with solid heat transfer. The properties of the linear elastic material are set according to the characteristics of each material.

3.3.3. Solid Heat Transfer Physics Field

The solid heat transfer physics field provides thermal performance simulations of the system, laying the foundation for subsequent multiphysics coupling with solid mechanics to model thermal expansion and thermal stress [25]. The system simulates several consecutive steady-state temperature scenarios, with the equations as follows:
ρ C p u T + q = Q + Q t e d
q = k T
where T represents set temperature, q represents heat flux, C p represents constant pressure heat capacity, k represents thermal conductivity, ρ represents model density, Q represents heat source, and Q t e d represents thermoelastic damping.
The initial temperature of this model is set to 293.15 K. By adding the initial temperature T0 to the parameters, the medium properties and thermal expansion temperature are set to T0 and applied to the optical system. Subsequently, a parametric scan is performed to simulate temperature variations at −25 °C, 0 °C, 25 °C, and 50 °C. These temperature changes cause thermal expansion and contraction throughout the optical system, affecting the stress field, displacement field, and optical mirrors.

4. Results and Discussion

In COMSOL, both steady-state and transient solvers are utilized for simulations. The visualization post-processing module is employed to analyze and process the simulation results, generating the required two-dimensional and three-dimensional images. This approach enables a multi-angle, in-depth analysis of the data, providing a clear and intuitive presentation of the simulation outcomes and yielding reliable and reasonable conclusions.

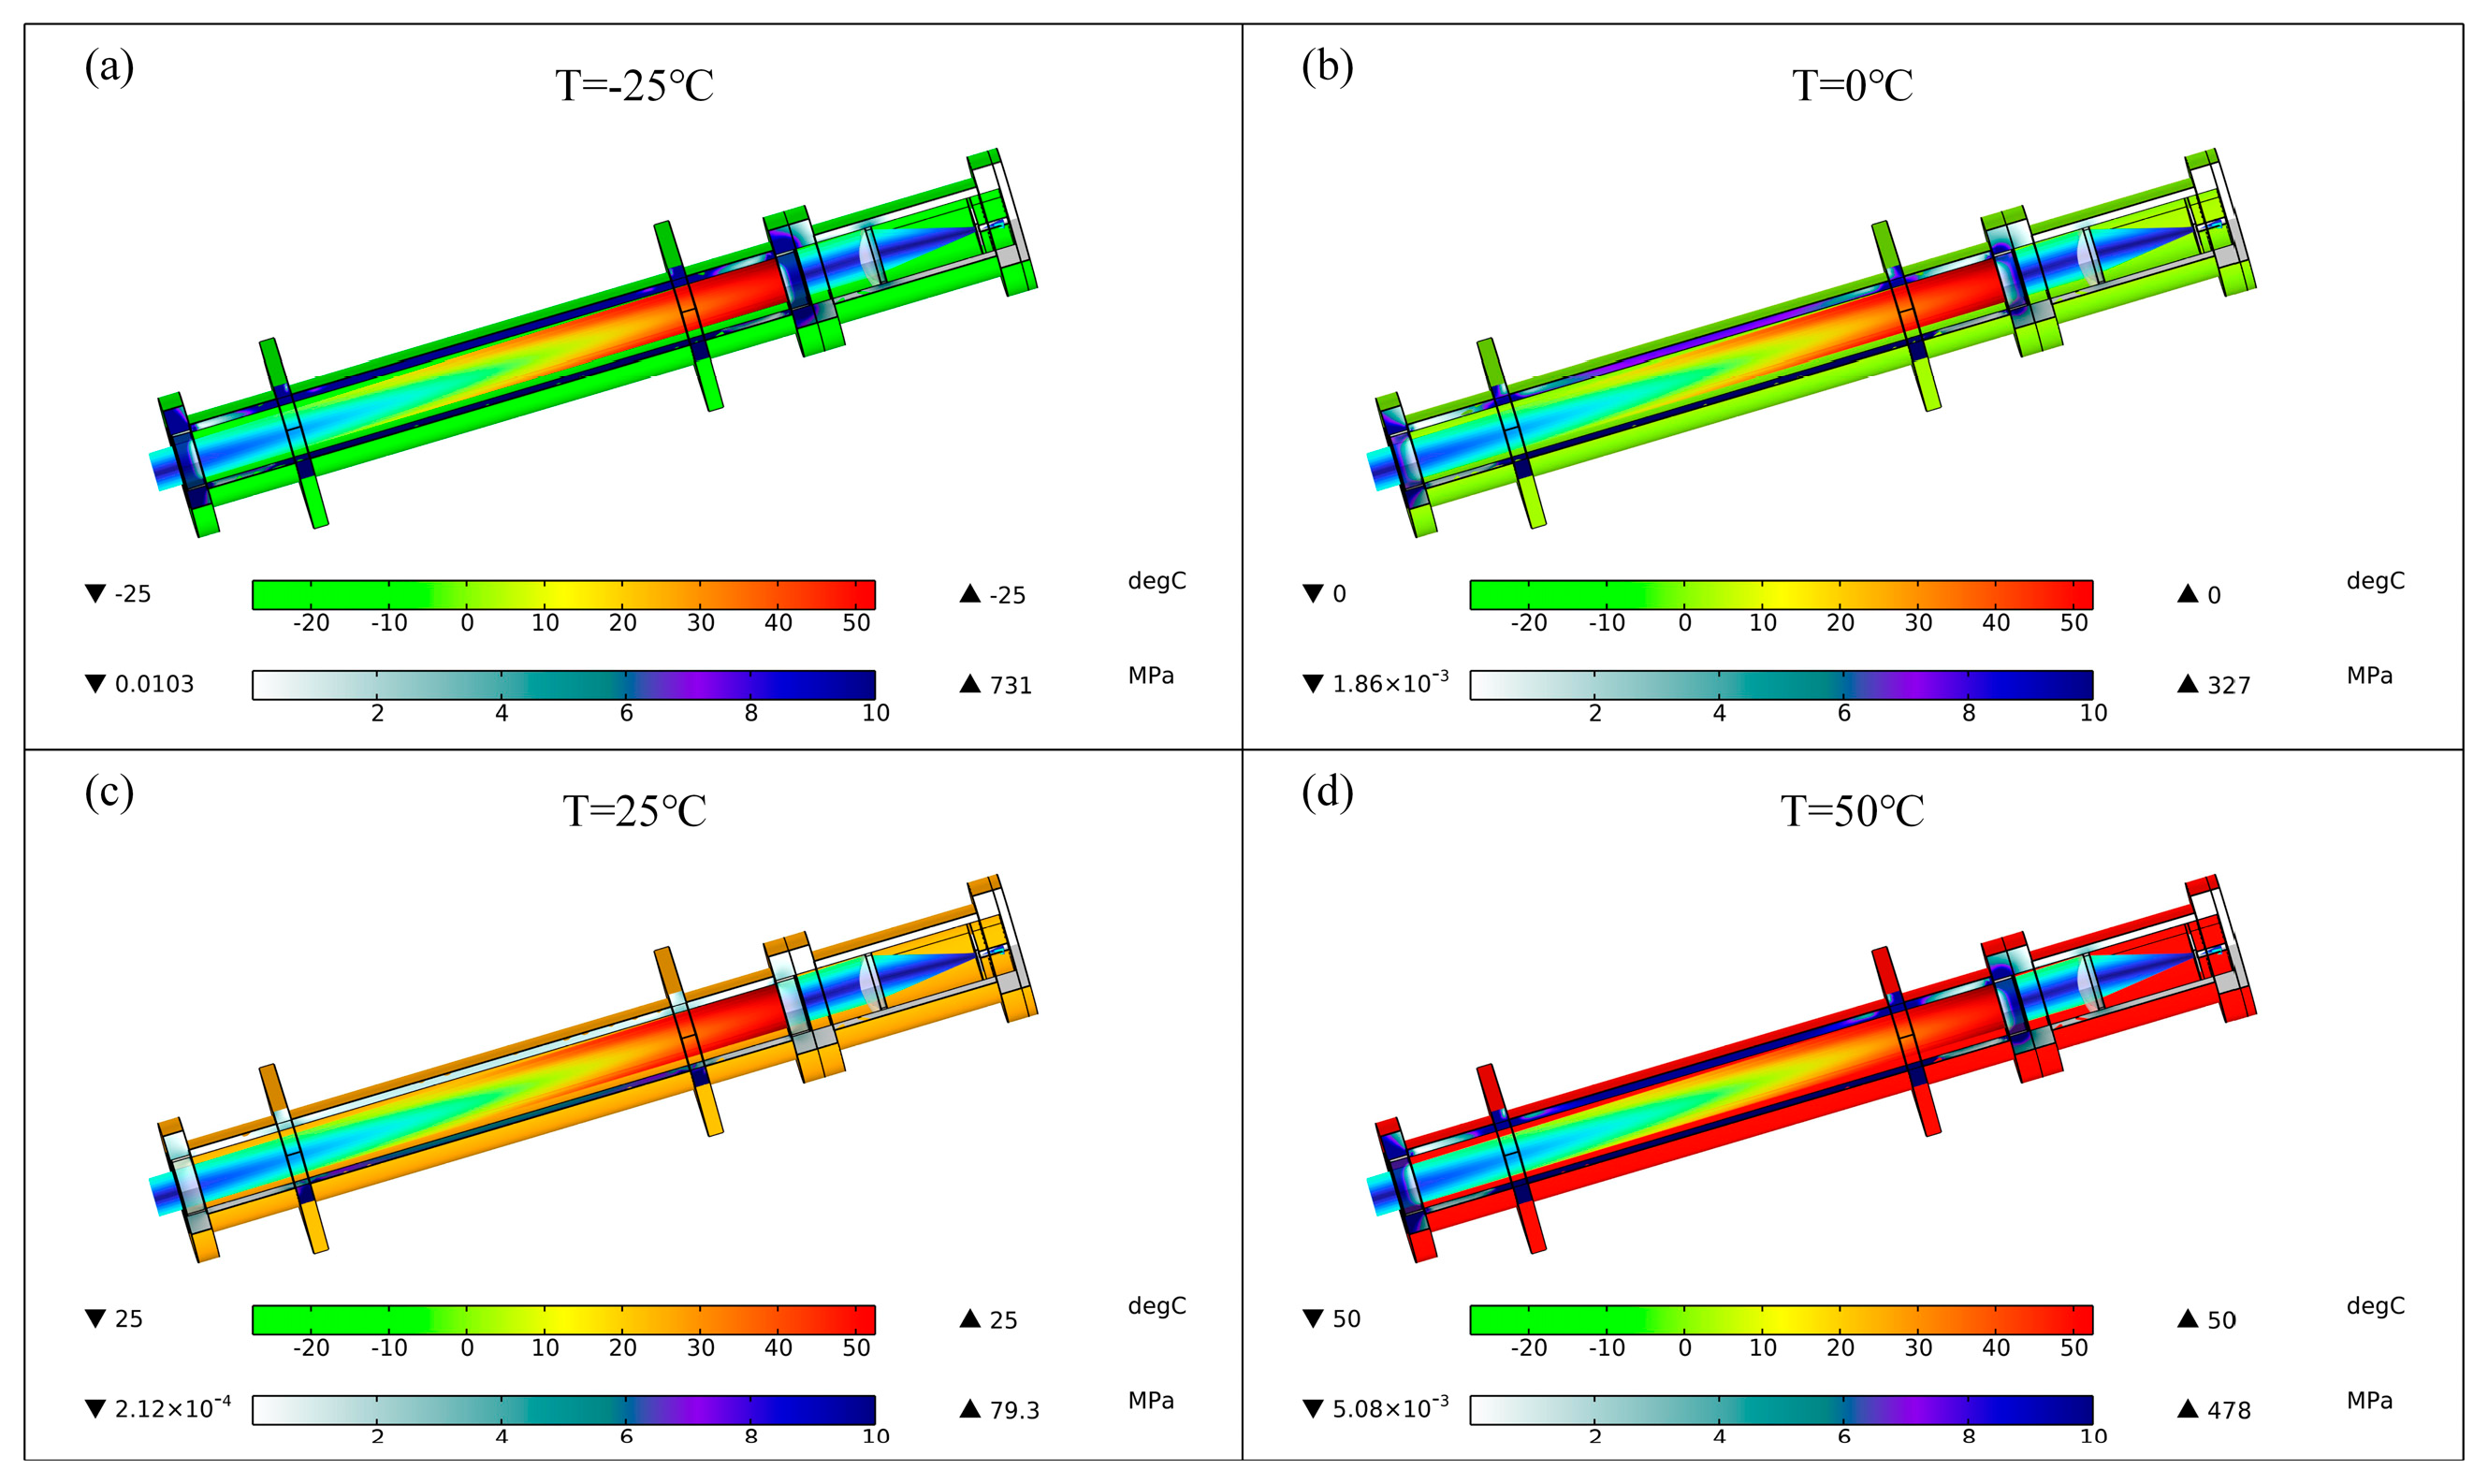
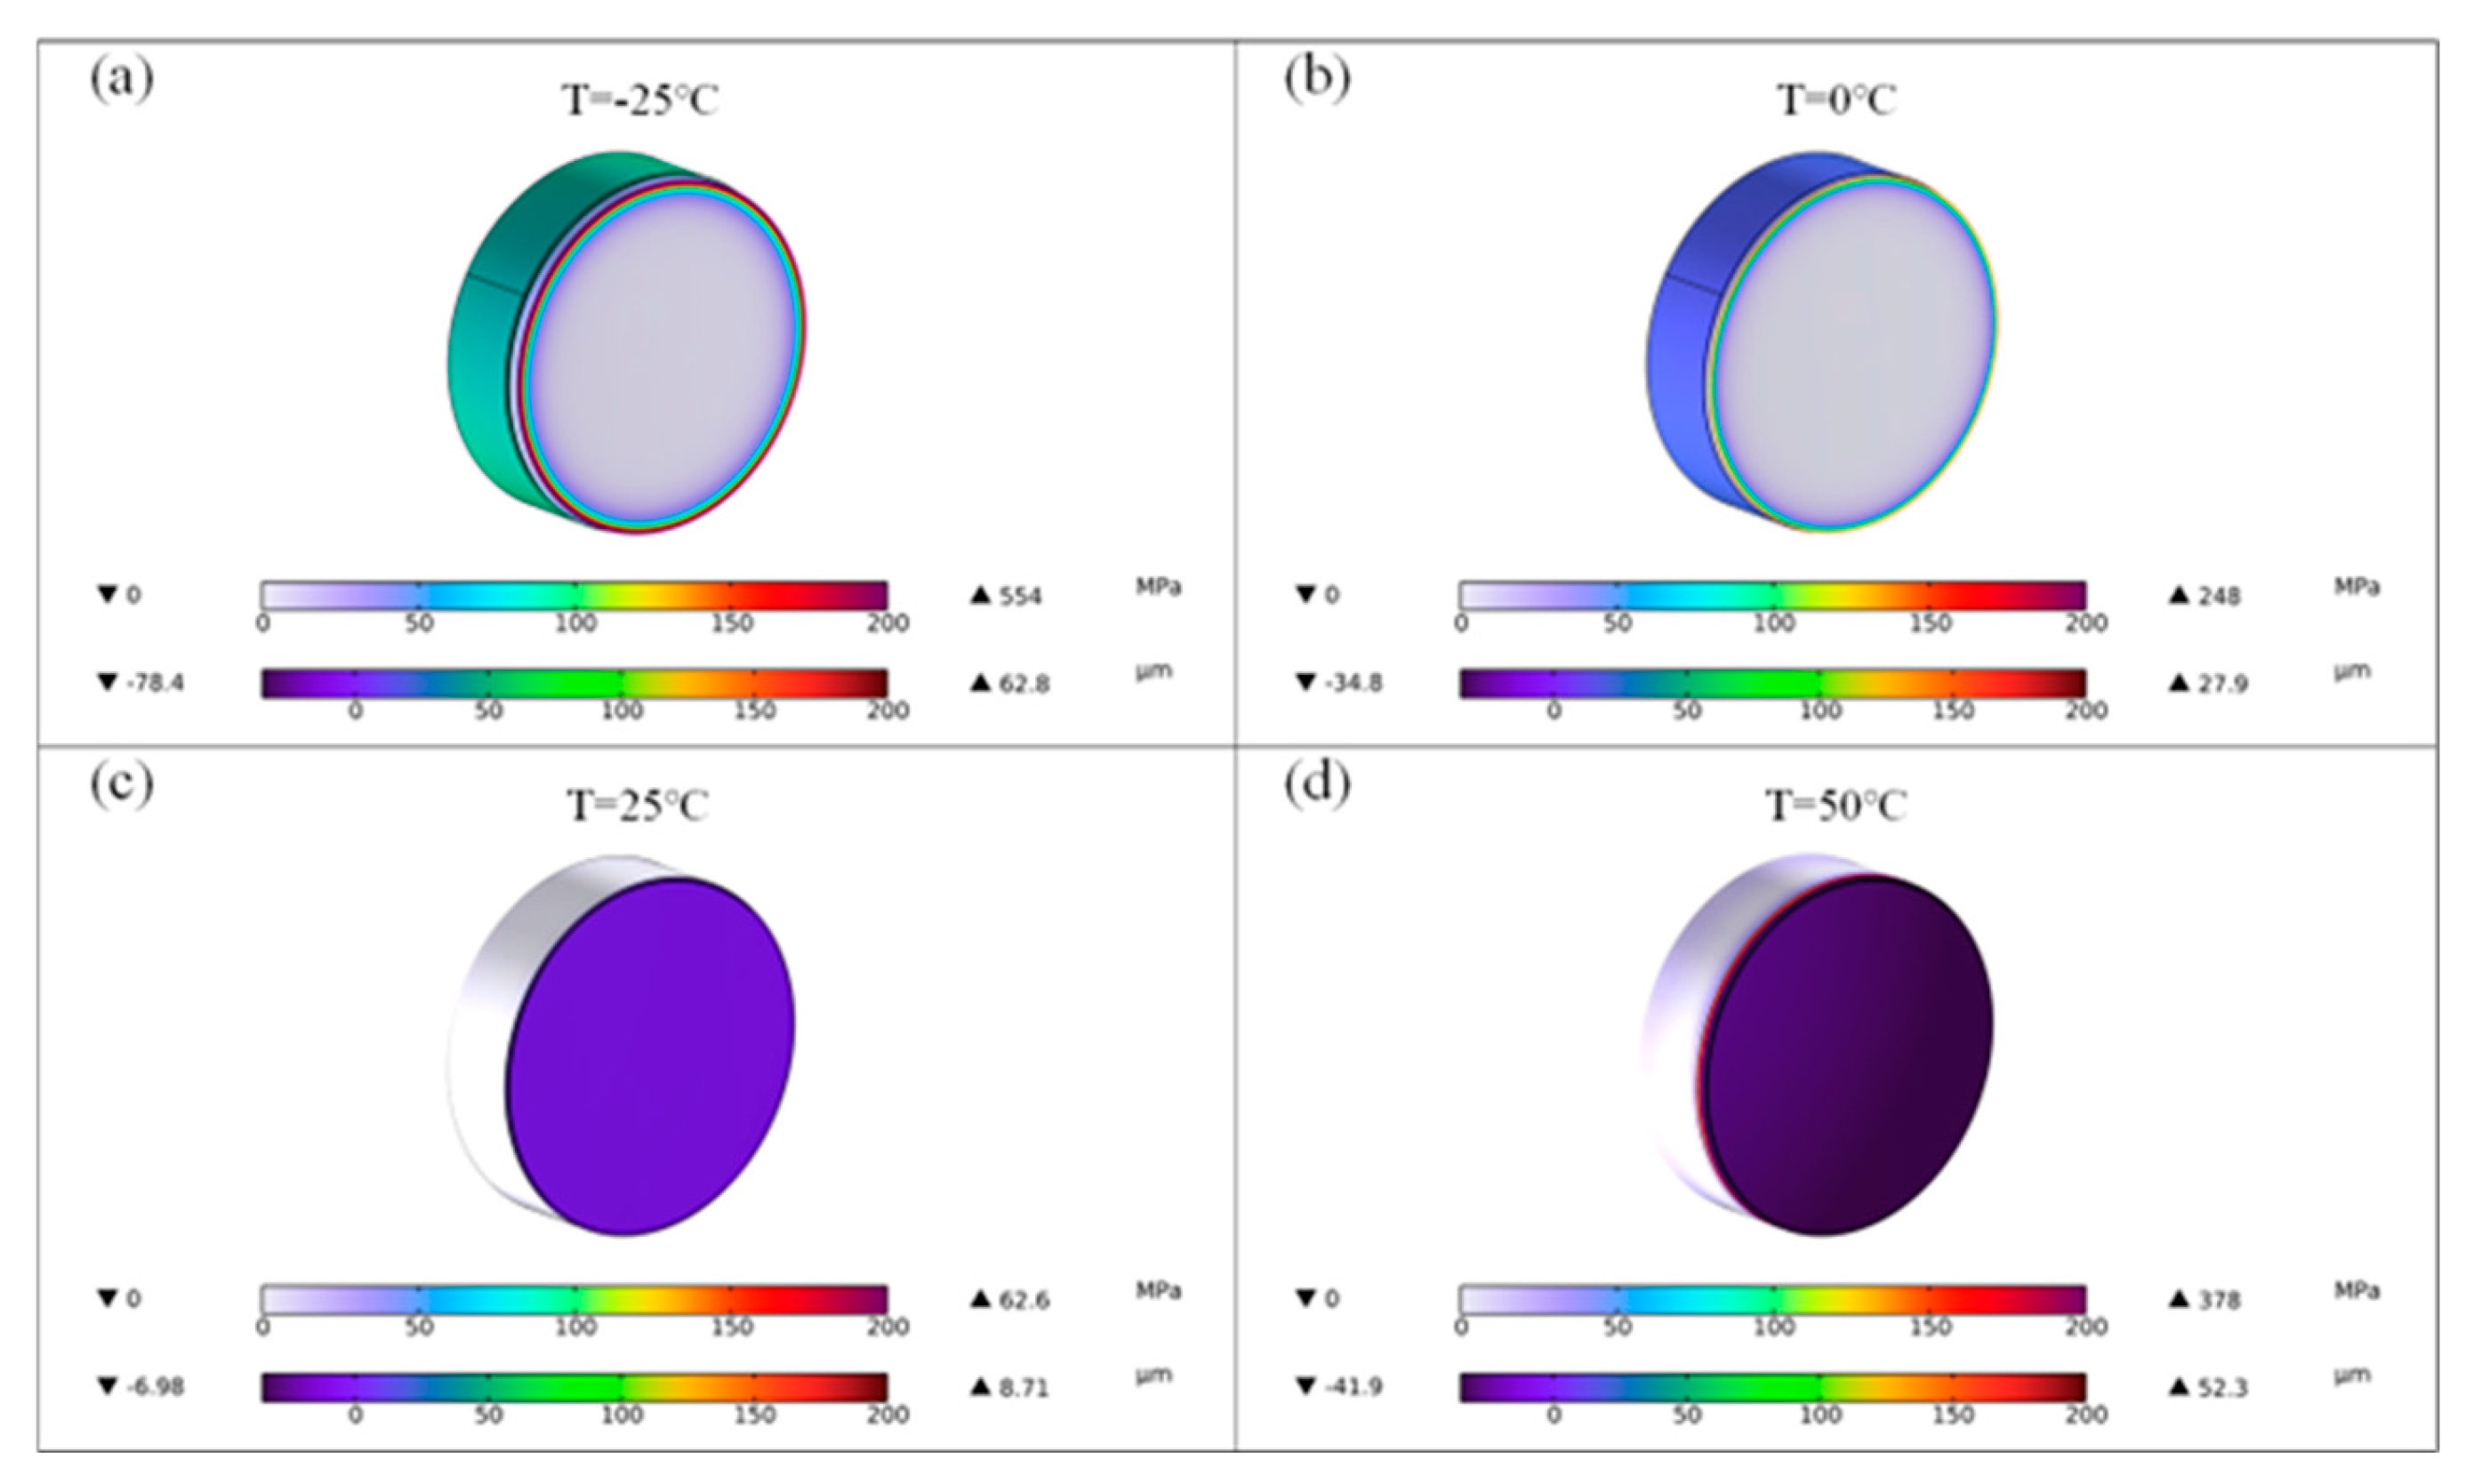
4.1. Stress Analysis

The simulation results show the stress field distribution of the off-axis integrated cavity optical system at different temperatures, as illustrated in Figure 4. The different colors in the cross-section represent the magnitude of the stress, with the brightest colors between the two mirrors indicating the highest stress. The figure displays the ray trajectories and a sectional view of three-fourths of the off-axis integrated cavity optical system, highlighting the stress field distribution in the cross-section. As the temperature of the optical system increases from −25 °C to 50 °C, the thermal expansion and contraction effects of the materials, along with the fixed constraints of the two supports on the cavity, lead to stress concentration in the constrained areas. From the figure, it can be observed that at −2 °C, the system experiences contraction, resulting in increased stress, with the maximum stress reaching 731 MPa. At 0 °C and 25 °C, the stress gradually decreases, with maximum stresses of 327 MPa and 79.3 MPa, respectively. At 50 °C, the system undergoes thermal expansion, causing the stress to increase again, with a maximum stress of 478 MPa. However, at −25 °C, the system experiences the highest overall stress, which has the greatest impact on the optical path.

4.2. Thermal Deformation Analysis

The system’s temperature variation ranges from −25 °C, 0 °C, 2 °C, to 50 °C. Due to the thermal expansion and contraction effects of the materials and the fixed constraints in the middle of the cavity, the system undergoes thermal deformation. The ray trajectories and temperature distribution are mutually coupled, with the ray trajectories affecting the temperature field, while the temperature field interferes with the ray trajectories through induced structural deformation. The simulation results show the deformation distribution of the off-axis integrated cavity optical system at different temperatures, as illustrated in Figure 5. Since the deformation of the optical system is minimal, the results have been amplified for clearer observation of the structural changes, with the wireframe indicating the structure before deformation. The figure reveals that at −25 °C, the system contracts due to thermal contraction effects, with a maximum deformation of 114 μm. At 50 °C, the system expands due to thermal expansion effects, with a maximum deformation of 76.1 μm. However, at −25 °C, the overall deformation of the system is greater, having a more significant impact on the optical path.

4.3. Deformation Analysis of the First Mirror

Mirrors are crucial for the transmission of laser beams, making it essential to analyze their deformation. Figure 6 illustrates the stress and deformation of the first mirror at different temperatures. The colored sections in the figure represent the structure before deformation, while the white sections indicate the structure after deformation. The colored rings represent the magnitude of the stress. From the figure, it is evident that the displacement of the mirror varies with temperature. At −25 °C, the maximum displacement of the mirror reaches 78.4 μm, and at 50 °C, it reaches 52.3 μm. The surface deformation of the mirror causes changes in the optical propagation of the system under different temperature conditions, ultimately affecting the imaging quality of the optical system. As the temperature increases from −25 °C to 50 °C, the root-mean-square radius values are 73.2 μm, 73.4 μm, 74.2 μm, and 75.4 μm, respectively. Subsequent optimization designs can use this information to reduce mirror position changes caused by temperature variations.

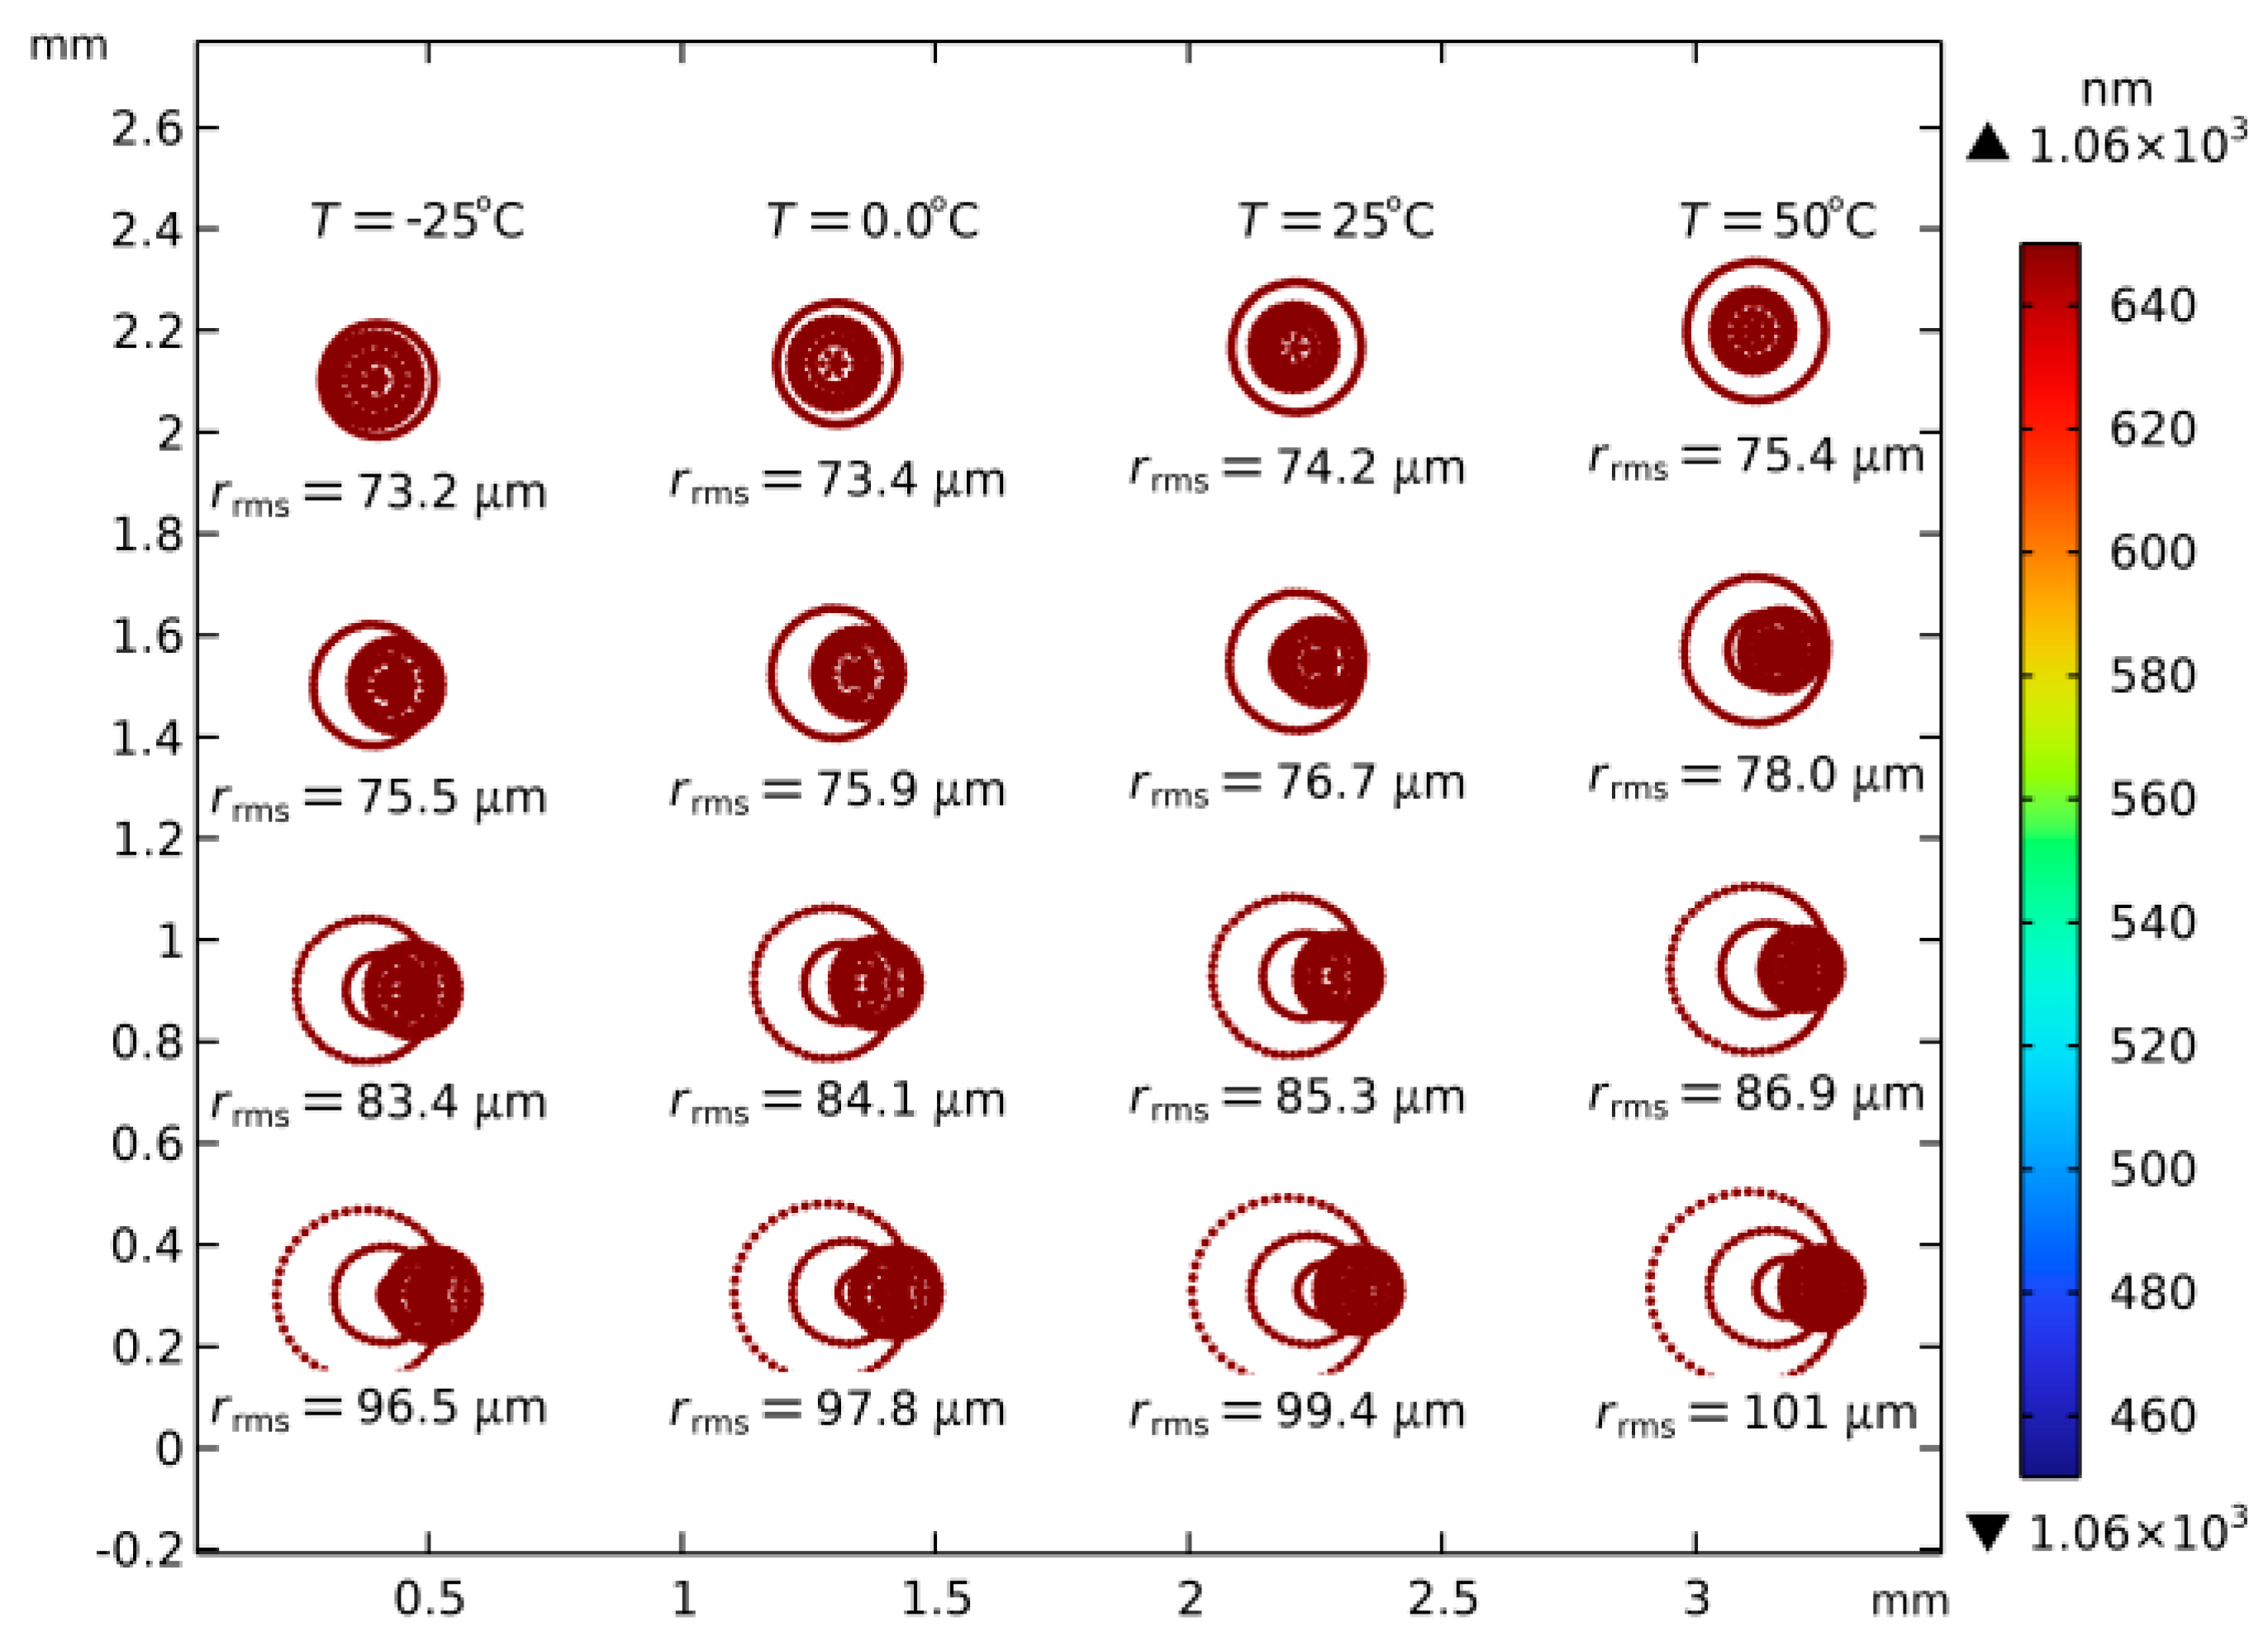
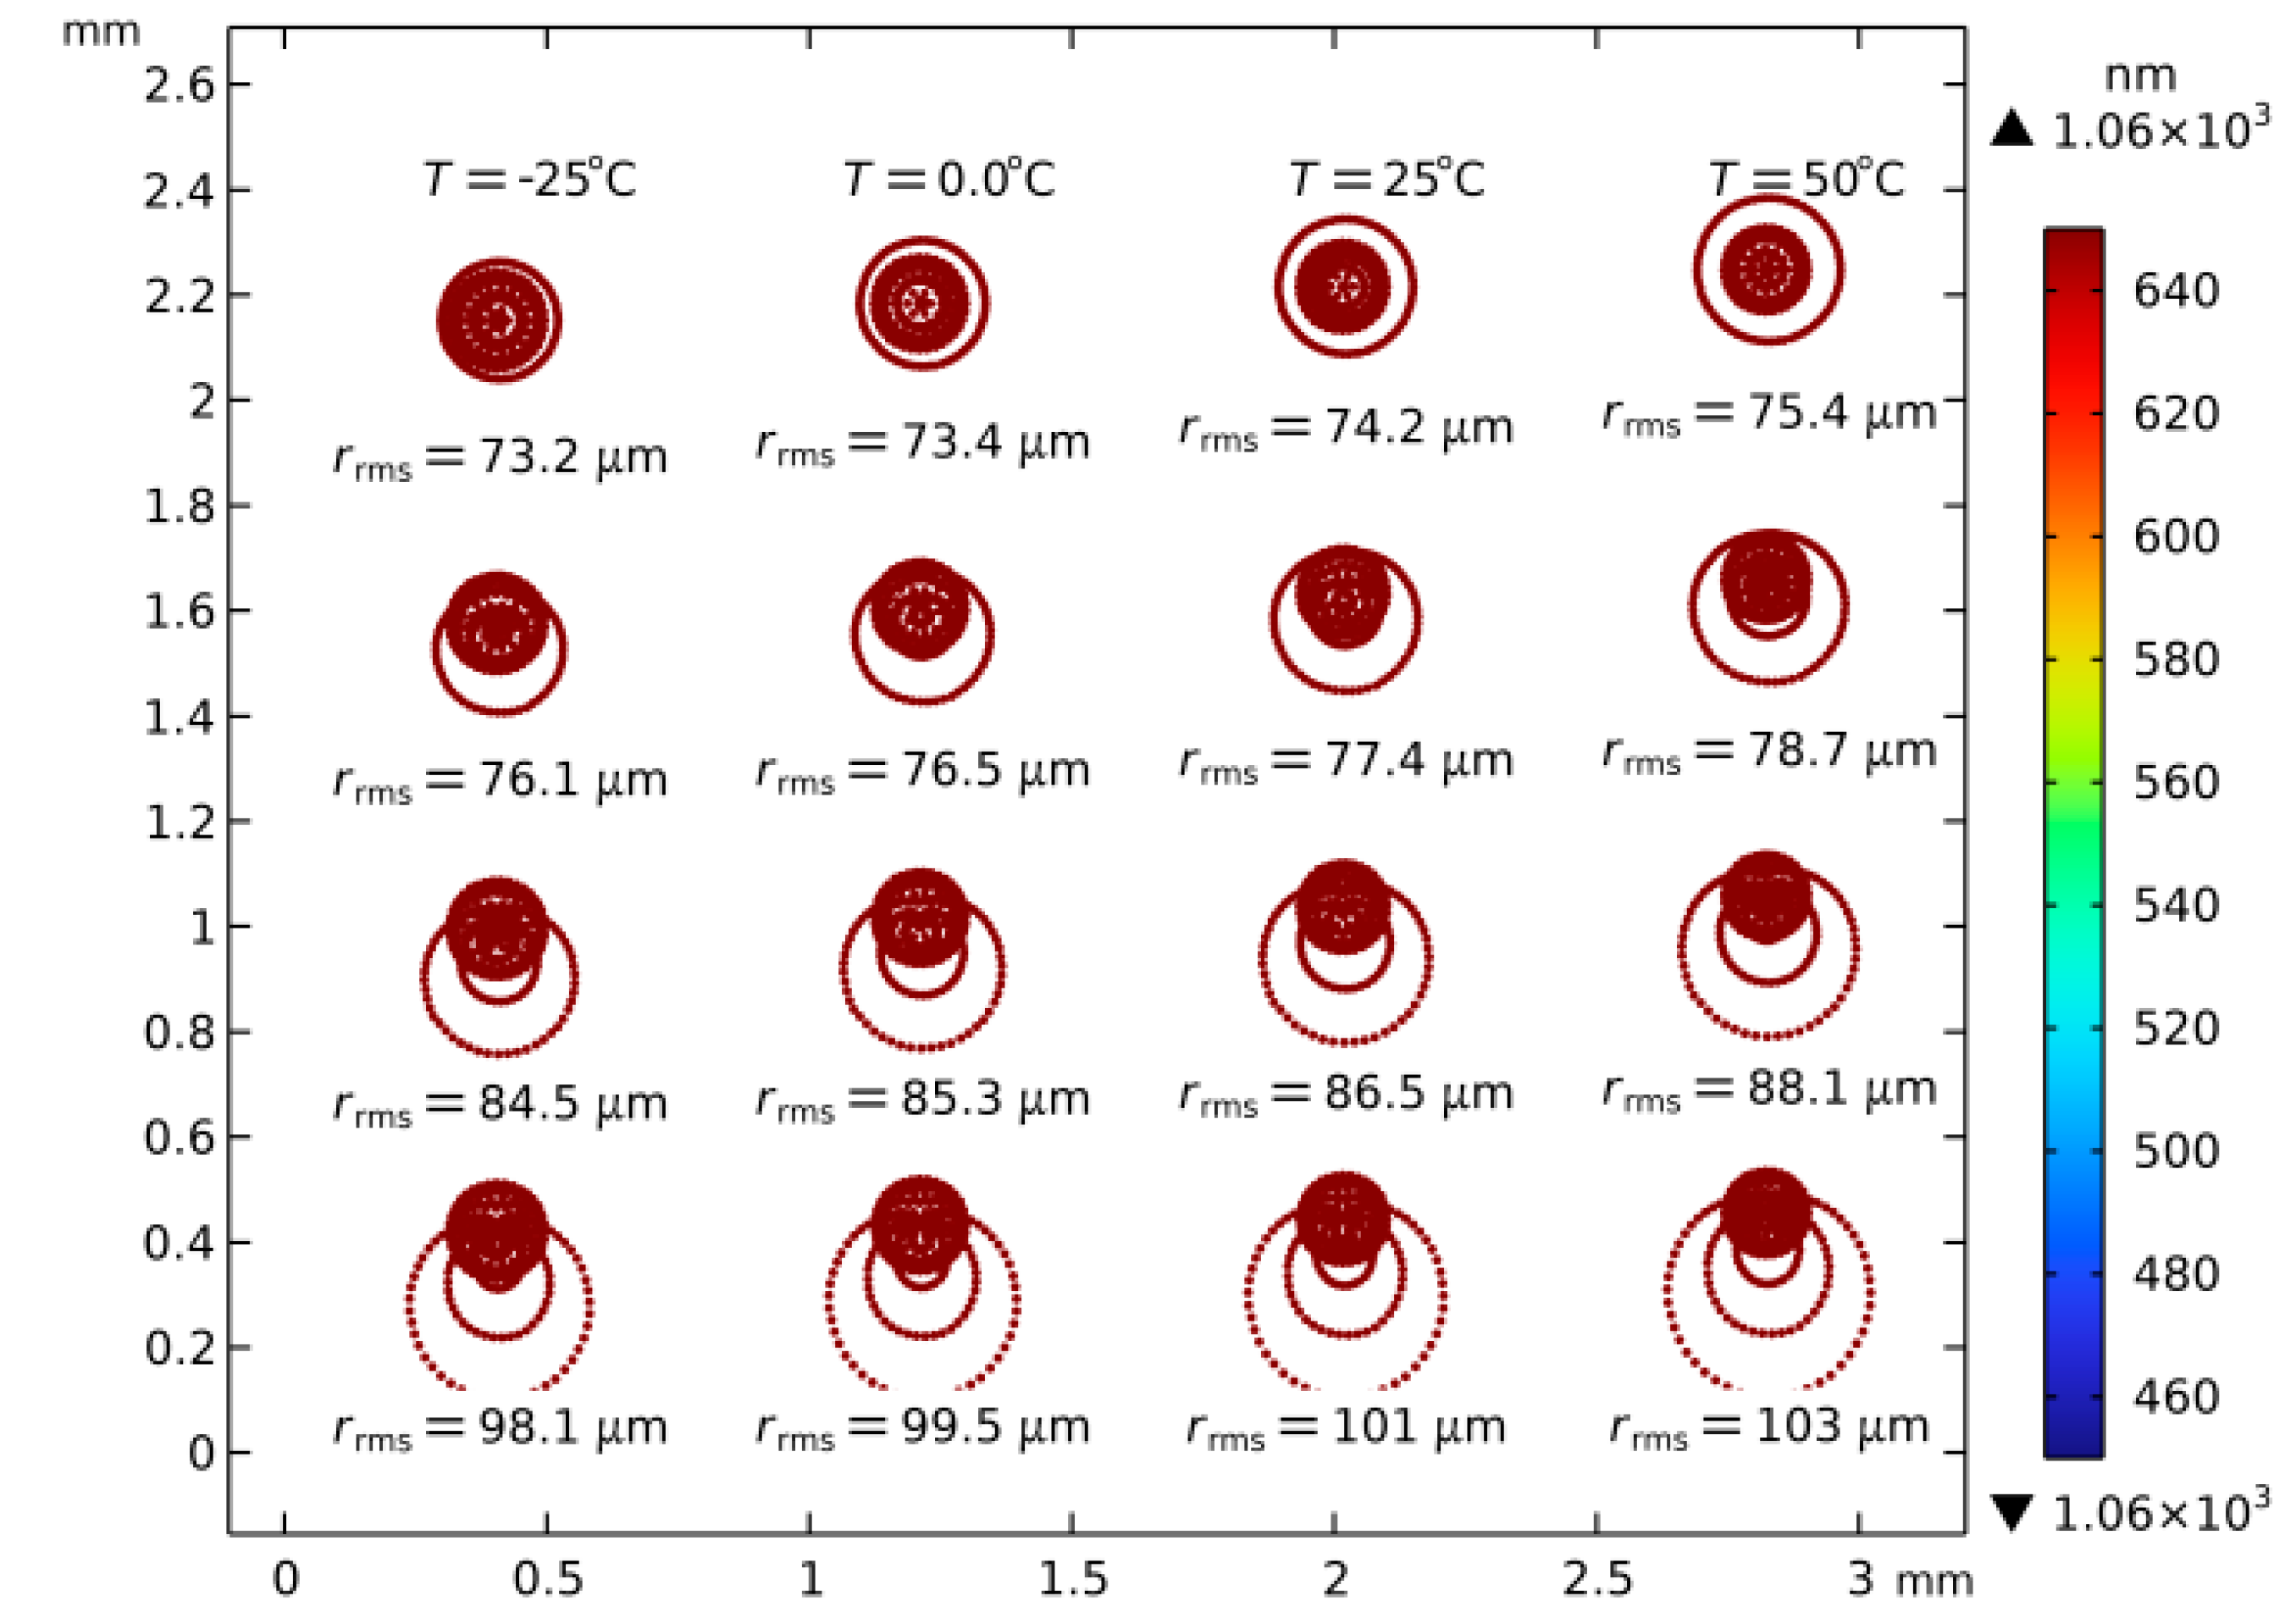
4.4. Spot Diagram Analysis

Laser light enters the optical cavity off-axis through a high-reflectivity mirror, undergoing multiple reflections within the chamber before being converged by a plano-convex lens and finally reflecting onto the surface of a photodetector. By adjusting the off-axis incident angle of the light source in the XY directions, the distribution of the light spot on the detector surface was analyzed to evaluate the performance of the off-axis integrated cavity device. Figure 7 and Figure 8 show the distribution of the point patterns of the off-axis integrated cavity optical system at different temperatures, as well as the impact of different incident angles on the light spot distribution on the detector surface. The deviation of the light source in the X direction affects the left–right distribution of the light spot, with the spot distribution gradually widening as the X direction angle increases. Similarly, the deviation in the Y direction affects the up–down distribution, with the spot distribution lengthening as the Y direction angle increases. The larger the off-axis incident angle in the XY directions, the more higher-order modes are excited within the cavity, making the cavity modes denser and the surface spot distribution more uniform, thus increasing the system’s signal-to-noise ratio. However, excessively large incident angles can lead to an enlarged spot distribution, which may exceed the detector surface.
Figure 9 shows the root-mean-square (RMS) radius values corresponding to different incident angles at 25 °C. These results indicate that within a certain range of incident angles, the larger the incident angle, the greater the RMS radius, leading to a wider spot distribution.

5. Conclusions

Based on COMSOL finite element simulation software, this study comprehensively considers the geometrical optics, solid mechanics, and solid heat transfer physics fields to simulate the behavior of an off-axis integrated cavity optical system under varying environmental temperatures. A multiphysics-coupled simulation model suitable for off-axis integrated cavities has been established. Numerical simulation results indicate that changes in the external temperature lead to variations in the system’s stress field distribution and deformations of the optical mirrors, with the magnitude of deformation being closely related to the temperature. The deformation of the optical system tends to expand or contract around a defined constraint area; increasing the rigidity of this area can improve the system’s stability. The image quality at the optimal focal plane of the optical system changes with the temperature under different thermal conditions. An external thermostat can be added to maintain the optical system at the optimal temperature. Additionally, different off-axis incident angles affect the spot distribution; larger angles result in more uniform spot distributions and higher signal-to-noise ratios. However, if the incident angle is too large, the spot may exceed the detector surface. Using COMSOL for the parametric design of the model, we can easily adjust system parameters (such as cavity dimensions and material properties) and find the optimal design solution with the optimization module. The findings of this study provide insights into the deformation, imaging performance, and optimization of off-axis integrated cavity optical systems under various environmental temperatures.

Author Contributions

Conceptualization, X.T., J.Y. and G.C.; methodology, X.T.; software, J.Y.; validation, S.C., X.C. and J.Y.; formal analysis, T.M. and J.Y.; writing—original draft preparation, J.Y.; writing—review and editing, X.T.; supervision, X.T., J.Y. and G.C.; project administration, X.T. and G.C.; funding acquisition, X.T. and G.C. All authors have read and agreed to the published version of the manuscript.

Funding

This research was funded by the Medical Special Cultivation Project of Anhui University of Science and Technology (grant number YZ2023H1B010) and the Supplementary Material Natural Science Foundation of China (grant number 62105005).

Institutional Review Board Statement

Not applicable.

Informed Consent Statement

Not applicable.

Data Availability Statement

Data are contained within the article.

Conflicts of Interest

The authors declare no conflicts of interest.

References

  1. Liu, Y.X.; Wang, Z.B.; Wei, X.X.; Wang, J.J.; Meng, X.; Mao, G.L. Simultaneous detection of CH4 and CO2 through dual modulation off-axis integrated cavity output spectroscopy. Chin. Phys. B 2023, 32, 104209. [Google Scholar] [CrossRef]
  2. Ngo, M.; Nguyen-Ba, T.; Dewaele, D.; Cazier, F.; Zhao, W.X.; Nähle, L.; Chen, W.D. Wavelength modulation enhanced off-axis integrated cavity output spectroscopy for OH radical measurement at 2.8 µm. Sens. Actuat. A Phys. 2023, 362, 114654. [Google Scholar] [CrossRef]
  3. Yang, X.; Zhang, Z.R.; Xia, H.; Sun, P.S.; Pang, T.; Wu, B.; Liu, X.; Guo, Q. Re-injection off-axis integrated cavity output spectroscopy for the simultaneous detection of N2O, H2O and CO with a mid-infrared QCL laser. Analyst 2024, 149, 909–916. [Google Scholar] [CrossRef] [PubMed]
  4. Zheng, K.Y.; Zhang, L.; Leng, S.; Xi, Z.H.; Zheng, C.T.; Wang, Y.D.; Tittel, F.K. An exhaled breath gas sensor system for near-infrared ammonia measurement and kidney diagnostics. Spectrochim. Acta A 2024, 321, 124625. [Google Scholar] [CrossRef]
  5. Shao, L.G.; Mei, J.X.; Chen, J.J.; Tan, T.; Wang, G.S.; Liu, K.; Gao, X.M. Recent advances and applications of off-axis integrated cavity output spectroscopy. Microw. Opt. Technol. Let. 2022, 65, 1489–1505. [Google Scholar] [CrossRef]
  6. Long, F.Y.; Gao, G.Z.; Zhang, M.K.; Jiang, Y.H.; Cai, T.D. Multi-laser sensor for simultaneous multi-gas measurements using off-axis cavity-enhanced absorption spectroscopy with an opposite two-way configuration. Opt. Lett. 2022, 47, 1339–1342. [Google Scholar] [CrossRef] [PubMed]
  7. Tian, X.; Cheng, G.; Cao, Y.N.; Chen, J.J.; Liu, K.; Gao, X.M. Simultaneous detection of hydrogen sulfide and carbon dioxide based on off-axis integrated cavity output spectroscopy using a near-infrared distributed feedback diode laser. Microw. Opt. Technol. Let. 2021, 63, 2074–2078. [Google Scholar] [CrossRef]
  8. Yuan, Z.H.; Huang, Y.B.; Zhao, Q.; Zhang, L.L.; Lu, X.J.; Huang, J.; Qi, G.; Luo, T.; Cao, Z.S. Dual-path coupling V-shaped structure off-axis integrated cavity output spectroscopy (V-OA-ICOS) for water vapor stable isotope detection at 3.66 μm. Sens. Actuat. B Chem. 2024, 410, 135676. [Google Scholar] [CrossRef]
  9. Gao, Q.Y.Y.; Zheng, Y.Q.; Wang, L.; Li, C.L.; Zhang, J.L.; Wu, H.; Han, Y.X.; Wang, S. Designing a Long Optical Path Direct-Injection-Integrated Cavity for Laser Absorption Spectroscopy. Photonics 2023, 11, 36. [Google Scholar] [CrossRef]
  10. He, Q.Y.; Chang, J.; Li, J.K.; Zheng, C.T.; Tittel, F.K. On-line measurement of atmospheric oxygen by an open-path OA-ICOS based sensor with high accuracy at ambient pressure. Infrared Phys. Technol. 2023, 131, 104699. [Google Scholar] [CrossRef]
  11. Moyer, E.J.; Sayres, D.S.; Engel, G.S.; Clair, J.M.; Keutsch, F.N.; Allen, N.T.; Kroll, J.H.; Anderson, J.G. Design considerations in high-sensitivity off-axis integrated cavity output spectroscopy. Appl. Phys. B Lasers Opt. 2008, 92, 467–474. [Google Scholar] [CrossRef]
  12. Chu, Y.F.; Wang, Z.E.; Xue, L.L.; Deng, M.; Lin, G.; Xie, H.L.; Shin, H.H.; Li, W.W.; Firl, G.; D‘Amico, D.F.; et al. Characterizing warm atmospheric boundary layer over land by combining Raman and Doppler lidar measurements. Opt. Express 2022, 30, 11892–11911. [Google Scholar] [CrossRef] [PubMed]
  13. Li, A.H.; Bian, Y.M.; Liang, Y.C.; Zhu, Y.J. Integrated design for large-scale opto-mechanical structure. Opt. Appl. 2009, 39, 383–389. [Google Scholar]
  14. Li, L.; Xing, K.M.; Zhao, M.; Wang, B.X.; Chen, J.F.; Zhuang, P. Optical–Mechanical Integration Analysis and Validation of LiDAR Integrated Systems with a Small Field of View and High Repetition Frequency. Photonics 2024, 11, 179. [Google Scholar] [CrossRef]
  15. Trim, S.J.; Butler, S.L.; Spiteri, R.J. Benchmarking multiphysics software for mantle convection. Comput. Geosci. 2021, 154, 104797. [Google Scholar] [CrossRef]
  16. Zhao, X.T.; He, F.Y.; Xue, Y.W.; Ma, W.H.; Yin, X.H.; Xia, S.K.; Zeng, M.J.; Du, G.X. High-resolution imaging of magnetic fields of banknote anti-counterfeiting strip using fiber diamond probe. Chin. Phys. B 2024, 33, 048502. [Google Scholar] [CrossRef]
  17. Codau, E.; Codau, T.C.; Lupu, I.G.; Raru, A.; Farima, D. Heat transfer simulation through textile porous media. J. Text. Inst. 2023, 114, 257–264. [Google Scholar] [CrossRef]
  18. Che, C.Q.; Yan, B.F.; Fu, C.J.; Li, G.N.; Qin, C.X.; Liu, L.Q. Improvement of cable current carrying capacity using COMSOL software. Energy Rep. 2022, 8, 931–942. [Google Scholar] [CrossRef]
  19. Kumar, B.; Banerjee, A.; Das, R.; Manna, B. Frequency dependent effective modulus of square grid lattice using spectral element method. Mech. Mater. 2023, 184, 104695. [Google Scholar] [CrossRef]
  20. Wang, J.G.; Gao, C.; Duan, X.; Mao, K. Multi-field Coupling Simulation and Experimental Study on Transformer Vibration Caused by DC Bias. J. Electr. Eng. Technol. 2015, 10, 176–187. [Google Scholar] [CrossRef]
  21. Zhao, W.K.; Teng, Y.; Tang, K.; Zhu, S.M.; Yang, K.; Duan, J.J.; Huang, Y.M.; Chen, Z.A.; Ye, J.D.; Gu, S.L. Significant suppression of residual nitrogen incorporation in diamond film with a novel susceptor geometry employed in MPCVD. Chin. Phys. B 2022, 31, 118102. [Google Scholar] [CrossRef]
  22. Callegari, A.; Mijalkov, M.; Gököz, A.B.; Volpe, G. Computational toolbox for optical tweezers in geometrical optics. J. Opt. Soc. Am. B 2015, 32, 11–19. [Google Scholar] [CrossRef]
  23. Jin, H.X.; Zhang, E.R.; Espinosa, H.D. Recent Advances and Applications of Machine Learning in Experimental Solid Mechanics: A Review. Appl. Mech. Rev. 2023, 75, 061001. [Google Scholar] [CrossRef]
  24. Patel, M.S.; Yong, Y.K.; Tanaka, M. Drive level dependency in quartz resonators. Int. J. Solids Struct. 2009, 46, 1856–1871. [Google Scholar] [CrossRef]
  25. Luzzi, L.; Cammi, A.; Marcello, V.; Fiorina, C. An approach for the modelling and the analysis of the MSR thermo-hydrodynamic behaviour. Chem. Eng. Sci. 2010, 65, 4873–4883. [Google Scholar] [CrossRef]
Figure 1. Simulation analysis process of off-axis integrated cavity optical sensing system.
Photonics 11 00720 g001
Figure 2. Geometric structure of off-axis integrated cavity optical system.
Photonics 11 00720 g002
Figure 3. Grid structure of off-axis integrated cavity optical system.
Photonics 11 00720 g003
Figure 4. The stress analysis results under different temperature conditions. (a) −25 °C (b) 0 °C (c) 25 °C (d) 50 °C. The color shows the magnitude of the stress in the cross-section.
Photonics 11 00720 g004
Figure 5. The thermal deformation analysis results under different temperature conditions. (a) −25 °C (b) 0 °C (c) 25 °C (d) 50 °C.
Photonics 11 00720 g005
Figure 6. The deformation analysis results of the first reflector under different temperature conditions. (a) −25 °C (b) 0 °C (c) 25 °C (d) 50 °C.
Photonics 11 00720 g006
Figure 7. The deviation of the X direction of the light source affects the left and right distribution of the light spot.
Photonics 11 00720 g007
Figure 8. The deviation of the Y direction of the light source affects the up-and-down distribution of the light spot.
Photonics 11 00720 g008
Figure 9. Root-mean-square radius values corresponding to different incident angles.
Photonics 11 00720 g009
Table 1. The properties of Steel AISI 4340 material.
Coefficient of Thermal Expansion (1/K)12.3 × 10−6
Heat capacity at constant pressure (J/kg·K)475
Relative dielectric constant1
Density (kg/m3)7850
Thermal conductivity (W/m·K)44.5
Young’s modulus (GPa)205
Poisson’s ratio0.28
Disclaimer/Publisher’s Note: The statements, opinions and data contained in all publications are solely those of the individual author(s) and contributor(s) and not of MDPI and/or the editor(s). MDPI and/or the editor(s) disclaim responsibility for any injury to people or property resulting from any ideas, methods, instructions or products referred to in the content.

