Article

The Method and Experiment of Micro-Crack Identification Using OFDR Strain Measurement Technology

National Key Laboratory of Intense Pulsed Radiation Simulation and Effect, Northwest Institute of Nuclear Technology, Xi’an 710024, China
*
Author to whom correspondence should be addressed.
Photonics 2024, 11(8), 755; https://doi.org/10.3390/photonics11080755 (registering DOI)
Submission received: 16 July 2024 / Revised: 8 August 2024 / Accepted: 11 August 2024 / Published: 13 August 2024
(This article belongs to the Special Issue Fiber Optic Sensors: Science and Applications)

Abstract

:
The precise evaluation of micro-crack sizes and locations is crucial for the safe operation of structures. Traditional detection techniques, however, suffer from low spatial resolution, making it difficult to accurately locate micrometer-scale cracks. A method and experimental study were proposed in this paper for identifying and locating micro-cracks using optical fiber strain sensing based on OFDR to address this issue. The feasibility of this method for micro-crack detection was verified by the combination of a polyimide-coated sensing optical fiber (PISOF) and tight sheath sensing optical fiber (TSSOF). A calculation method for micro-crack widths based on distributed optical fiber strain curves was established, and the test results of different optical fibers were compared. Through multiple verification experiments, it was found that the strain peak curves of both fiber types could accurately locate micro-cracks with a precision of 1 mm. Additionally, the crack widths could be obtained by processing the distributed strain curves using a computational model, enabling the accurate capture of micro-crack characteristics at the 10 μm level. A strong linear relationship was observed between the optical fiber stretching length and the crack width. Notably, the relative error in calculating the crack width from the strain curve of PI fiber was very small, while a linear relationship existed between the maximum strain value of the TSSOF and the crack width, allowing for the calculation of the crack width based on the maximum strain value. This further validated the feasibility of the method designed in this paper for the analysis of micro-crack characteristic parameters.

1. Introduction

The performance parameters of micro-cracks play a crucial role in the research of the mechanical efficiency or safe operation of various materials and structural devices [1,2]. Their size and location are of significant importance for structural safety assessments, as structures such as reinforced concrete and composites are prone to cracking due to manufacturing defects or external factors during long-term use. Early detection of cracks can ensure the safety and stable operation of structures, thus avoiding the degradation of structural performance and serious consequences [3,4,5]. Therefore, crack detection techniques have received increasing attention. At that time, mature detection techniques were mainly comprised of non-destructive testing methods, such as ultrasonic, machine vision, or laser measurement [6,7,8,9,10,11]. Among these methods, ultrasonic technology exhibited multiple propagation modes within structures, including non-metals and composites, thus posing difficulties in accurately locating defects [12]. Digital image-related techniques were limited to monitoring changes solely on the surface of structures and were constrained by their specific usage scenarios [13]. Especially in the case of micrometer-scale cracks, Yin S. utilized the interaction between Lamb waves and micro-cracks to achieve their localization [14]. Wang J. proposed that the static component (SC) induced by Lamb waves could effectively locate one or multiple micro-cracks [15]. However, these methods solely achieved localization, with unknown precision and an inability to accurately quantify the size of cracks.
Optical fiber sensors, renowned for their small size, light weight, corrosion resistance, and immunity to electromagnetic interference, had been extensively utilized in structural health monitoring [16,17]. Their inert silica composition, coupled with the flexible sensing fibers of micro-scale diameters, permitted embedded deployment and facile coupling with test objects. At that time, sensing technologies for optical fiber sensors were primarily divided into FBG quasi-distributed and fiber-distributed types. Among them, FBG monitored the local strain within the matrix by measuring shifts in characteristic wavelengths [18]. Fiber-distributed sensing technologies primarily encompassed OTDR and OFDR signal conditioning methods [19,20].
According to research conducted then, OTDR, including BOTDR and BOTDA techniques, was also present in structural health monitoring and was frequently applied to structures such as bridges and buildings [21,22,23]. Nevertheless, these monitoring techniques suffered from low spatial resolution, making it challenging to accurately locate micro-cracks and measure crack width. OFDR is one of the most rapidly developing distributed fiber sensing technologies in recent years. Leveraging its high spatial resolution of mm level and high recognition accuracy of 0.1 pm level, OFDR has shown promising application prospects in micro-scale measurement, making it possible to accurately measure cracks and quantify damage using distributed fiber sensors. In previous research, we utilized OFDR technology with weak grating WRFBG to achieve strain distribution patterns with a spatial resolution of 1.28 mm during the tensile process on the surface of steel reinforcement components. Cailing Fu achieved a sub-millimeter spatial resolution φ-OFDR fiber shape sensor through femtosecond laser-induced scattering arrays [24]. Therefore, OFDR has irreplaceable advantages in the field of high-density data measurement, directly benefiting the quantitative measurement of micro-crack sizes. Fiber sensors are influenced by external parameters such as the strain or temperature, resulting in changes in the Rayleigh scattering signals within the fiber, which serve as the basic demodulation basis for OFDR. Therefore, it is necessary to analyze and design detection methods based on the performance parameters of micro-cracks.
In response to the aforementioned issues, this paper proposes the demodulation of strain signals from sensing optical fiber contacts based on OFDR technology to characterize the performance parameters of micro-cracks. A PISOF and TSSOF with a diameter of 0.9 mm were employed to verify the feasibility of using OFDR technology for micro-crack detection. Multiple validation experiments were actively conducted, and the experimental data were analyzed to establish a method for calculating the micro-crack width based on distributed optical fiber strain curves. By utilizing the integral processing of the distributed strain, the crack width could be accurately obtained, successfully capturing the characteristics of micro-cracks at the 10-micrometer level. The strain peak curves of both fiber types used in the experiments accurately located the positions of the micro-cracks, revealing a linear relationship between the stretched length of the optical fiber and the crack width, with linearity approaching 1. Through processing the maximum values of the strain curves with standard distribution, it was found that there was a linear relationship between the maximum strain value of the PISOF and the size of the micro-crack, providing another method for quantifying the size of micro-cracks. The testing method proposed in this paper provides technical support for micro-crack detection.

2. Principles

2.1. The Micro-Crack Localization Principle Based on OFDR

The OFDR technique primarily focuses on the precise demodulation and control of the linear frequency-swept laser. Utilizing coherent detection techniques, it performs frequency-domain analysis on the beat signal, as depicted in Figure 1. By converting the collected reference and measurement signals through non-uniform fast Fourier transform into the distance domain, strain information can be obtained from different locations on the sensing optical fiber with high spatial resolution. OSI-S, the OFDR demodulation instrument used in this paper, has a high spatial resolution of 1 mm. The strain test range was from negative 12,000 με to positive 12,000 με, the demodulation wavelength range was from 1535 nm to 1576 nm, and the strain repetition accuracy was ±1 με, which can realize the measurement of extremely high-density strain data and spatial positioning of millimeter level.
With the uneven distribution of the refractive index, a certain position of optical fiber is affected by the temperature or strain, and Rayleigh scattering frequency shift occurs, and the frequency shift should be linear with the temperature. Its physical principle is that the length of the optical fiber can be converted into a strain or temperature change value through the change in the optical fiber length. The spatial resolution of OFDR-distributed fiber sensing technology is technically limited, based on the scanning wavelength bandwidth and scanning length of the laser. Theoretically, the higher the bandwidth, the smaller the testable spatial resolution value, and vice versa. The longer the length of the scan, the larger the selectable spatial resolution value, and vice versa.
When a metal sheet with a thickness of 0.5 mm was used to apply stress to the optical fiber, as shown in Figure 2, strain variations were induced at that location. The precise localization of different positions on the fiber was achieved through OFDR-distributed optical fiber sensing technology, and this location could be regarded as the actual position of the crack. As illustrated in Figure 3a, a strain peak was observed at the position of 2.060 m, which corresponded to the crack location in the tight sheath. Similarly, the crack location in the PISOF was identified at 2.425 m using the same method, as shown by the strain variations depicted in Figure 3b.

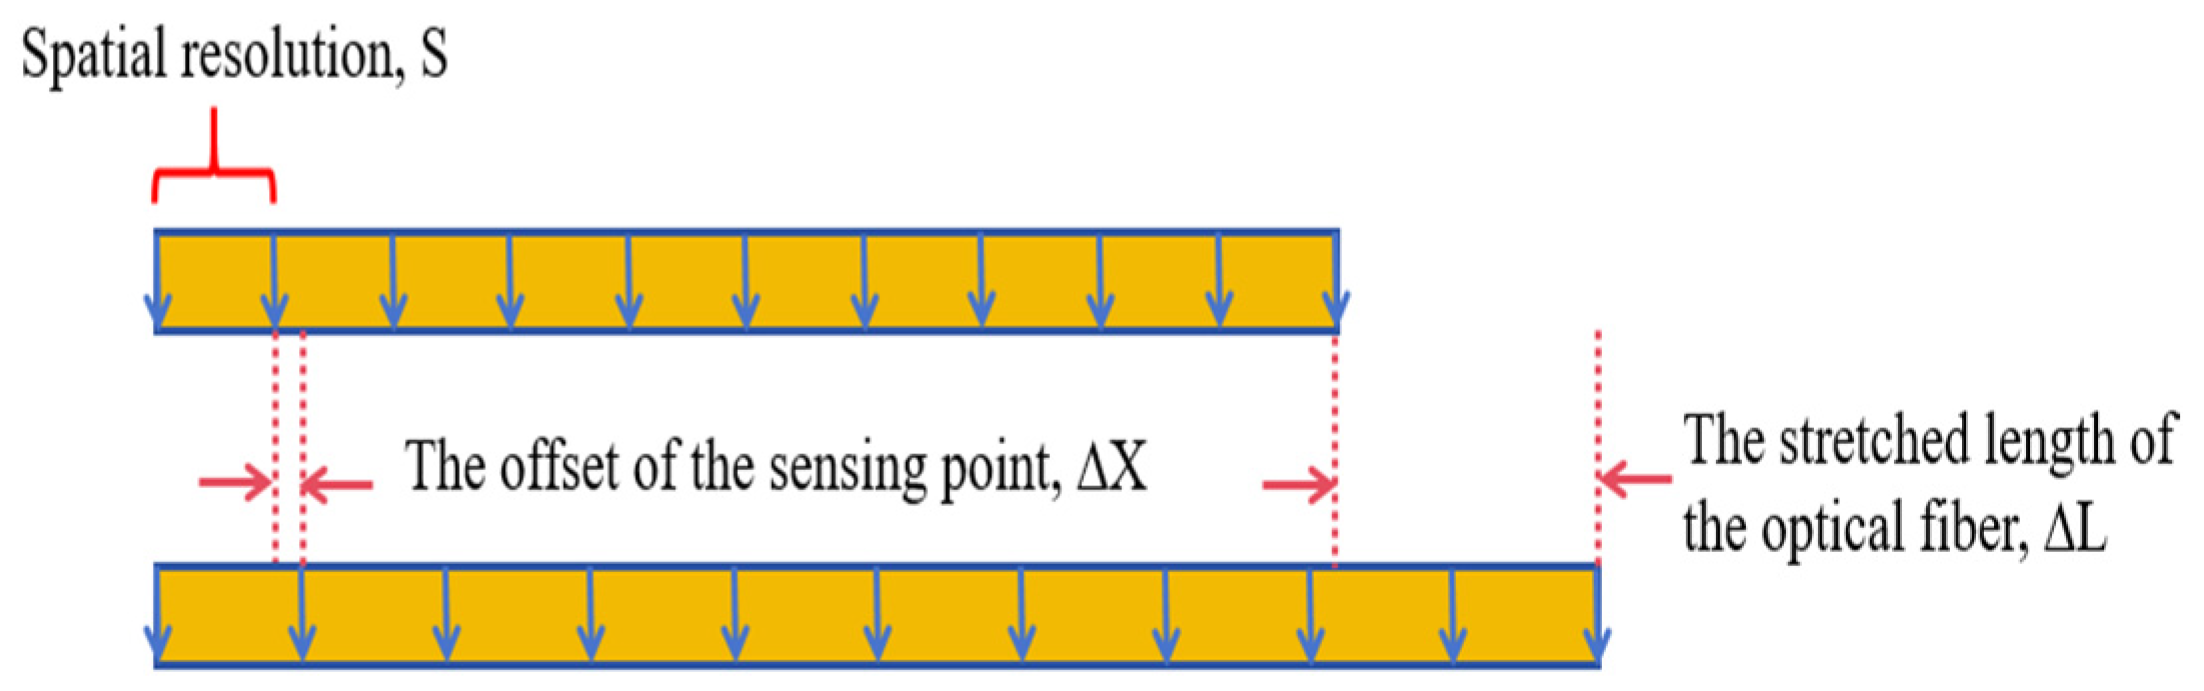
2.2. Calculation Method for Micro-Crack Width

When the optical fiber is stretched, its length changes. As a distributed sensor, the spacing between internal sensing points is determined by the selected spatial resolution. When strain variations occur at a sensing point, it indicates that the fiber length at that location has changed. The formula for calculating the offset of a sensing point is as follows:
Δ X n = S · ε n
The offset of a sensing point is denoted as ∆X, while εn represents the strain at each point, and S stands for the spatial resolution. As shown in Figure 4, by summing up the offsets of all sensing points, the total length change ∆L of the entire optical fiber segment can be obtained.
As the crack expands, the optical fiber undergoes stretching, resulting in strain concentration primarily near the crack region. Conversely, positions distant from the crack experience negligible strain variations. By integrating the offsets of sensing points adjacent to the crack exhibiting strain changes, it becomes possible to determine the elongation length of the optical fiber using this specific formula:
Δ L = i = n S · ε n
where ∆L is the fiber stretch length; since no deformation occurs at other positions of the fiber sensor, the fiber elongation can be considered as the crack width generated.

3. Experimental Preparation

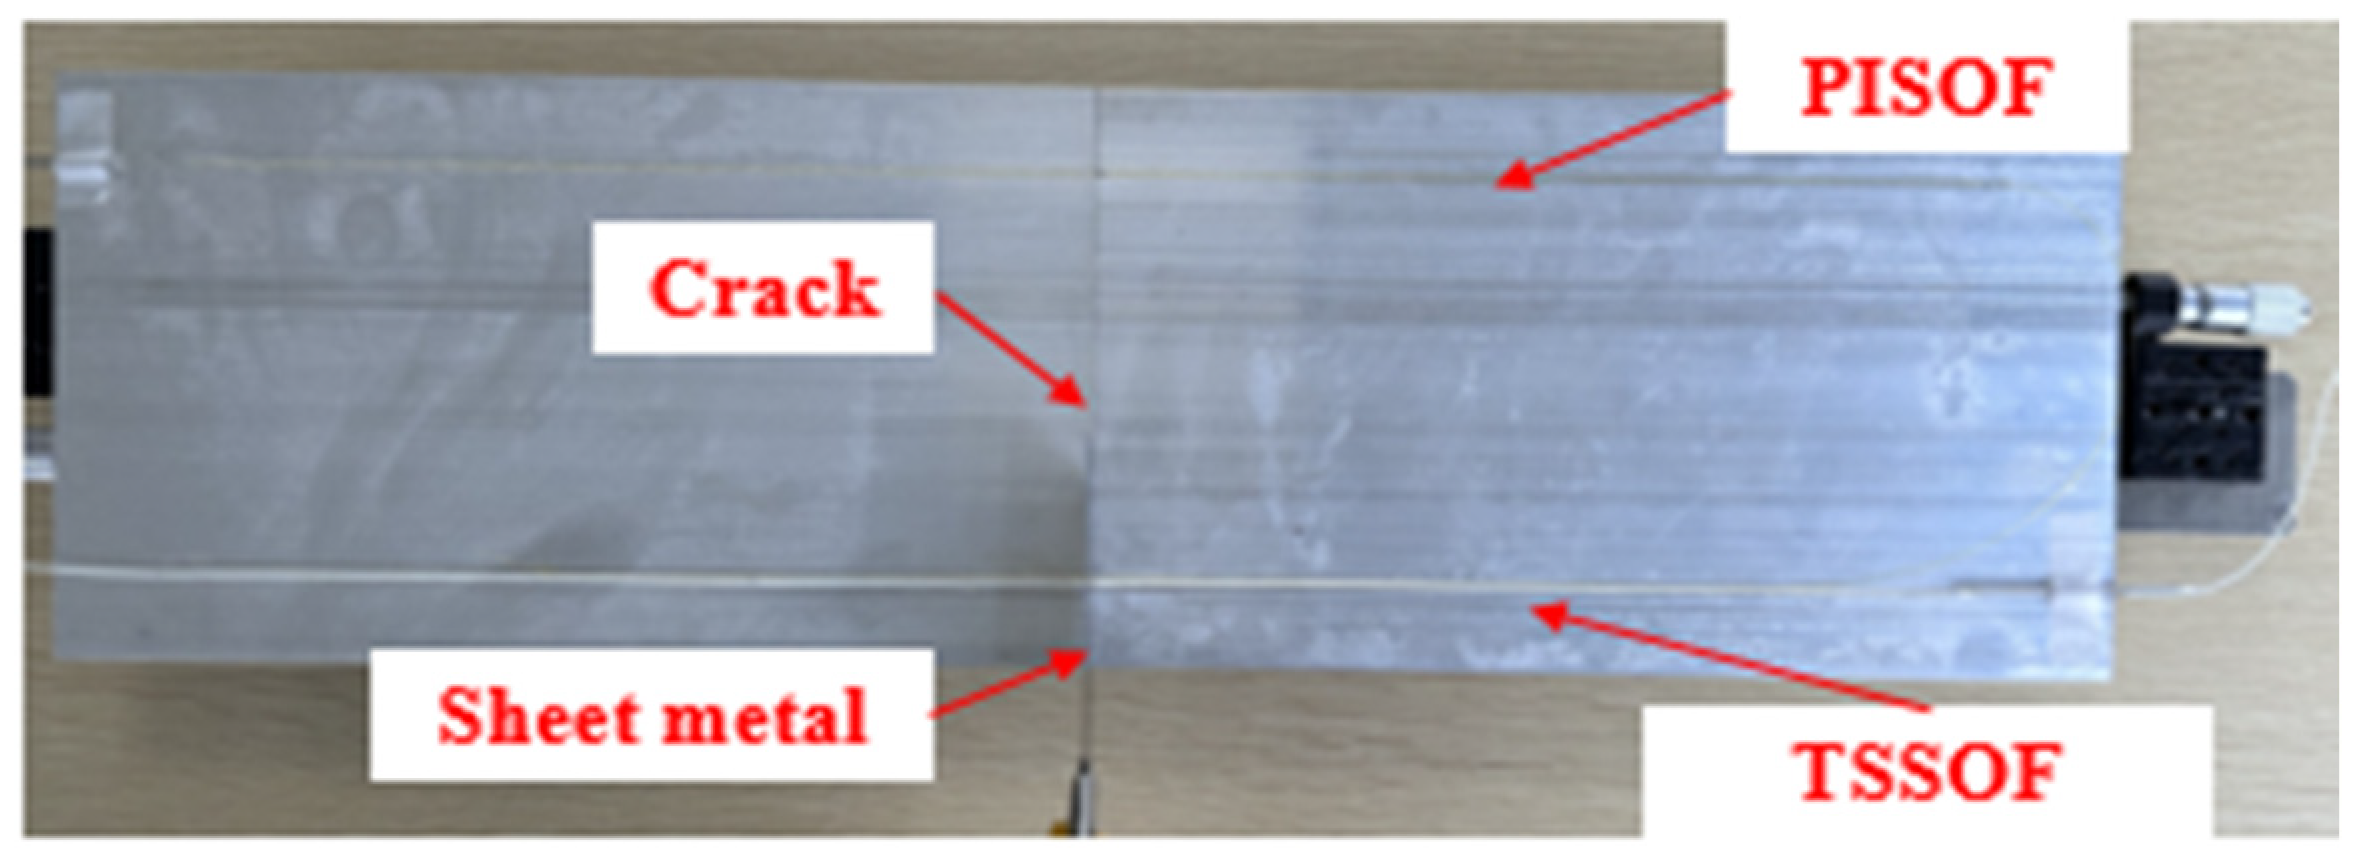
3.1. Experimental Setup

A slot was made in the middle of a steel plate using laser cutting. The cut steel plate was then fixed onto a slide rail, and its movement was controlled by a micrometer differential head to ensure a perfect fit between the cut sections. Epoxy resin glue was used to adhere a 0.9mm TSSOF and PISOF vertically and side by side onto the two steel plates. Because the loading stress is concentrated in the crack, where the glue is most likely to break, only the optical fiber at the crack is stretched, and the rest of the position is fixed by the glue. Figure 5a illustrates the experimental setup and the layout of the optical fibers.
With the steel plates in close contact, a reference point was selected, and one of the plates was fixed. The other plate was translated using the micrometer differential head, achieving a displacement precision of 10 μm. The displacement of this plate served as a measure of the crack size. The strain data of the optical fibers were recorded for crack sizes of 10 μm, 20 μm, 30 μm, 40 μm, and 50 μm. In this experiment, a 1 m fiber patch cord G65 was used to connect the experimental sample to the OSI-S. Figure 5b depicts the OFDR micro-crack identification and measurement system.

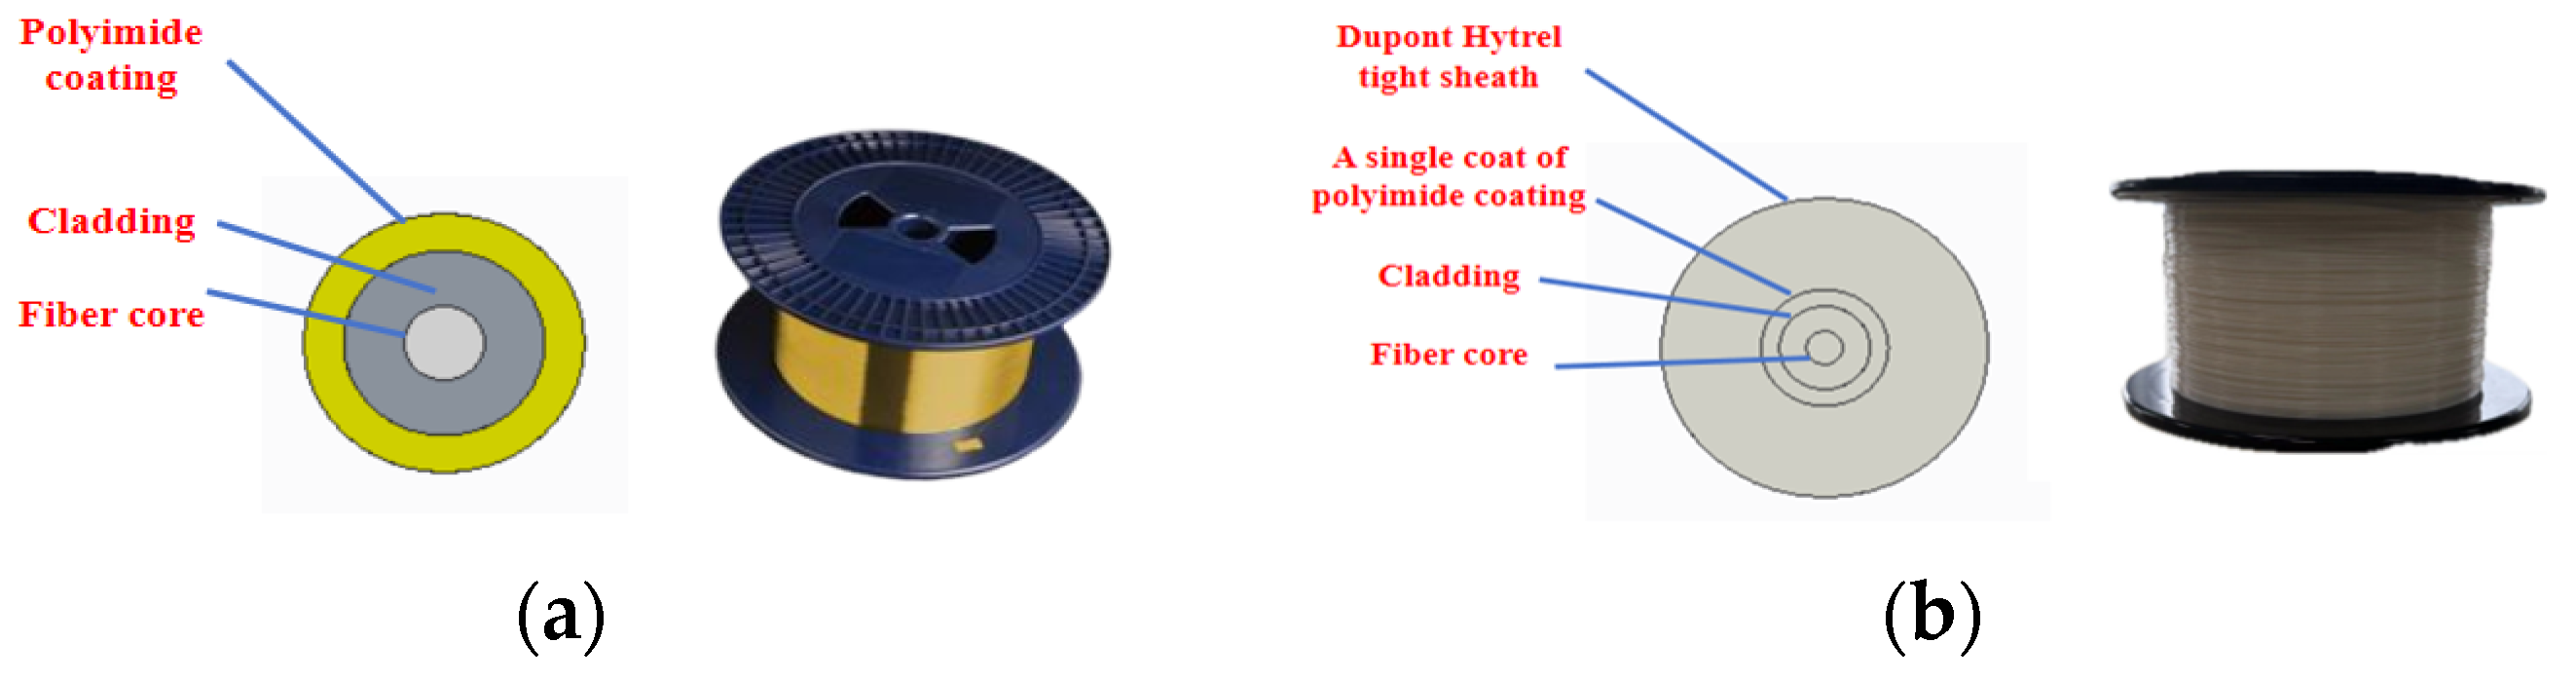
3.2. Two Types of Fiber Optic Strain Sensors

The optical fiber sensor possesses the advantages of a miniature diameter and flexible deployment, with distinct sensing characteristics associated with different fiber structures. Figure 6a illustrates the structure and physical appearance of the PISOF, which primarily consists of a core, cladding, and polyimide coating layer. The cladding diameter measures 125 μm, while the coating layer diameter is 155 μm. In this study, the PI-125 fiber type was chosen due to its ability to achieve an attenuation of 0.5 dB/km in the 1550 nm wavelength band. As a bare sensing fiber, it exhibits excellent sensitivity and high precision, enabling a wavelength accuracy of ±0.1 pm.
Figure 6b depicts the structure and physical appearance of the 0.9mm TSSOF, which primarily comprises a core, cladding, primary acrylate resin coating layer, and an outer protective sheath made of Dupont Hytrel. This fiber can achieve an attenuation of ≤0.30 dB/km in the 1550 nm wavelength band. The Dupont Hytrel outer sheath serves as a tight protective covering, effectively mitigating interference from other factors during testing, and possesses good toughness and strength.

4. Results and Discussion

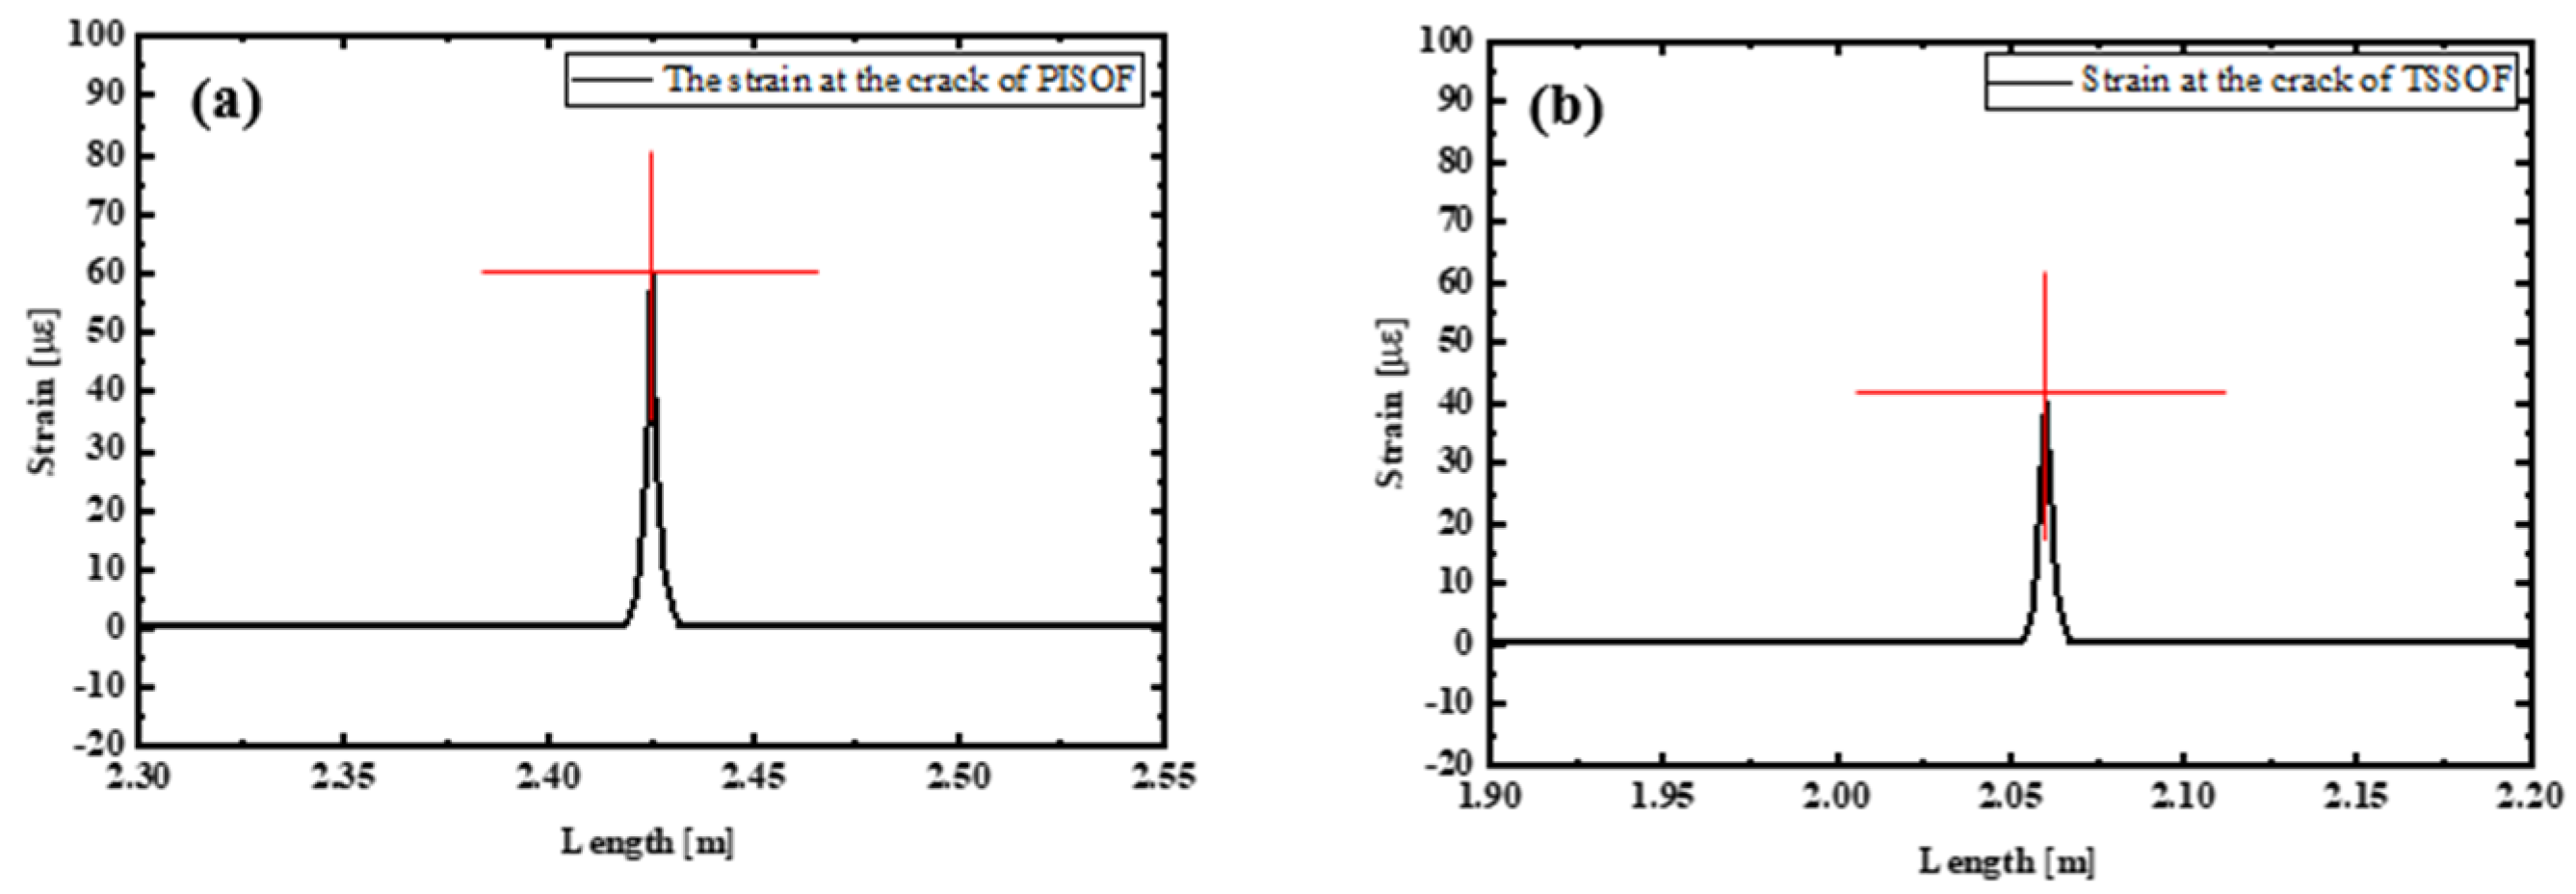
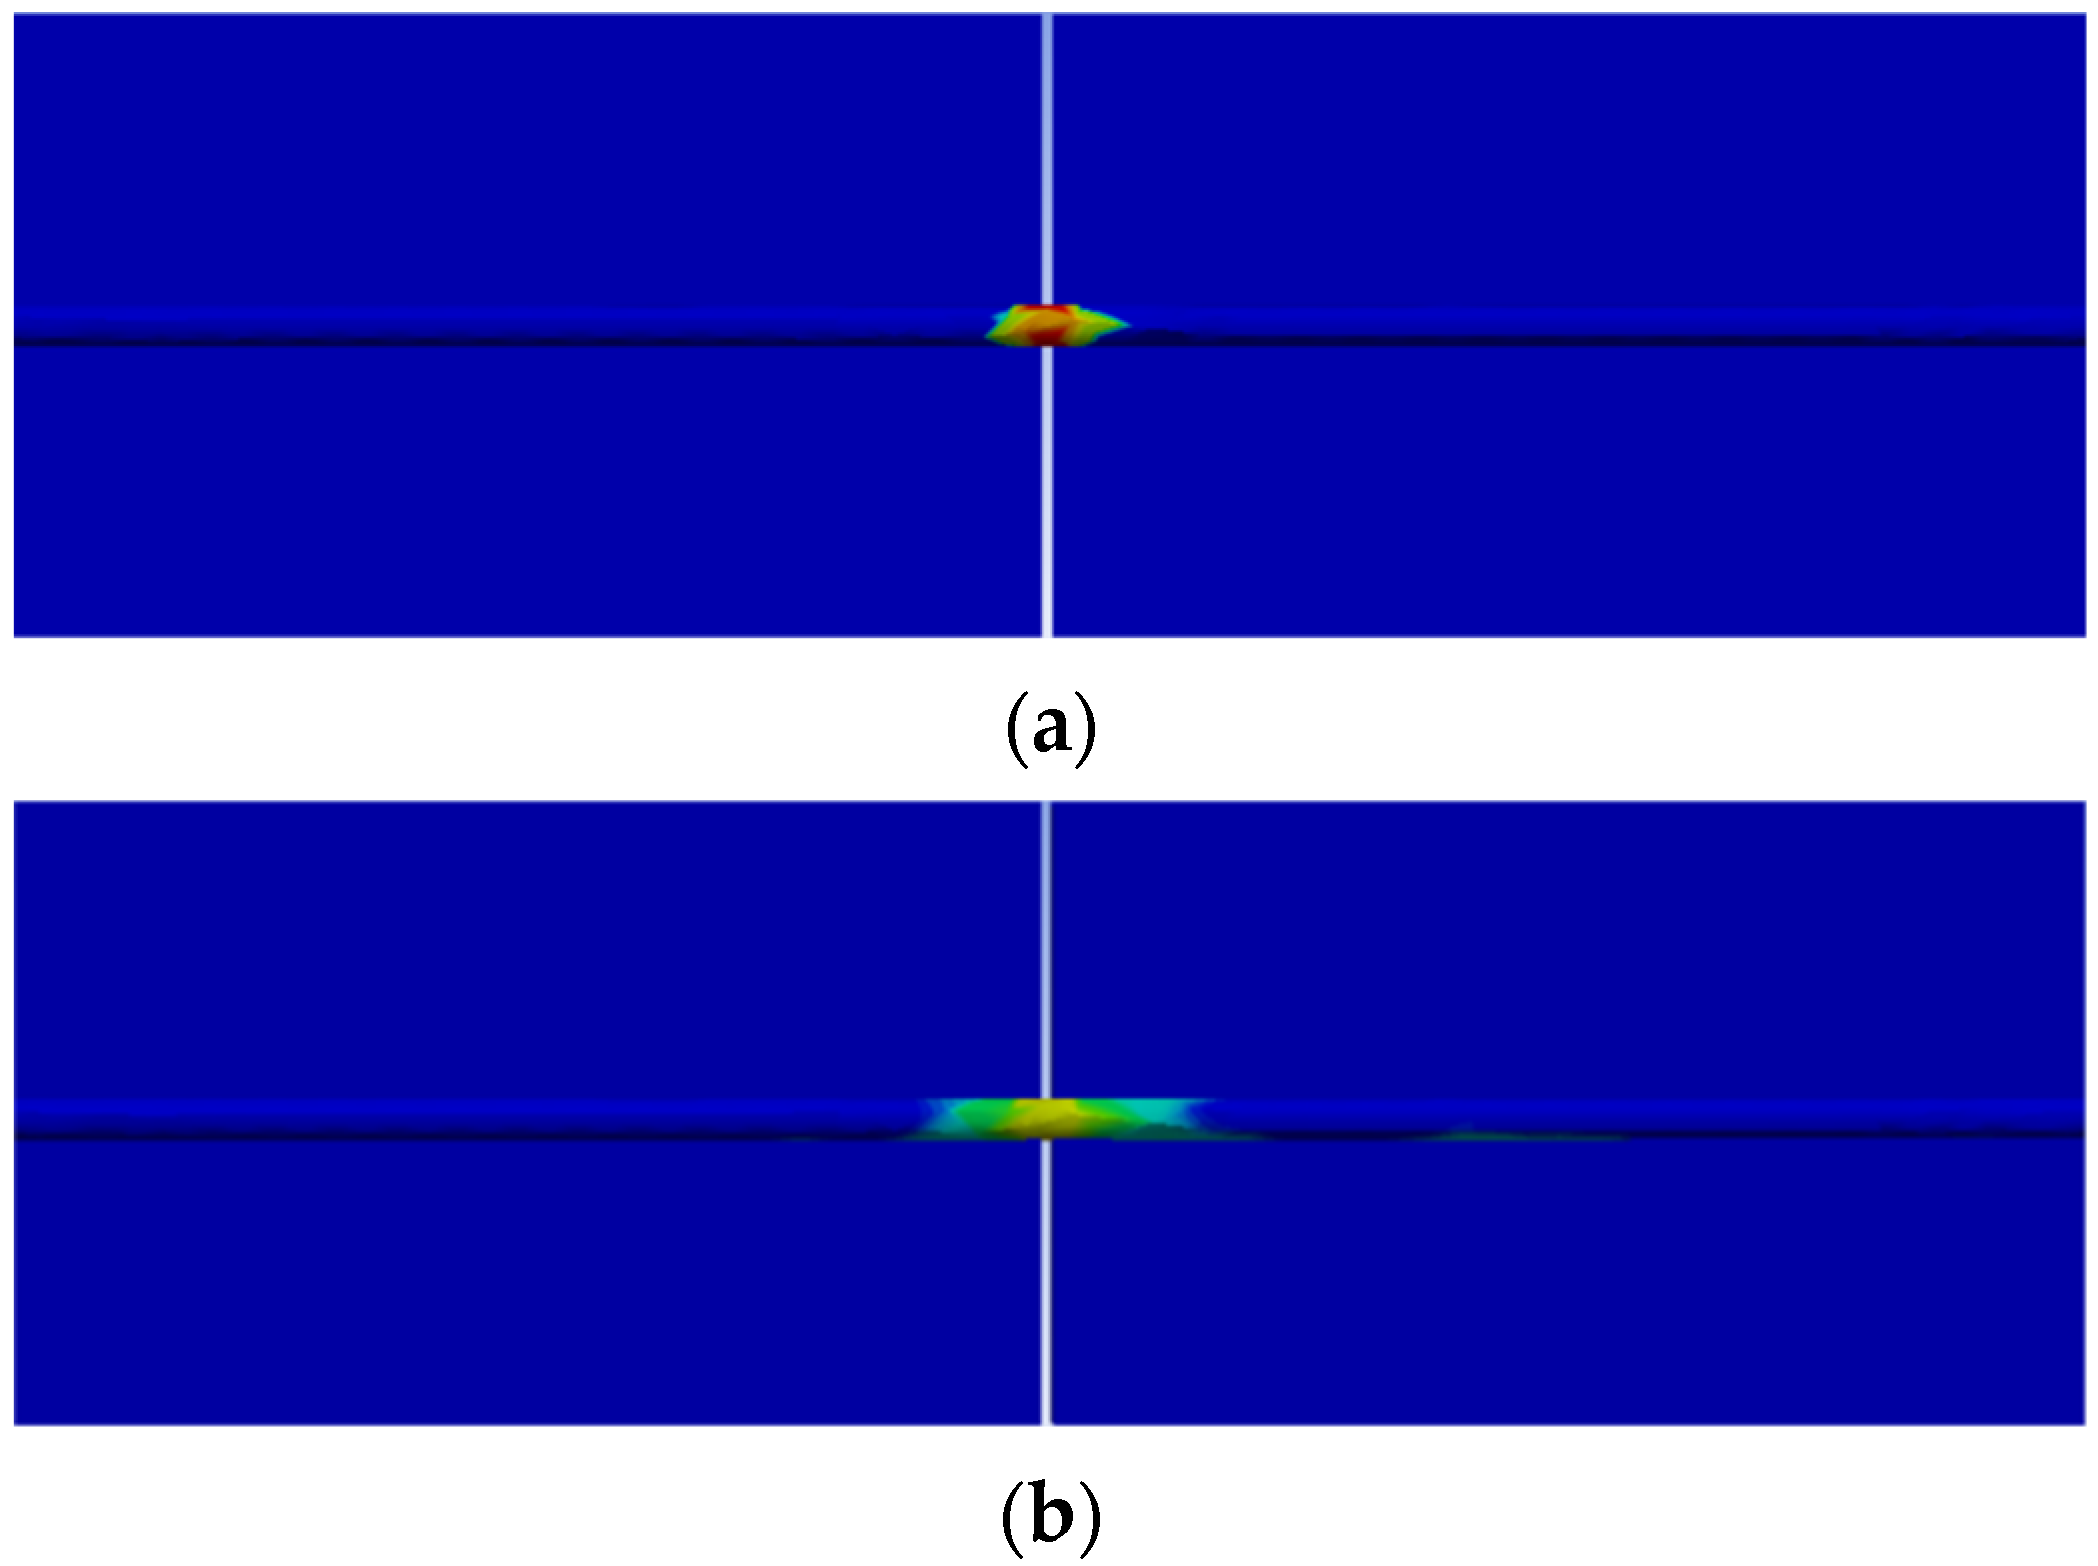
4.1. Analysis of Location Results of Micro-Cracks

To test the accuracy of the strain data, the fiber was calibrated by the frequency shift–strain coefficient. In OFDR sensing demodulation technology, the scattering frequency shift is detected, and the Rayleigh scattering shift is affected by two physical quantities: temperature and strain. The formula is as follows:
Δ v = R 1 Δ ε + R 2 Δ T
In the formula, Δ v : Rayleigh scattering frequency shift, R 1 : frequency shift–strain coeffs, Δ ε : strain change, R 2 : frequency shift–temp coeffs, and ΔT: temp change. Ensure that the temperature is constant during the calibration process, ΔT = 0.
Different forces were applied to the two fibers to produce a fixed strain, with the amount of Rayleigh scattering frequency shift generated by the fibers tested by using an OSI instrument. After the test calibration, R 1 = 0.15152 GHz / μ ε , which is consistent with the coefficient calculated by Kisalaya Chakrabarti et al. [26].
The displacement of the sliding steel plate was controlled by adjusting the micrometer differential head with five different micrometer adjustments of 10 μm, 20 μm, 30 μm, 40 μm, and 50 μm, respectively. Simultaneously, the optical fiber closely attached to the steel plate surface experienced a tensile effect as a result of this displacement. By demodulating the Rayleigh scattering frequency-domain signals in the optical fiber sensor using OFDR technology, distributed strain data along the axial direction of the fiber were obtained, thus characterizing the movement of the steel plate. This experiment directly demodulated the optical signal to strain data recording by the OFDR-distributed fiber sensor, as shown in Figure 7; the left peak of the curve represents the strain measurement data for the 0.9mm TSSOF, while the right peak represents the strain data for the PISOF. It is evident that both types of optical fibers exhibited significant strain changes, with peak positions occurring at the predetermined crack locations. Additionally, Figure 7 compares the strain peak fiber points under the five different micrometer adjustments with the actual crack locations.
As can be clearly observed from Figure 7, under the same micrometer adjustment, the maximum strain measured by the PISOF was greater than that measured by the TSSOF. However, the peak width of the strain curve measured by the TSSOF was broader than that of the PISOF. To further explore the sensing effect of fiber coatings on micro-scale displacements, a distributed strain curve was obtained, as shown in Figure 8. The strain curve of the TSSOF was relatively smooth, while the strain curve of the PISOF was more concentrated.
As the crack width increased, significant tensile forces arose on both sides of the crack. These tensile forces caused an overall length change in the optical fibers near the crack. Due to the small elastic modulus of the fiber sheath material, the affected fiber length range was extensive, resulting in a more distributed stress pattern. The stress was maximized at the center of the crack, leading to the largest strain variation. Conversely, the strain gradually decreased on both sides of the crack. On the other hand, the polyimide coating exhibited a higher elastic modulus, resulting in a smaller length range affected by tensile forces and a more concentrated stress pattern. Similarly, the stress was maximized at the crack center, leading to the largest strain variation, with the strain gradually decreasing on both sides of the crack.
As depicted in Figure 8b, the peak of the PISOF data exhibited irregular patterns. This was attributed to the direct coating of PI on the bare fiber surface, making it more sensitive to external influences. Additionally, the non-uniform thickness of the adhesive used to attach the fiber had a direct impact on the sensitive surface of the fiber, leading to non-standard peaks. Uneven glue paint brushing can affect the strain size of adjacent points, within the spatial resolution test of each point strain size, but because of the crack directly will fiber stretching, the stretch length is related to the crack size, so the total strain on the fiber size is not affected by glue, can use the relevant formula to calculate the seam width size, but not through a single point strain accurate judgment crack center position. In contrast, the TSSOF, due to its sheath thickness, protected its internal fiber sensing surface from the influence of the direct adhesive. Therefore, during the experiment, only tensile forces caused changes in its axial strain. As illustrated in Figure 8a, the TSSOF was able to produce a more standard strain peak curve, making it advantageous for micro-crack localization.
Figure 9a shows the strain simulation diagram of the line structure with a large elastic modulus in crack expansion, with the strain at the crack; Figure 9b shows the strain simulation diagram of the line structure with a small elastic modulus in crack expansion, and the strain at the crack; Figure 9 shows that the crack expansion affects the structural strain with a small elastic modulus, but the maximum strain value is smaller, which is consistent with the test results of two different optical fibers, indicating that the experimental data are reliable.

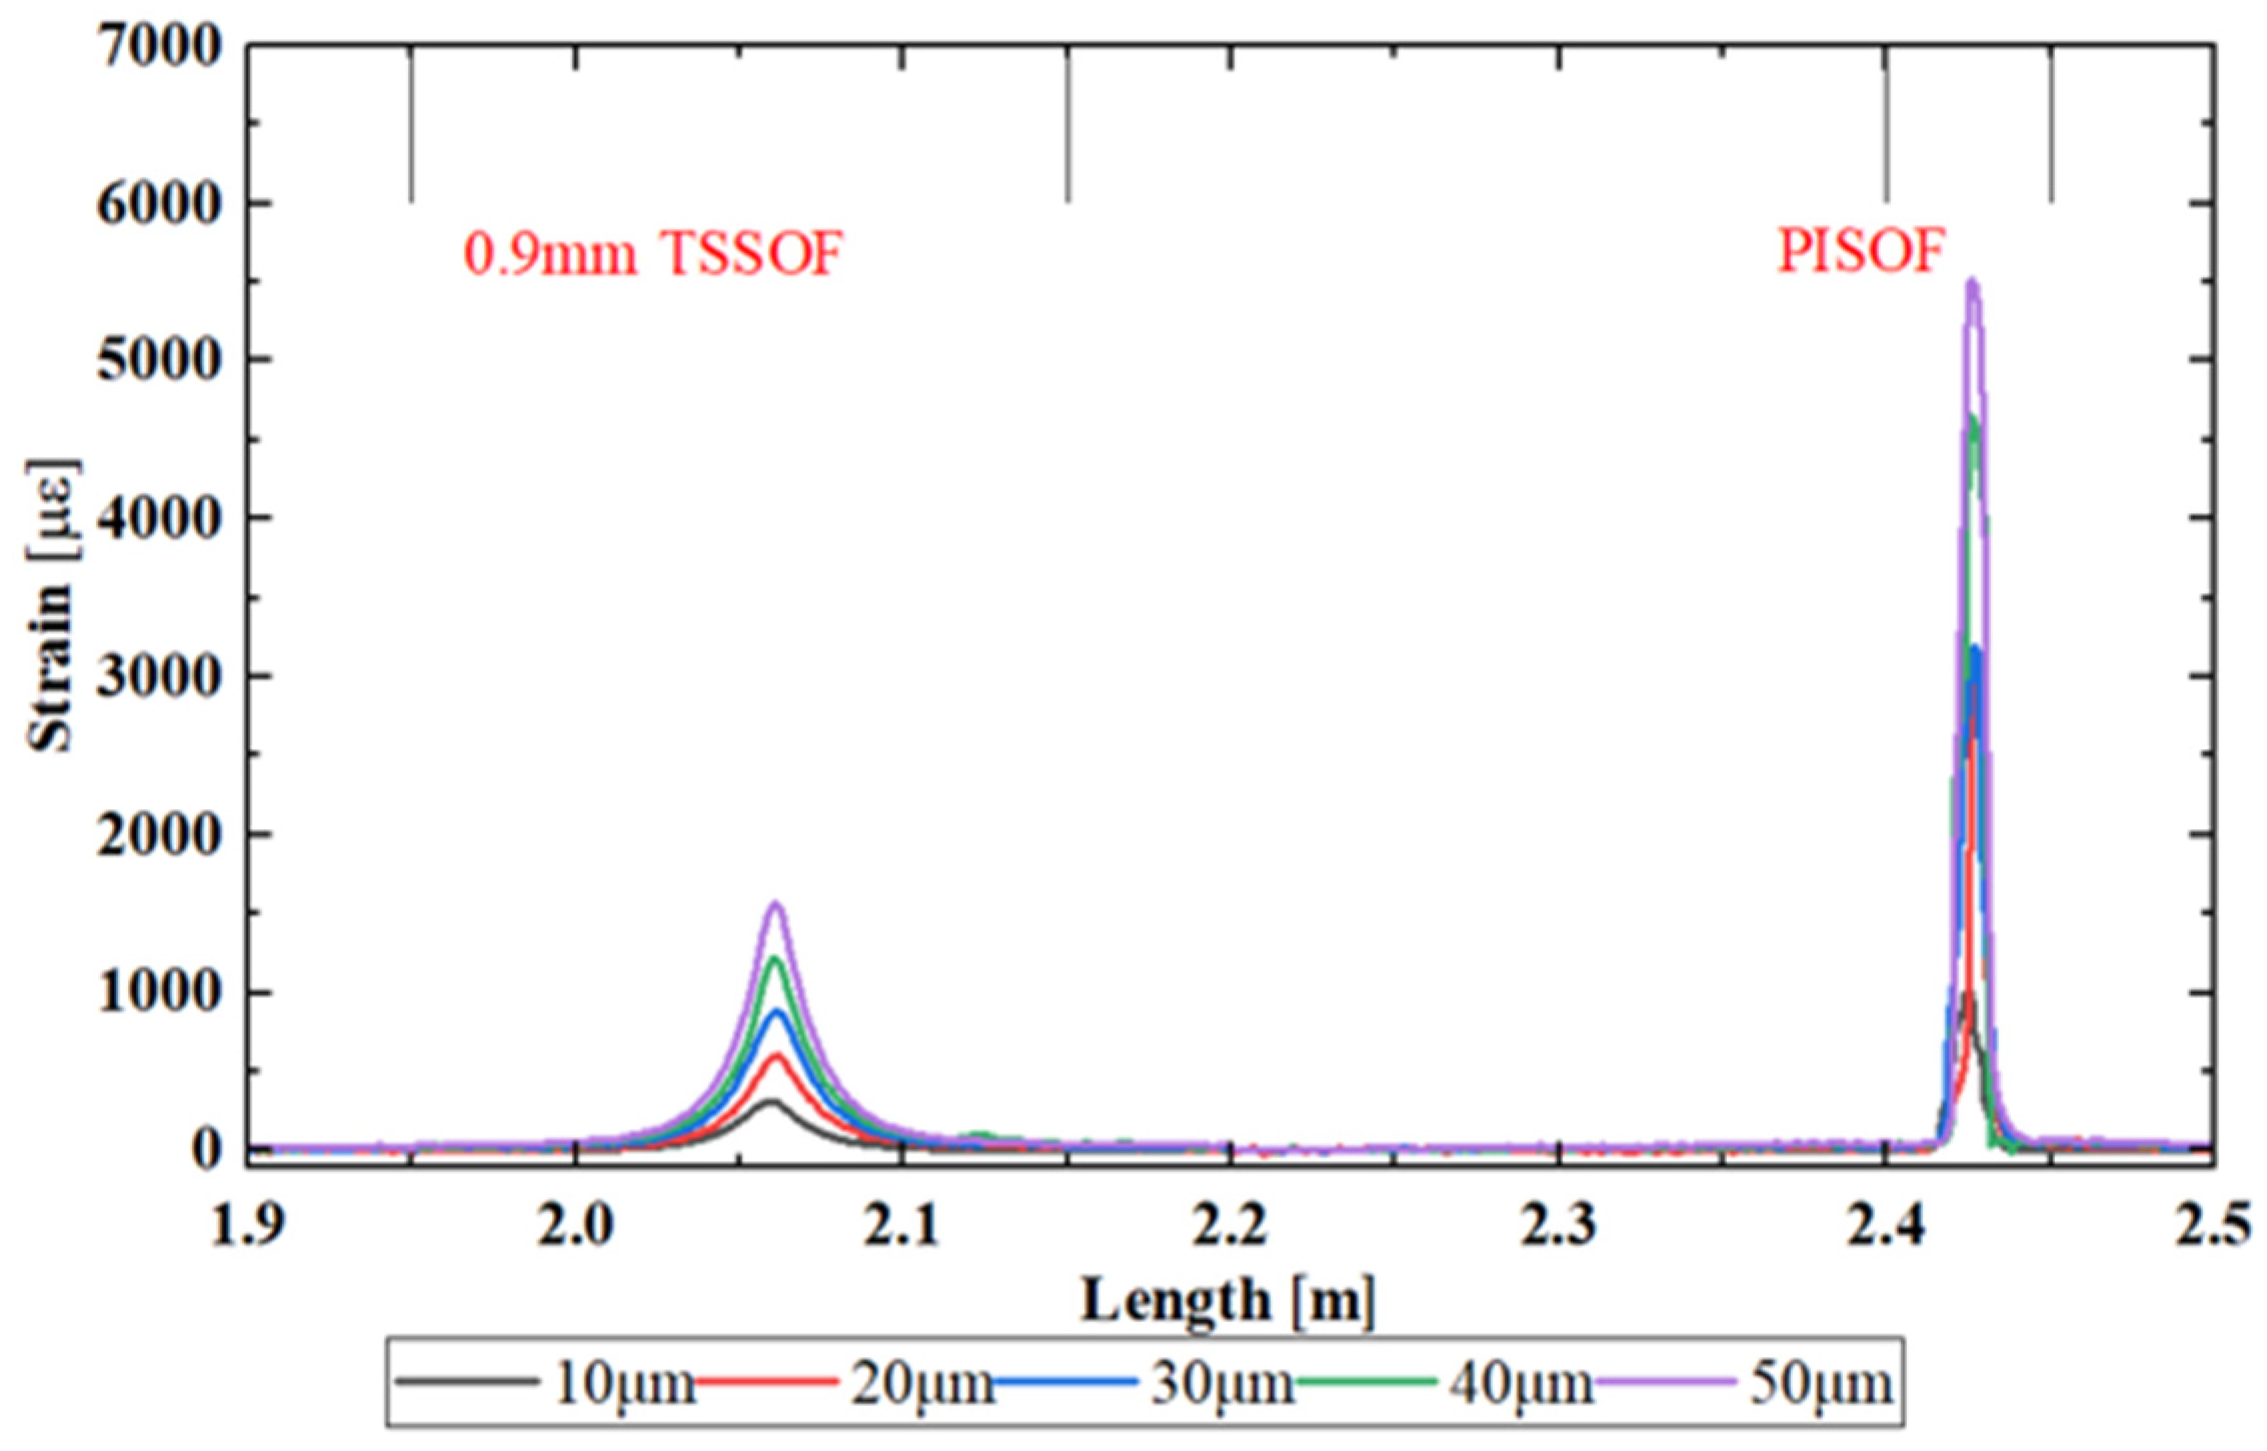
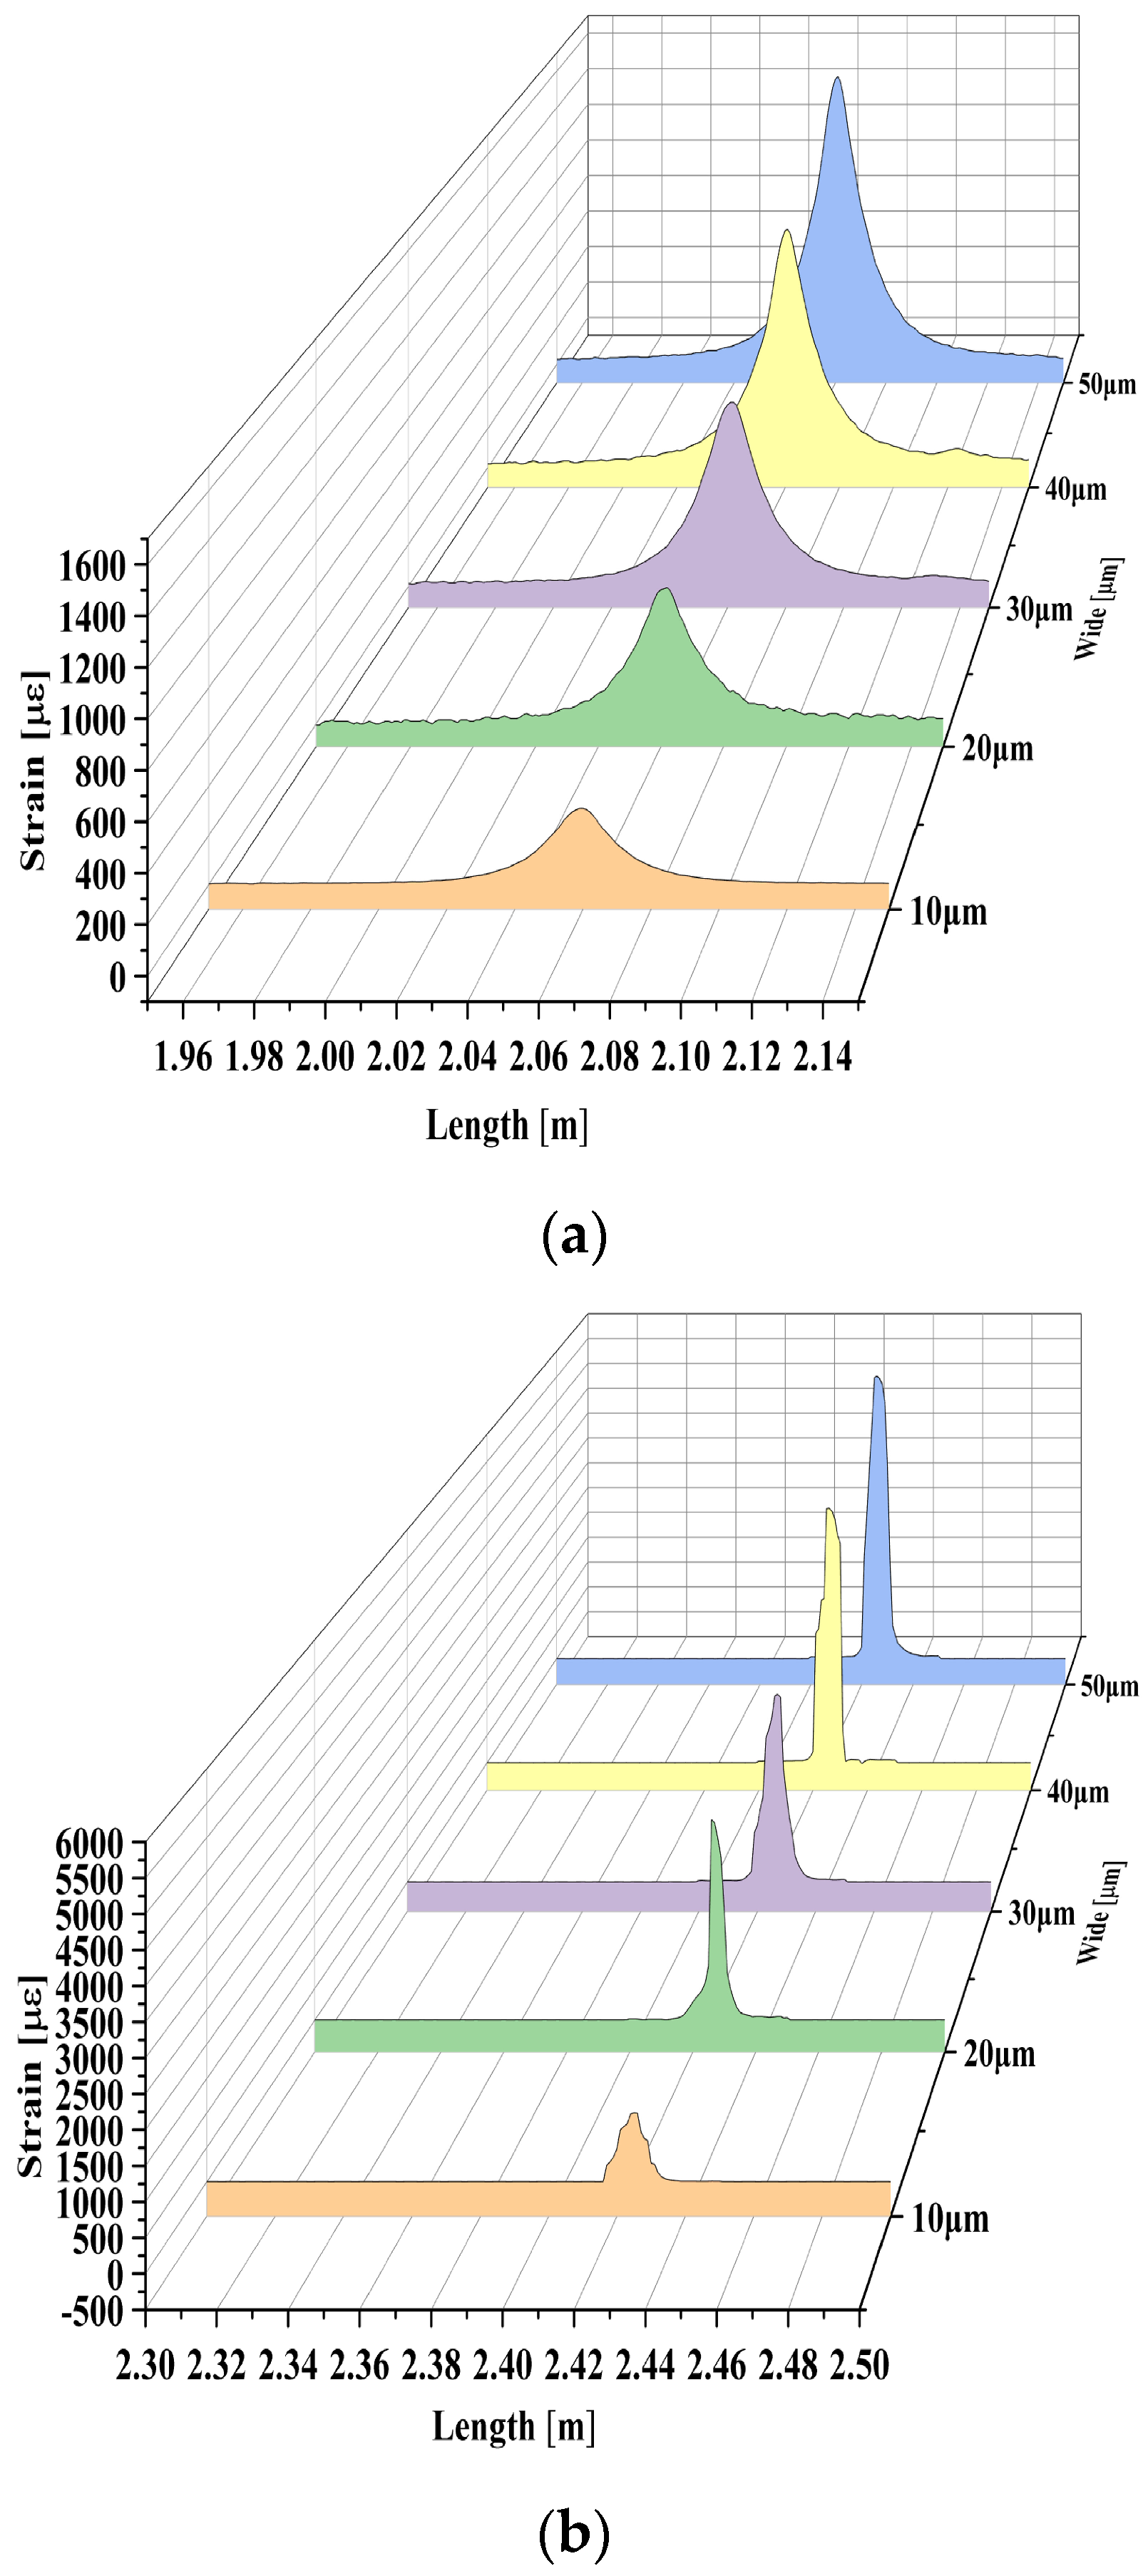
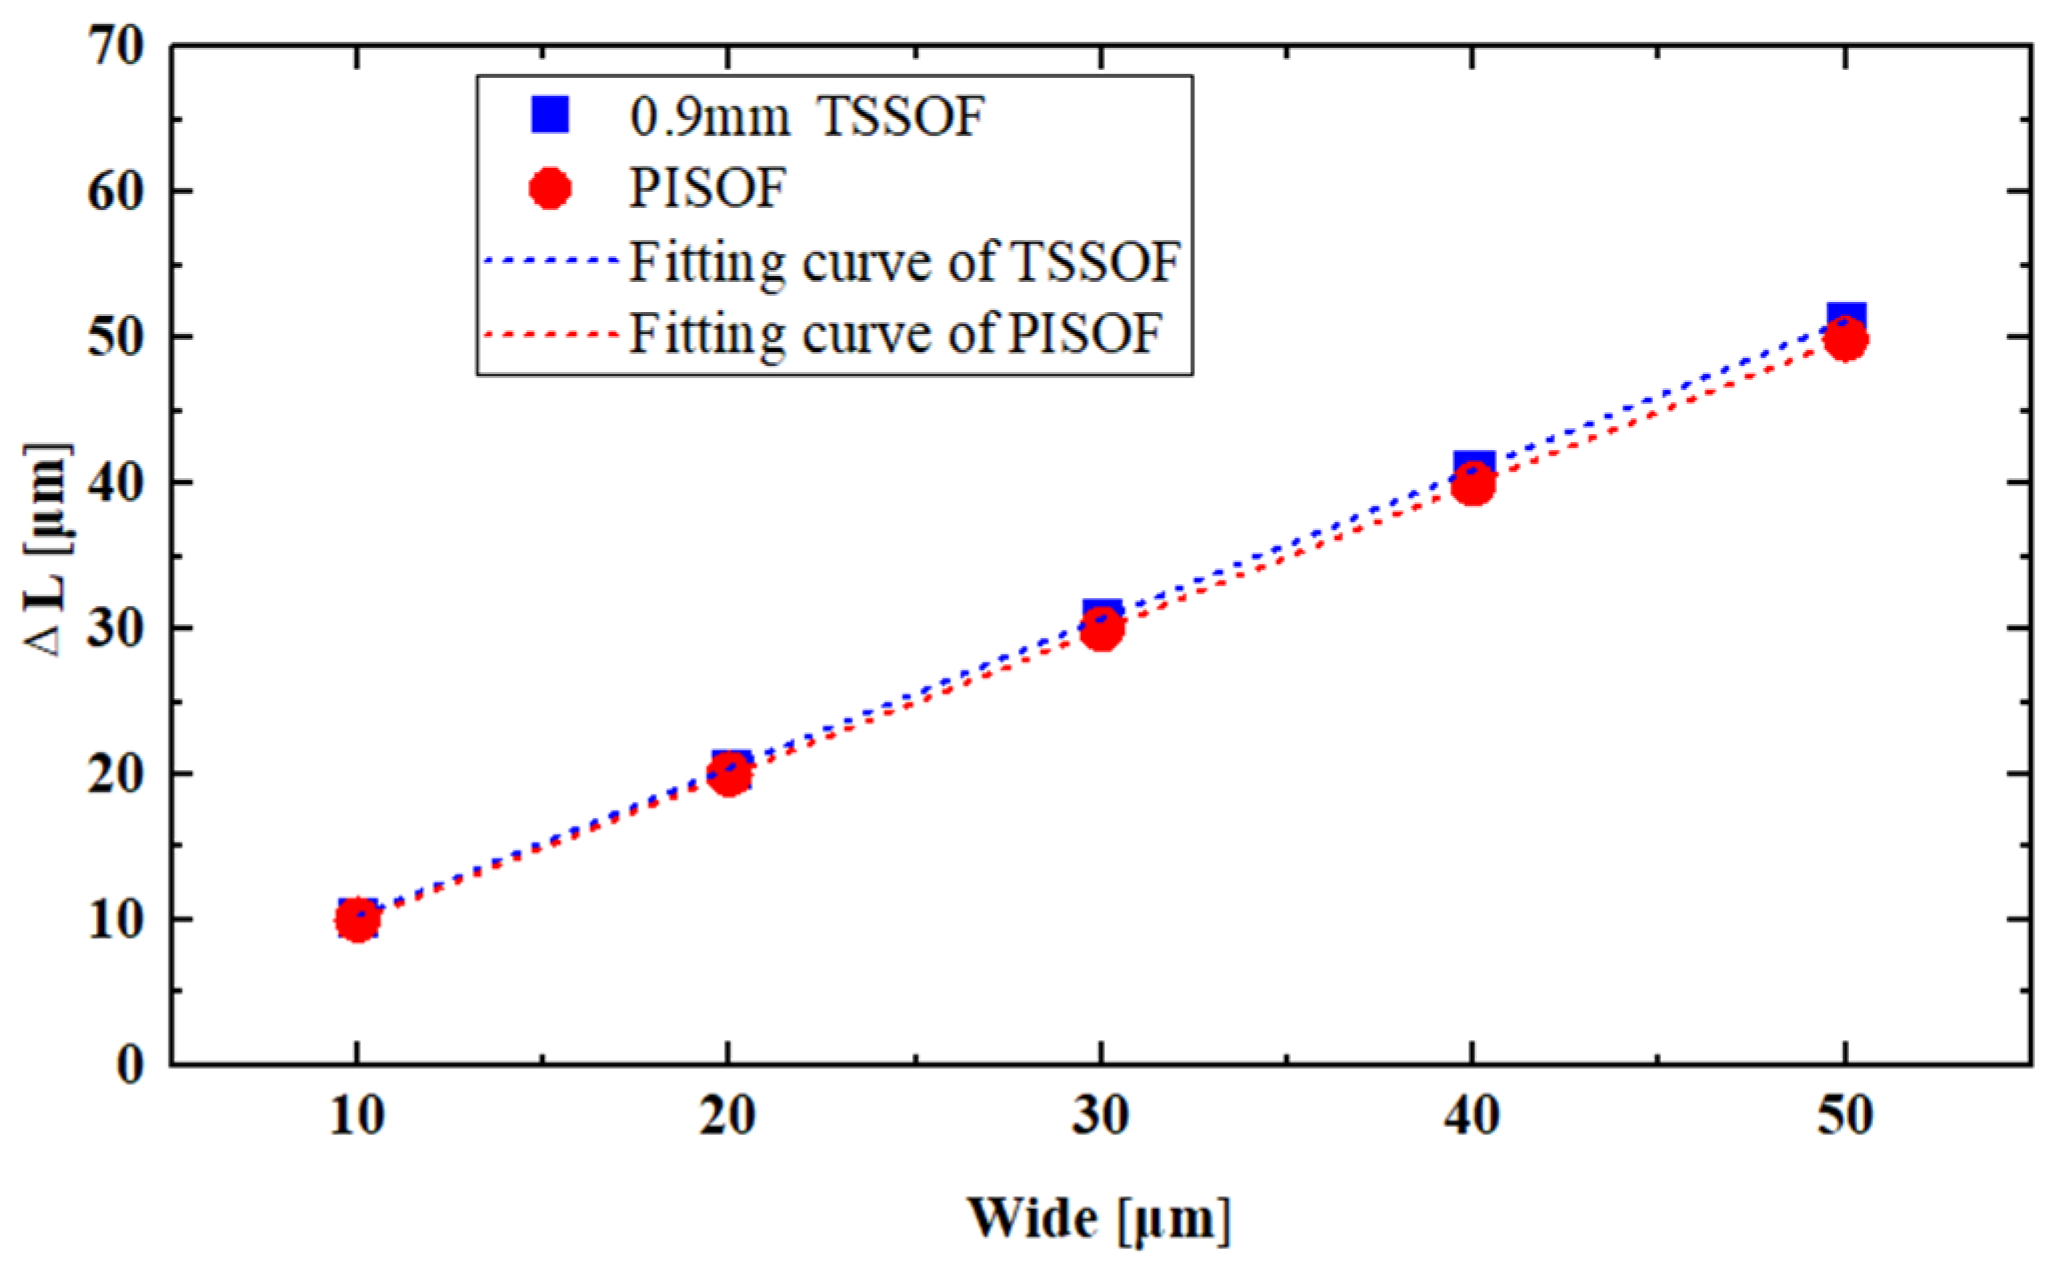
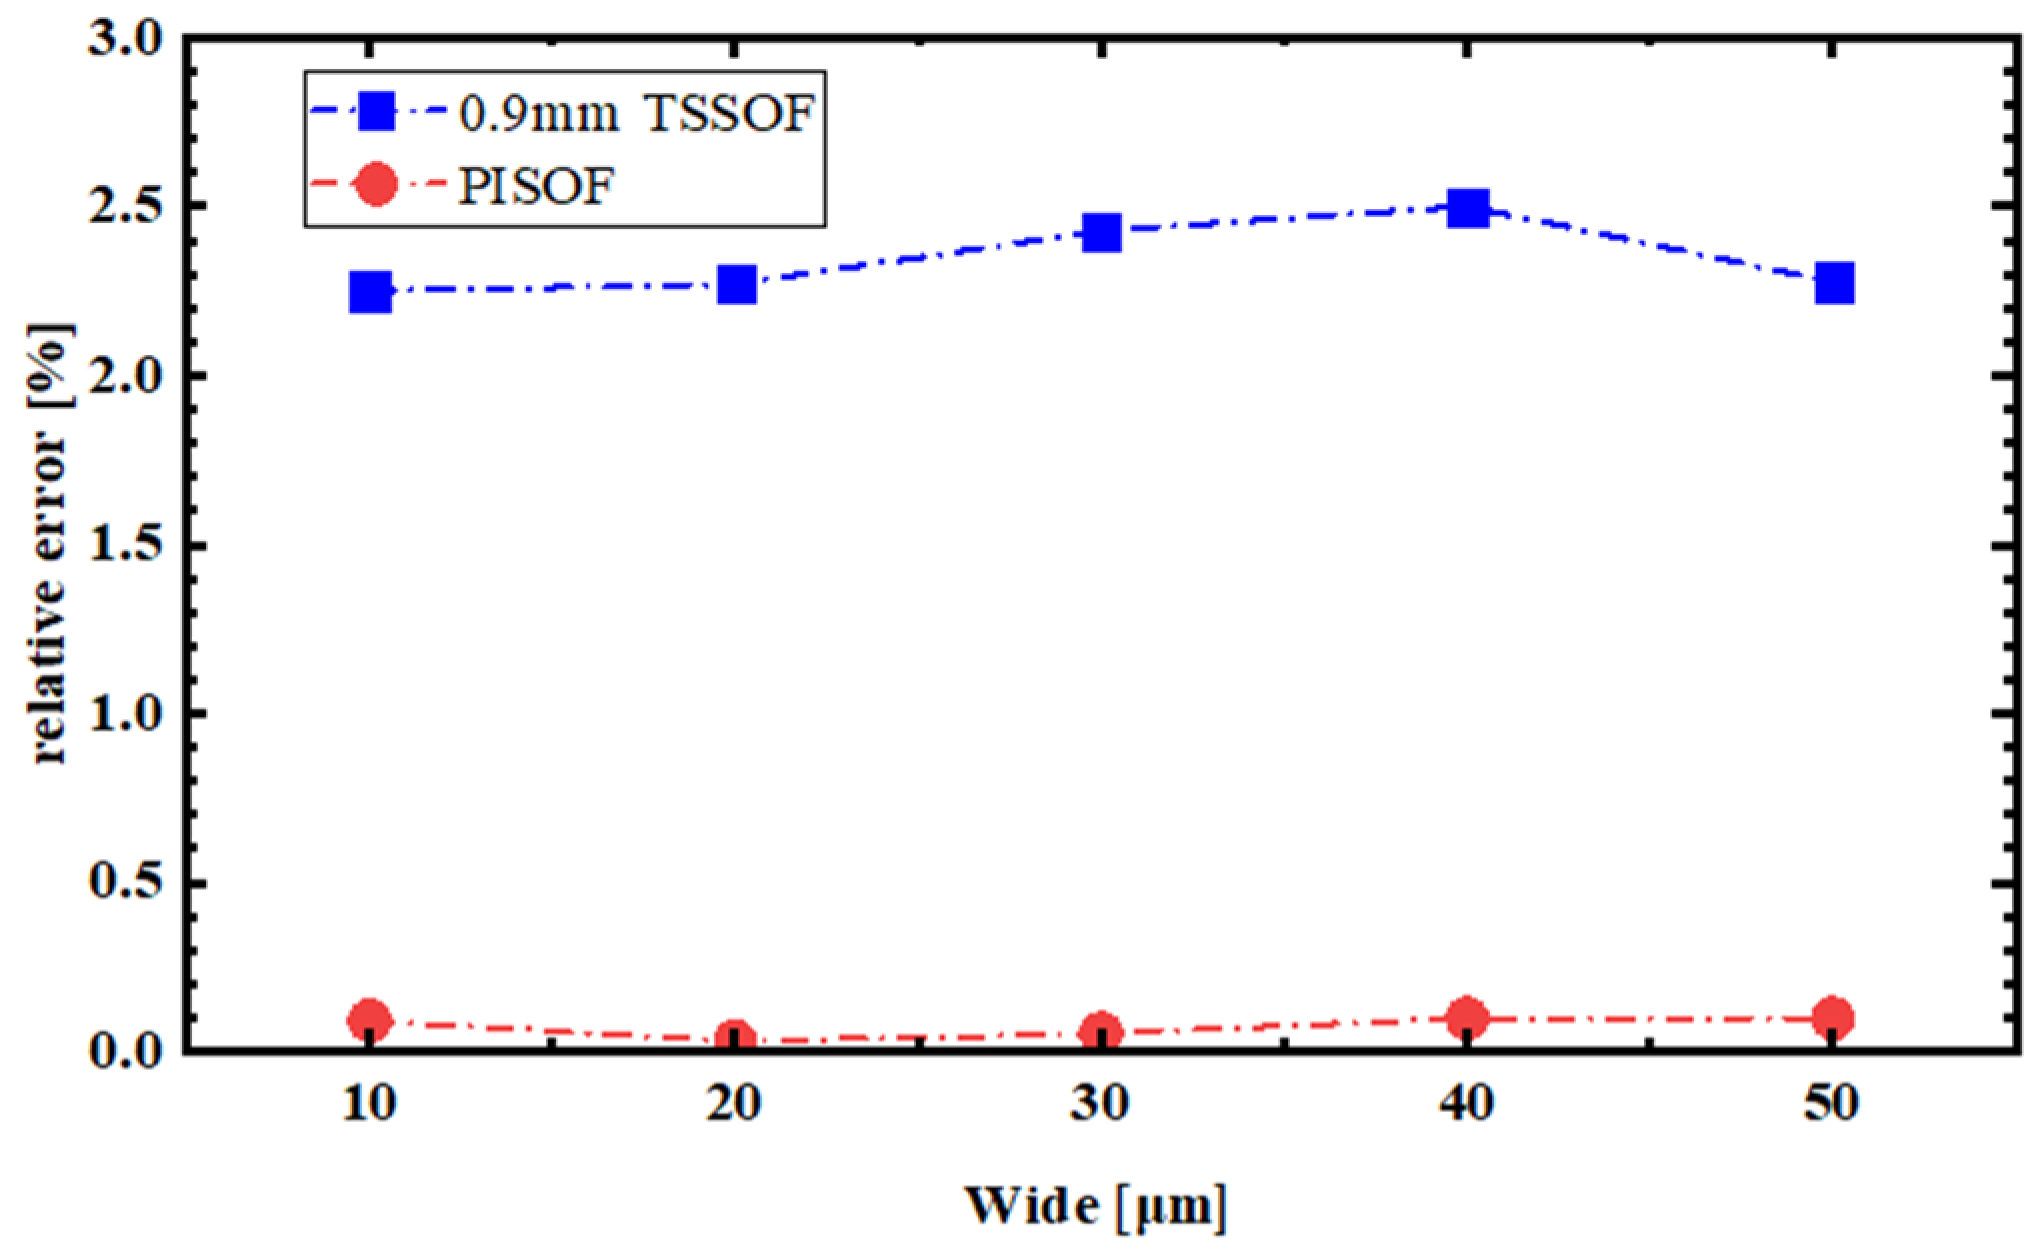
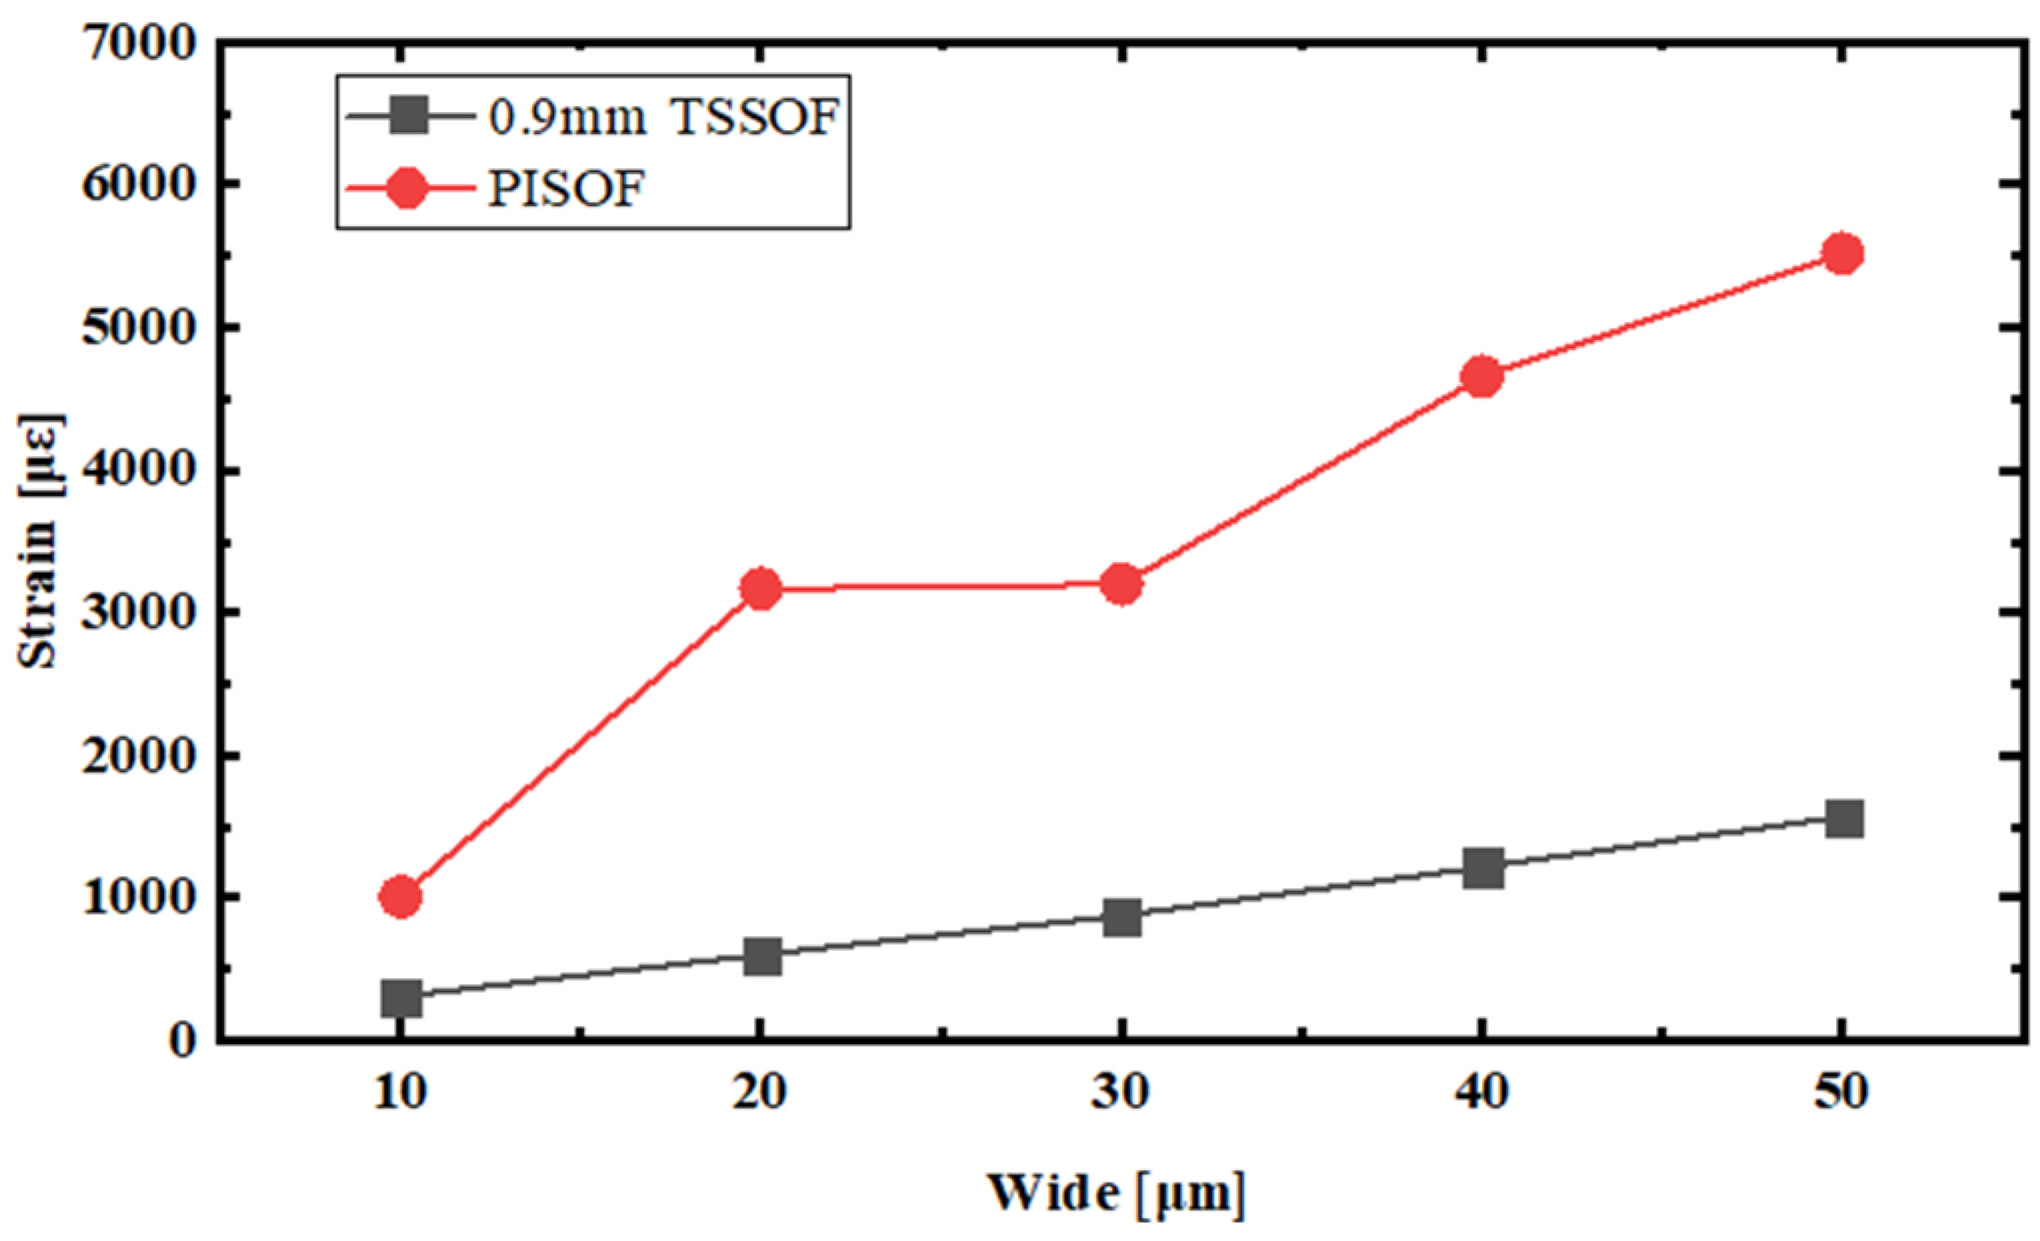
4.2. Analysis of Micro-Crack Width Measurement Results

The stretching process undergone by the optical fiber sensor was considered as a one-dimensional axial change for characterizing the crack width due to its micrometer-scale diameter characteristics. By taking the peak values of the strain curves measured by the optical fiber as the input and applying the integral calculation method outlined in Section 2.2 to process the distributed strain values, the stretching condition of the optical fiber was quantified. The strain change on the fiber is caused by cracks; therefore, we selected the sensing point data with the strain greater than 0 and the strain increasing to the peak position, and calculated the crack width by integrating it. The specific numerical values of the length changes for the two types of optical fibers are presented in Table 1.
As demonstrated in Figure 10, under the influence of micro-cracks of various sizes, the calculated stretching lengths of the two types of optical fibers, based on their strain sensing data, exhibited excellent consistency. The numerical values were close to the crack widths and displayed a linear growth trend. Specifically, the linearity R2 of the detection curve for the crack widths using the TSSOF was 0.9999, while the linearity R2 for the PISOF was 1. These results further validate the feasibility of using the numerically calculated stretching lengths of optical fibers through the integral calculation method proposed in this study as a measure for micro-crack widths.
The measured values in Table 2 were processed for relative error analysis to facilitate a deeper understanding of the advantages of the two types of optical fibers in crack width measurement. As shown in Figure 11, the relative errors for both fiber types did not exceed 2.5%. Notably, the values obtained from the PI fiber were nearly identical to the theoretical values. This can be attributed to the fact that the strain perception of the TSSOF necessitates the transmission of strain through the sheath material, whereas the PI fiber can directly sense the surrounding strain environment. This indicates that the PI fiber exhibits certain advantages when utilizing computational models to characterize micro-crack size measurements.
The maximum strain values of the test data obtained from the two types of optical fibers were recorded under the same micro-displacement conditions, as presented in Table 2, to investigate the influence of micro-crack sizes on the peak strain curves. It was observed that, as shown in Figure 12, the maximum strain values of the TSSOF exhibited a good linear relationship with the micro-crack sizes after fitting the data. The crack width could be directly calculated from the maximum strain values of the TSSOF under these conditions. However, the PISOF exhibited a significant nonlinear relationship with the micro-crack sizes. Specifically, when the crack width reached 30 μm, the growth rate differed from that observed previously. This deviation may be attributed to the partial separation of the glue from the steel plate at the crack location under this specific crack width. Consequently, the optical fiber at the crack position was not in close contact with the steel plate, resulting in a lack of a clear numerical pattern between the crack width and the maximum strain measured by the PISOF. Therefore, using the maximum strain to directly calculate the crack width for the PISOF would result in significant errors. The effect of the PI optical fiber is consistent with an ordinary single-mode optical fiber in a strain test, but it is not recommended that an ordinary optical fiber without a coating layer is easy to break in a strain test, so this use of the PI optical fiber and tight sheath optical fiber test is compared. Although the strain effect of the tight sheath fiber test is not as good as the PI fiber, it is very suitable in crack detection.

5. Conclusions

In this article, a method for identifying and locating micro-cracks using high spatial resolution optical fiber strain sensing technology based on OFDR was proposed, and a calculation method for micro-crack widths based on measured distributed optical fiber strain curves was established. Multiple verification experiments were conducted using both a PISOF and 0.9mm TSSOF. A comparative analysis was conducted between the experimental data and the computational model. Firstly, the strain peak curves of both fiber types accurately located the micro-cracks with a precision of 1 mm. Secondly, the crack widths were obtained by processing the distributed strain curves using an integral model, successfully capturing the characteristics of micro-cracks with sizes ranging from 10 to 50 μm. Notably, a strong linear relationship was observed between the optical fiber stretching length and the crack width. Finally, the analysis revealed that the PISOF exhibited a smaller error in calculating the crack width using the integral model, while a linear relationship existed between the maximum strain value of the TSSOF and the crack width, enabling the calculation of the crack width based on the maximum strain value. Therefore, the choice of fiber optic sensors for crack monitoring should be made based on the specific application scenario and the structure of the object under test, with the TSSOF offering advantages in certain testing scenarios.
In summary, the testing method proposed in this article has been analyzed and validated through experimental data, providing a novel technical approach for the detection of micro-cracks.

Author Contributions

Conceptualization, B.C. and J.Y.; methodology, J.L.; software, M.Z.; formal analysis, B.C.; investigation, D.Z.; resources, W.L.; data curation, B.C.; writing—original draft preparation, B.C.; writing—review and editing, B.C.; visualization, J.L.; supervision, M.Z.; project administration, B.C. All authors have read and agreed to the published version of the manuscript.

Funding

This research was funded by the Northwest Institute of Nuclear Technology. Funding Number C0000604. Funding Data: December 2022–December 2024.

Institutional Review Board Statement

Not applicable.

Informed Consent Statement

Not applicable.

Data Availability Statement

The data presented in this study are available on request from the corresponding author. The data are not publicly available due to privacy concerns.

Acknowledgments

The authors would like to thank the editors and all of the anonymous reviewers for their constructive feedback and criticisms.

Conflicts of Interest

The authors declare no conflicts of interest.

References

  1. Jing, A. Application of Laser welding Technology in aviation industry machinery manufacturing. Mod. Ind. Econ. Inf. Technol. 2024, 14, 121–123. [Google Scholar]
  2. Molaro, J.L.; Byrne, S.; Langer, S.A. Grain-scale thermoclastic stresses and spatiotemporal temperature gradients on airless bodies, implications for rock breakdown. J. Geophys. Res. Planets 2015, 120, 255–277. [Google Scholar] [CrossRef]
  3. Li, J.; Wang, Q.; Zan, Y.; Ju, L.; Jing, C.; Zhang, Y. Research on wing crack propagation of closed crack under uniaxial compression based on peridynamics. Eng. Anal. Bound. Elem. 2024, 158, 121–138. [Google Scholar] [CrossRef]
  4. Wang, Y.; Han, S.; Yu, Y.; Qi, X.; Zhang, Y.; Lian, Y.; Bai, Z.; Wang, Y.; Lv, Z. Numerical Simulation of Metal Defect Detection Based on Laser Ultrasound. IEEE Photonics J. 2021, 13, 6800609. [Google Scholar] [CrossRef]
  5. Zhang, R.; Sun, Y.; Ma, J. Understanding thermal–mechanical fatigue crack growth: A microscopic mechanical model. Mater. Sci. Eng. A 2005, 398, 142–145. [Google Scholar] [CrossRef]
  6. Esmaeili, A.; Mohammadi, B.; Yousefi, A. Investigation of T-stress and tensile strength effect on crack tip conditions and crack initiation angle in off-axis laminate composite. Theor. Appl. Fract. Mech. 2024, 130, 104283. [Google Scholar] [CrossRef]
  7. Yan, X.; Wang, H.; Fan, X. Research Progress in Nonlinear Ultrasonic Testing for Early Damage in Metal Materials. Materials 2023, 16, 2161. [Google Scholar] [CrossRef] [PubMed]
  8. Bi, C.; Yuan, Y.; Zhang, R.; Xiang, Y.; Wang, Y.; Zhang, J. A Dynamic Mode Decomposition Based Edge Detection Method for Art Images. IEEE Photonics J. 2017, 9, 7803813. [Google Scholar] [CrossRef]
  9. Ogura, K.; Nishikawa, I. Fatigue Crack Closure Monitoring at Elevated Temperature Using Laser Interferometric Displacement Gage. Proceedings of the KSME/JSME THERMAL and FLUID Engineering Conference, 1990. [Google Scholar]
  10. Dietzel, W.; Schwalbe, K.H. Monitoring stable crack growth using a combined AC/DC potential drop technique. Mater. Test. 1986, 28, 368–372. [Google Scholar] [CrossRef]
  11. Swartz, S.E.; Jones, G.L.; Hu, K.K. Compliance Monitoring of Crack Growth in Concrete. J. Eng. Mech. Div. 1978, 104, 789–800. [Google Scholar] [CrossRef]
  12. Dumoulin, C.; Deraemaeker, A. Real-time fast ultrasonic monitoring of concrete cracking using embedded piezoelectric transducers. Smart Mater. Struct. 2017, 26, 104006. [Google Scholar] [CrossRef]
  13. Zhang, G.Q.; Wang, J.W. A New Method for Inspecting Crack of Concrete Bridges Using Image Processing Technique. Adv. Mater. Res. 2010, 1037, 2704–2708. [Google Scholar]
  14. Yi, D.; Kong, L.; Xie, J.; Huang, C. Online Crack Detection of Highly Curved Cylindrical Coils. IEEE Trans. Ind. Inform. 2024, 20, 703–712. [Google Scholar] [CrossRef]
  15. Yin, S.; Xiao, H.; Xu, C.; Wang, J.; Deng, M.; Kundu, T. Microcrack localization using nonlinear Lamb waves and cross-shaped sensun clusters. Ultrasonics 2022, 124, 106770. [Google Scholar] [CrossRef] [PubMed]
  16. Wang, J.; Xu, C.; Hu, N.; Deng, M. Microcrack localization based on static component induced by a primary A0 Lamb wave in a thin plate. JASA Express Lett. 2022, 2, 024001. [Google Scholar] [CrossRef] [PubMed]
  17. Leffers, L.; Locmelis, J.; Bremer, K.; Roth, B.; Overmeyer, L. Optical Bend Sensor Based on Eccentrically Micro-Structured Multimode Polymer Optical Fibers. IEEE Photonics J. 2021, 13, 6800307. [Google Scholar] [CrossRef]
  18. Ying, Y.; Morgese, M.; Ansari, F.; Gao, Z. Prediction of crack opening in steel beam based on strains measured from distributed optical fiber sensor. Meas. Sci. Technol. 2024, 35, 015101. [Google Scholar] [CrossRef]
  19. Ma, S.; Ji, Q.; Zhao, X.; Qin, Z.; Liu, Z.; Xu, Y. Humidity Sensing Using a Multimode Fiber Ring Laser with Thermal Compensation. Photonics 2024, 11, 484. [Google Scholar] [CrossRef]
  20. Liu, X.; Tang, Y.; Zhang, Z.; Yang, S.; Hu, Z.; Xu, Y. A Pattern Recognition Method for Filter Bags in Bag Dust Collectors Based on Φ-Optical Time-Domain Reflectometry. Photonics 2024, 11, 152. [Google Scholar] [CrossRef]
  21. Liu, K.; Yin, G.; Zhang, Z.; Yang, P.; Lu, H.; Li, D.; Zhu, T. High-Resolution and High-Precision Φ-OFDR Strain Sensing Scheme Based on Adaptive Phase Unwrapping and Wavelet Packet Denoising. J. Light. Technol. 2024, 42, 891–897. [Google Scholar] [CrossRef]
  22. Li, Y.; Fan, H.; Zhang, L.; Liu, Z.; Wang, L.; Wu, J.; Wang, S. Single-Mode Input Fiber Combined with Multimode Sensing Fiber Used in Brillouin Optical Time-Domain Reflectometry. Photonics 2022, 9, 398. [Google Scholar] [CrossRef]
  23. Li, Y.N.; Cao, X.Y.; Xie, T.; Zhao, Z.G.; Zhou, Y.P.; Li, C.; Liu, H.; Su, J.K.; Li, L.M.; Zhang, Z.L. Strain and Cracks of Tunnel Lining Surveyed by Fiber Bragg Grating Strain Sensors and Ultrasonic Tester. Appl. Mech. Mater. 2013, 2453, 472–478. [Google Scholar] [CrossRef]
  24. Fu, C.; Meng, Y.; Chen, L.; Zhong, H.; Du, C.; He, J.; Weng, X.; Liu, L.; Qu, J.; Wang, Y. High-spatial-resolution φ-OFDR shape sensor based on multicore optical fiber with femtosecond-laser-induced permanent scatter arrays. Opt. Lett. 2023, 48, 3219–3222. [Google Scholar] [CrossRef] [PubMed]
  25. Chen, B.; Yang, J.; Zhang, D.; Li, J.; Wang, Z.; Shi, G.; Zhang, M. Double-Wire-Based Single Distributed Optical Fiber Strain Sensing Method in High-Temperature Environment. IEEE Trans. Instrum. Meas. 2023, 26, 7000710. [Google Scholar] [CrossRef]
  26. Chakrabarti, K.; Shiwa, M. Simulation Study of Strains Obtained by Two Different Scattering Processes in Optical Fiber Sensors. Int. J. Comput. Sci. Eng. 2016, 4, 1–9. [Google Scholar]
Figure 1. The schematic diagram of signal processing in the frequency domain using OFDR [25].
Photonics 11 00755 g001
Figure 2. Physical picture of micro-crack location simulation positioning device.
Photonics 11 00755 g002
Figure 3. Illustration of fiber crack localization. (a) Localization results of PISOF; (b) localization results of TSSOF.
Photonics 11 00755 g003
Figure 4. Schematic diagram of optical fiber sensing point offset.
Photonics 11 00755 g004
Figure 5. Experimental scene layout. (a) The experimental setup and the layout of the optical fibers; (b) depicts the OFDR micro-crack identification and measurement system.
Photonics 11 00755 g005
Figure 6. Two types of optical fiber sensors utilized in the experiment. (a) Structure and physical appearance of PISOF; (b) structure and physical appearance of TSSOF.
Photonics 11 00755 g006
Figure 7. The distribution of strain peaks for two types of optical fiber sensors under five different micrometer adjustments.
Photonics 11 00755 g007
Figure 8. Strain distribution of the two sensing fibers under different grain widths. (a) Strain distribution of TSSOF; (b) Strain distribution curve of PISOF.
Photonics 11 00755 g008
Figure 9. Simulation results of two kinds of elastic modulus lines under crack expansion: (a) lines with large elastic modulus, (b) lines with small elastic modulus.
Photonics 11 00755 g009
Figure 10. Trend diagram of tensile length of two kinds of fiber with theoretical crack size change.
Photonics 11 00755 g010
Figure 11. Relative error curves of measured values and theoretical crack sizes of the two optical fiber sensors.
Photonics 11 00755 g011
Figure 12. The crack size corresponds to the maximum strain dispersion diagram of the two sensing fibers.
Photonics 11 00755 g012
Table 1. Measurement results of two optical fiber sensors under cracks of different sizes.
Types of Optical Fiber SensorsCrack Width
10 μm20 μm30 μm40 μm50 μm
0.9mm-TSSOF10.225 μm20.454 μm30.728 μm41.022 μm51.138 μm
PISOF9.991 μm20.006 μm29.984 μm39.961 μm49.951 μm
Table 2. The maximum strain values measured for two kinds of fiber under different crack sizes.
Types of Optical Fiber SensorsCrack Width
10 μm20 μm30 μm40 μm50 μm
0.9mm TSSOF310.2 με601.9 με876.4 με1217.5 με1569.4 με
PISOF1006.6 με3166.7 με3197.8 με4652.1 με5515.6 με
Disclaimer/Publisher’s Note: The statements, opinions and data contained in all publications are solely those of the individual author(s) and contributor(s) and not of MDPI and/or the editor(s). MDPI and/or the editor(s) disclaim responsibility for any injury to people or property resulting from any ideas, methods, instructions or products referred to in the content.

