Article

Diamond-Based Fiber-Optic Fabry–Perot Interferometer with Ultrawide Refractive-Index Measurement Range

School of Electronic and Information Engineering, Southwest University, No. 2, Tiansheng Road, BeiBei District, Chongqing 400715, China
*
Authors to whom correspondence should be addressed.
Photonics 2024, 11(8), 763; https://doi.org/10.3390/photonics11080763
Submission received: 9 July 2024 / Revised: 7 August 2024 / Accepted: 12 August 2024 / Published: 15 August 2024
(This article belongs to the Special Issue Progress in Fiber Optic Sensors: Design and Applications)

Abstract

:
The majority of Fabry–Perot interferometer (FPI) tip refractive index (RI) sensors utilize silica optical fiber as the cavity material, with an RI of approximately 1.45. This restricts their applicability in measuring the RI of liquids with an RI of approximately 1.45. Here, we propose a fiber-optic FPI-tip RI sensor by bonding a flat, thin diamond film onto the apex of a single-mode optical fiber. The FPI cavity is constructed from a diamond with an RI of approximately 2.4, theoretically enabling the sensor to achieve an ultrawide RI measurement range of 1 to 2.4. A theoretical comparison of its measurement performance was conducted with that of an FPI-tip RI sensor whose cavity is formed by silica fiber. Additionally, an experimental examination of the device’s RI measurement performance was conducted. The results show that the sensor has visibility to the RI unit of −0.4362/RIU in the RI range of 1.33 to 1.40. Combined with other narrow-RI-ranged high-sensitivity sensors, our proposed RI sensor has the potential for use in a wide range of applications.

1. Introduction

Measuring the refractive index (RI) accurately is important in various fields, including the chemical industry, disease diagnosis, environmental monitoring, food safety, and scientific research [1,2,3]. Numerous effective RI measurement techniques have been developed. The Abbe refractometer is the most traditional RI measurement equipment in labs, while the fiber-optic RI sensor is the most intensively investigated configuration for online RI monitoring. Many fiber-optic RI sensors have been proposed [1,2,3]. For example, a side-polished optical fiber coated with a thin metal film was used to excite plasmonic resonance to sense RI changes when in contact with the metal film’s surface [2]. Additionally, fiber-optic gratings, including the long-period [4] and tapered [5] fiber gratings, and side-polished [5] or cladding-etched [6,7] fiber Bragg gratings have been used for measuring the RI of liquids. Also, open-cavity fiber-optic interferometers, including the Fabry–Perot interferometer (FPI) [8,9,10] and the Mach–Zehnder interferometer (MZI) [11], have been used in monitoring the RI of liquids or gases. A fiber-optic FPI-tip RI sensor is fabricated to measure the gas/liquid contact at its tip [12,13,14]. However, because the RI of silica optical fiber is approximately 1.45, many of these fiber-optic sensors have narrow RI measurement ranges. In particular, for the FPI-tip RI sensor whose cavity is a silica optical fiber, its responses will fluctuate near an RI of around 1.45, which is close to the RI of many liquids [12]. The most popular Abbe refractometer has an RI measurement range of only 1.30 to 1.70, which is insufficient for certain industrial and research applications. This is particularly evident in the fields of high-resolution research and industry. The utilization of high-coupling-efficiency optical applications involving high-RI liquids is a common practice. In such instances, a refractometer with a more expansive range of RI measurements is required, one that can be readily utilized in an online setting. For example, in the integrated chip industry and optical research, high-RI materials, such as UV-curing adhesives with an RI exceeding 1.8, are employed. Diamond is a form of carbon whose atoms are arranged in a crystalline structure. Because of its merits, such as ultra-high RI, extreme hardness, ultra-high thermal conductivity, and high chemical corrosion resistance [15], along with the easy creation of color centers with excellent quantum properties at room temperature [16], it is widely used as a gemstone and in the industry as well as in scientific research. Here, we propose an ultrawide-range RI measurement fiber-optic FPI sensor fabricated by bonding a micrometer-sized flat diamond particle on the apex of a single-mode optical fiber. The cavity of the proposed FPI is formed by the diamond, with two reflective mirrors created at the fiber–diamond interface and the diamond interface exposed to the measured sample, respectively.

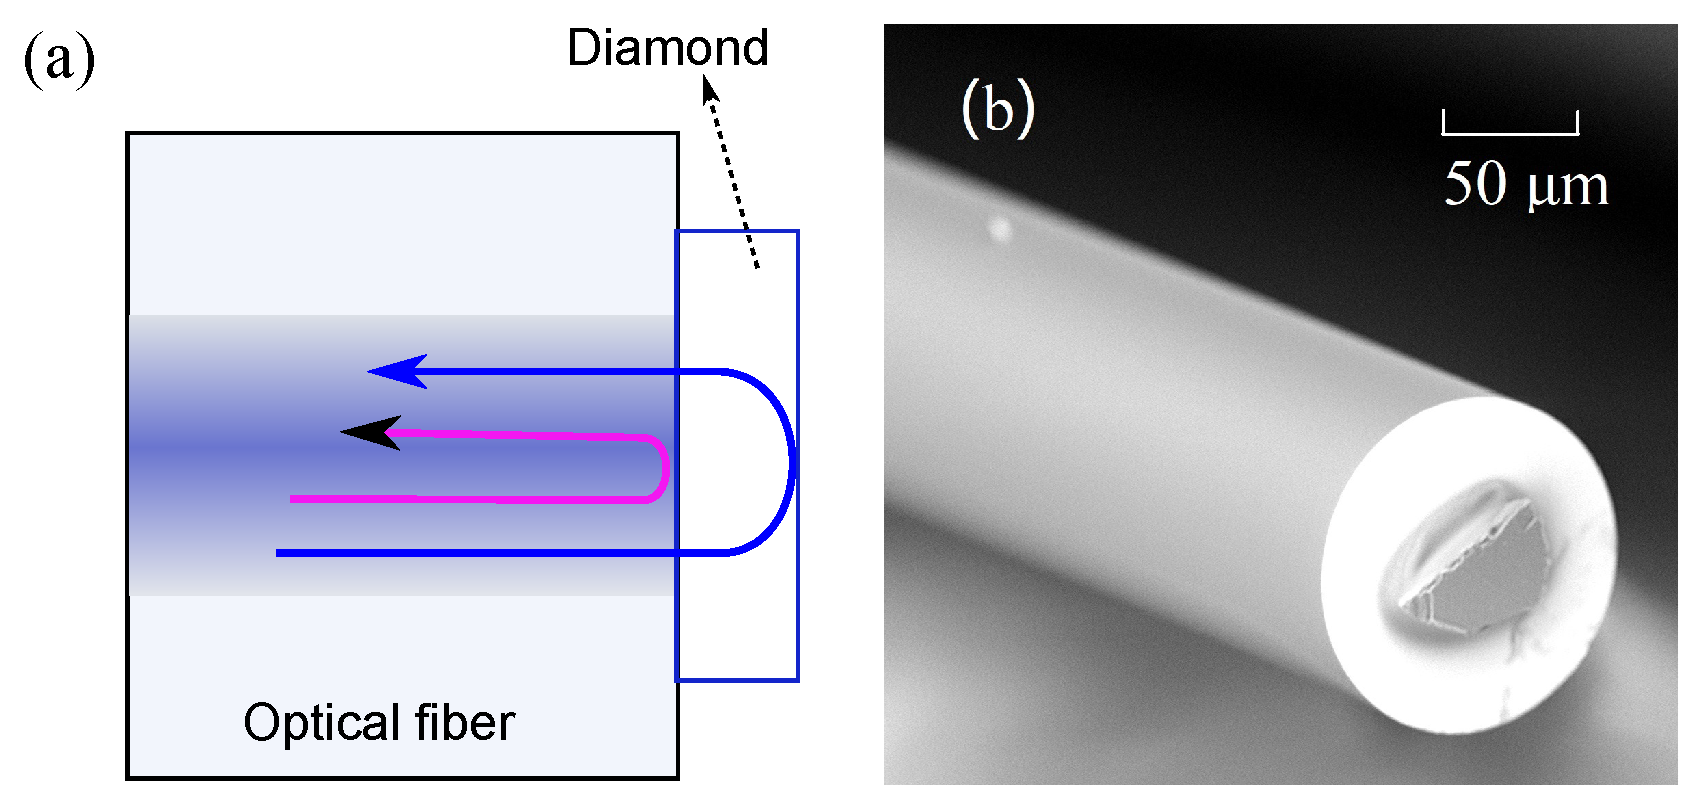
2. Sensor Fabrication and Principles

The diamond-based FPI is fabricated by first applying a small amount of UV-curable adhesive to the cleaved flat end of the single-mode optical fiber, then positioning the fiber end to bond the selected micrometer-scale diamond at the center of the fiber end, and finally curing the UV-curable adhesive under UV light for approximately 5 min.The principal schematic diagram of the diamond-based FPI is shown in Figure 1a, and one of the electron microscope images of the fabricated FPI, which has a cavity length (diamond thickness) of approximately 34.14 μm, is shown in Figure 1b. The two reflection mirrors of the FPI are formed by the fiber–diamond interface and the diamond interface, which is exposed to the measured sample, respectively, and their light power reflection coefficients, denoted as R 1 and R 2 , are given by [12,13]
R 1 = ( n d n f n d + n f ) 2 , R 2 = ( n d n s n d + n s ) 2
where n d = 2.4 represents the refractive index of the diamond, n f = 1.46 denotes the refractive index of the optical fiber core, and n s represents the RI of the measured sample that contacts the diamond surface. Then, the total reflected light field from the two faces/mirrors of the FPI is
E r = E 0 [ R 1 + ( 1 α ) ( 1 R 1 ) R 2 e j 2 ϕ ]
α denotes the ratio of transmission loss caused by the light beam divergence in the diamond and the imperfections on the diamond surface, and ϕ denotes the round-trip propagation phase shift, given by ϕ = ( 2 π n d L d ) / λ . Thus, the FPI’s total reflective intensity, I r ( λ ) is
I r ( λ ) = E 0 2 [ R 1 + R 2 ( 1 α ) 2 ( 1 R 1 ) 2 + 2 ( 1 α ) ( 1 R 1 ) R 1 R 2 cos 4 π n d L d λ ]
when λ = ( 2 n d L d ) / k and λ = ( 4 n d L d ) / ( 2 k + 1 ) (k represents an integer), the FPI’s total reflective intensity I r ( λ ) reaches its maximum and minimum values, respectively. Thus, the visibility of the FPI’s interference fringes is
V = I r . m a x I r . m i n I r . m a x + I r . m i n = 2 ( 1 α ) ( 1 R 1 ) R 1 ( n d 2 n s 2 ) R 1 ( n d + n s ) 2 + [ ( 1 α ) ( 1 R 1 ) ] 2 ( n d n s ) 2
Figure 2 shows the reflection spectrum of a fabricated FPI when immersed in microscopic immersion oil with an RI of n = 1.517 . It can be observed that the FPI interference spectrum exhibits varying degrees of visibility at different wavelengths. This phenomenon can be attributed to the non-uniformity of the light source intensity. In theory, as indicated by Equation (4), the light source intensity will ultimately be subtracted, meaning that the visibility will not be contingent on the intensity of the light source. In practice, when the lowest light intensity detectable by the optical spectrum analyzer (OSA) is limited, and when the resonance valley I r . m i n falls below the noise floor of the OSA, the only result obtained I r . m i n is the noise floor. The resonance peaks I r . m a x take on a shape similar to that of the light source’s intensity spectrum. Consequently, as the light source’s intensity decreases, the obtained visibility also decreases, falling below the theoretical visibility. Another factor that affects the visibility of the FPI is the cavity length or diamond thickness. From Equation (4), it can be seen that the highest visibility is achieved when the reflected light intensities from the two mirrors, the fiber–diamond interface, and the diamond interface are equal. This is represented by R 1 equals to R 2 ( 1 α ) 2 ( 1 R 1 ) 2 . However, due to the losses caused by coupling and light beam divergence in the diamond ( α ), it is typically the case that R 2 ( 1 α ) 2 ( 1 R 1 ) 2 is smaller than R 1 , thus preventing the attainment of the maximum visibility value of 1. As the divergence of the light beam increases in proportion to the length of the cavity, an increase in the thickness of the diamond results in a reduction in the intensity of the reflected light coupled back to the optical fiber, indicated by the increase in the value of α . Consequently, the value of R 2 ( 1 α ) 2 ( 1 R 1 ) 2 diminishes, and the degree of visibility declines. To accurately determine the maximum visibility of the interference spectrum, we selected the peak with the highest intensity as I r . m a x and its neighboring valley as I r . m i n in Equation (4). Using Equations (1) and (4), we obtained that the value of α is 0.43142 for the diamond-based FPI whose reflection spectrum is shown in Figure 2. Substituting α into Equation (4) and replacing R 1 in Equation (4) with the value calculated from Equation (1), we obtain the relationship between the FPI’s interference fringes’ visibility, V, and the RI of the measured sample, n s , as shown in Figure 3. This calculation shows that the diamond-based FPI has a wide RI measurable range. Even if the measured sample’s RI reaches 2.2, the FPI’s interference fringes still have a visibility of approximately 0.2. Additionally, as shown in Figure 3a, we calculated the interference fringes’ visibility versus the measured sample’s RI for a traditional FPI whose cavity is formed by silica optical fiber (we used α = 0.43142 for the calculation). The theoretically calculated results in Figure 3a show that each visibility value of the diamond-based FPI corresponds to only one RI value. In other words, its visibility and RI values are bijective. In contrast, each visibility value of the silica optical fiber-based FPI corresponds to four RI values in the RI range of 1.0 to 2.4. For the air-plus-silica hybrid cavity FPI, as reported in [12,13], each visibility value corresponds to two RI values in the RI range of 1.0 to 2.4, as shown in Figure 3c. The calculation is based on the original data ( R 1 = 0.004 , α 1 = 0.5 , α 2 = 0.1 ) and formula (Equation (8)) presented in [12]. Thus, although it has high RI sensitivity in some small RI ranges, the non-bijective relationship between visibility and RI values limits the applications of the silica optical fiber-based FPI. Figure 3b,d illustrate the comparison of the sensitivity ( Δ ( v i s i b i l i t y ) / Δ ( R I ) ) of the proposed diamond-based FPI, the silica cavity FPI, and the air-plus-silica hybrid cavity FPI [12]. The results demonstrate that the absolute sensitivity value of the diamond-based FPI is lower than that of the conventional silica fiber cavity FPI and the air-plus-silica hybrid cavity FPI across the refractive index ranges of 1.0 to approximately 1.65 and 1.1 to approximately 1.77, respectively.

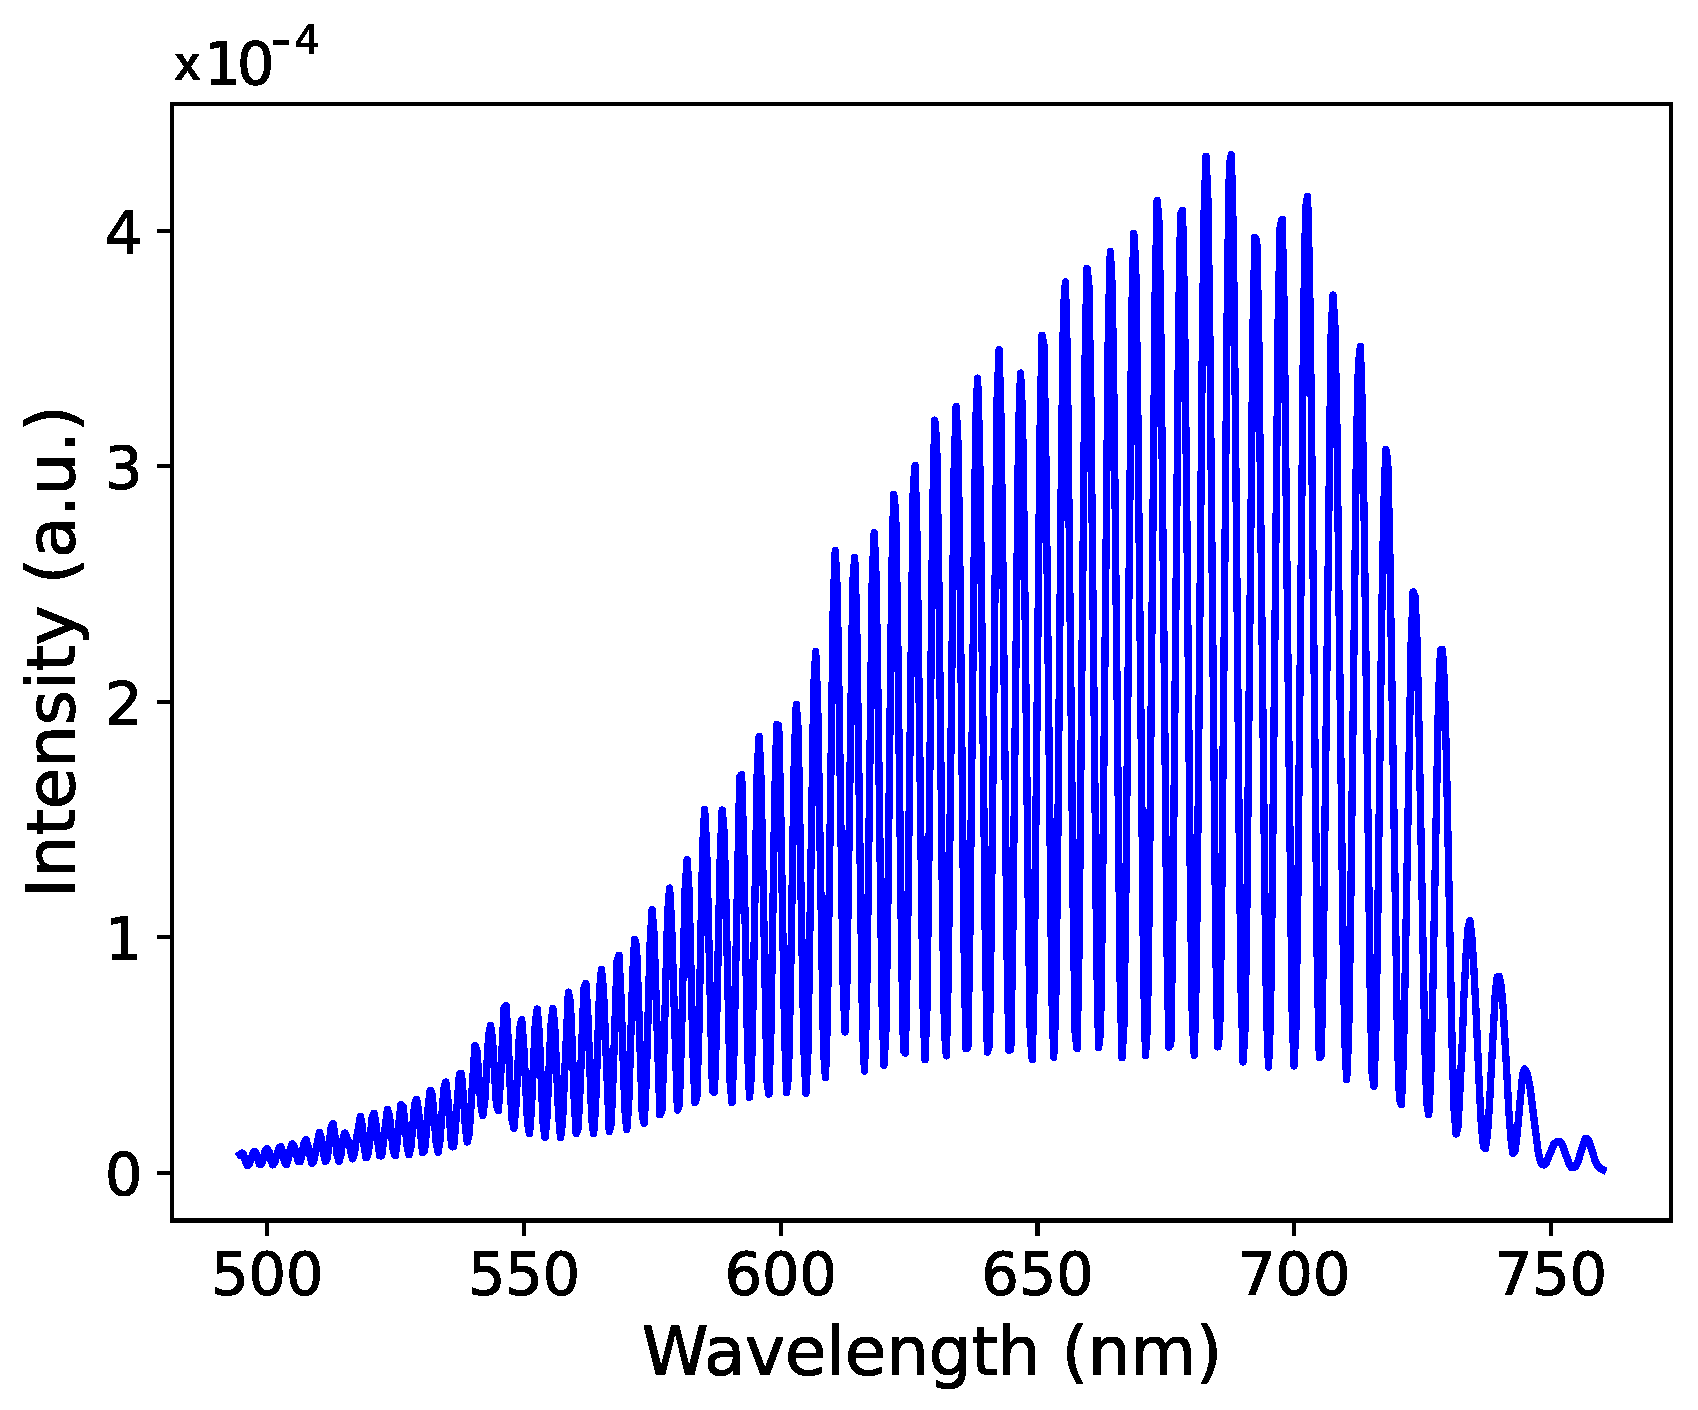
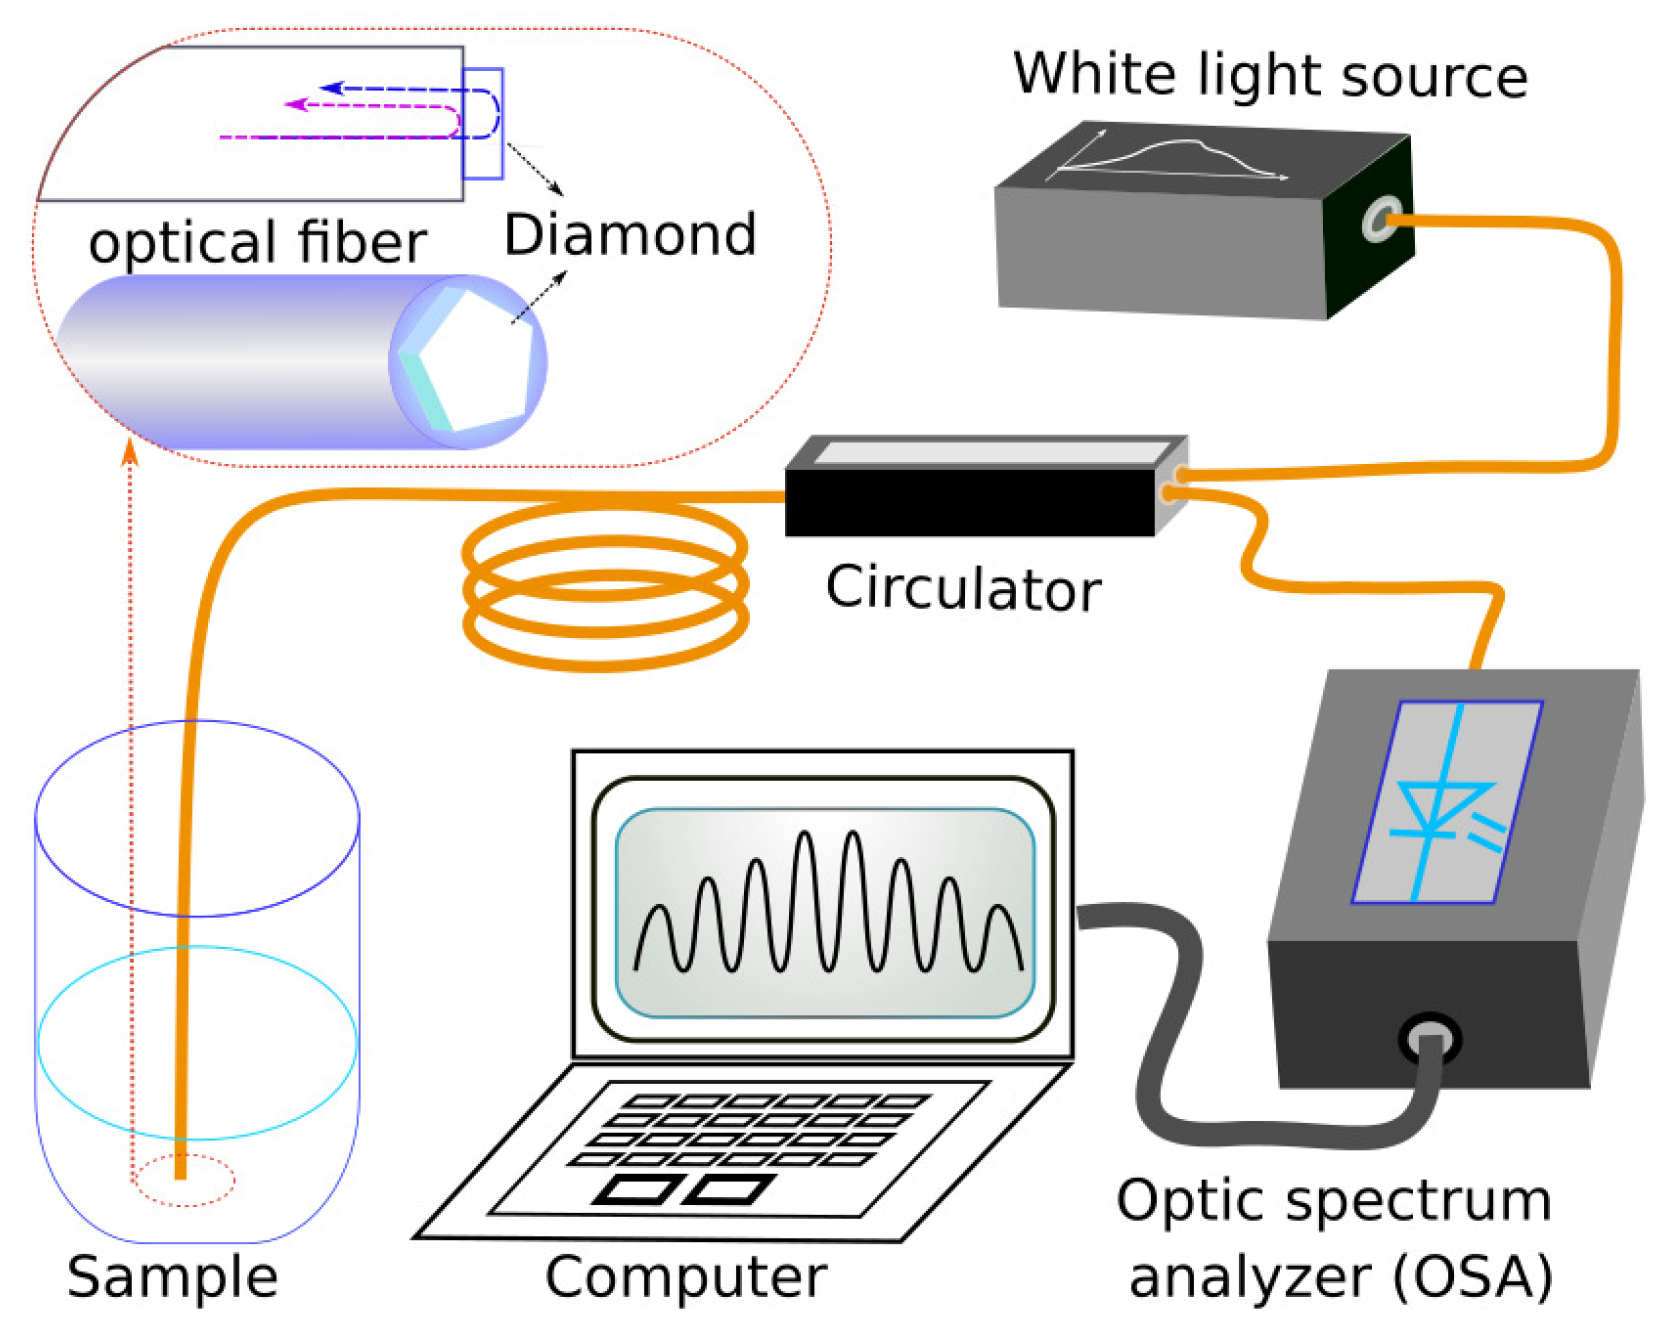
3. Experiment and Results
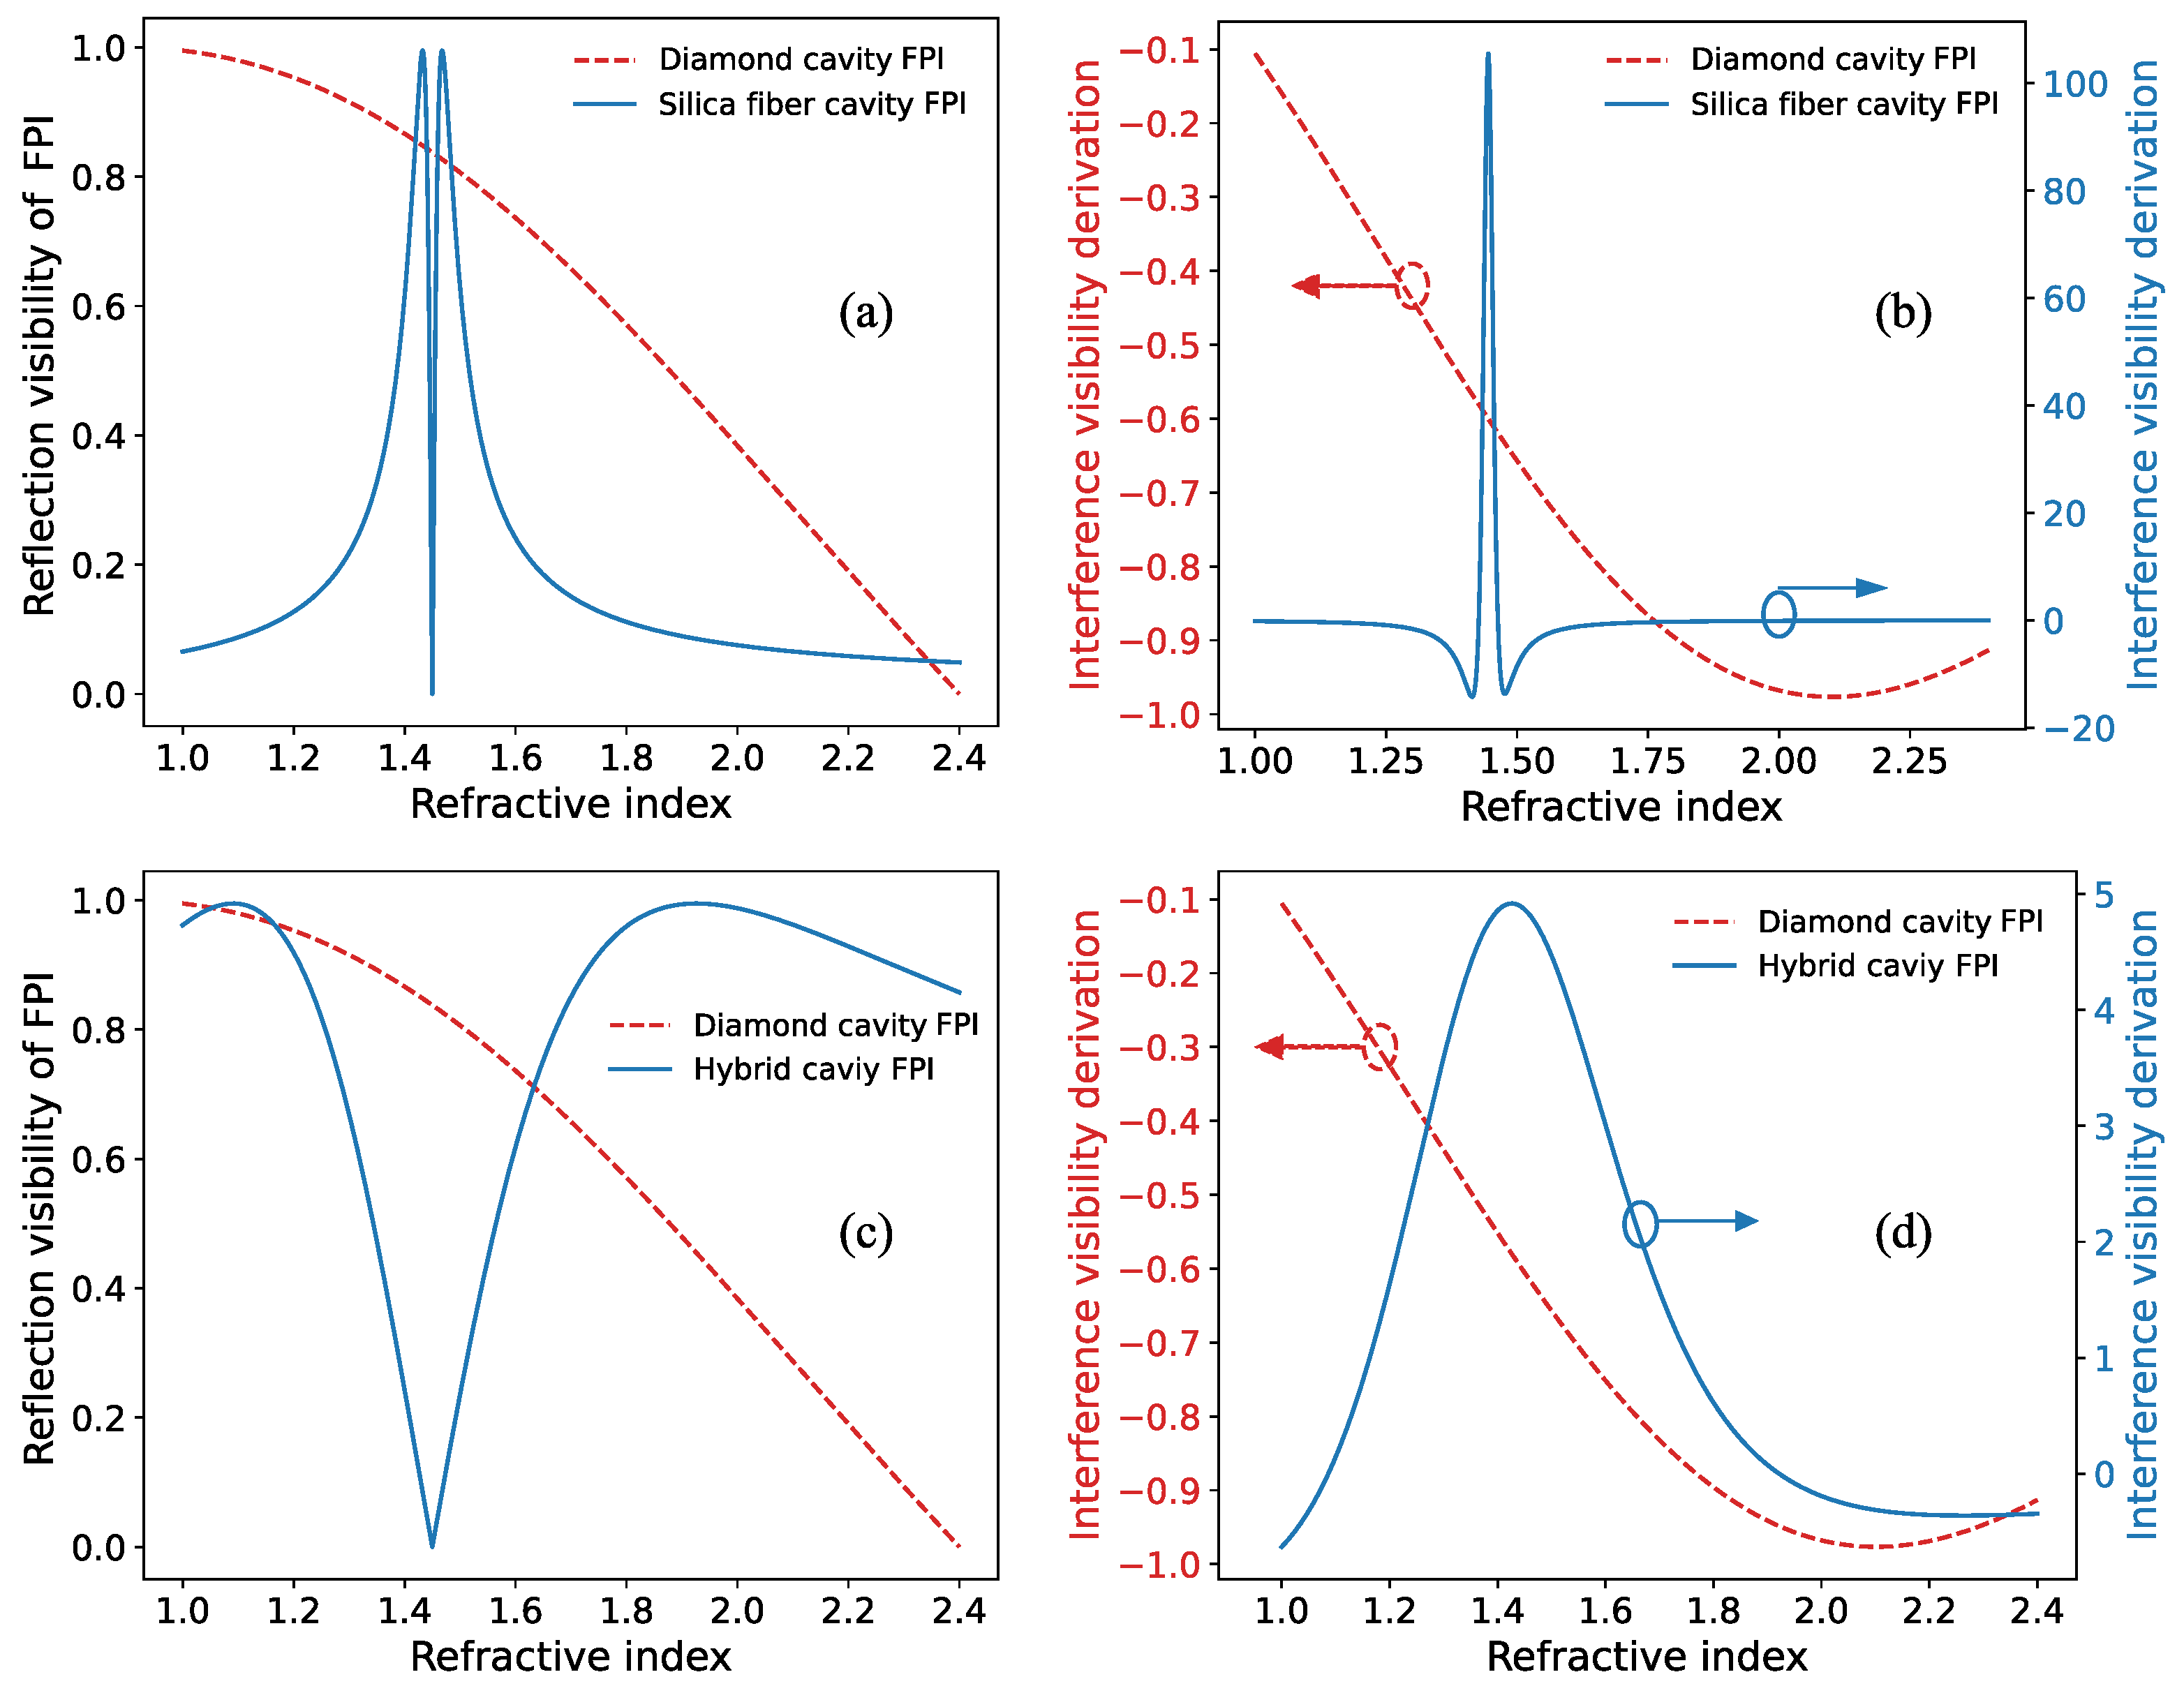
Figure 4 shows the experimental setup for measuring the refractive index (RI) of liquids using the diamond-based FPI. Broadband light from a white light source is introduced into the diamond-based FPI through an optical fiber connected to an optical circulator. The FPI’s reflection spectrum, guided back through the same fiber, is then coupled to an optical spectrum analyzer (OSA, Anritsu, Atsugi, Japan, MS9740A) via the optical circulator. A computer is connected to the OSA to analyze and record the FPI’s reflection spectrum.
We first selected a group of glucose solutions with sugar concentrations ranging from 0% to 40% in 5% increments and measured their RI using an Abbe refractometer (Shanghai Li Chen, with an accuracy of 0.0002 nD). Then, we dipped our diamond-based FPI in the glucose solution and recorded its reflection spectrum. The diamond-based FPI we used has a thickness (cavity length) of approximately 48.6 μm, and its reflection spectrum is shown in Figure 5 (blue line). The minor peak observed near 1565 nm is attributed to the light source, as the light source exhibits a similar minor peak at approximately 1565 nm (red dashed line).The visibility of the FPI is calculated using Equation (4) by selecting the peak with the highest intensity as I r . m a x , which is the fourth peak near 1595 nm, and its neighboring valley as I r . m i n , which is the third valley near 1584 nm in Figure 5. The uncertainty associated with these measurements can be evaluated by conducting repeated measurements. The measured reflected spectrum of the FPI inserted in glucose solutions with varying RI is shown in Figure 6a. Their visibility of the FPI versus the measured RI results, along with its comparison to the theoretically calculated visibility versus RI curve, is shown in Figure 6b. Figure 6b demonstrates that the experimental results closely match the theoretically calculated visibility values. Also, Figure 6b shows that within the RI range of 1.33 to 1.40, the visibility decreases linearly with the increase in RI. The calculated sensitivity is approximately −0.4362/RIU, indicating that the visibility of the FPI’s reflection spectrum changes by approximately −0.4362 when the RI increases by one refractive index unit (RIU). From an RI of 1.33 to 1.40, the total change in the power of the FPI-interfering spectrum peak is 0.025 μW, with an average error of 0.000267 μW. Therefore, the sensitivity to RI is approximately 0.357143 μW/RIU and the achievable RI resolution is about 7.5 × 10 4 . We then investigated the temperature dependence of the diamond-based FPI’s visibility by raising the temperature from 20 °C to 80 °C, in increments of 10 °C, in air, and measured the corresponding reflection spectrum visibility. The results shown in Figure 7 indicate that the visibility of the FPI has a maximum fluctuation of approximately 0.0035, corresponding to an RI error of about 8.2 × 10 3 .

4. Discussions

The available RI sensors and instruments are typically designed for short-range RI measurements. For instance, even the most popular RI instrument, the Abbe refractometer, has an RI measurement range of 1.30 to 1.70. In comparison, our proposed diamond-based FPI offers an RI measurement range of 1.0 to 2.4, thereby addressing the shortage of wide-range RI sensors in practical applications. Furthermore, our proposed diamond-based FPI-tip RI sensor is straightforward to fabricate and cost-effective. One potential limitation of the proposed RI sensor is its relatively low sensitivity. The results of the simulation, as shown in Figure 3, and the experimental results, as shown in Figure 6, demonstrate that the diamond-based fiber-optic FPI-tip RI sensor has an ultrawide RI measurement range. However, the sensitivity of the diamond-based RI sensor is less pronounced compared to the silica fiber-based fiber-optic FPI-tip RI sensor when the measured RI is below 1.65, particularly within the RI range where the silica fiber RI is situated. For example, the results of the air cavity-plus-silica fiber hybrid FPI in [12] indicate that their obtained sensitivity in the RI range of 1.32 to 1.45 is approximately −4.59/RIU, which is about 10 times higher than that of our fabricated diamond-based RI sensor. Therefore, in practical applications, combining a diamond-based FPI with other narrow-range, high-sensitivity RI sensors, such as a silica fiber-based FPI, will allow the respective advantages of both types to be exploited, thereby obtaining accurate RI measurements of a liquid sample across a wide RI range. For example, a diamond-based FPI could be utilized to precisely determine the RI range of a given sample. Subsequently, a silica fiber-based FPI or other narrow-range, high-sensitivity RI sensors could be employed to achieve high sensitivity within the specific narrow range of 1.35 to 1.65.
Our fabricated FPI exhibits temperature-induced non-linear fluctuations in visibility, as shown in Figure 7. This phenomenon can be primarily attributed to the high thermal expansion of the UV-curing adhesive used for bonding the diamond. This expansion, due to rising temperatures, affects the light coupling between the diamond and the optical fiber, thereby influencing the overall performance of the RI sensor. Using thermally stable bonding materials, such as melt glass or transparent ceramics, to bond the diamond to the fiber tip may reduce these visibility fluctuations. Additionally, alternative fabrication techniques for the FPI, such as directly coating a nanodiamond/zinc oxide (ZnO) film followed by depositing a silicon film [17,18], or directly growing a diamond film or sheet on the optical fiber end, may reduce the aforementioned visibility fluctuations.
As indicated by Equation (4), the proposed configuration of the fiber-optic FPI-tip RI sensor’s RI measuring range is contingent upon the RI of the transparent materials used to construct the FPI cavity end surface. Therefore, in the configuration of an ultrawide-RI-measurable-range diamond-based FPI sensor, the diamond can be substituted with alternative high-RI transparent micrometer-scale flat and thin films, including zinc oxide and titanium oxide crystals, sapphire, high-RI glasses, and high-RI transparent ceramics. The ultrawide RI measurable range will remain unaltered. One such configuration is proposed in Figure 8a. Additionally, a small drop of high-RI polymer fluid, which becomes transparent when solidified, can be applied onto the optical fiber tip to form a wide-RI-measurable-range FPI-type RI sensor, as proposed in Figure 8b.

5. Conclusions

In conclusion, we have proposed a fiber-optic FPI sensor with an ultrawide RI measurement range. This sensor was fabricated by bonding a flat, thin, micrometer-scale diamond film onto the apex of a single-mode optical fiber. The theoretical discussion encompasses an examination of the operational principle, sensitivity, and the dependence of the measurement range. Moreover, the RI performance of the sensor was evaluated by measuring a series of glucose solutions with varying RI values, calibrated using an Abbe refractometer. Furthermore, the temperature response of the sensor was investigated by analyzing the visibility of the reflection spectrum at different temperatures. The performance of the FPI RI sensor is consistent with theoretical calculations, exhibiting a sensitivity of −0.4362/RIU in the RI range of 1.33 to 1.40. The FPI’s reflection spectrum visibility exhibits a maximum fluctuation of approximately 0.0035 between 20 °C and 80 °C. Further research is required to investigate the use of thermally stable bonding materials to bond the diamond to the optical fiber or, alternatively, the direct application of other adhesive fabrication techniques, such as coating or growing diamond on the optical fiber apex. Additionally, the ultrawide RI measurement range of this particular FPI-tip sensor configuration can be extended by substituting the micrometer-scale flat and thin diamond film on the optical fiber apex with alternative high-RI transparent flat and thin crystal/glass films or a high-RI transparent polymer drop, thus potentially yielding a more practical RI sensor worthy of further investigation. This type of ultrawide-measurement-range FPI RI sensor can be utilized as a standalone device or in conjunction with other narrow-range, high-sensitivity RI sensors to achieve accurate RI measurements across a wide range. In combination with other online RI sensors, this ultrawide-RI-measurable and high-spatial-resolution FPI sensor may offer new possibilities for practical applications.

Author Contributions

Conceptualization, D.D. and Y.-Y.X.; methodology, D.D.; validation, D.D., J.Y. and Y.T.; formal analysis, D.D. and J.Y.; investigation, D.D. and J.Y.; resources, D.D. and Y.-Y.X.; data curation, J.Y.; writing—original draft preparation, D.D. and J.Y.; writing—review and editing, D.D.; project administration, D.D. and Y.-Y.X.; funding acquisition, D.D. All authors have read and agreed to the published version of the manuscript.

Funding

This research was funded by Chongqing Ph.D. “Through Train” Scientific Research Project-sl202100000172. Fundamental Research Funds for the Central Universities (grant number: SWU021004).

Institutional Review Board Statement

Not applicable.

Informed Consent Statement

Not applicable.

Data Availability Statement

Data are contained within the article.

Conflicts of Interest

The authors declare no conflicts of interest.

References

  1. Aydin, D.; Barnes, J.A.; Loock, H.P. In-fiber interferometry sensors for refractive index. Appl. Phys. Rev. 2023, 10, 011307. [Google Scholar] [CrossRef]
  2. Xu, Y.; Bai, P.; Zhou, X.; Akimov, Y.; Png, C.E.; Ang, L.K.; Knoll, W.; Wu, L. Optical Refractive Index Sensors with Plasmonic and Photonic Structures: Promising and Inconvenient Truth. Adv. Opt. Mater. 2019, 7, 1801433. [Google Scholar] [CrossRef]
  3. Li, X.; Shao, Y.; Yu, Y.; Zhang, Y.; Wei, S. A Highly Sensitive Fiber-Optic Fabry–Perot Interferometer Based on Internal Reflection Mirrors for Refractive Index Measurement. Sensors 2016, 16, 794. [Google Scholar] [CrossRef]
  4. Lee, C.L.; Weng, Z.Y.; Lin, C.J.; Lin, Y. Leakage coupling of ultrasensitive periodical silica thin-film long-period grating coated on tapered fiber. Opt. Lett. 2010, 35, 4172–4174. [Google Scholar] [CrossRef] [PubMed]
  5. Gomes, A.D.; Silveira, B.; Warren-Smith, S.C.; Becker, M.; Rothhardt, M.; Frazão, O. Temperature independent refractive index measurement using a fiber Bragg grating on abrupt tapered tip. Opt. Laser Technol. 2018, 101, 227–231. [Google Scholar] [CrossRef]
  6. Yang, M.; Dai, J.; Li, X.; Wang, J. Side-polished fiber Bragg grating refractive index sensor with TbFeCo magnetoptic thin film. J. Appl. Phys. 2010, 108, 033102. [Google Scholar] [CrossRef]
  7. Guo, J.; Sun, M.; Fang, J.; Wei, G.; Shi, B.; Jiang, H. High-Sensitivity Seawater Salinity Sensing With Cladding Etched Fiber Bragg Grating Technology. IEEE Sens. J. 2023, 23, 14182–14192. [Google Scholar] [CrossRef]
  8. Duan, D.; Rao, Y.J.; Zhu, T. High sensitivity gas refractometer based on all-fiber open-cavity Fabry–Perot interferometer formed by large lateral offset splicing. J. Opt. Soc. Am. B 2012, 29, 912–915. [Google Scholar] [CrossRef]
  9. Wu, C.; Liu, Z.; Zhang, A.P.; Guan, B.O.; Tam, H.Y. In-line open-cavity Fabry–Pérot interferometer formed by C-shaped fiber for temperature-insensitive refractive index sensing. Opt. Express 2014, 22, 21757–21766. [Google Scholar] [CrossRef]
  10. Zhang, Q.; Hao, P.; Tian, X.; Li, Y. High-visibility in-line fiber-optic optofluidic Fabry–Pérot cavity. Appl. Phys. Lett. 2017, 111, 191102. [Google Scholar] [CrossRef]
  11. Duan, D.; Rao, Y.J.; Xu, L.C.; Zhu, T.; Wu, D.; Yao, J. In-fiber Mach–Zehnder interferometer formed by large lateral offset fusion splicing for gases refractive index measurement with high sensitivity. Sens. Actuators B Chem. 2011, 160, 1198–1202. [Google Scholar] [CrossRef]
  12. Rao, Y.J.; Deng, M.; Duan, D.W.; Zhu, T. In-line fiber Fabry-Perot refractive-index tip sensor based on endlessly photonic crystal fiber. Sens. Actuators A Phys. 2008, 148, 33–38. [Google Scholar] [CrossRef]
  13. Xu, B.; Yang, Y.; Jia, Z.; Wang, D.N. Hybrid Fabry-Perot interferometer for simultaneous liquid refractive index and temperature measurement. Opt. Express 2017, 25, 14483–14493. [Google Scholar] [CrossRef] [PubMed]
  14. Zhang, P.; Zhang, L.; Mourelatos, Z.P.; Wang, Z. Crystallization-sapphire-derived-fiber-based Fabry-Perot interferometer for refractive index and high-temperature measurement. Appl. Opt. 2018, 57, 9016–9021. [Google Scholar] [CrossRef] [PubMed]
  15. Field, J.E. The mechanical and strength properties of diamond. Rep. Prog. Phys. 2012, 75, 126505. [Google Scholar] [CrossRef] [PubMed]
  16. Schröder, T.; Mouradian, S.L.; Zheng, J.; Trusheim, M.E.; Walsh, M.; Chen, E.H.; Li, L.; Bayn, I.; Englund, D. Quantum nanophotonics in diamond [Invited]. J. Opt. Soc. Am. B 2016, 33, B65–B83. [Google Scholar] [CrossRef]
  17. Milewska, D.; Karpienko, K.; Jędrzejewska-Szczerska, M. Application of thin diamond films in low-coherence fiber-optic Fabry Pérot displacement sensor. Diamond Relat. Mater. 2016, 64, 169–176. [Google Scholar] [CrossRef]
  18. Majchrowicz, D.; Hirsch, M.; Wierzba, P.; Bechelany, M.; Viter, R.; Jędrzejewska-Szczerska, M. Application of Thin ZnO ALD Layers in Fiber-Optic Fabry-Pérot Sensing Interferometers. Sensors 2016, 16, 416. [Google Scholar] [CrossRef] [PubMed]
Figure 1. (a) Principle schematic diagram of the diamond-based fiber-optic Fabry–Perot interferometer (FPI). (b) Electronic microscope image of one fabricated diamond-based fiber-optic FPI (diamond thickness is approximately 34.14 μm).
Photonics 11 00763 g001
Figure 2. Measured reflection spectrum of a fabricated FPI sensor (diamond thickness is approximately 40.82 μm). The spectrum is obtained by inserting the FPI sensor inside microscopic immersion oil (Fluka 51786; its RI is n = 1.517 at room temperature (20 °C)).
Photonics 11 00763 g002
Figure 3. (a) Calculated maximum visibility versus measured refractive index (RI) of the fabricated diamond-based FPI (whose reflection spectrum is shown in Figure 2) and an optical fiber-based FPI sensor having the same α value ( α = 0.43142 ); n d is replaced by n s i l i c a = 1.45 in Equations (1) and (4). (b) Interference visibility derivation ( Δ ( v i s i b i l i t y ) / Δ ( R I ) ) of the two FPIs shown in (a). (c) Calculated maximum visibility versus measured RI of the fabricated diamond-based FPI and the air-plus-silica hybrid cavity FPI in [12]. (d) Interference visibility derivation ( Δ ( v i s i b i l i t y ) / Δ ( R I ) ) of the two FPIs shown in (c).
Photonics 11 00763 g003
Figure 4. Experimental setup for the diamond-based FPI’s RI sensor measurement. The yellow lines represent the single-mode optical fiber cables. The measured sample is in a baker, and the diamond-based FPI is immersed in the liquid sample during the measurement of the RI of the liquid sample. The inset is the schematic diagram of the diamond-based FPI.
Photonics 11 00763 g004
Figure 5. The interferometric spectrum of the diamond-based FPI used in RI measurements (diamond thickness approximately 48.6 μm). The spectrum is obtained by inserting the FPI sensor inside air and water whose RI is n = 1.33 at room temperature (20 °C). The red dashed line represents the reflected spectrum of a flat bare fiber end in the air, in the absence of the diamond.
Photonics 11 00763 g005
Figure 6. (a) The reflected spectrum of a diamond-based FPI inserted into glucose solutions with varying refractive indices (RIs). (b) Experimental measured maximum visibility versus measured RI results and theoretically calculated maximum visibility versus RI curve of the fabricated diamond-based FPI.
Photonics 11 00763 g006
Figure 7. Experimentally measured reflection spectrum visibility change due to the temperature change in the fabricated diamond-based FPI.
Photonics 11 00763 g007
Figure 8. The The schematic diagrams of the proposed ultrawide-RI-measurable-range fiber-optic FPI: (a) fabricated by bonding a high-RI flat and thin crystal or glass sheet on the apex of single-mode fiber, or (b) by dipping a small drop of high-RI transparent polymer and then solidifying it.
Photonics 11 00763 g008
Disclaimer/Publisher’s Note: The statements, opinions and data contained in all publications are solely those of the individual author(s) and contributor(s) and not of MDPI and/or the editor(s). MDPI and/or the editor(s) disclaim responsibility for any injury to people or property resulting from any ideas, methods, instructions or products referred to in the content.

