Longitudinal Wave Defect Detection Technology Based on Ablation Mechanism


Abstract
:1. Introduction
2. Theoretical Basis and Simulation Model
2.1. Laser Ultrasonic Ablation Theory
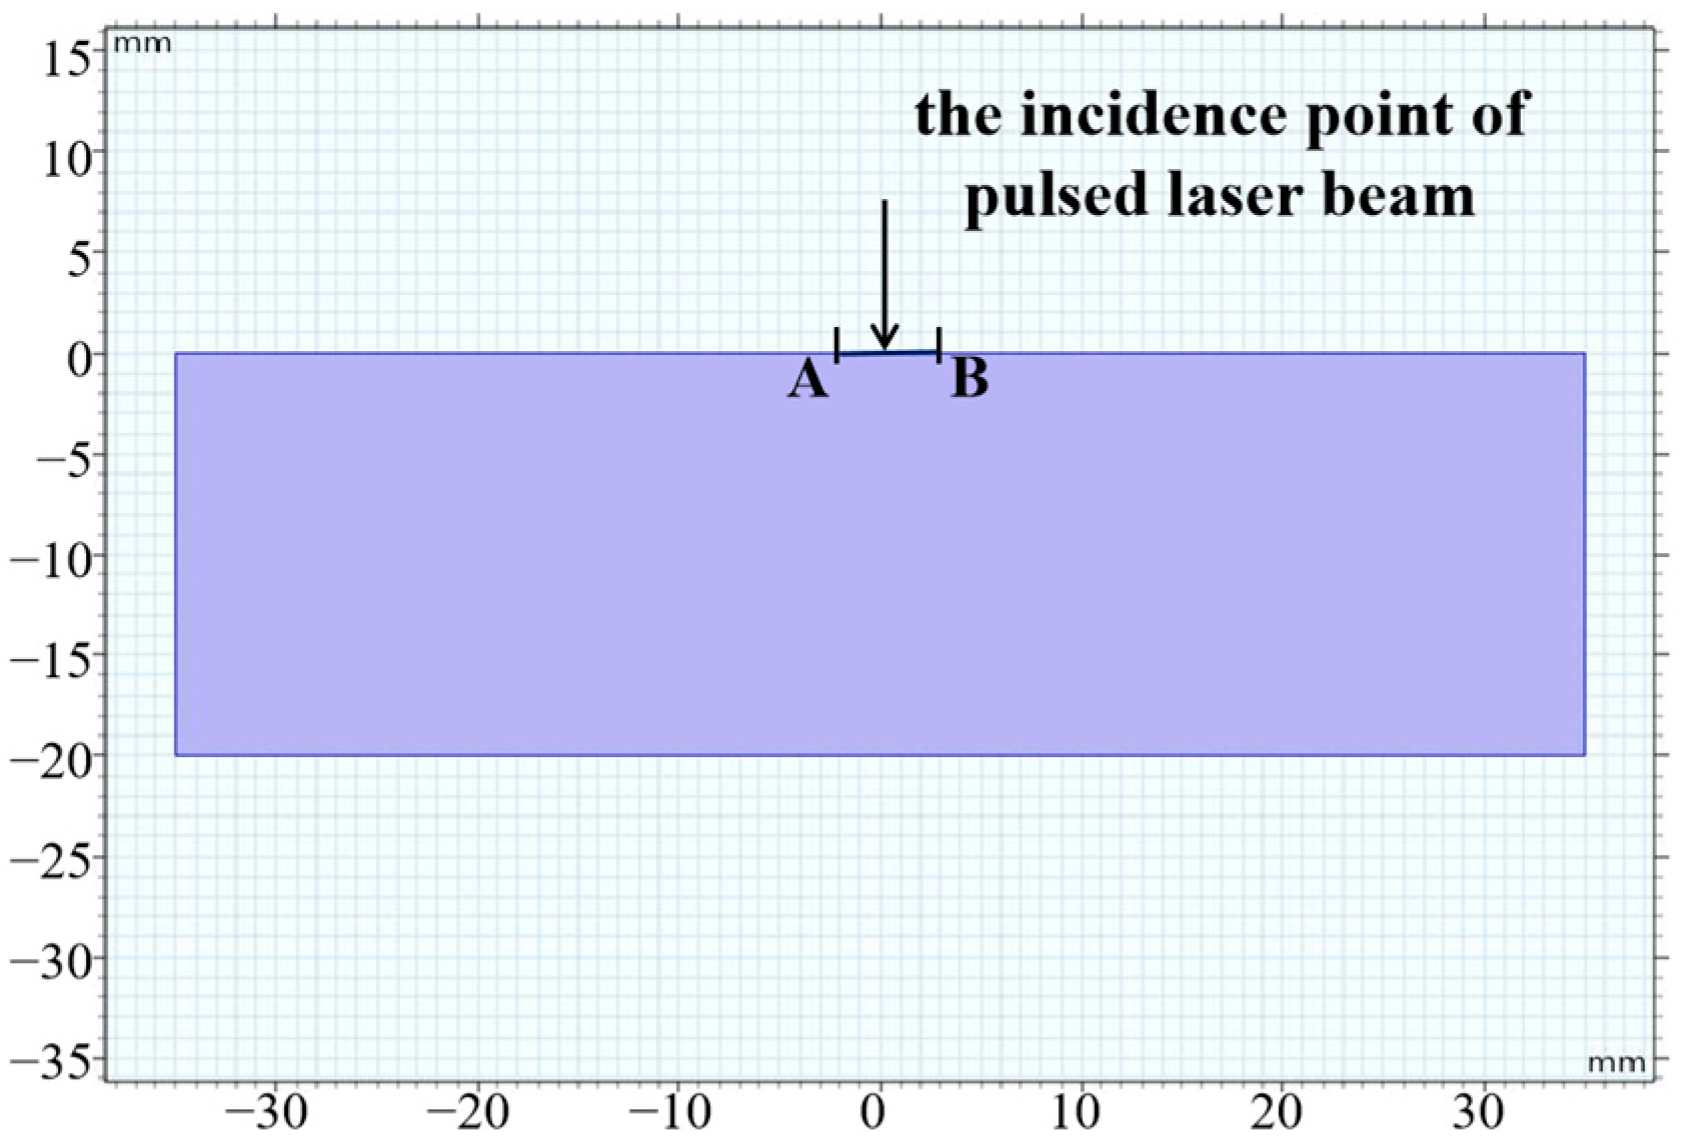
2.2. Model Building and Parameter Setting
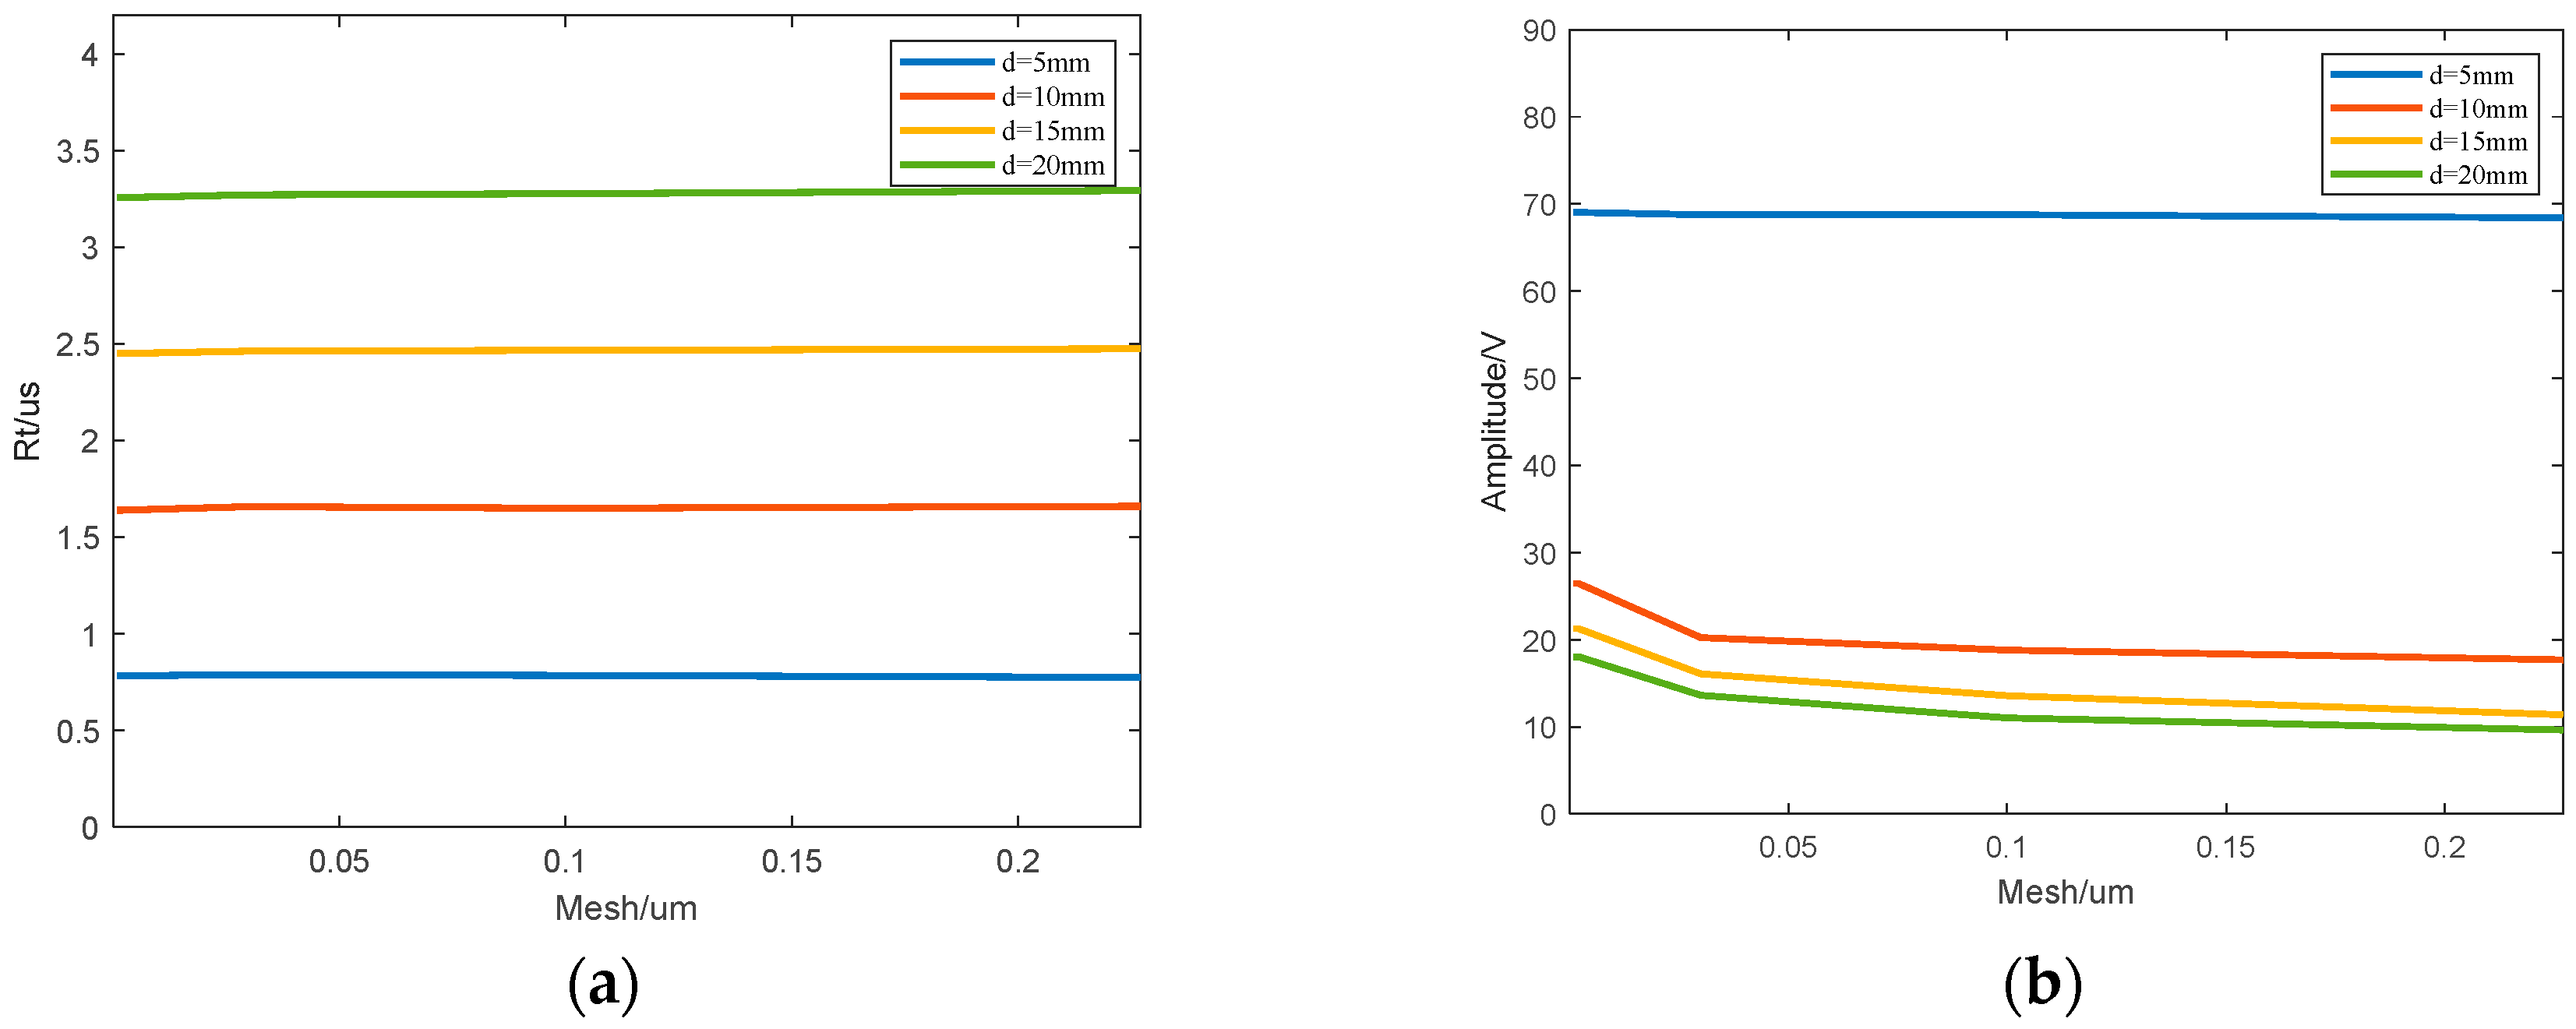
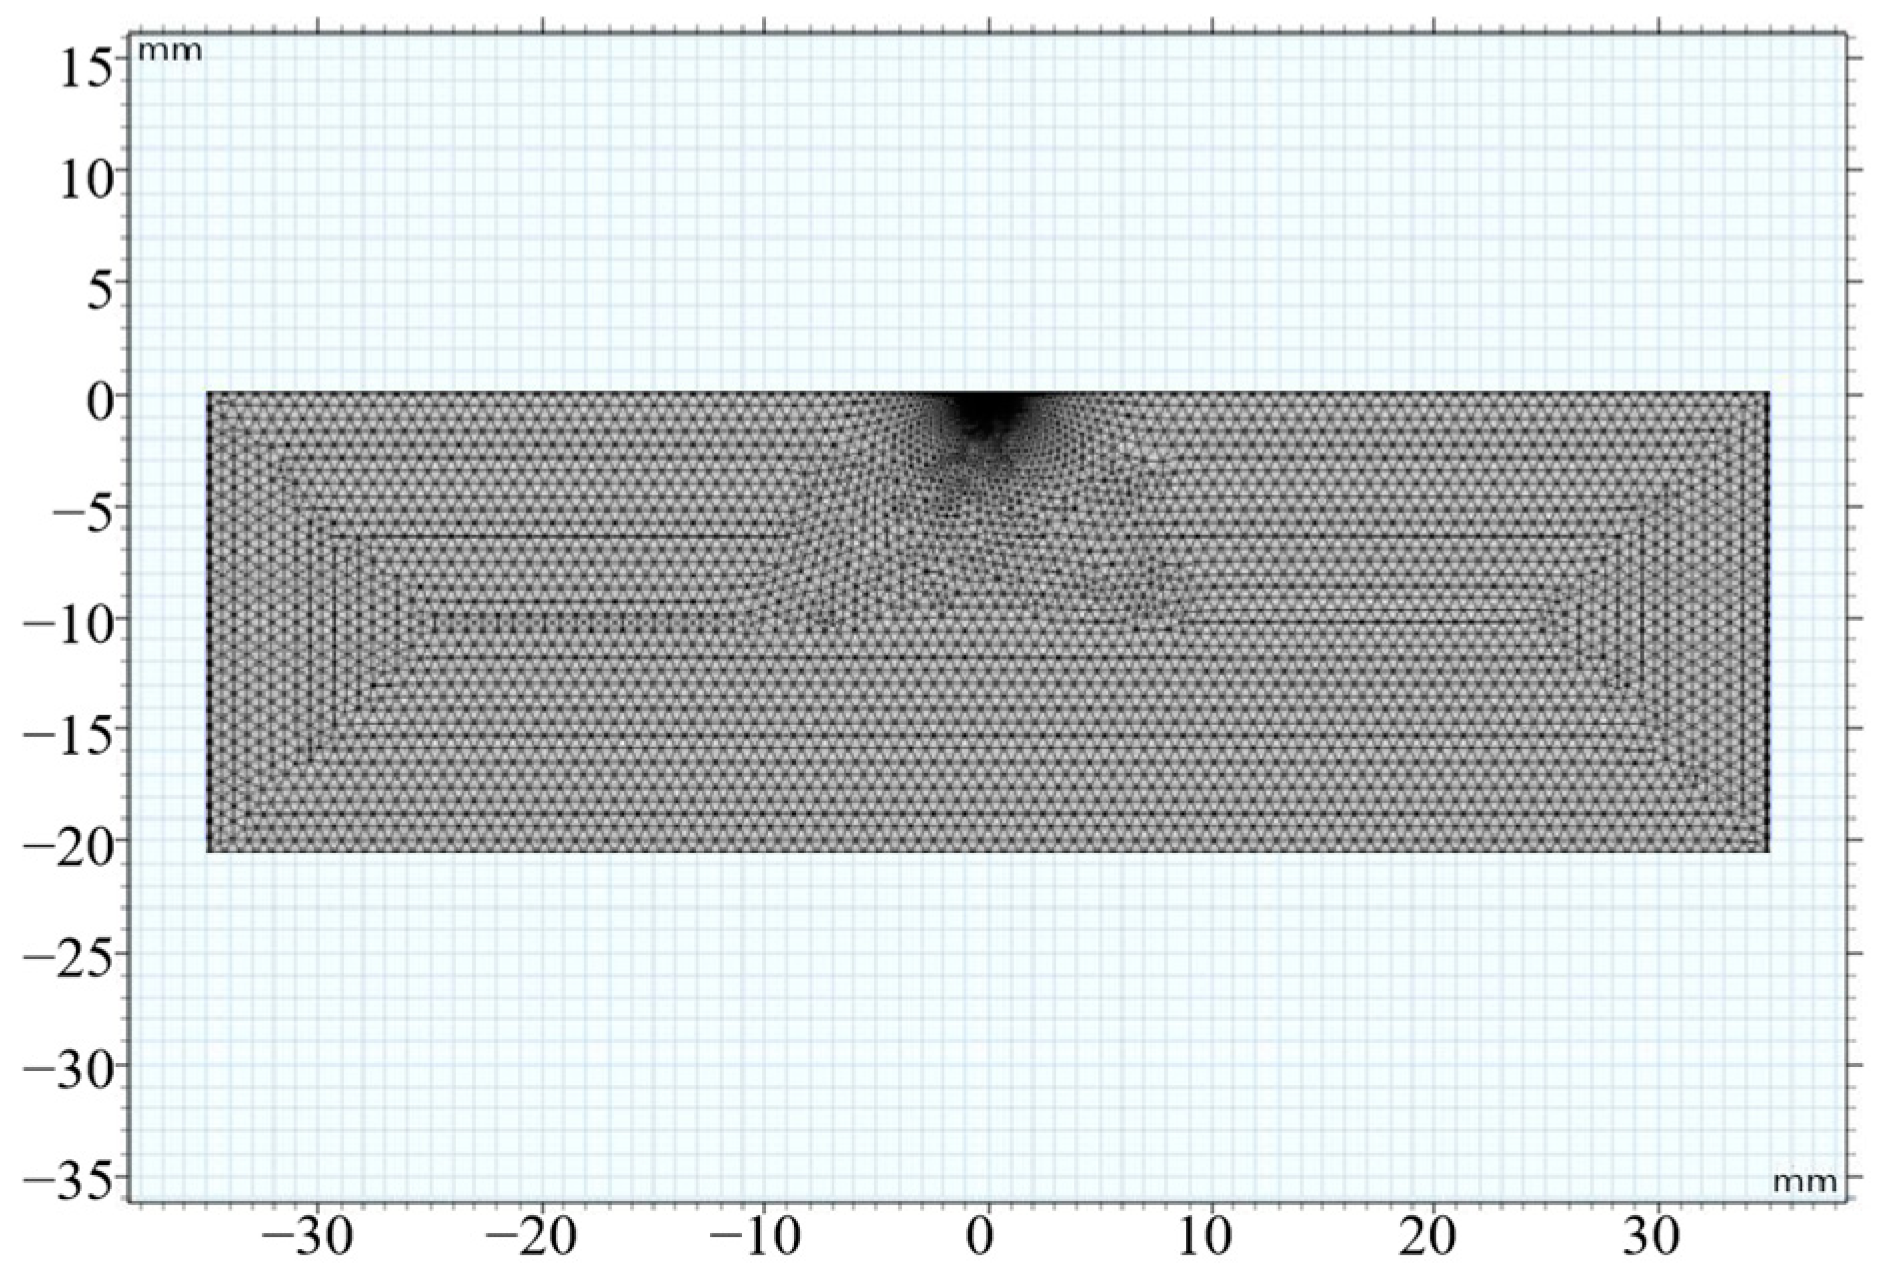
2.2.1. Mesh Division
2.2.2. Selection of Time Step
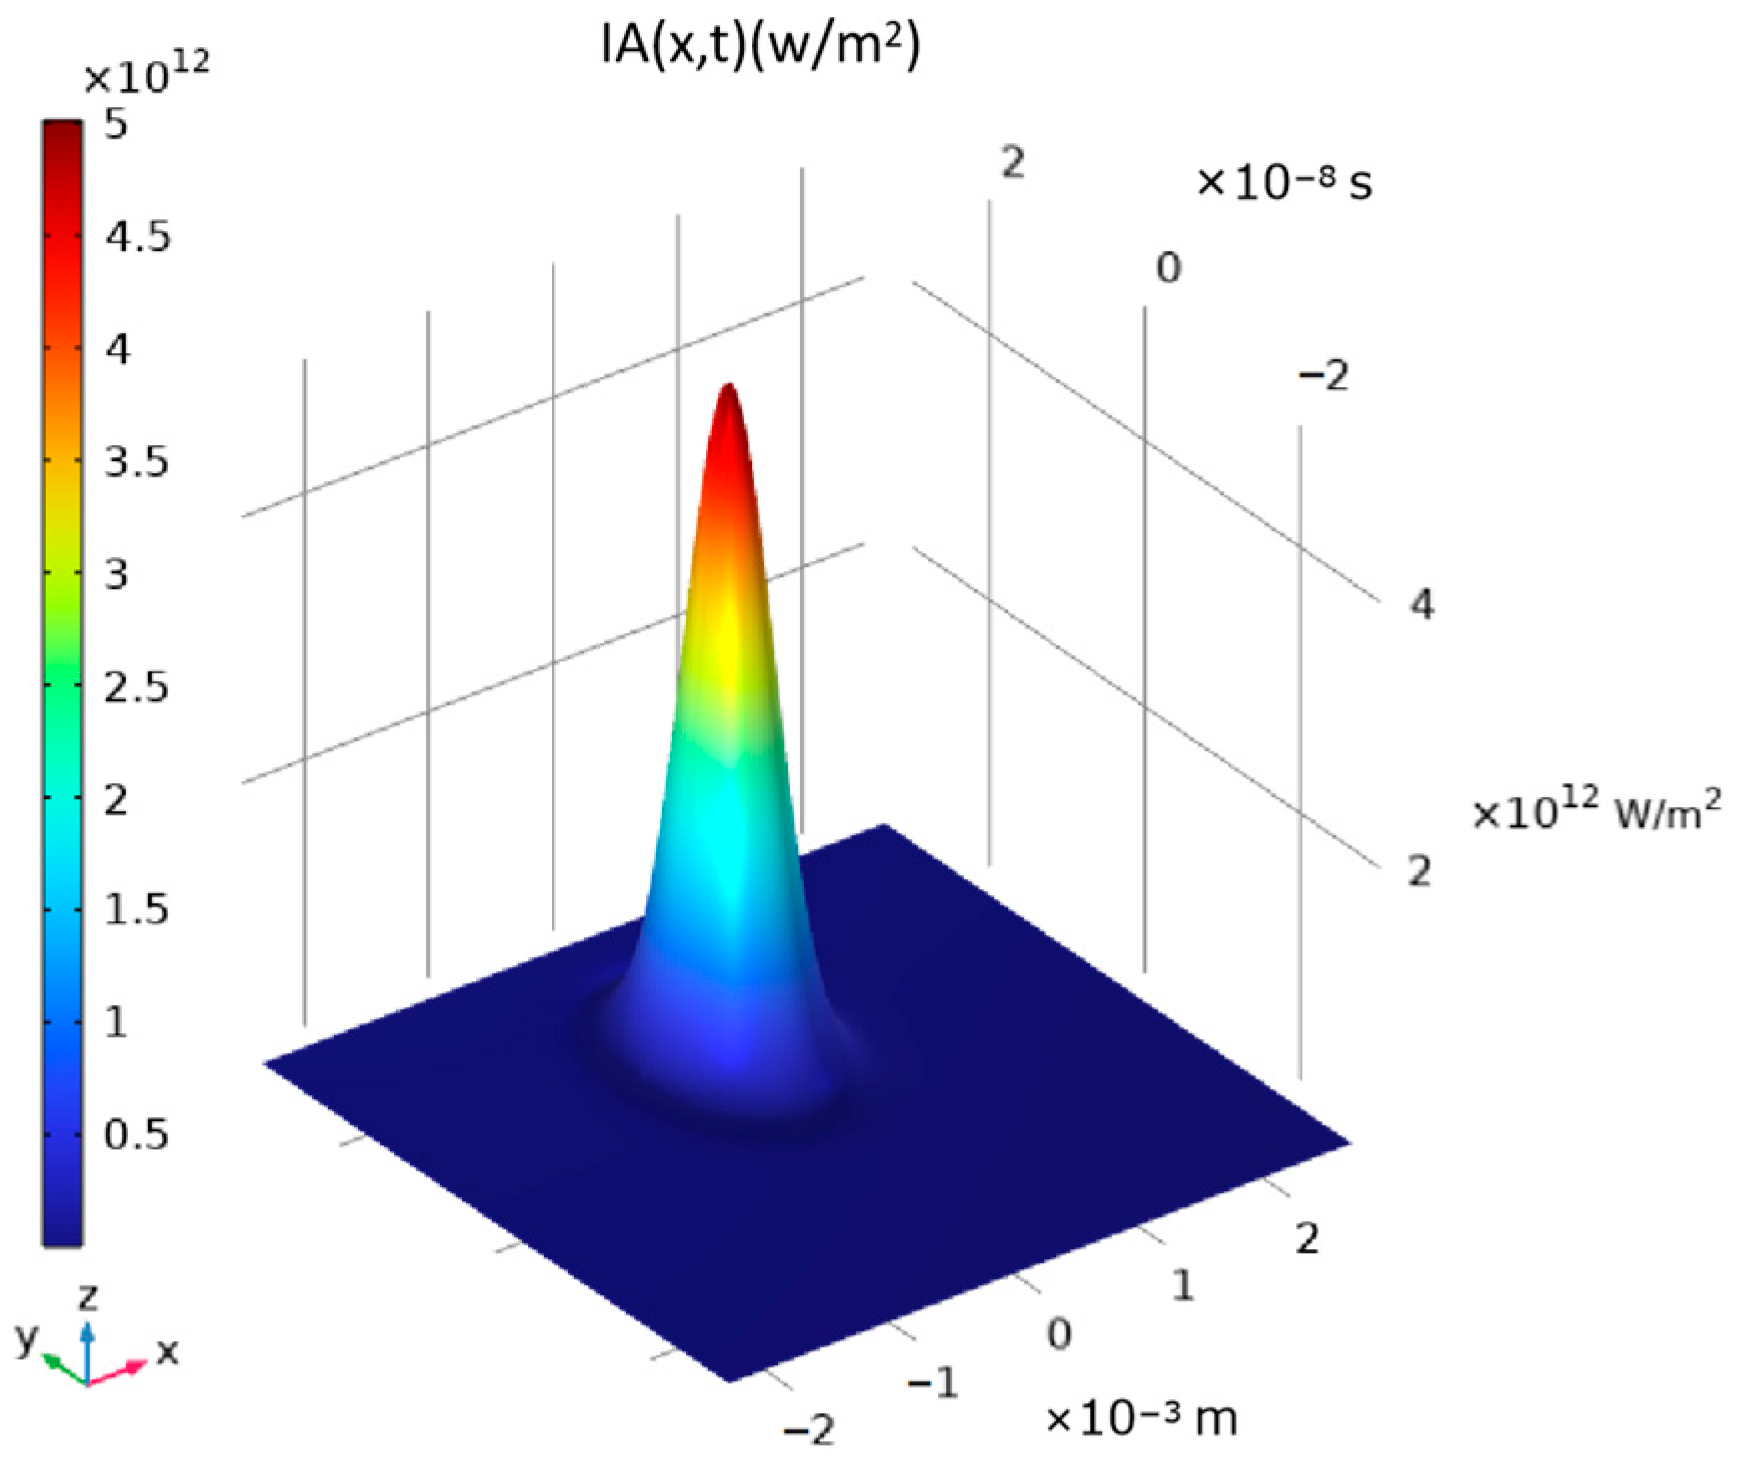
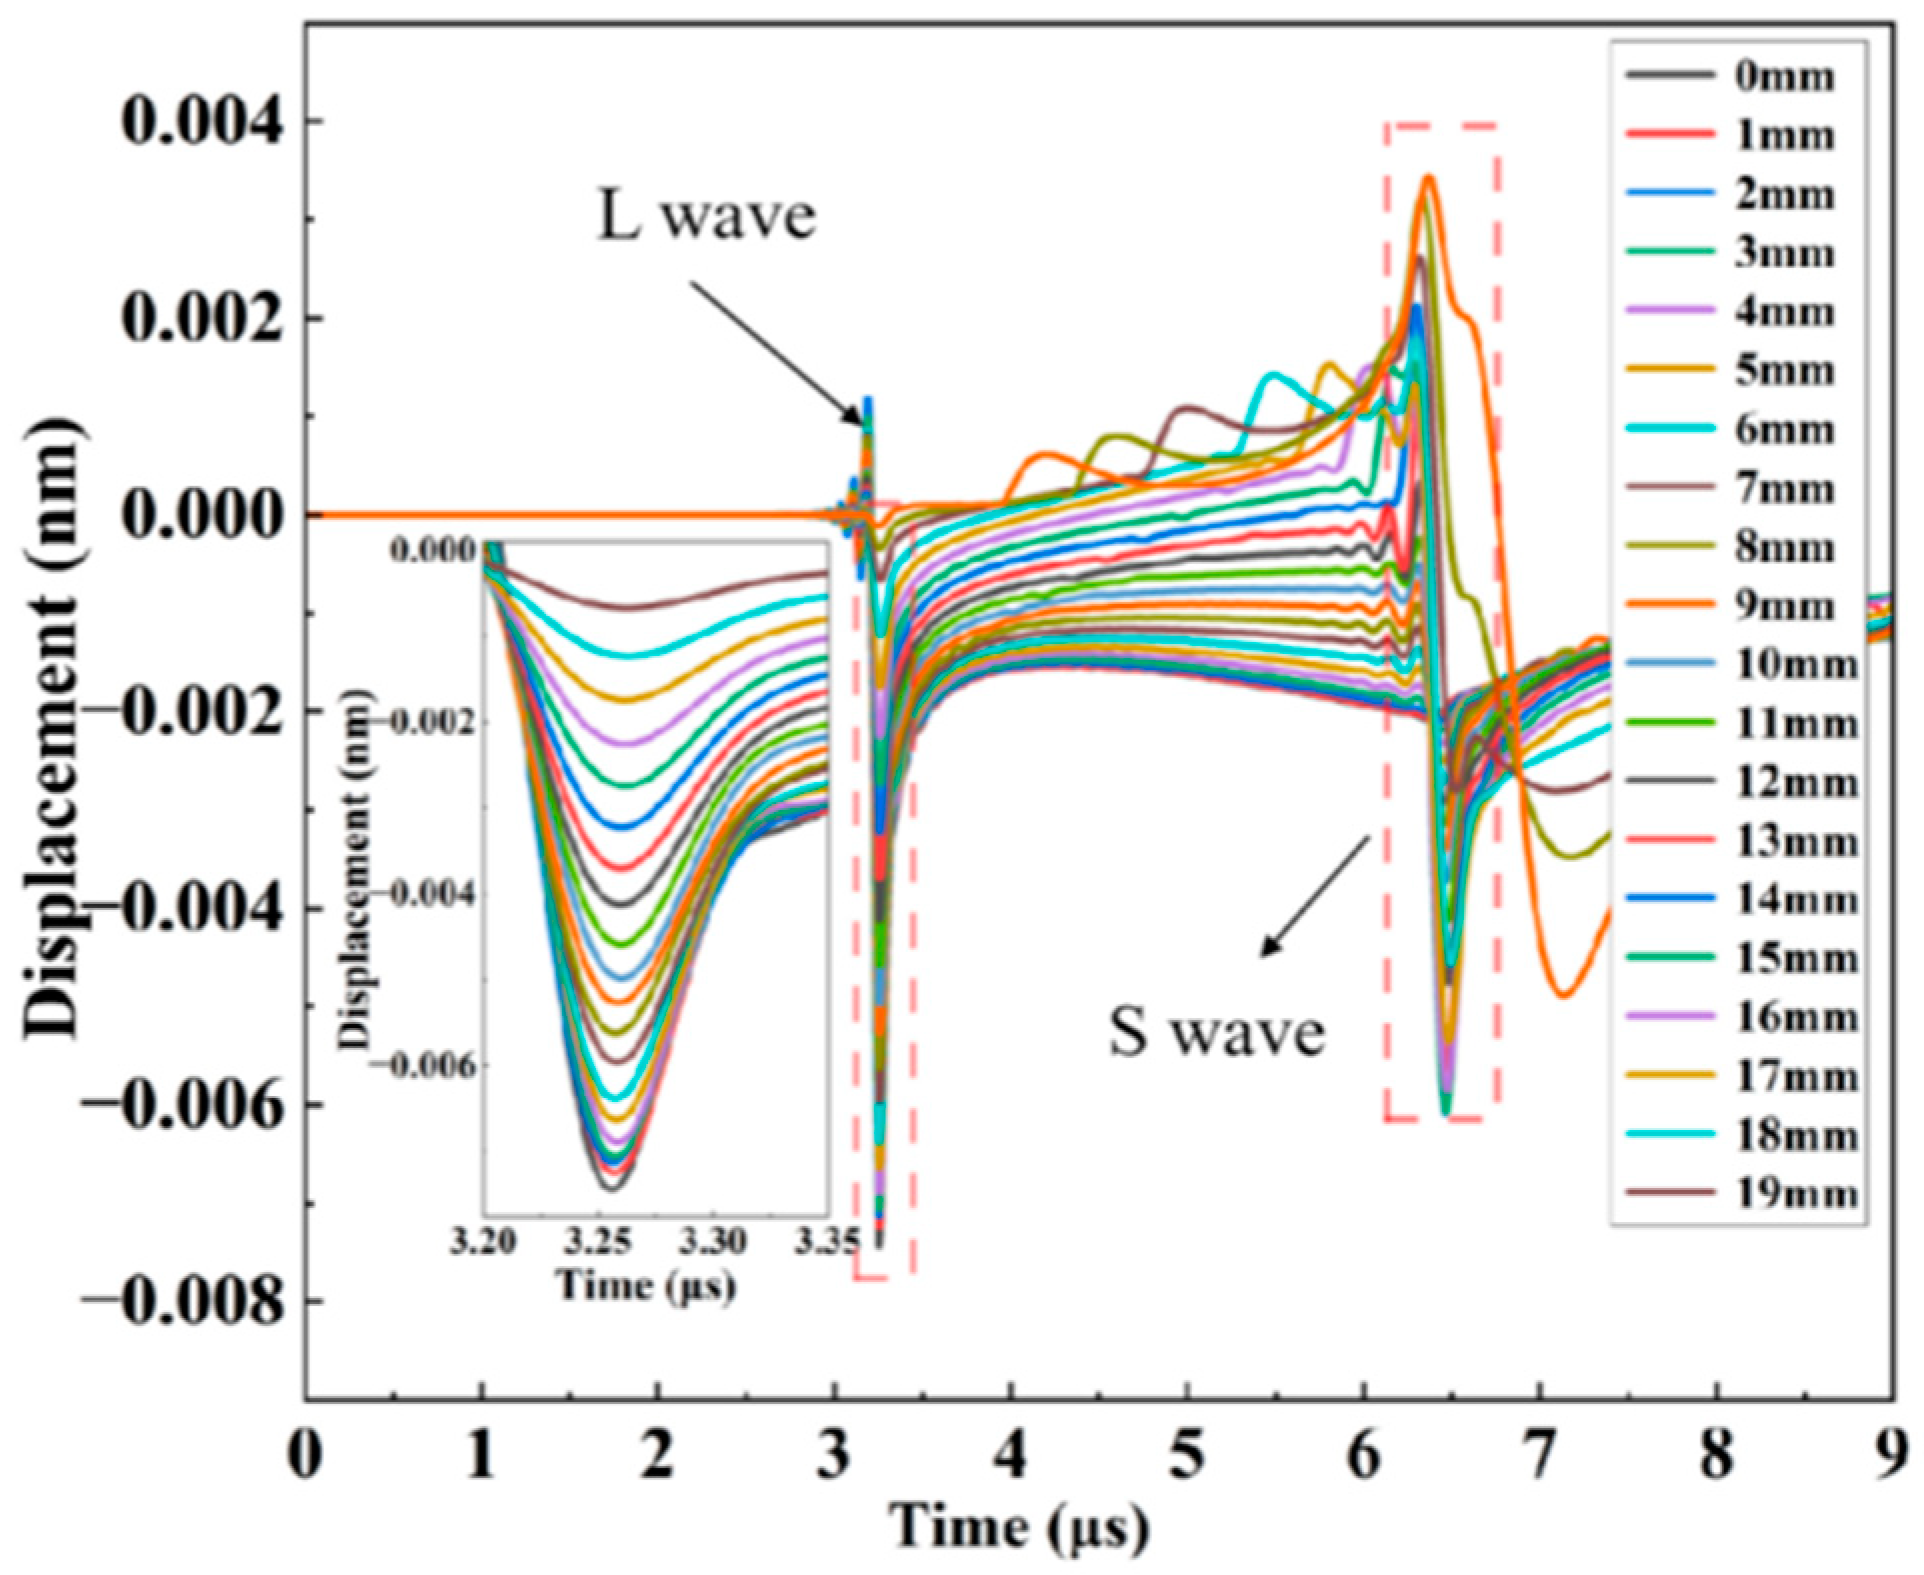
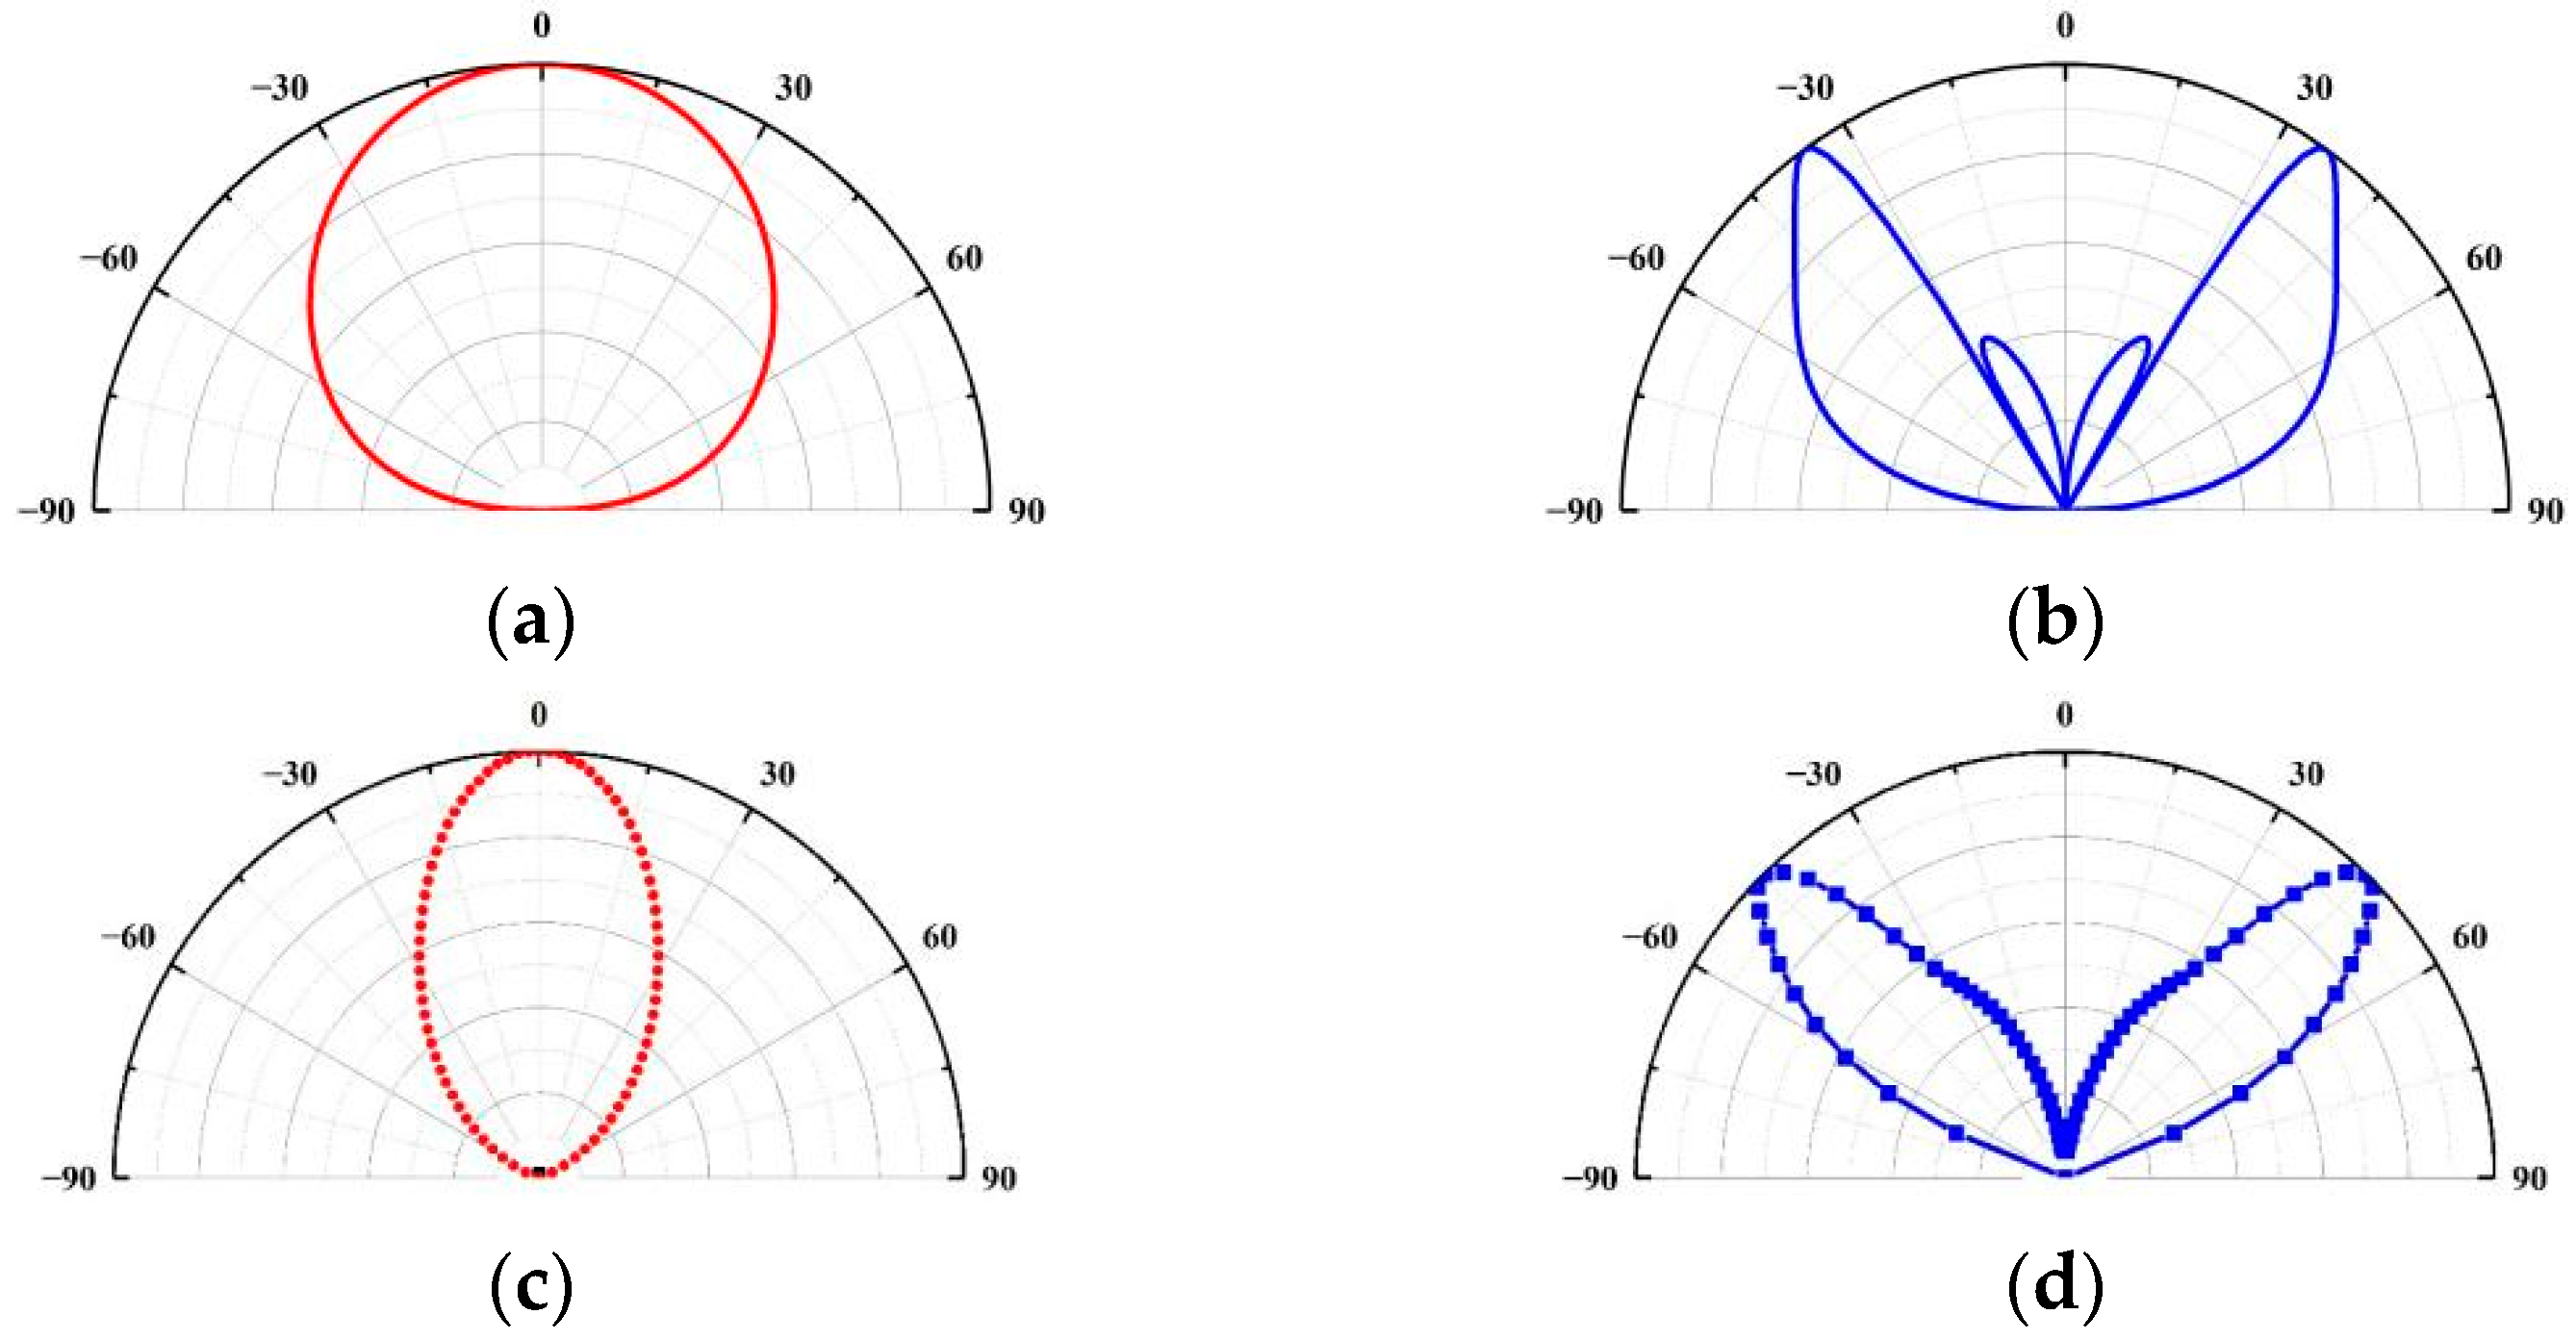
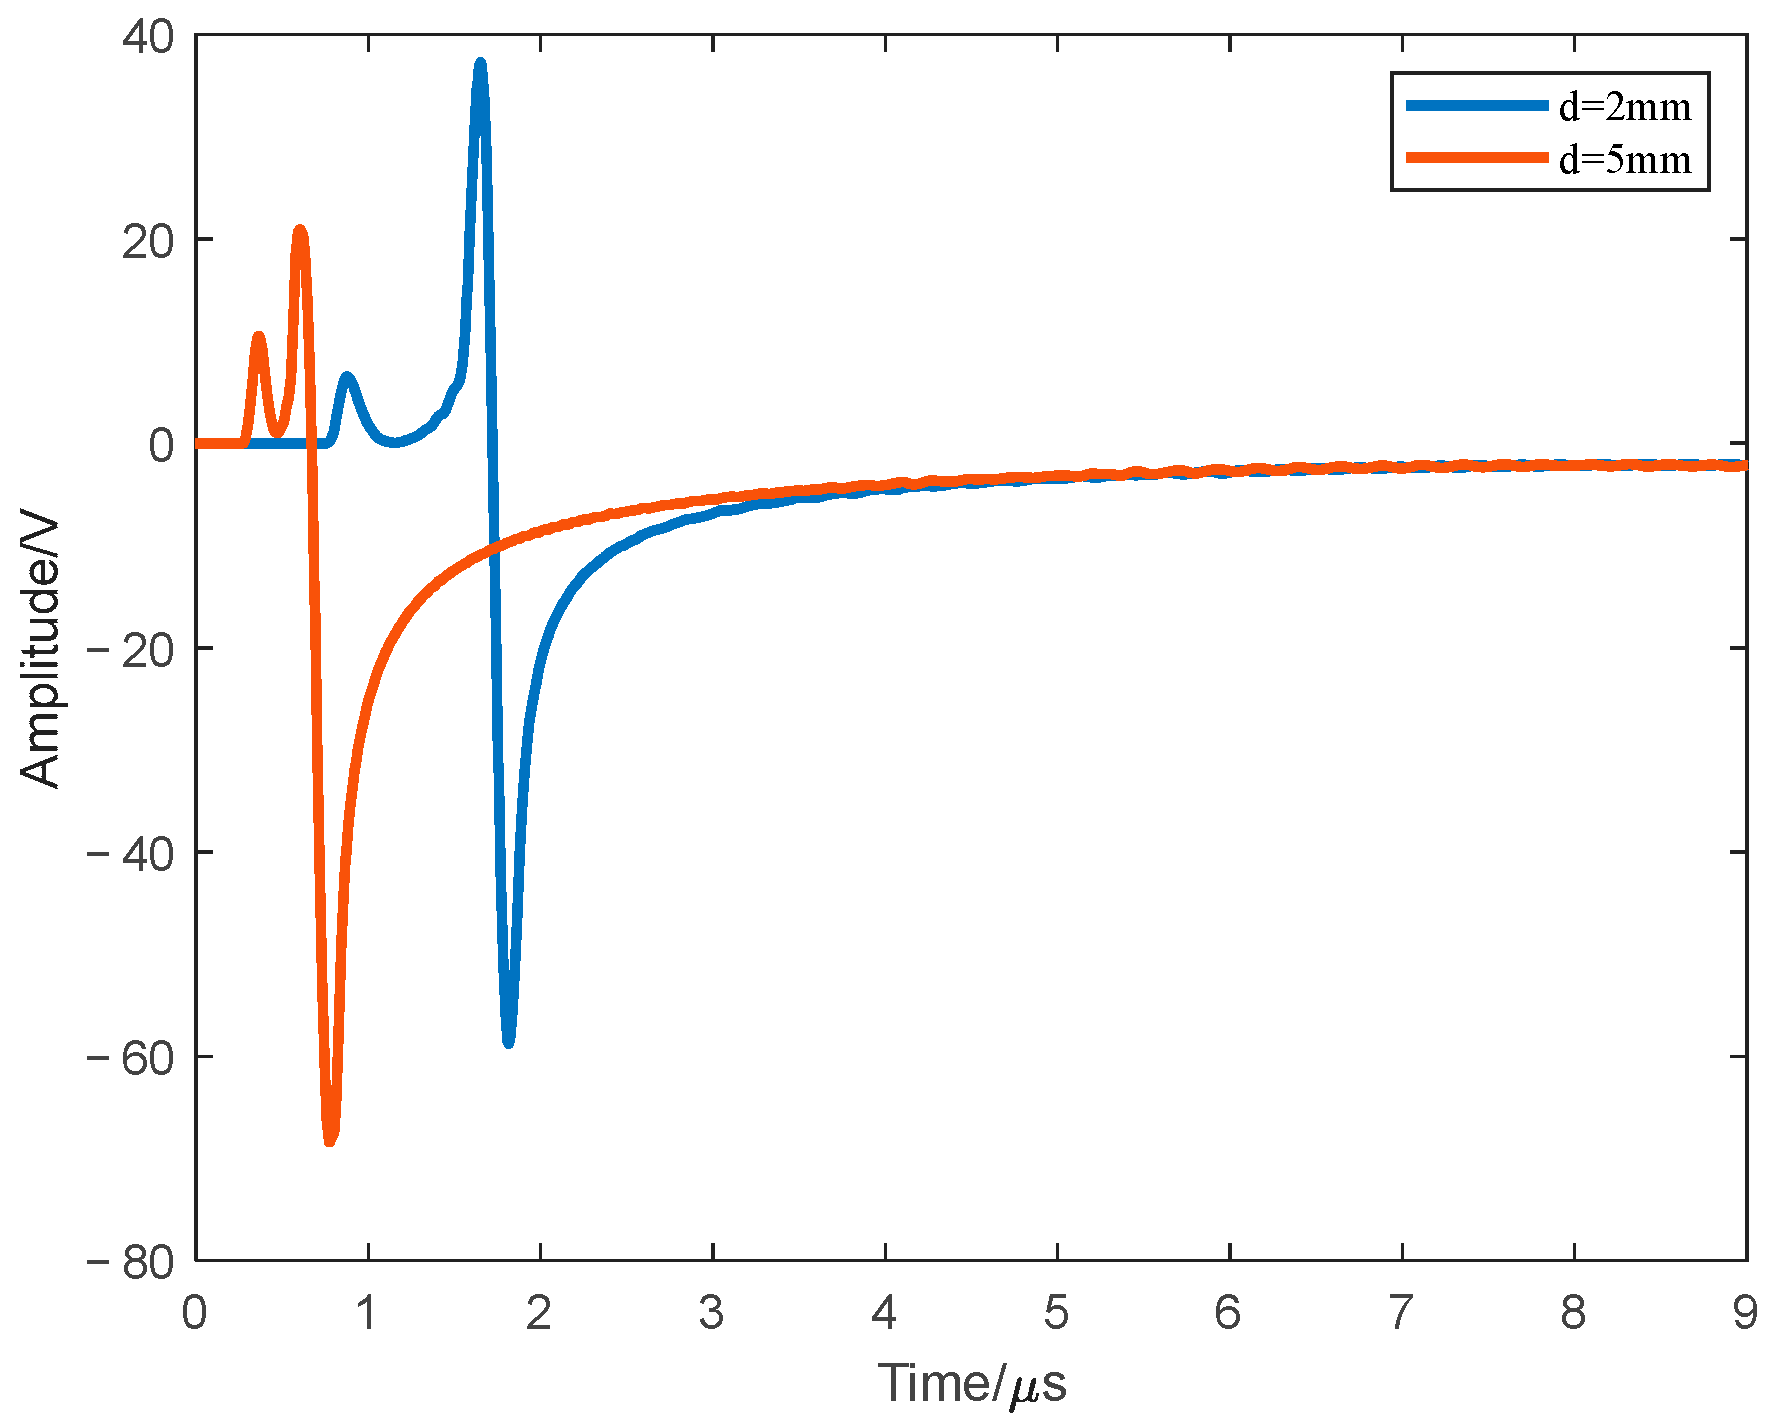
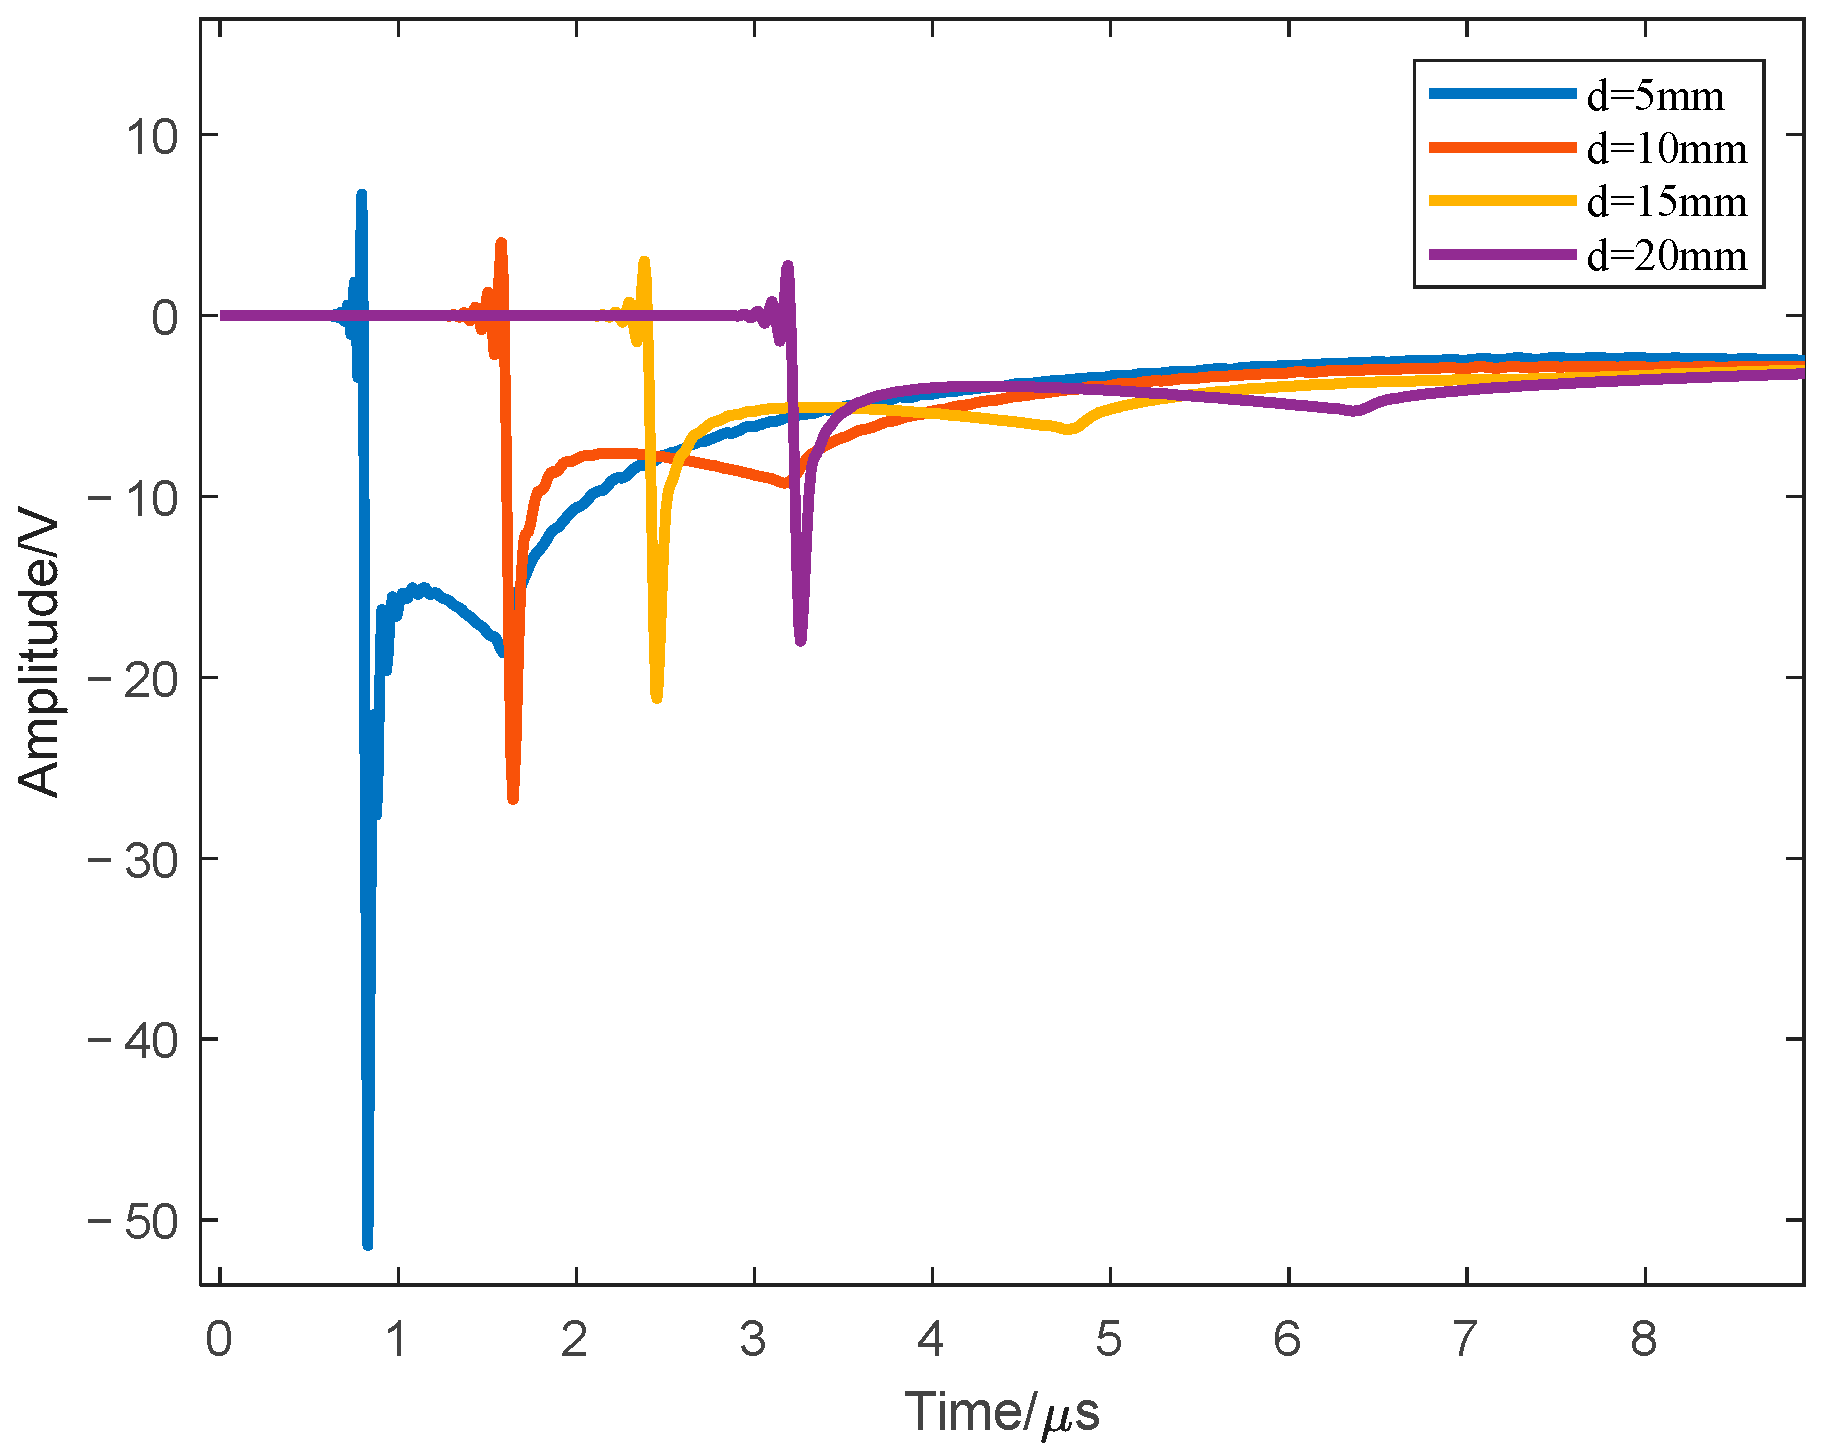
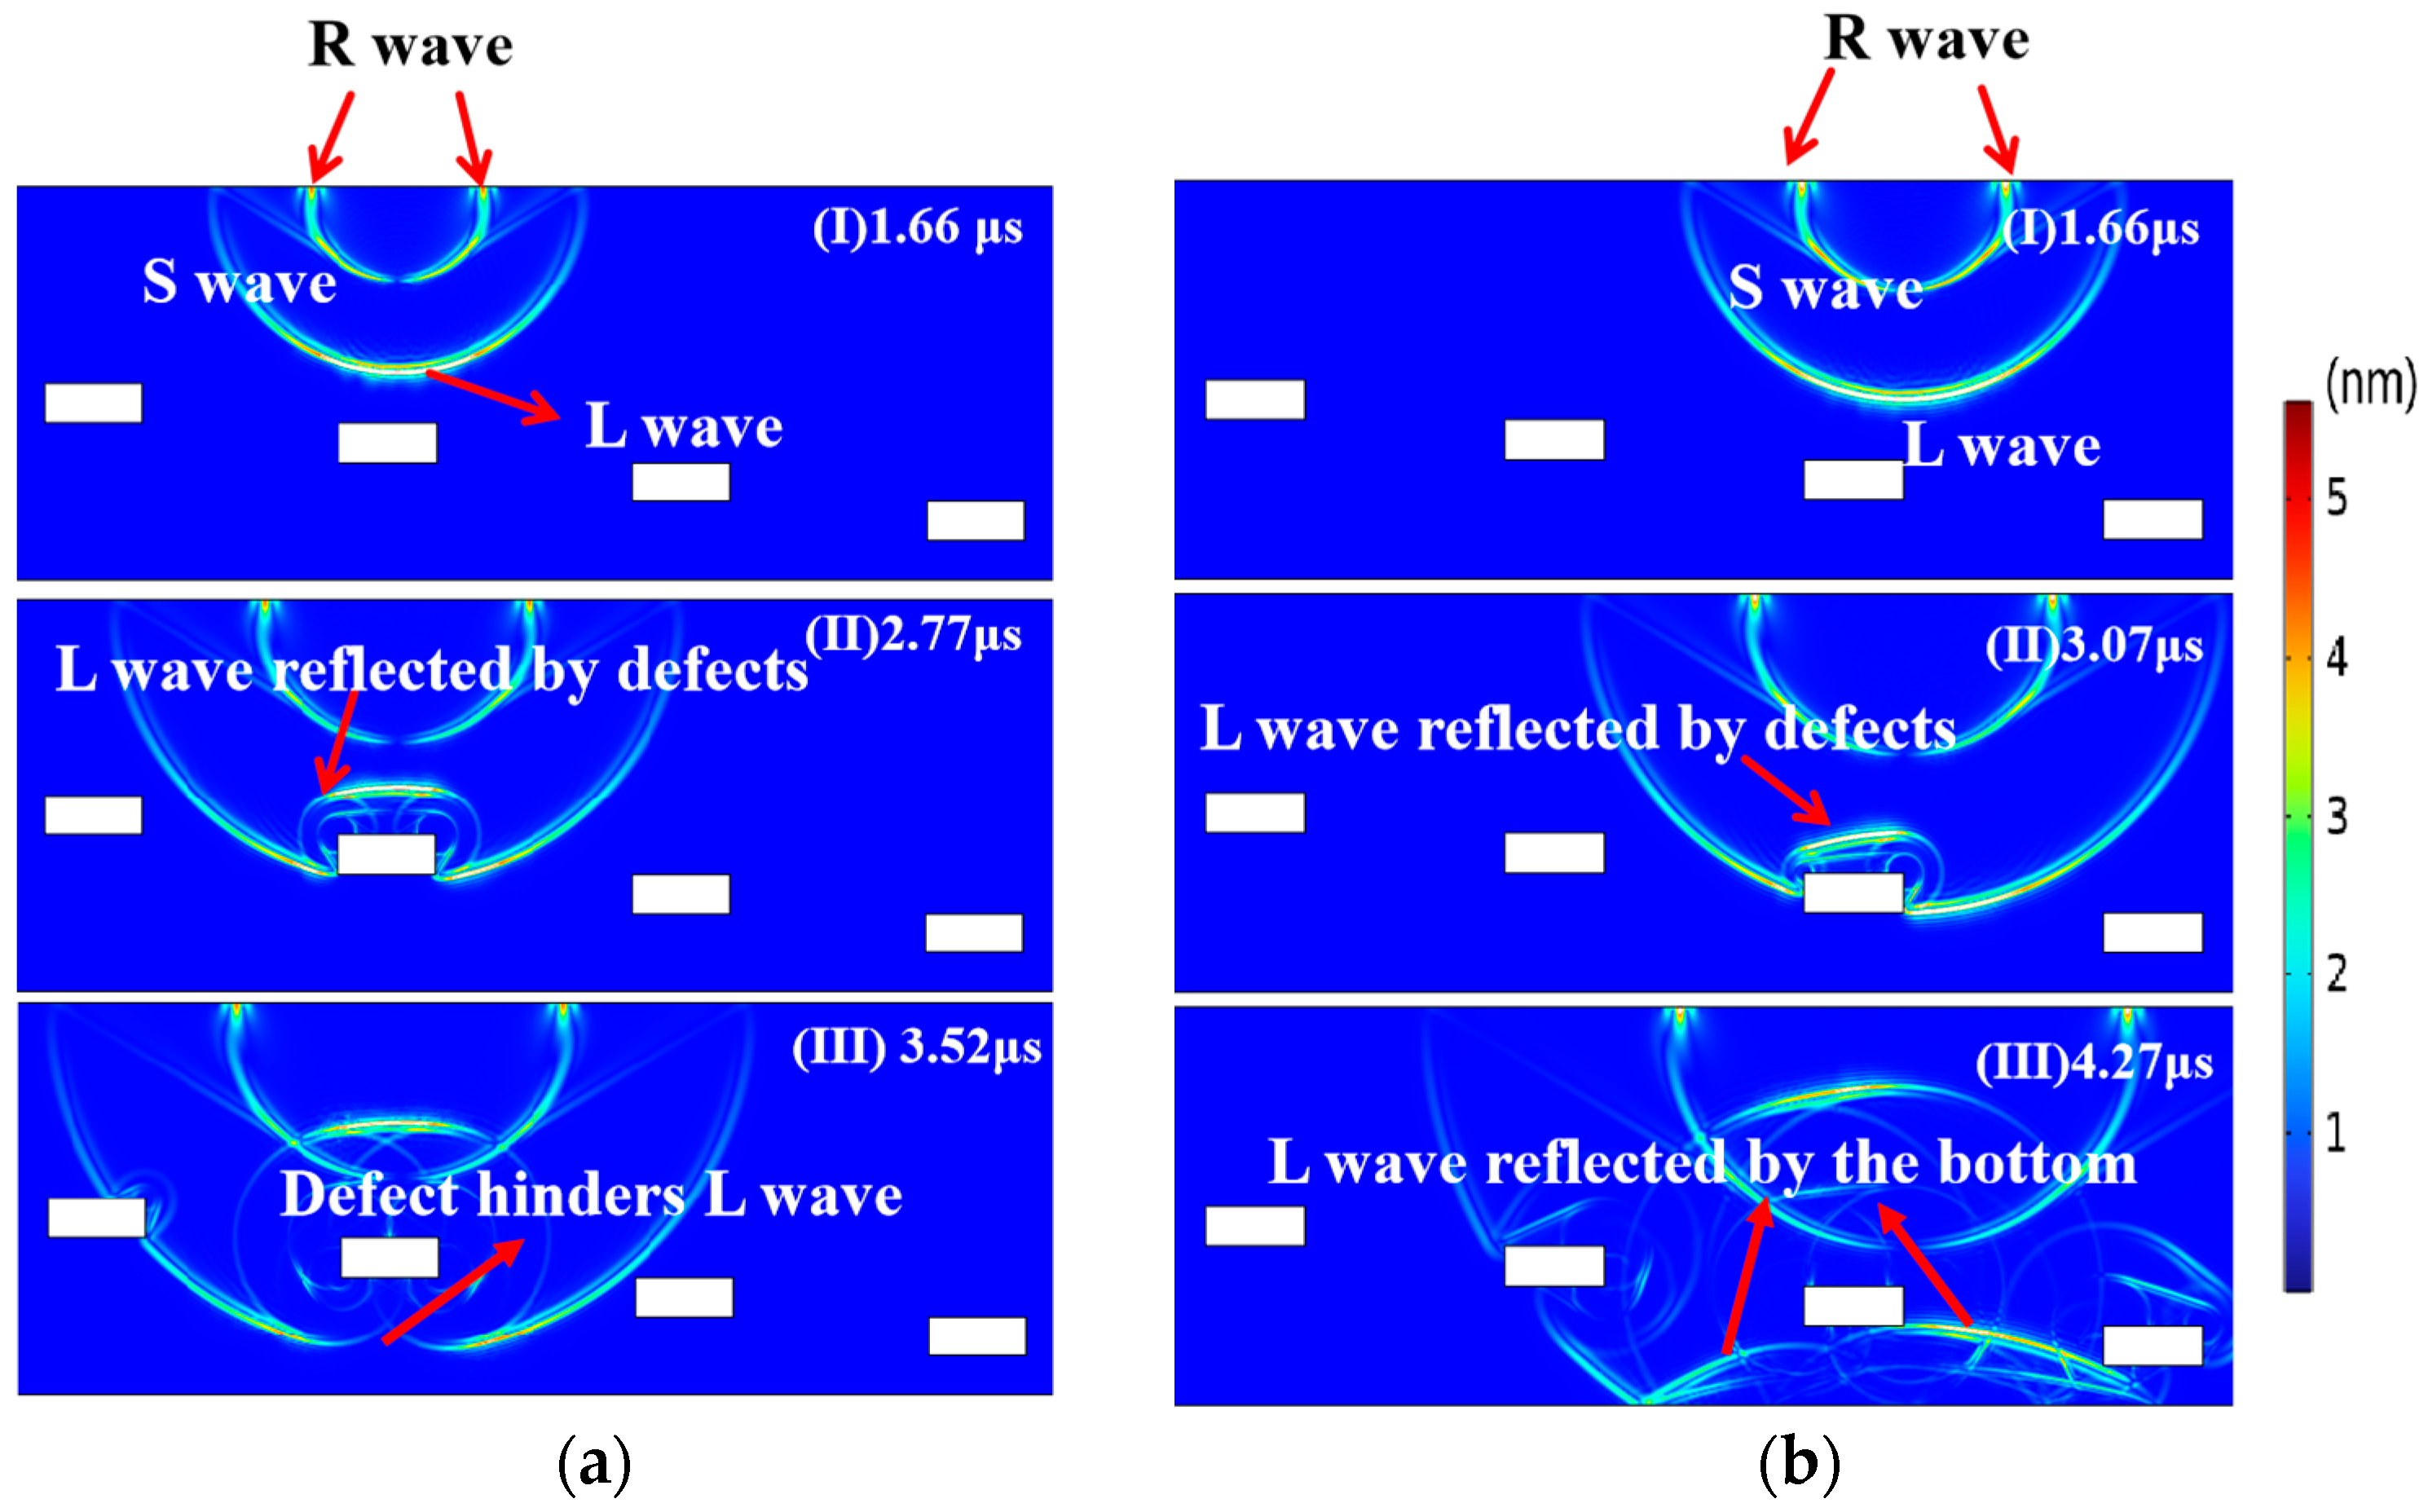
2.3. Numerical Simulation Results
3. Defect Detecting
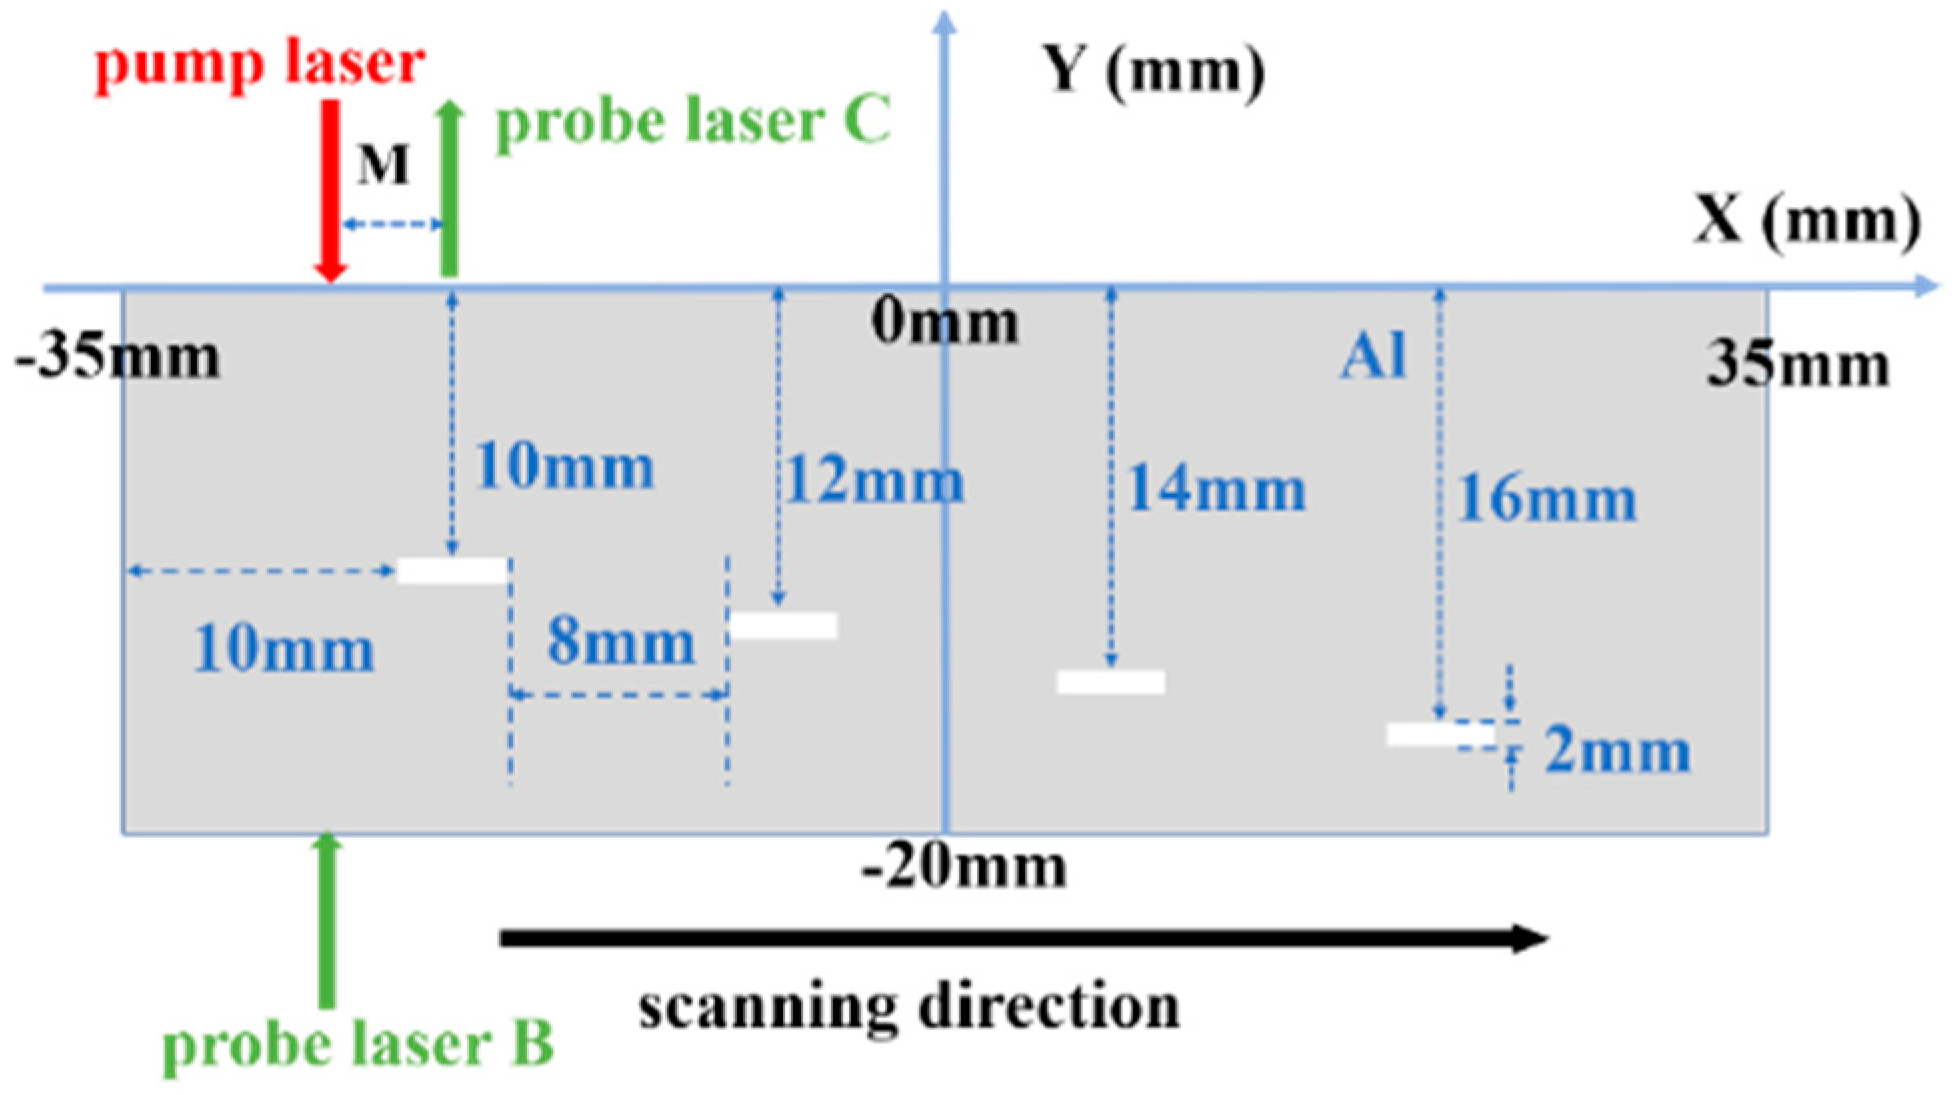
3.1. Defect Detection Model
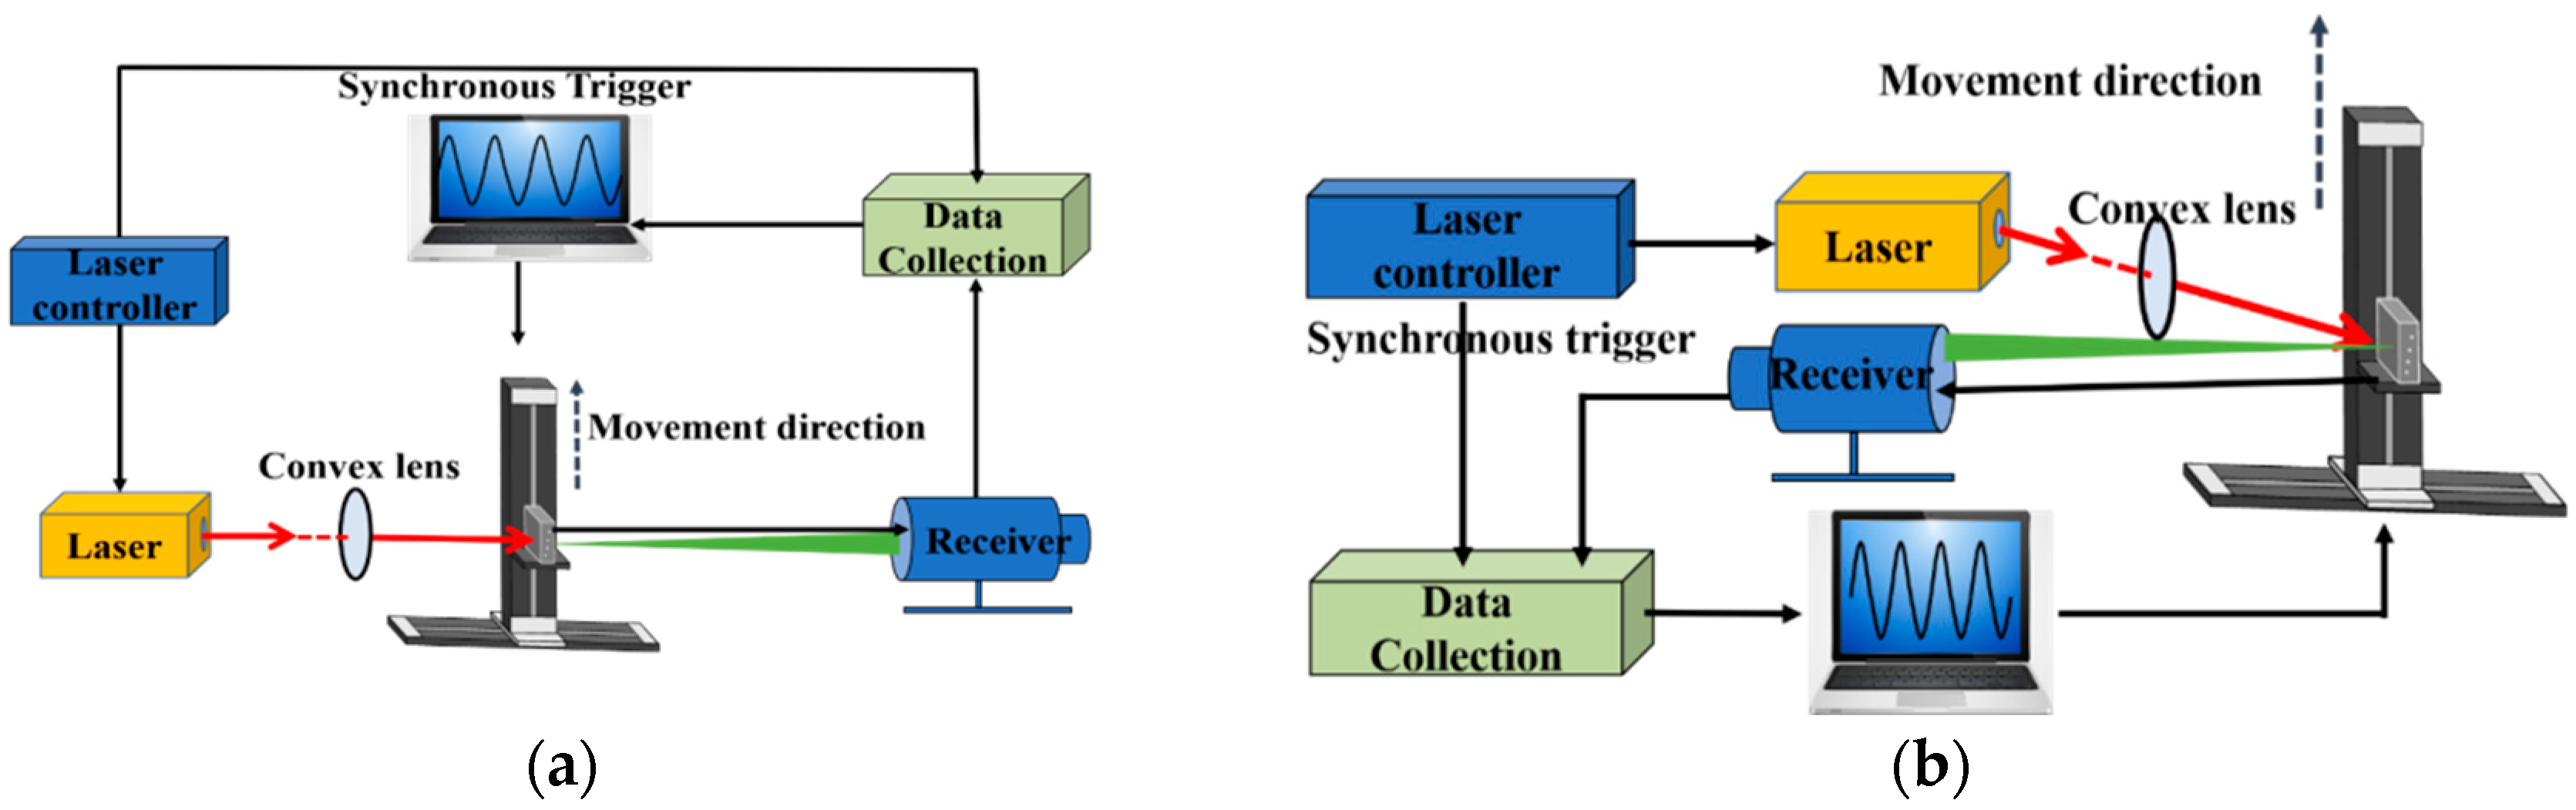
3.2. Experimental Installation
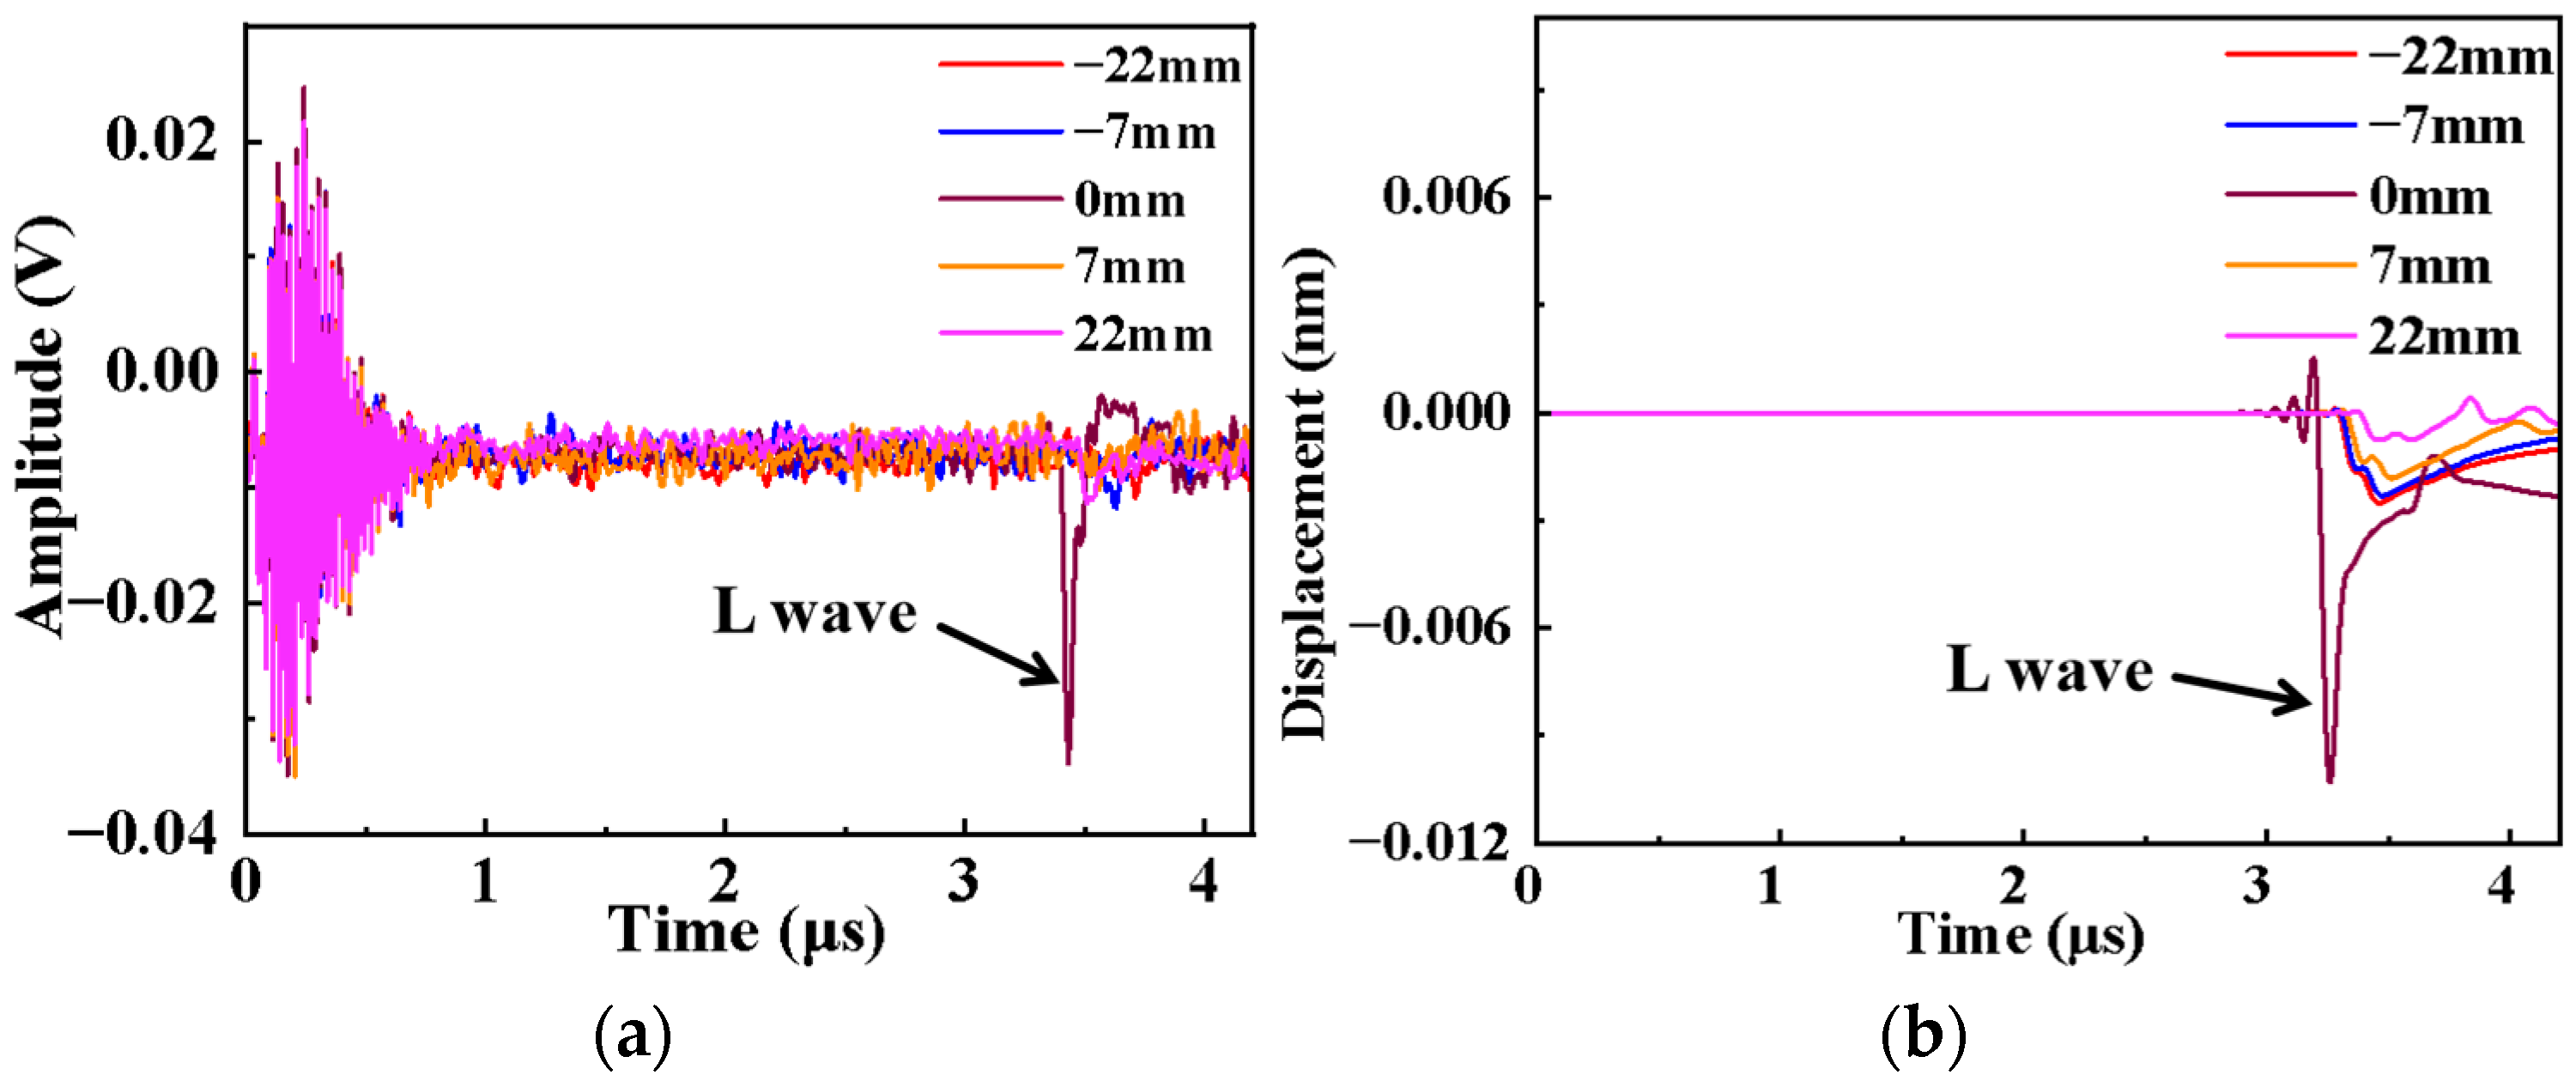
3.3. Analysis of Effect
3.4. Discussion
4. Conclusions
Author Contributions
Funding
Institutional Review Board Statement
Informed Consent Statement
Data Availability Statement
Conflicts of Interest
References
- Zhang, Q.; Liu, X.; Jiang, Y.; Zhang, B. Superamphiphobic organosilane-grafted attapulgite as an effective corrosion-resistant and anti-icing coating for aluminum alloy. Colloids Surf. A Physicochem. Eng. Asp. 2024, 696, 134405. [Google Scholar] [CrossRef]
- Vinay, M.S.; Ranganatha, S. Influence of Contact Area on Tribo Response of Al 6061 in Ambient and Vacuum Environment. J. Phys. Conf. Ser. 2021, 2070, 012164. [Google Scholar] [CrossRef]
- Sun, K.; Sun, C.; Li, J.; Wang, Z.; Gao, W.; Fan, Q. Study of Laser-Generated Longitudinal Waves Interacting with an Internal Spherical Cavity by Use of a Transmission Time Delay Method. Int. J. Thermophys. 2020, 41, 97–111. [Google Scholar] [CrossRef]
- Dai, L.N.; Ni, C.Y.; Ying, K.N.; Yuan, L.; Kan, W.W.; Shen, Z.H. Defect imaging based on laser ultrasonic frequency domain synthetic aperture focusing technology with separated generation–detection and 2-D equivalent velocity mapping. Opt. Laser Technol. 2022, 156, 108485. [Google Scholar] [CrossRef]
- Tariq, O.M.; Mohammed, M.S.; Aljohani, M.S. Optimizing radiographic sensitivity in the in-service testing of pipes. Russ. J. Nondestruct. Test. 2020, 56, 92–99. [Google Scholar] [CrossRef]
- Mohammad, T.S.; Taheri, A.; Movafeghi, A.; Rokrok, B. Mathematical behavior of optical density of γ-ray radiography images of steel pipes. Russ. J. Nondestruct. Test. 2019, 55, 967–974. [Google Scholar] [CrossRef]
- Yang, Y.; Li, L.; Cai, X.; Kang, Y.H. Influence of magnetic suspension quality and measurement and control device in fluorescent magnetic particle testing. J. Harbin Eng. Univ. 2021, 42, 574–580. [Google Scholar]
- Xiang, W.; Shi, J.; Liu, G.; Xu, F. Application of improved Alex Net model in fluorescent magnetic particle testing. Manuf. Autom. 2020, 42, 40–45. [Google Scholar]
- Xu, Z.H.; Zhao, J.R.; Shi, M.Z. Study on the application of penetration testing in the periodic inspection of industrial pipelines. Boil. Manuf. 2024, 3, 62–64. [Google Scholar]
- Dong, W.H.; Qin, F.Q.; Zhu, D.Y. Application of permeation testing on in-service austenitic stainless steel pressure vessels. China Mach. 2024, 13, 27–30. [Google Scholar]
- Sun, H.; Shi, Y.B.; Zhang, W.; Li, Y.; Yu, C.; Li, M.; Li, X. A study on ferromagnetic casing wall thinning evaluation based on pulsed eddy current testing. IEEE Trans. Instrum. Meas. 2021, 70, 1–11. [Google Scholar] [CrossRef]
- Chen, X.L.; Li, J.W.; Wang, Z.H. Inversion Method in Pulsed Eddy Current Testing for Wall Thickness of Ferromagnetic Pipes. IEEE Trans. Instrum. Meas. 2020, 69, 9766–9773. [Google Scholar] [CrossRef]
- Ghavamian, A.; Mustapha, F.; Baharudin, B.H.T.; Yidris, N. Detection, localisation and assessment of defects in pipes using guided wave techniques: A Review. Sensors 2018, 18, 4470. [Google Scholar] [CrossRef]
- Nagy, P.B.; Simonetti, F.; Instanes, G. Corrosion and erosion monitoring in plates and pipes using constant group velocity Lamb wave inspection. Ultrasonics 2014, 54, 1832–1841. [Google Scholar] [CrossRef]
- Pelivanov, I.; Ambroziński, Ł.; Khomenko, A.; Koricho, E.G.; Cloud, G.L.; Haq, M.; O’Donnell, M. High resolution imaging of impacted CFRP composites with a fiber-optic laser-ultrasound scanner. Photoacoustics 2016, 4, 55–64. [Google Scholar] [CrossRef] [PubMed]
- Tetsuo, F.; Takash, O. Surface Flaw Detection of Rotating Bodies Using Laser Ultrasound. IEEJ Trans. Electron. Inf. Syst. 2010, 130, 1095–1101. [Google Scholar]
- Satoshi, O.; Taketo, M.; Kazufumi, N.; Imura, F.; Kita, R.; Asai, S. In-situ measurement of weld quality during MAG welding using laser ultrasonic. Weld. Int. 2019, 33, 450–459. [Google Scholar]
- Truong, C.T.; Lee, J. Thickness reconstruction of nuclear power plant pipes with flow-accelerated corrosion damage using laser ultrasonic wavenumber imaging. Struct. Health Monit. 2018, 17, 255–265. [Google Scholar] [CrossRef]
- Tan, H.; Chen, Y.X.; Jin, Y. Research on real-time laser ultrasonic monitoring method of the curing state of butyl hydroxyl liner. J. Opt. 2022, 42, 175–185. [Google Scholar]
- Zhang, Y.; Wang, X.; Yang, Q.; Xue, R.; Zhang, J.; Sun, Y.; Krishnaswamy, S. Research on epoxy resin curing monitoring using laser ultrasonic. Measurement 2020, 158, 107737. [Google Scholar] [CrossRef]
- Quintero, R.; Simonetti, F.; Howard, P.; Friedl, J.; Sellinger, A. Noncontact laser ultrasonic inspection of Cramic Matrix Composites (CMCs). NDT E Int. 2017, 88, 8–16. [Google Scholar] [CrossRef]
- An, Y.-K. Impact-Induced Delamination Detection of Composites Based on Laser Ultrasonic Zero-Lag Cross-Correlation Imaging. Adv. Mater. Sci. Eng. 2016, 2016, 6474852. [Google Scholar] [CrossRef]
- Zhou, Z.G.; Sun, G.K.; Li, Z.; Zhang, Y. Application of laser ultrasonic inspection technology in composite material inspection. J. Harbin Inst. Technol. 2012, 17, 119–122. [Google Scholar]
- Sun, G.; Zhou, Z. Application of laser ultrasonic technique for non-contact detection of drilling-induced delamination in aeronautical composite components. Optik 2014, 125, 3608–3611. [Google Scholar] [CrossRef]
- Chinchilla, C.S.; Croxford, J.A.; Wilcox, D.P. Optimising laser-induced phased-arrays for defect detection in continuous inspections. NDT E Int. 2024, 144, 103091. [Google Scholar] [CrossRef]
- Xing, K.; Pei, C.X.; Chen, Z.M. Fully noncontact inspection of closed surface crack with nonlinear laser ultrasonic testing method. Ultrasonics 2021, 114, 106426. [Google Scholar]
- Xu, Z.; Tian, Q.; Hu, P.; Li, H.; Shen, S. Laser ultrasonic detection of submillimeter artificial holes in laser powder bed fusion manufactured alloys. Opt. Laser Technol. 2024, 169, 110030. [Google Scholar] [CrossRef]
- Pei, C.; Yi, D.; Liu, T.; Kou, X.; Chen, Z. Fully noncontact measurement of inner cracks in thick specimen with fiber-phased-array laser ultrasonic technique. NDT E Int. 2020, 113, 102273. [Google Scholar] [CrossRef]
- Guo, X.; Chen, Y.; Gao, X.; Wang, J.; Xun, Y.; Li, Y. Efficiency enhancement and application of laser ultrasonic longitudinal wave based on glass constraint. Appl. Opt. 2023, 62, 9334–9342. [Google Scholar] [CrossRef]
- Tanaka, T.; Izawa, Y. Nondestructive detection of small internal defects in carbon steel by laser ultrasonics. Jpn. J. Appl. Phys. 2001, 40, 1477–1481. [Google Scholar] [CrossRef]
- Choi, S.; Jhang, K. Internal defect detection using laser-generated longitudinal waves in ablation regime. J. Mech. Sci. Technol. 2018, 32, 4191–4200. [Google Scholar] [CrossRef]
- Gao, T.F.; Wang, Y.S.; Qing, X.L. A New Laser Ultrasonic Inspection Method for the Detection of Multiple Delamination Defects. Materials 2021, 14, 2424. [Google Scholar] [CrossRef] [PubMed]
- Seo, H.; Kim, J.; Yoon, S.; Jhang, K.Y. Determination of laser beam intensity to maximize amplitude of ultrasound generated in ablation regime via monitoring plasma-induced air-borne sound. Int. J. Precis. Eng. Manuf. 2015, 16, 2641–2645. [Google Scholar] [CrossRef]
- Monchalin, J.P.; Aussel, J.D.; Heon, R.; Bussiere, J.F.; Bouchard, P.; Guèvremont, J.; Padioleau, C. Laser-ultrasonic developments towards industrial applications. In Proceedings of the IEEE 1988 Ultrasonics Symposium Proceedings, Chicago, IL, USA, 2–5 October 1988; pp. 1041–1044. [Google Scholar]
- Telschow, K.L.; Walter, J.B.; Garcia, G.V. Laser ultrasonic monitoring of ceramic sintering. J. Appl. Phys. 1990, 68, 6077–6082. [Google Scholar] [CrossRef]
- Zeng, W.; Yao, Y. Numerical simulation of laser-generated ultrasonic waves for detection surface defect on a cylinder pipe. Optik 2020, 212, 164650. [Google Scholar] [CrossRef]
- Wang, Y.; Han, S.; Yu, Y.; Qi, X.; Zhang, Y.; Lian, Y.; Lv, Z. Numerical simulation of metal defect detection based on laser ultrasound. IEEE Photonics J. 2021, 13, 1–9. [Google Scholar] [CrossRef]
- Han, S.; Lian, Y.; Xie, L.; Hu, Q.; Ding, J.; Wang, Y.; Lu, Z. Numerical simulation of angled surface crack detection based on laser ultrasound. Front. Phys. 2022, 10, 982232. [Google Scholar] [CrossRef]
- Ready, J.F. Effects of High Power Laser Radiation; Academic Press: New York, NY, USA, 1971. [Google Scholar]
- Drain, L.E. Laser Ultrasonics Techniques and Applications, 1st ed.; Routledge: New York, NY, USA, 1990; p. 467. [Google Scholar]
- Zuo, O.Y.; Wu, M.P.; Tang, Y.H. Numerical simulation study of laser ultrasonic crack detection based on COMSOL. Laser Infrared 2020, 50, 1164–1171. [Google Scholar]
- Chai, H.Q.; Chen, Y.X.; Wang, Z.B.; Guo, X.; Wang, J.; Zhao, X. Directivity study of laser ultrasonic sound field based on transmission method. J. Photonics 2023, 52, 63–73. [Google Scholar]
- Zhang, S.Y.; Paul, M.; Fassbender, S.; Schleichert, U.; Arnold, W. Experimental study of laser-generated shear waves using interferometry. Res. Nondestruct. Eval. 1990, 2, 143–155. [Google Scholar] [CrossRef]


| Parameter | Numerical Value |
|---|---|
| Constant pressure heat capacity (J/kg·K) | 900 |
| Latent heat of vaporization (kJ/kg) | 10,778 |
| Density (kg/m3) | 2700 |
| Evaporating point (K) | 2790 |
| Thermal conductivity (W/(m·K)) | 238 |
| Young’s modulus (Pa) | 70 × 109 |
| Poisson’s ratio | 0.33 |
| Receive Location | Longitudinal Wave Arrival Time | Transverse Wave Arrival Time | Longitudinal Wave Error Rate | Transverse Wave Error Rate |
|---|---|---|---|---|
| 5 mm | 0.829 | 1.592 | 0.66% | 0.189% |
| 10 mm | 1.641 | 3.164 | 0.77% | 0.45% |
| 15 mm | 2.454 | 4.773 | 0.58% | 0.48% |
| 20 mm | 3.256 | 6.367 | 0.29% | 0.64% |
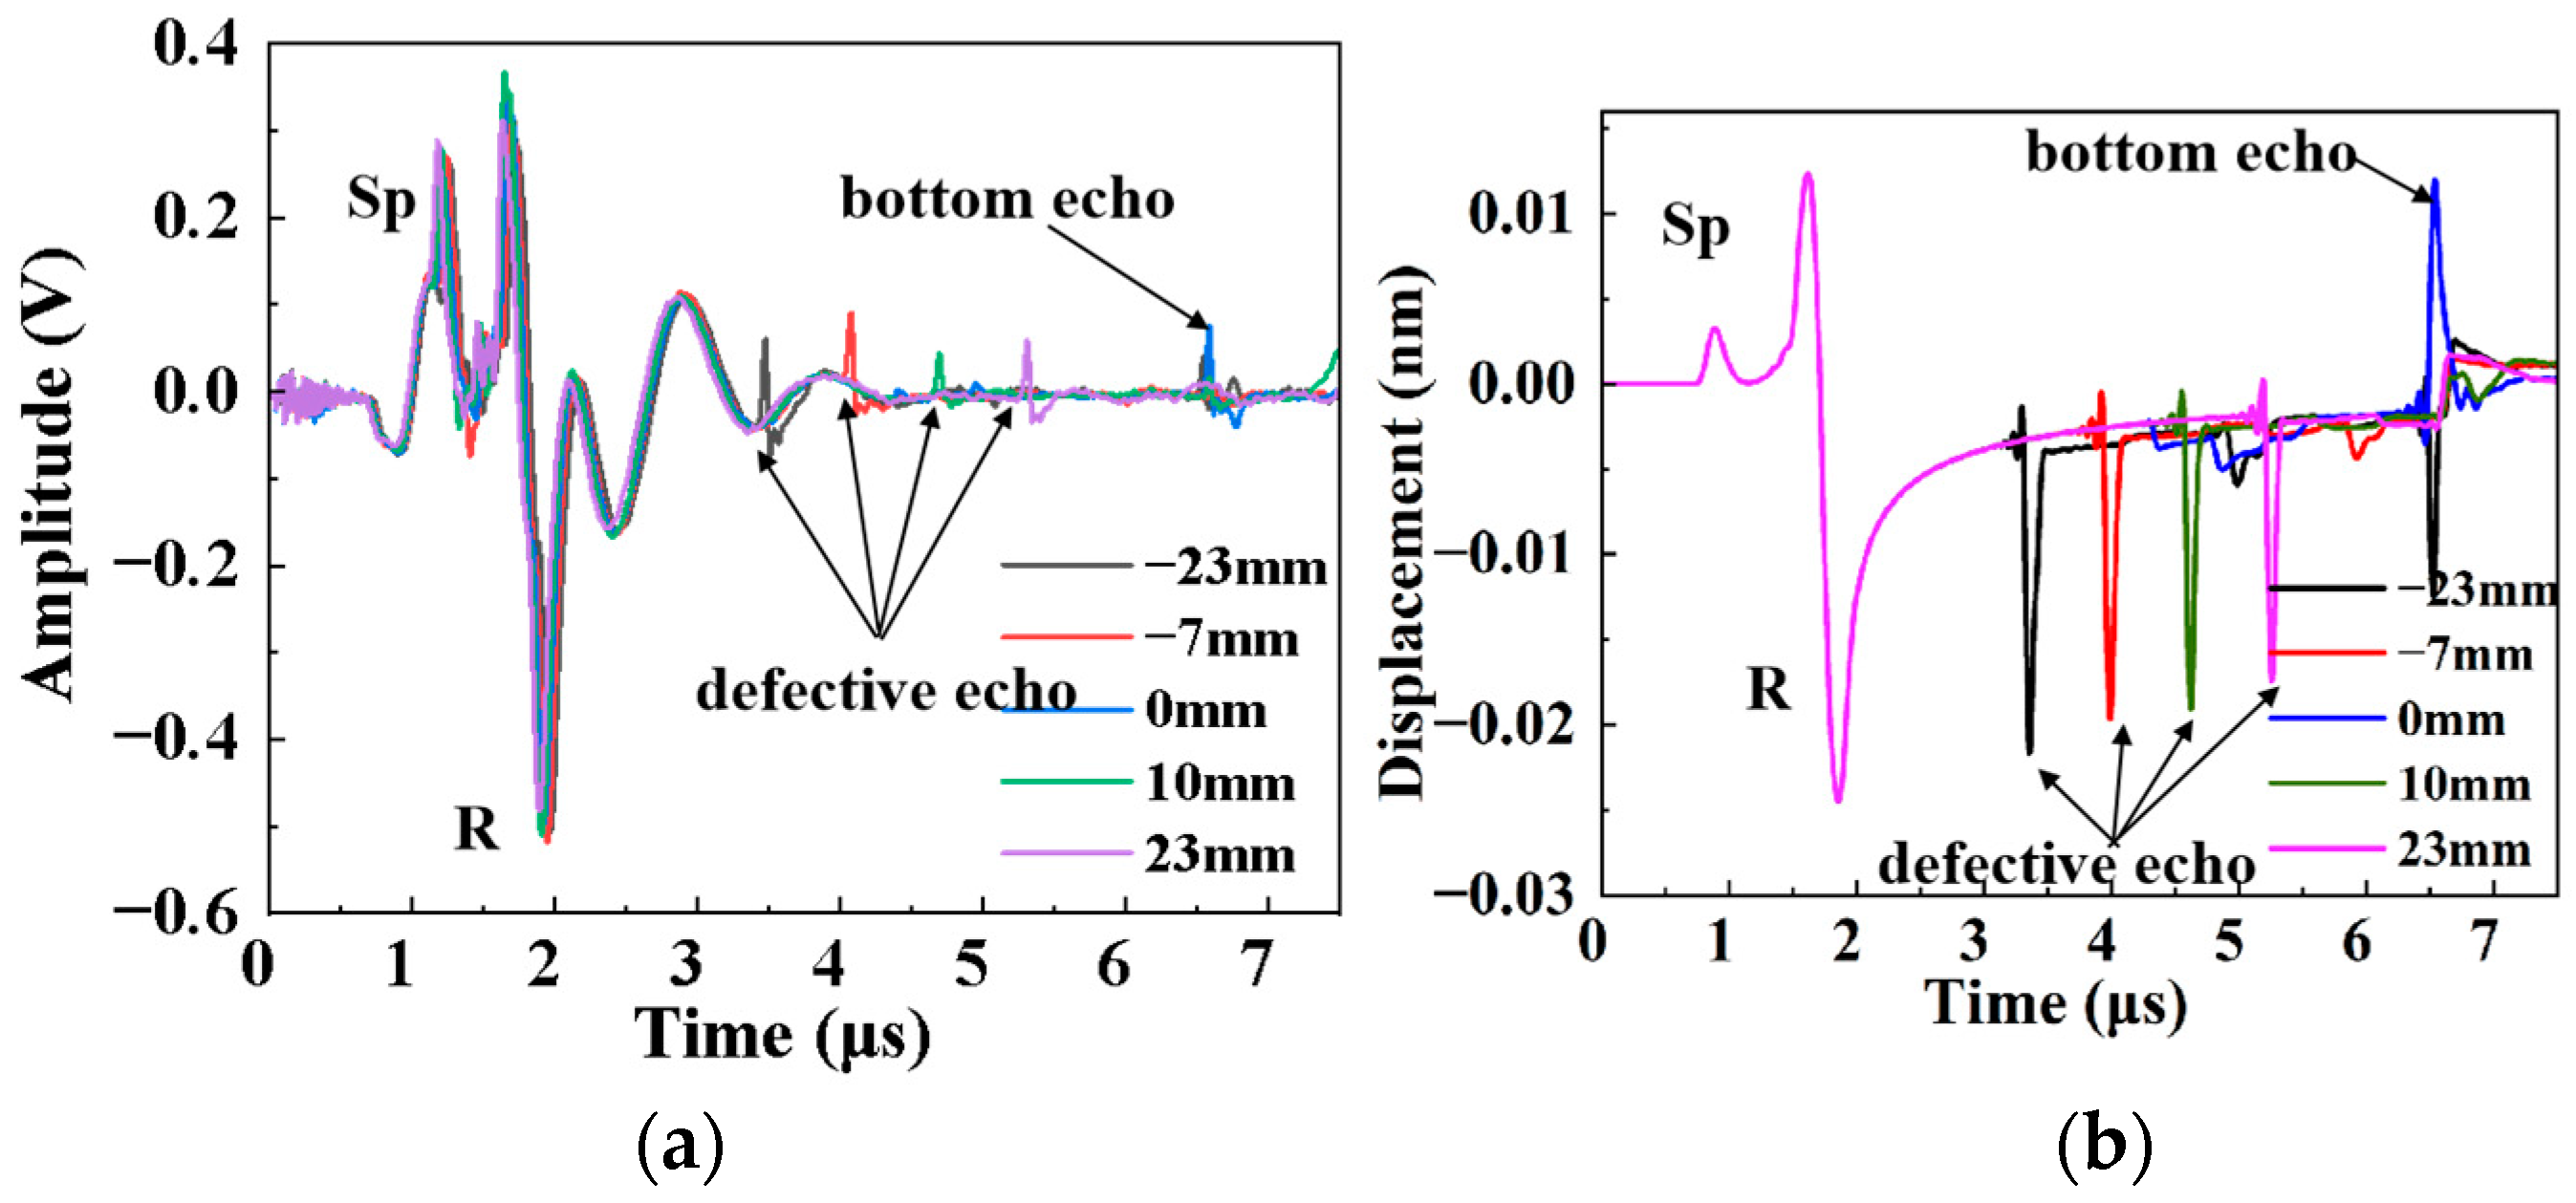
| Defect Depth | Defective Echo Arrival Time (μs) | Actual Arrival Time of Defective Echo (μs) | Measured Defect Depth (Mm) | Error/% |
|---|---|---|---|---|
| 10 mm | 3.23 | 10.010 | 0.10 | 3.23 |
| 12 mm | 3.90 | 12.086 | 0.72 | 3.90 |
| 14 mm | 4.63 | 14.348 | 2.48 | 4.63 |
| 16 mm | 5.28 | 16.363 | 2.26 | 5.28 |
Disclaimer/Publisher’s Note: The statements, opinions and data contained in all publications are solely those of the individual author(s) and contributor(s) and not of MDPI and/or the editor(s). MDPI and/or the editor(s) disclaim responsibility for any injury to people or property resulting from any ideas, methods, instructions or products referred to in the content. |
© 2024 by the authors. Licensee MDPI, Basel, Switzerland. This article is an open access article distributed under the terms and conditions of the Creative Commons Attribution (CC BY) license (https://creativecommons.org/licenses/by/4.0/).
Share and Cite
Wang, J.; Guo, X.; Xun, Y.; Liu, J.; Guo, X.; Li, Y. Longitudinal Wave Defect Detection Technology Based on Ablation Mechanism. Photonics 2024, 11, 805. https://doi.org/10.3390/photonics11090805
Wang J, Guo X, Xun Y, Liu J, Guo X, Li Y. Longitudinal Wave Defect Detection Technology Based on Ablation Mechanism. Photonics. 2024; 11(9):805. https://doi.org/10.3390/photonics11090805
Chicago/Turabian StyleWang, Jian, Xing Guo, Yanqin Xun, Junzuo Liu, Xin Guo, and Ya Li. 2024. "Longitudinal Wave Defect Detection Technology Based on Ablation Mechanism" Photonics 11, no. 9: 805. https://doi.org/10.3390/photonics11090805