Article

A Novel Electromagnetic Wavelength Measurement Method Based on Photoacoustic Effect and Photoacoustic Response Characteristics of Nanomaterials

1
School of Electronics and Engineering, University of Electronic Science and Technology of China, Chengdu 610054, China
2
MOE Key Laboratory of Laser Life Science & Institute of Laser Life Science, College of Biophotonics, South China Normal University, Guangzhou 510631, China
*
Authors to whom correspondence should be addressed.
Photonics 2024, 11(9), 831; https://doi.org/10.3390/photonics11090831
Submission received: 28 July 2024 / Revised: 28 August 2024 / Accepted: 1 September 2024 / Published: 2 September 2024
(This article belongs to the Special Issue New Perspectives in Biomedical Optics and Optical Imaging)

Abstract

:
This study proposes a differential wavelength measurement method based on the electromagnetic-induced photoacoustic effect. The differential method involves irradiating the sample with multiple wavelengths and utilizing differences in absorption characteristics across different materials to calculate and measure the excitation light wavelengths. Compared to traditional detection methods, this approach combines the unique properties of electromagnetic-induced photoacoustic effect, offering high sensitivity and a wider detection range from microwave to light. Furthermore, the system is structurally simple and stable, suitable for non-destructive testing of various materials, including wavelength-sensitive biological tissues. The experimental results demonstrate that combined with Polymers Benzodithiophene Triazole–Quinoxaline (PBTQ) and Single-Walled Carbon Nanotubes (SWCNTs) as absorbing media, this technique provides a rapid and cost-effective means of wavelength measurement, achieving an uncertainty of approximately 2.33 nm within the range of 680–800 nm, and it can be used for wavelength/frequency measurement of various electromagnetic waves.

1. Introduction

Laser wavelength measurement holds a crucial position in modern scientific and technological domains. Accurate wavelength determination serves as the foundation for high-precision metrology, optical fiber communications, and medical diagnostics and plays a critical role in industrial manufacturing, scientific research, and environmental monitoring. Precise measurement and control of laser wavelengths significantly enhance data transmission quality, improve measurement system resolution, and ensure accuracy. Since 1960, numerous researchers have focused on laser wavelength measurement, culminating in the first comprehensive review [1] in 1977. The most widely applied methods involve phase analysis of interference fringes, such as Kowalski [2] and Mach–Zehnder [3] interferometers, and wavelength measurement interferometers utilizing scanning mirrors and fast Fourier transform algorithms [4]. These methods typically require a reference laser (reference wavelength) and often necessitate high coherence of the laser source. Another prevalent approach relies on interference fringe period analysis, primarily using Fabry–Perot and Fizeau interferometers [5,6,7,8]. Fabry–Perot interferometers can achieve relative uncertainties of up to 10−9, requiring stable optical geometries and precise determination of mirror distances, thus exhibiting high sensitivity to mechanical stability. Optical beating phenomena [9,10] offer the most accurate wavelength measurement method (achieving uncertainties of 10−11 without the need for interferometer setups). This technique involves using fast photodetectors to measure frequency differences between the test laser and a reference laser during optical beating. Optimal wavelength measurement methods depend on factors, such as required measurement accuracy, range, speed, cost, and test wavelengths, necessitating tailored strategies based on experimental conditions. Microwave frequency measurement involves electronic planar devices (e.g., filters, delay lines, and frequency-selective surfaces). In 2017, one research team [11] proposed using band-pass filters to filter RF signals and estimate frequencies based on filtered signal power levels, achieving frequency identification precision below 15 MHz within a frequency range of 2 to 4 GHz. Microwave photonics-based frequency measurement [12] has emerged, modulating RF signals into the optical domain and converting optical signals back to the electrical or digital domains for frequency computation. This technique often utilizes March–Zehnder [13] modulators to achieve multi-frequency resolutions up to 1.2 GHz. In the terahertz band, methods utilizing cutoff waveguides and detectors [14] determine the presence of terahertz signals across various frequencies but provide approximate frequency ranges rather than precise values. While Zeeman effect-based measurement methods [15] offer accurate signal frequencies, they require additional magnetic and cryogenic systems, making them complex and costly. Heterodyne [16,17] methods are widely used due to their maturity, simplicity, and reliability, ideal for diagnosing structural and operational parameters of high-power terahertz sources, like gyrotrons. For the measurement of high-power pulsed lasers, the primary method currently employed is based on deflection mirror deformation interferometry [18]. However, it is necessary to appropriately reduce the laser power to avoid damaging the equipment. Another approach involves coupling the high-power laser into a multimode fiber for transmission [19], where the power is reduced before performing spectral analysis. Although this method effectively lowers the laser power, the interference caused by different modes within the multimode fiber can degrade the wavelength resolution. Moreover, the process of reducing laser power through a multimode fiber is inherently limited and complex.
This paper proposes a differential wavelength measurement method based on the electromagnetic-induced photoacoustic effect, introducing a novel approach that meets diverse testing requirements. This method offers the advantages of a wide measurement range and high sensitivity, accommodating flexible wavelength detection. Especially at high power levels, non-contact measurement can effectively reduce the risk of equipment damage caused by direct laser irradiation. Theoretical derivations and acoustic signal processing methods are provided, and its feasibility is demonstrated through normalization and a comparison of optical–acoustic signal intensity curves for Polymers Benzodithiophene Triazole–Quinoxaline (PBTQ) [20] and Single-Walled Carbon Nanotube (SWCNT) materials.

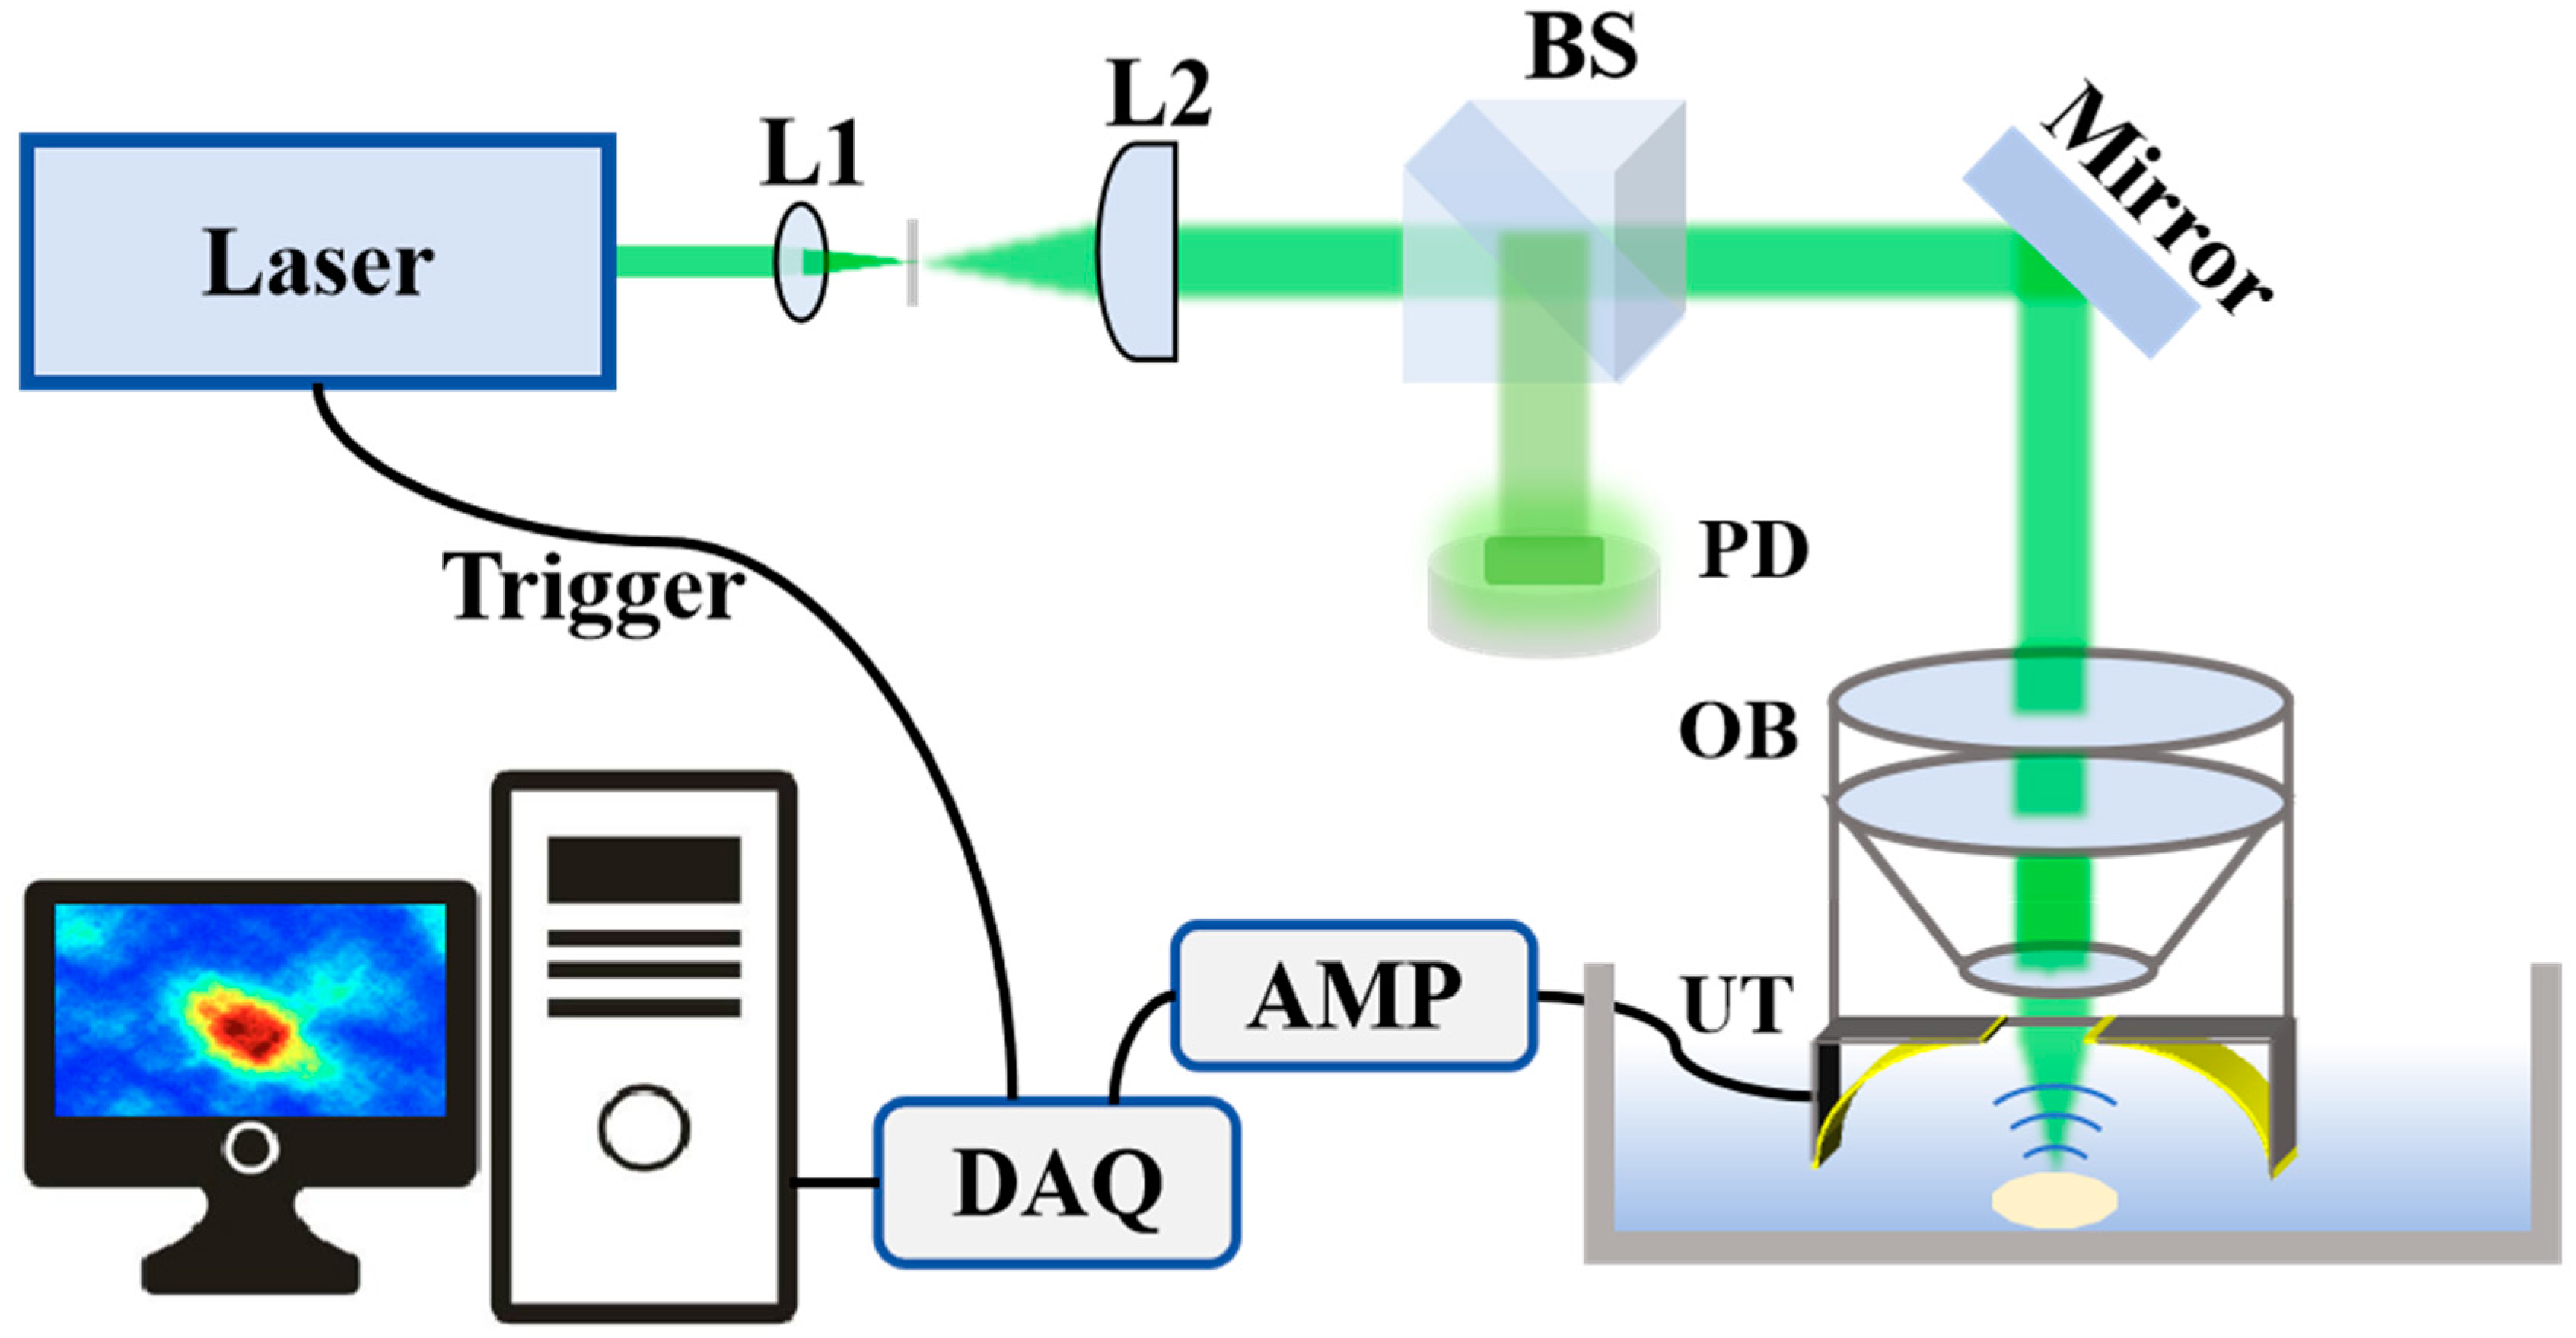
2. Methods and System

The theory of photoacoustics can be described as a straightforward physical process. When a sample absorbs modulated light radiation, it undergoes periodic heating, which results in localized pressure or stress within the thermal diffusion range at the sample surface. The conversion of optical pulses into acoustic energy is based on the non-radiative relaxation of absorbed energy during the thermal process. Subsequent thermal expansion generates acoustic waves. Assuming all energy absorbed by the medium under pulsed laser irradiation converts to heat, causing temperature elevation, T can be calculated using Equation (1) according to thermodynamic principles.
Δ T = E α ρ V C P
where T is the change in thermal energy, E α is the absorbed infrared light energy, ρ is the density of the irradiated medium, V is the volume of the medium, and C P is the specific heat capacity of the medium. As the temperature increases, thermal expansion gives rise to an initial acoustic pressure, with its initial value P 0 expressed by Equation (2).
P 0 = Δ T β ρ c 2 = β c 2 C P E 0
where E 0 is the energy density absorbed by light ( E 0 = E α V ); β is the thermal expansion coefficient of the optical medium; c is the sound speed in a medium. Upon defining the Grüeneisen parameter Γ = β c 2 C P , the expression for the initial value P 0 becomes Equation (3).
P 0 = Γ E 0
Research indicates that the Grüeneisen parameter of water varies with temperature, affecting its photoacoustic signal accordingly. The photoacoustic pressure P is described in the form of the temporal wave Equation (4) as follows:
1 v 2 2 t 2 2 P = α β C P I ( Z , t ) t
where α is the optical absorption coefficient and I is the instantaneous light intensity; under conditions of constant laser power and fixed transducer position (at constant temperature and pressure, with water as the medium), the acoustic pressure P of the photoacoustic signal correlates with the optical absorption coefficient and laser power   P L   .
P α P L
Research showed that the optical absorption coefficient α of different materials varies as a function of the optical wavelength λ . For readers to understand, we consider two materials where the absorption function of material 1, α 1 ( λ ) = β λ , is a linear function, and the absorption function of material 2, α 2 ( λ ) = k , is constant (in fact, the light absorption coefficient of materials is irregular and difficult to explain with accurate formulas, and the final results of our experiments are obtained by fitting). Given that k and β are constants, and under conditions of constant laser power P L , we have the following:
P 1 P 2 = α 1 ( λ ) P L α 2 ( λ ) P L = β k λ
where P 1 and P 2 is the photoacoustic signal of materials 1 and 2 and α 1 and α 2 are the optical absorption coefficients of materials 1 and 2. Accordingly, the ratio of the optical absorption coefficients ( α 1 α 2 ) is the ratio of photoacoustic signals uniquely corresponding to the laser wavelength λ within a specific range. Thus, by calculating P 1 P 2 , the value of the laser wavelength λ can be determined.
The device diagram of the photoacoustic wavelength measurement system proposed in this paper is shown in Figure 1. The laser has a wavelength tunable (650–2400 nm), a pulse width of 10 ns, and a repetition rate of 20 Hz. The laser first passes through a filtering system to filter out clutter and then passes through a beam splitting (BS) to form two beams of light. One of them acts on a photodiode (PD) to detect laser energy, and the other laser beam passes through an objective lens and is focused on the material. The sound wave generated by the photoacoustic effect is transmitted by a hollow focused ultrasonic transducer (UT, center hole diameter is 6 mm, focal length is 15 mm, center frequency is 10 MHz, 100% bandwidth, the energy of the single pulse is 10 microjoules (mJ), and the diameter of the spot irradiated on the sample is about 500 microns) and then collected by a high-speed acquisition card (DAQ, M3i.4110) through a signal amplifier (AMP, LNA-650, RF BAY, Suzhou, China). Finally, Matlab software2022a calculates the normalized value of the photoacoustic signal.

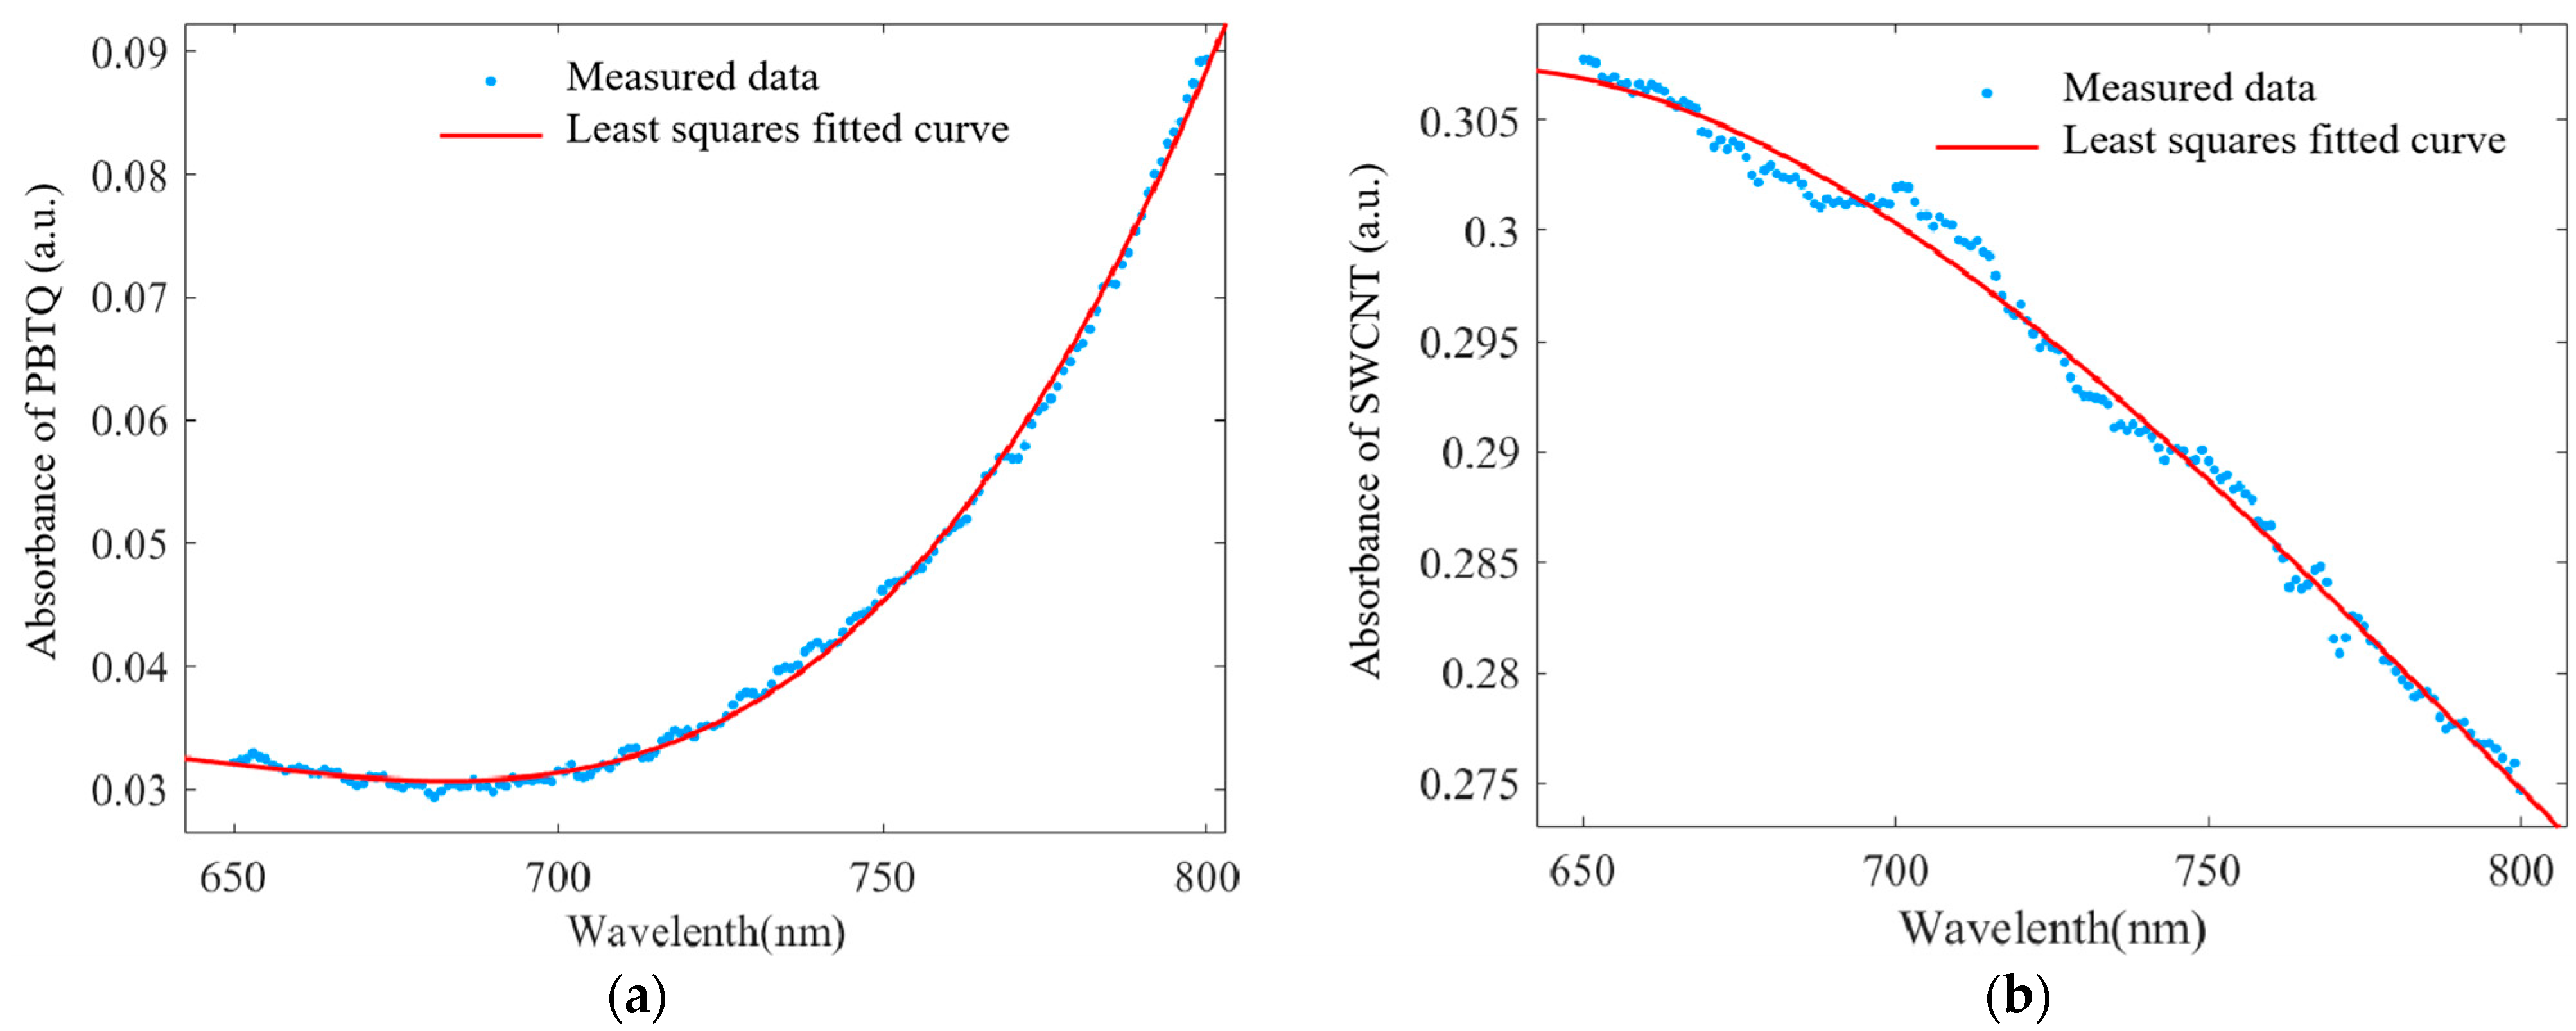
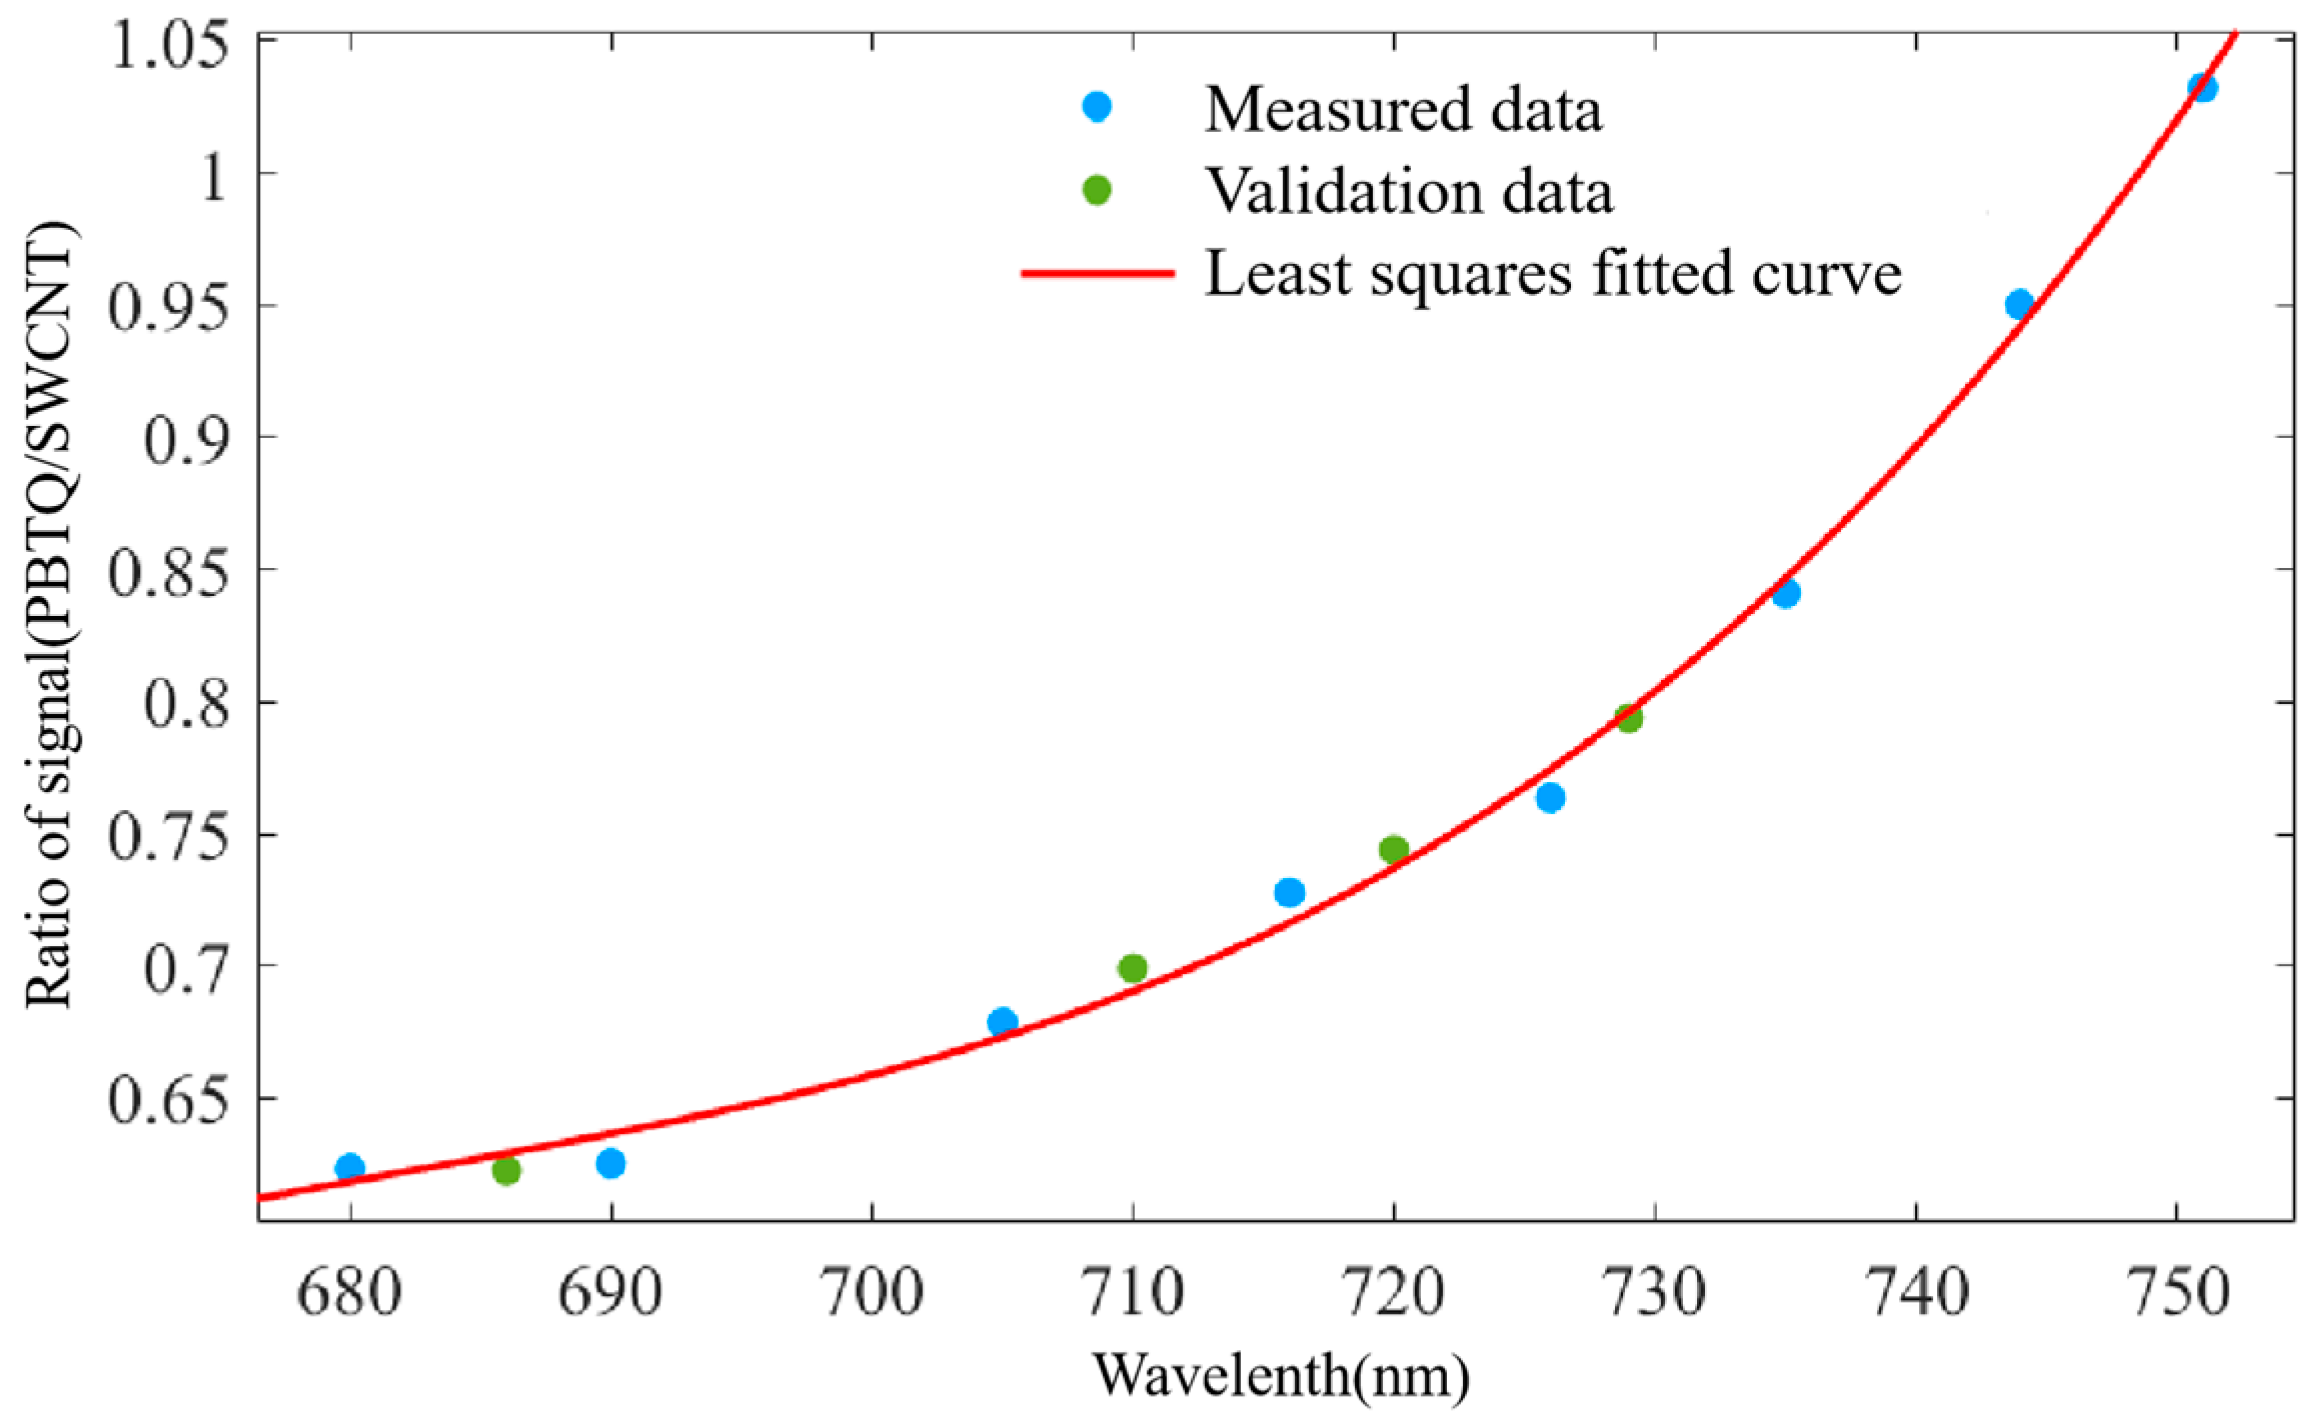
3. Results and Discussion

In this study, the optical method was initially employed to measure the absorption coefficients of PBTQ and SWCNT at different laser wavelengths within the range of 650–800 nm, with a 1 nm interval. The absorption data were fitted using third-order polynomials, as illustrated in Figure 2. The fitting curves for both materials were obtained through nonlinear least squares iterative methods, yielding correlation coefficients R 2 of 0.998 and 0.9924, respectively. The goodness of fit is summarized in Table 1. From the fitted curves, it can be observed that the absorption coefficient of PBTQ monotonically increases within the wavelength range of 680–800 nm, while that of SWCNT monotonically decreases over the same range. Consequently, the ratio P 1 P 2 of their photoacoustic signal intensities is uniquely determined by the wavelength within the 680–800 nm range, as shown in Equation (6). By determining P 1 P 2 in Equation (6), the laser wavelength can be accurately identified.
Subsequently, a series of photoacoustic signal intensities for PBTQ and SWCNT were measured, as depicted in Figure 3. A total of twelve wavelengths were measured, with each wavelength tested three times to obtain an average value. Uncertainties were calculated, and the relative uncertainty of PBTQ/SWCNT was maintained at 2%. Among these, eight wavelengths were used for fitting curves, while four wavelengths (686 nm, 710 nm, 720 nm, 729 nm) served as validation points. As shown in Figure 3, the blue dots represent fitted data, while the green dots represent validation data. The increasing red fitted curve aligns with the conclusions drawn in Figure 2. The final validation data wavelengths (683.67 nm, 710.68 nm, 721.92 nm, 729.68 nm) confirm the feasibility of this method. The wavelength detection uncertainty of the system is approximately 2.33 nm, primarily attributed to optical damage and other phenomena affecting the stability of absorption coefficients during multiple laser exposures.

4. Conclusions

We studied the photoacoustic effects of two materials, PBTQ and SWCNT, and built a material-based wavelength detection system, which can be used as a wavelength measurement method derived from the photoacoustic effect. The method features a simple structure, low costs, and a wide and flexible measurement range. By detecting the optical absorption coefficients of PBTQ and SWCNT, coupled with theoretical derivation, a quantitative relationship between laser wavelength and the ratio of photoacoustic signal intensity has been established. It has been verified that the system achieves a wavelength measurement uncertainty of approximately 2.33 nm within the 680–800 nm range, suitable for rapid and cost-effective wavelength measurement of lasers. The wavelength detection method based on the thermoacoustic effect of electromagnetic waves is not limited to the wavelength range discussed in this manuscript. Our ultimate goal is to extend the detection capability to a broader range of power wavelengths, including infrared, millimeter-wave, and terahertz bands, which are relevant for applications, such as electromagnetic weapons, where the energy levels are too high for conventional instruments to handle. Our previous experiments have demonstrated the effectiveness of terahertz-induced thermoacoustic signals for detecting the power of terahertz emitters [21]. Currently, due to limitations in available materials, we have only been able to validate this method within the optical wavelength range of 680–800 nanometers. In future work, we plan to explore additional materials, such as those with various structural combinations, like PBTQ [20] and MXene [22,23], for the terahertz range to enable wavelength/frequency measurements across a wider spectrum of electromagnetic waves. In addition, we will also learn from this method [24,25] and achieve electromagnetic wave wavelength/frequency detection over a wider frequency band by fitting the band gap of the two materials.

Author Contributions

Conceptualization, Y.H.; data curation, Z.Z.; formal analysis, Y.H., R.Z. and L.H.; methodology, L.H. and Y.H.; project administration, R.Z. and Z.Z.; Software, L.H. and Y.H.; validation, R.Z. and Z.Z.; writing—original draft, L.H. and Y.H.; writing—review and editing, L.H., Y.H., R.Z. and Z.Z. All authors have read and agreed to the published version of the manuscript.

Funding

This work was supported in part by the National Natural Science Foundation of China under, Grant Nos. 82071940 and 82371977, and in part by the Key Research and Development Program of the Science and Technology Department of Sichuan Province under Grant Nos. 2023YFG0322 and 2024NSFSC0465.

Institutional Review Board Statement

Not applicable.

Informed Consent Statement

Not applicable.

Data Availability Statement

All data supporting the conclusions of this manuscript are included within the manuscript.

Conflicts of Interest

The authors declare no conflicts of interest.

References

  1. Abreu, M.; Candan, G.; Failache, H. Wavemeter. An instrument to determine coherent light beam wavelength. In Proceedings of the IEEE Instrumentation & Measurement Technology Conference, Waltham, MA, USA, 21–23 May 2002. [Google Scholar] [CrossRef]
  2. Solomakha, D.A.; Toropov, A.K. Laser wavelength measurements (review). Sov. J. Quantum Electron. 1977, 7, 1637–1660. [Google Scholar] [CrossRef]
  3. Coddington, I.; Swann, W.C.; Newbury, N.R. Erratum: Coherent Multiheterodyne Spectroscopy Using Stabilized Optical Frequency Combs. Phys. Rev. Lett. 2008, 100, 013902. [Google Scholar] [CrossRef]
  4. Cao, T.L.; Yao, J.Q.; Zheng, Y. Ways of wavelength mesasurement of terahertz wave based on Fabry-Perot interferometer. Opt. Instrum. 2008, 30, 13–16. [Google Scholar]
  5. Das, D.; Banerjee, A.; Barthwal, S.; Natarajana, V. A rubidium-stabilized ring-cavity resonator for optical frequency metrology: Precise measurement of the D1 line in 133Cs. Eur. Phys. J. Dat. Mol. Opt. Plasma Phys. 2006, 38, 545–552. [Google Scholar] [CrossRef]
  6. Qi, X.; Xiao, H.; Han, X.; Xia, D.; Chen, X. Frequency Measurement for Terahertz Waves Based on High Magnetic Field Technology. In Proceedings of the 44th International Conference on Infrared, Millimeter, and Terahertz Waves (IRMMW-THz), Paris, France, 1–6 September 2019. [Google Scholar] [CrossRef]
  7. Yee, D.S.; Jang, Y.D.; Kim, Y.C.; Seo, D.C. Terahertz spectrum analyzer based on frequency and power measurement. Opt. Lett. 2010, 35, 2532–2534. [Google Scholar] [CrossRef]
  8. Zou, X.; Yao, J. Microwave frequency measurement with improved measurement range and resolution. Electron. Lett. 2009, 45, 497–498. [Google Scholar] [CrossRef]
  9. Lau, K.Y.; Nabiev, R.F.; Chang-Hasnain, C.J.; Eng, L.E. Spectrodetector: Novel monolithic wavelength reader and photodetector. Electron. Lett. 2002, 31, 1373–1374. [Google Scholar] [CrossRef]
  10. Badran, H. A Low Cost Instantaneous Frequency Measurement System. Electromagn. Res. M 2017, 59, 171–180. [Google Scholar] [CrossRef]
  11. Xu, C.; Zhang, Y.S.; Zhao, Y.S.; Li, P. Advances in Spectroscopic Characters of Space Objects. J. Clin. Otorhinolaryngol. 2017, 37, 672–678. [Google Scholar]
  12. Ivanov, A.A.; Morozov, O.G.; Andreev, V.A.; Morozov, G.A.; Faskhutdinov, L.M. Microwave photonic system for instantaneous frequency measurement based on principles of “frequency-amplitude” conversion in fiber Bragg grating and additional frequency separation. In Proceedings of the XIV International Scientific and Technical Conference on Optical Technologies in Telecommunications, Samara, Russia, 23–26 November 2016; International Society for Optics and Photonics: San Diego, CA, USA, 2017. [Google Scholar] [CrossRef]
  13. Dai, J.; Xu, K.; Duan, R.; Zhang, X.; Wang, D.; Wu, J.; Lin, J. Instantaneous frequency measurement based on complementary microwave photonic filters with a shared Mach–Zehnder interferometer. Opt. Commun. 2011, 284, 5738–5741. [Google Scholar] [CrossRef]
  14. Thattey, S.S.; Dongare, A.S.; Dasgupta, K.; More, S.R.; Nair, L.G. A wavemeter for measuring changes in wavelength of pulsed dye lasers. Rev. Sci. Instrum. 1994, 65, 2470–2474. [Google Scholar] [CrossRef]
  15. Saitoh, T.; Nakamura, K.; Takahashi, Y.; Miyagi, K. Optical spectrum analyzer utilizing MEMS scanning mirror. IEEE Photonics Technol. Lett. 2006, 18, 767–769. [Google Scholar] [CrossRef]
  16. Petley, B.W.; Morris, K. A simple CW laser digital wavemeter. Opt. Quantum Electron. 1978, 10, 277–278. [Google Scholar] [CrossRef]
  17. Karpowicz, N.; Dai, J.; Lu, X.; Chen, Y.; Yamaguchi, M.; Zhao, H. Coherent heterodyne time-domain spectrometry covering the entire “terahertz gap”. Appl. Phys. Lett. 2008, 92, 011131. [Google Scholar] [CrossRef]
  18. Ach, F.; Schmiedel, A.; Kaemling, A.; Fischer, C.; Viöl, W. High power infrared laser beam monitoring by optical measurement of mirror surface deformation. Laser Phys. Lett. 2010, 2, 267–271. [Google Scholar] [CrossRef]
  19. Zhang, B.; Peng, Z.; Xia, Y.; Sun, Z.; Zheng, K.; Zhu, Q.; Dong, J.; Lu, Z. High precise time division multiplex UV pulse waveform measurement system for high power laser facility. Fusion Eng. Des. 2021, 173, 112878. [Google Scholar] [CrossRef]
  20. Liu, Y.; Liu, J.F.; Chen, D.D.; Wang, X.S.; Zhang, Z.; Yang, Y.C.; Jiang, L.H.; Qi, W.Z.; Ye, Z.Y.; He, S.Q.; et al. Fluorination Enhances NIR-II Fluorescence of Polymer Dots for Quantitative Brain Tumor Imaging. Angew. Chem. Int. Ed. 2020, 132, 21235–21243. [Google Scholar] [CrossRef]
  21. Wang, W.P.; Huang, L.; Zhou, H.J.; Gong, S.; Zeng, H.X.; Zhou, J.; Yang, Z.Q.; Zhang, Y.X. Low Frequency Terahertz Induced Thermoacoustic Signal Characteristics and Its Application in Solid-State Terahertz Transmitter Power Detection. IEEE Trans. Terahertz Sci. Technol. 2022, 12, 673–677. [Google Scholar] [CrossRef]
  22. Satapathy, A.; Sawant, K.K.; Mondal, S.; Raj, A.A.B.; Mahimkar, K.; Kandasubramanian, B. Recent Progress on MXenes as an Attenuator of Terahertz Radiation. J. Electron. Mater. 2023, 52, 1749–1768. [Google Scholar] [CrossRef]
  23. Titova, L.V.; Li, G.; Natu, V.; Huang, S.; Barsoum, M.W. 2D MXenes: Terahertz Properties and Applications. In Proceedings of the 45th International Conference on Infrared, Millimeter, and Terahertz Waves (IRMMW-THz), Buffalo, NY, USA, 8–13 November 2020. [Google Scholar] [CrossRef]
  24. Yang, Y.Y.; Gong, P.; Ma, W.D.; Hao, R.; Fang, X.Y. Effects of substitution of group-V atoms for carbon or silicon atoms on optical properties of silicon carbide nanotubes. Chin. Phys. B 2021, 30, 67803. [Google Scholar] [CrossRef]
  25. Henaish, A.; Abouhaswa, A. Effect of WO3 nanoparticle doping on the physical properties of PVC polymer. Bull. Mater. Sci. 2020, 43, 149. [Google Scholar] [CrossRef]
Figure 1. Photoacoustic wavelength measurement system.
Photonics 11 00831 g001
Figure 2. The fitted curve of the material’s optical absorbance in the wavelength range of 650 nm to 680 nm: (a) PBTQ; (b) SWCNT. The blue dots represent discrete measurements taken at 1 nm intervals; the red curve represents the fitted curve.
Photonics 11 00831 g002
Figure 3. Fitted curve of ratio of photoacoustic signal intensity (PBTQ/SWCNT). A total of twelve wavelengths were tested, with each wavelength measured three times to obtain an average value. Each data point represents the ratio of optical signal intensity, PBTQ/SWCNT, at the corresponding wavelength; the blue dots represent the fitted curve, and the green dots serve as the validation set.
Photonics 11 00831 g003
Table 1. This table shows the goodness of fit of the curve in Figure 2.
MATERIAL R 2 SSERMSE
PBTQ0.9988.016 × 10−57.385 × 10⁻⁴
SWCNT0.99421.111 × 10−48.694 × 10⁻⁴
Disclaimer/Publisher’s Note: The statements, opinions and data contained in all publications are solely those of the individual author(s) and contributor(s) and not of MDPI and/or the editor(s). MDPI and/or the editor(s) disclaim responsibility for any injury to people or property resulting from any ideas, methods, instructions or products referred to in the content.

