Communication

Quality Assessment of Perovskite Solar Cells: An Industrial Point of View

1
Ecoprogetti S.r.l., Via dell’Industria e dell’Artigianato 22/D, Carmignano di Brenta, 35010 Padova, Italy
2
Department of Information Engineering, University of Padova, 35131 Padova, Italy
3
Department of Physics and Astronomy, University of Padova, 35131 Padova, Italy
4
Department of Industrial Engineering, University of Padova, 35131 Padova, Italy
5
Center for Hybrid and Organic Solar Energy (CHOSE), Department of Electronic Engineering, University of Rome “Tor Vergata”, 00133 Rome, Italy
6
Consiglio Nazionale delle Ricerche—Istituto di Struttura della Materia (CNR-ISM), 00133 Rome, Italy
*
Author to whom correspondence should be addressed.
Photonics 2024, 11(9), 880; https://doi.org/10.3390/photonics11090880
Submission received: 19 August 2024 / Revised: 14 September 2024 / Accepted: 17 September 2024 / Published: 19 September 2024
(This article belongs to the Special Issue Advances in Perovskite Solar Cells)

Abstract

:
The mass production of photovoltaic (PV) devices requires fast and reliable characterization methods and equipment. PV manufacturers produce a complete module roughly every 20 s, and the electrical performance assessment is typically completed in less than 1 s. Times are even more stringent during cell manufacturing. To be competitive in the PV market, perovskite solar cells and modules aim to the same target, i.e., fast and reliable quality assessment. This communication report discusses the limit of characterizing the current perovskite technology. Standard current vs voltage measurements are compared to maximum power point tracking (MPPT), and a fast MPPT procedure is developed to meet the highly demand standard for quality control in the industry of PV production.

1. Introduction

In the last decade, perovskite photovoltaic (PV) devices have shown an unprecedented improvement, both in terms of power conversion efficiency (PCE) [1] and overall stability [2]. Nowadays, also thanks to governments funding support (see for instance the European Strategic Research and Innovation Agenda), perovskite PV has begun the technological transition from research laboratories to the industry [3,4]. In such a framework, the common practices for perovskite characterization (cell stabilization procedures, slow scan rates, and light soaking analysis) [5] are not compatible with fast industrial processes requiring just few seconds for quality assessment. Furthermore, worldwide industries mostly rely on normative guidelines from the International Electrotechnical Commission (IEC); however, the characterization methods described in the IEC 60904-1 [6] are not applicable for metastable devices [7] and, although a technical report exists (IEC TR 63228) [8], an equivalent standard for the measurements of perovskite devices is yet to be released.
It is therefore of fundamental importance to find and standardize a fast and reliable solution to evaluate the quality of perovskite-based solar cells and modules.
In this communication report, we fabricated semi-transparent formamidinium lead–bromide perovskite (FAPbBr3) mini-modules consisting of six cells connected in series. First, we characterized them by performing standard current-vs-voltage measurements. Then, we implemented a Fast Maximum Power Point Tracking (Fast-MPPT) algorithm, showing that it can be used to obtain a quick estimation of devices’ PCE, with higher reproducibility with respect to conventional methods. Lastly, a procedure for the quality assessment of perovskite PV, and possibly other emerging PV devices, targeting the need of industrial manufacturing is provided.

2. Materials and Methods

2.1. Perovskite Mini-Module Fabrication

The mini-modules based on FAPbBr3 perovskite were realized following the work of Di Girolamo et al. [9]. In short, the cell architecture was of NIP type, consisting of the following stack: glass/FTO/TiO2/SnO2/FAPbBr3/PTAA/ITO. Patterning (P) of the module was achieved by using the P1, P2, and P3 strategy, performed by using a raster scanning laser (Wophotonics; Yb:KGW; λ = 355 nm; 5 ps; pulsed at 2000 kHz with a fluence per pulse for patterning cells and for a P1, P2, and P3 of 40.85, 29.06; and 21.23 mJ cm−2, respectively) on 60 mm × 60 mm sized-substrates. Extensive details on the P1-P2-P3 scheme are reported in [10]. After P1 laser ablation, a 20 nm-thick TiO2 compact layer (c-TiO2) was deposited by spray pyrolysis at 460 °C, using a precursor solution consisting of titanium diisopropoxide bis(acetylacetonate), acetylacetone, and ethanol with a 3:2:45 volume ratio. Then, 2% Nb doping was achieved by adding niobium ethoxide to the precursor solution. SnO2 nanoparticle-based ink at 1:20 v/v in deionized water was deposited on the Nb/TiO2-coated substrate by spin coating at 4000 rpm for 20 s. Then, the substrates were annealed at 120 °C for 20 min. A stoichiometric perovskite solution (FAPbBr3) was prepared by mixing 1 M PbBr2 and 1 M FABr in DMSO solvent. Then, the FAPbBr3 perovskite films were obtained by spin coating at 4000 rpm for 20 s using a solvent quenching method on warm substrates (60 °C). Ethylacetate (500 µL) was dropped after 10 s. The samples were then annealed at 80 °C for 10 min. We used neo-Pentylammonium chloride (NEO) and iso-Pentylammonium chloride (ISO) solution (1 mg/mL) deposited on the top of perovskite to create a 2D perovskite interface by spin coating at 4000 rpm for 20 s. The ISO-NEO strategy allows for a strong reduction in non-radiative emission and an increase in PV parameters. We achieved a light utilization efficiency (Efficiency x Average Visible Transmittance) above 5.5%. The PTAA solution (10 mg/mL) in the toluene solvent was doped using TBP (10 µL/mL) and Li-TFSI (5 µL/mL, stock solution: 170 mg/mL in acetonitrile). The PTAA layer was deposited by spin coating at 4000 rpm for 20 s. After P2, low temperature ITO deposition was performed by using an industrial in-line magnetron sputtering (KENOSISTEC S.R.L., KS 400 In-Line, Milan, Italy) at 1.1∙10−3 mBar and 90 W RF power. Inert Ar gas was purged in the chamber (40 sccm) during the ITO deposition to activate the Ar+ plasma. P3 ablation lines were processed in order to obtain the final module layout formed by six cells with 7.38 mm × 45 mm cell width and height, connected in series. In this way, the minimodules had an active area of 20 cm2, with a geometrical fill factor exceeding 97%.

2.2. Electrical Characterizations

PV devices’ performance is evaluated by extrapolating their most representative figures of merit, namely, open-circuit voltage VOC, short-circuit current ISC, maximum output power PMAX, voltage at maximum power point VPP, and current at maximum power point IPP. All the electrical characterizations were performed in light conditions using a Keithly 2460 Source-Meter in a four-wire configuration to reduce all the parasitic components as much as possible.
Dual-scan current vs voltage (I-V) measurements were performed by sweeping the samples’ voltage from 0 V to (VOC) and backward with a scan rate of 6 V/s (I-V voltage sweep). Similarly, I-V current sweep was performed by scanning the current from 0 A to ISC (and backward). No additional delay was added between forward and reverse sweeps (the last data point of the forward scan is the first data point of the reverse scan).
Fast Maximum Power Point Tracking (Fast-MPPT) was performed using an adaptation of the predictive variable-step Newton–Raphson method proposed by Hosseini et al. [11]. In particular, starting from a guess value of PMAX, the device voltage was perturbed with a variable ΔV step calculated according to the Newton–Raphson algorithm [11], as reported in the following formula:
V = P n P n 1 g r a d n g r a d ( n 1 ) ,
with
g r a d ( n ) = P n P n 1 V n V ( n 1 ) ,
where n is the incremental number of steps during the algorithm, P ( n ) in the measure output power at step n , and V ( n ) is the applied voltage at step n .
In contrast to the method reported in [11], voltage instead of current is used as the perturbation variable. This allows for improved stability (especially for metastable devices) and higher precision around the maximum power point, as small current variations may induce large power changes, whereas small voltage variations lead to small power changes. Furthermore, to avoid possible divergence of the Newton–Raphson algorithm for very small values of g r a d n + 1 g r a d ( n ) , Equation (1) can be simplified as follows:
V = V n V ( n 1 ) P n P n 1 P n P n 2 .
While Equation (1) ensures fast convergence, Equation (3) provides higher stability. Therefore, to ensure both fast convergence and high stability in our MPPT method, we combine both equations as follows:
V = P n P n 1 g r a d n g r a d ( n 1 ) V n V n 1 > 10   µ V V n V ( n 1 ) P n P n 1 P n P n 2 V n V n 1 10   µ V
Measurements are performed by measuring both current and voltage, with a sampling time of 14 ms (~71 samples/s). After PMAX convergence, the Fast-MPPT measurement continues until the variation in ΔPMAX becomes stably lower than 10 µW.
Samples were illuminated using a custom ECOSUN Cell (A + A + A ++ Sun Simulator from Ecoprogetti S.r.l.), certified according to IEC 60904-9 [12]. The total irradiance of the solar simulator was adjusted by computing the spectral mismatch correction factor for the perovskite samples under test according to IEC 60904-7 [13].

3. Results and Discussion

The industrial PV production process requires the fast in-line evaluation of cell/module performance, which is usually achieved by performing fast I-V sweeps (typically lasting less than 1 s) using a solar simulator with a spectrum resembling the AM1.5G solar spectrum as closely as possible.
Sustaining these standards becomes a real challenge with perovskite solar cells (PSCs). An explicative example is reported in Figure 1a, showing an I-V sweep with a voltage scan-rate of 6 V/s. This is a relatively slow-scan rate, at least for PV manufacturers; however, the resulting I-V curve is characterized by a marked hysteresis that makes it challenging to univocally identify the device figures of merit. In particular, PMAX rises from 75.5 mW during the forward scan to 81.9 mW during the reverse scan, giving an uncertainty larger than 8%, which is unacceptable for most PV manufacturers. This is even more unacceptable considering that the real PMAX value may not be represented by either of the two scans.
It is worth noticing that since the absorption spectra of the PSCs under test ranges from 300 nm to 550 nm, we can adjust the ECOSUN spectrum to make it more “perovskite-friendly” (see Figure 1b for the comparison of the two spectra). In such a way, we can limit the variability factors during measurements by reducing sample self-heating processes and, at the same time, reducing the power consumption of the solar simulator.
Figure 1a shows a comparison between two IV sweeps performed with the two different illumination spectra. The perfect overlap between the two curves confirms that there is no information loss in reducing the active illumination spectrum and that the presence of hysteresis during the scans is due to the intrinsic metastability of the device [14], unrelated to any degradation phenomena. In the following text, the reduced “perovskite-friendly” spectrum will be used.
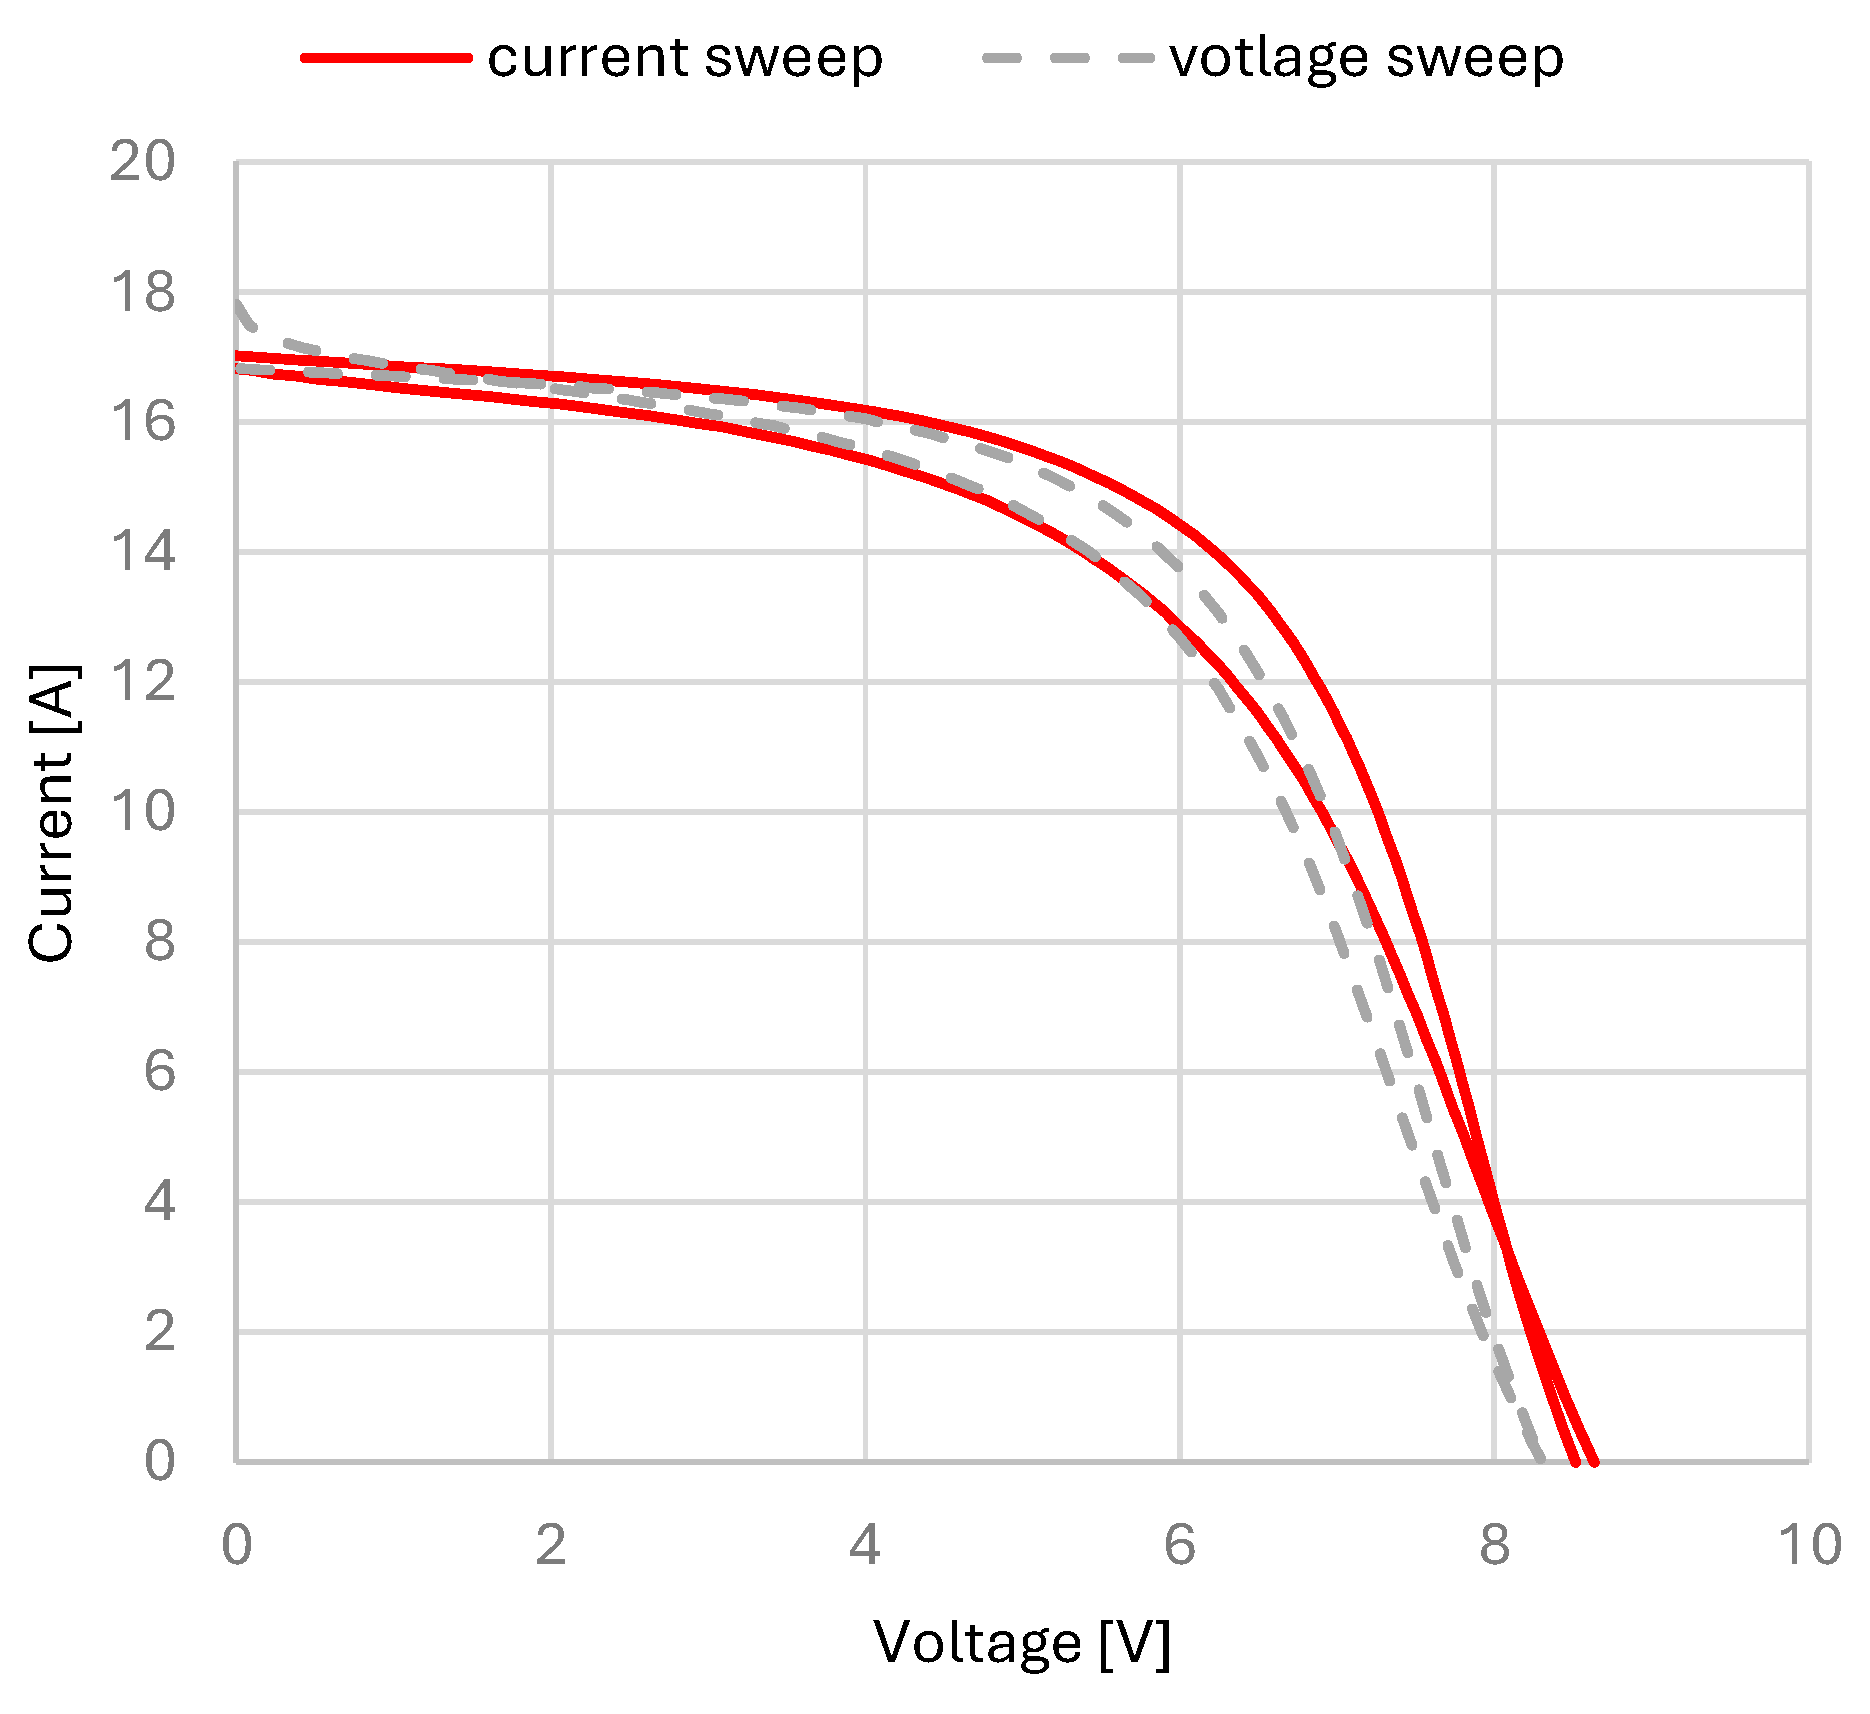
A tentative approach to reducing hysteresis (hence uncertainty in the extrapolation of device parameters) is to perform a current sweep instead of a voltage sweep. This approach is already effective for large-capacitance PV cells and modules, as with the silicon heterojunction technology, but we discourage its use with perovskite technologies due to their large ionic contribution. As reported in Figure 2, current sweeps induce an important displacement of mobile ions that reflects in a larger hysteresis that goes from 0.8 V during voltage sweeps (gray dashed line in Figure 2) to 1.9 V during current sweeps (red solid line in Figure 2). Furthermore, such displacements could trigger degradation processes that can irreversibly damage the device under test [15].
The comparison between voltage and current sweeps highlights once again the issue of correct evaluation of the PMAX. In fact, during current sweeps (Figure 2), PMAX goes from 77.2 mW to 87.1 mW (11% variation, compared to the 8% variation during the voltage sweep). Such a large PMAX uncertainty, combined with a device’s intrinsic instability [16], compels us to ask ourselves how we should consistently evaluate perovskite PV devices’ maximum power.
Given the above-mentioned problematics/limitations, it is therefore mandatory to find an alternative approach to promptly extrapolate the most relevant figures of merits of perovskite and, possibly, other emerging PV technologies. For this purpose, the International Summit on Organic Photovoltaic Stability (ISOS) protocols may come in handy. In 2020, several research teams used the ISOS protocols as the foundation for common practice for testing perovskite photovoltaic devices [5]. In this statement, they recommended the use of MPPT, not only for investigating devices’ stability and aging properties, but also as a tool for the assessment of PV devices’ performance.
Therefore, we implemented a Fast-MPPT method, as described in Section 2.2, that allowed us to rapidly converge to a stable value of PMAX.
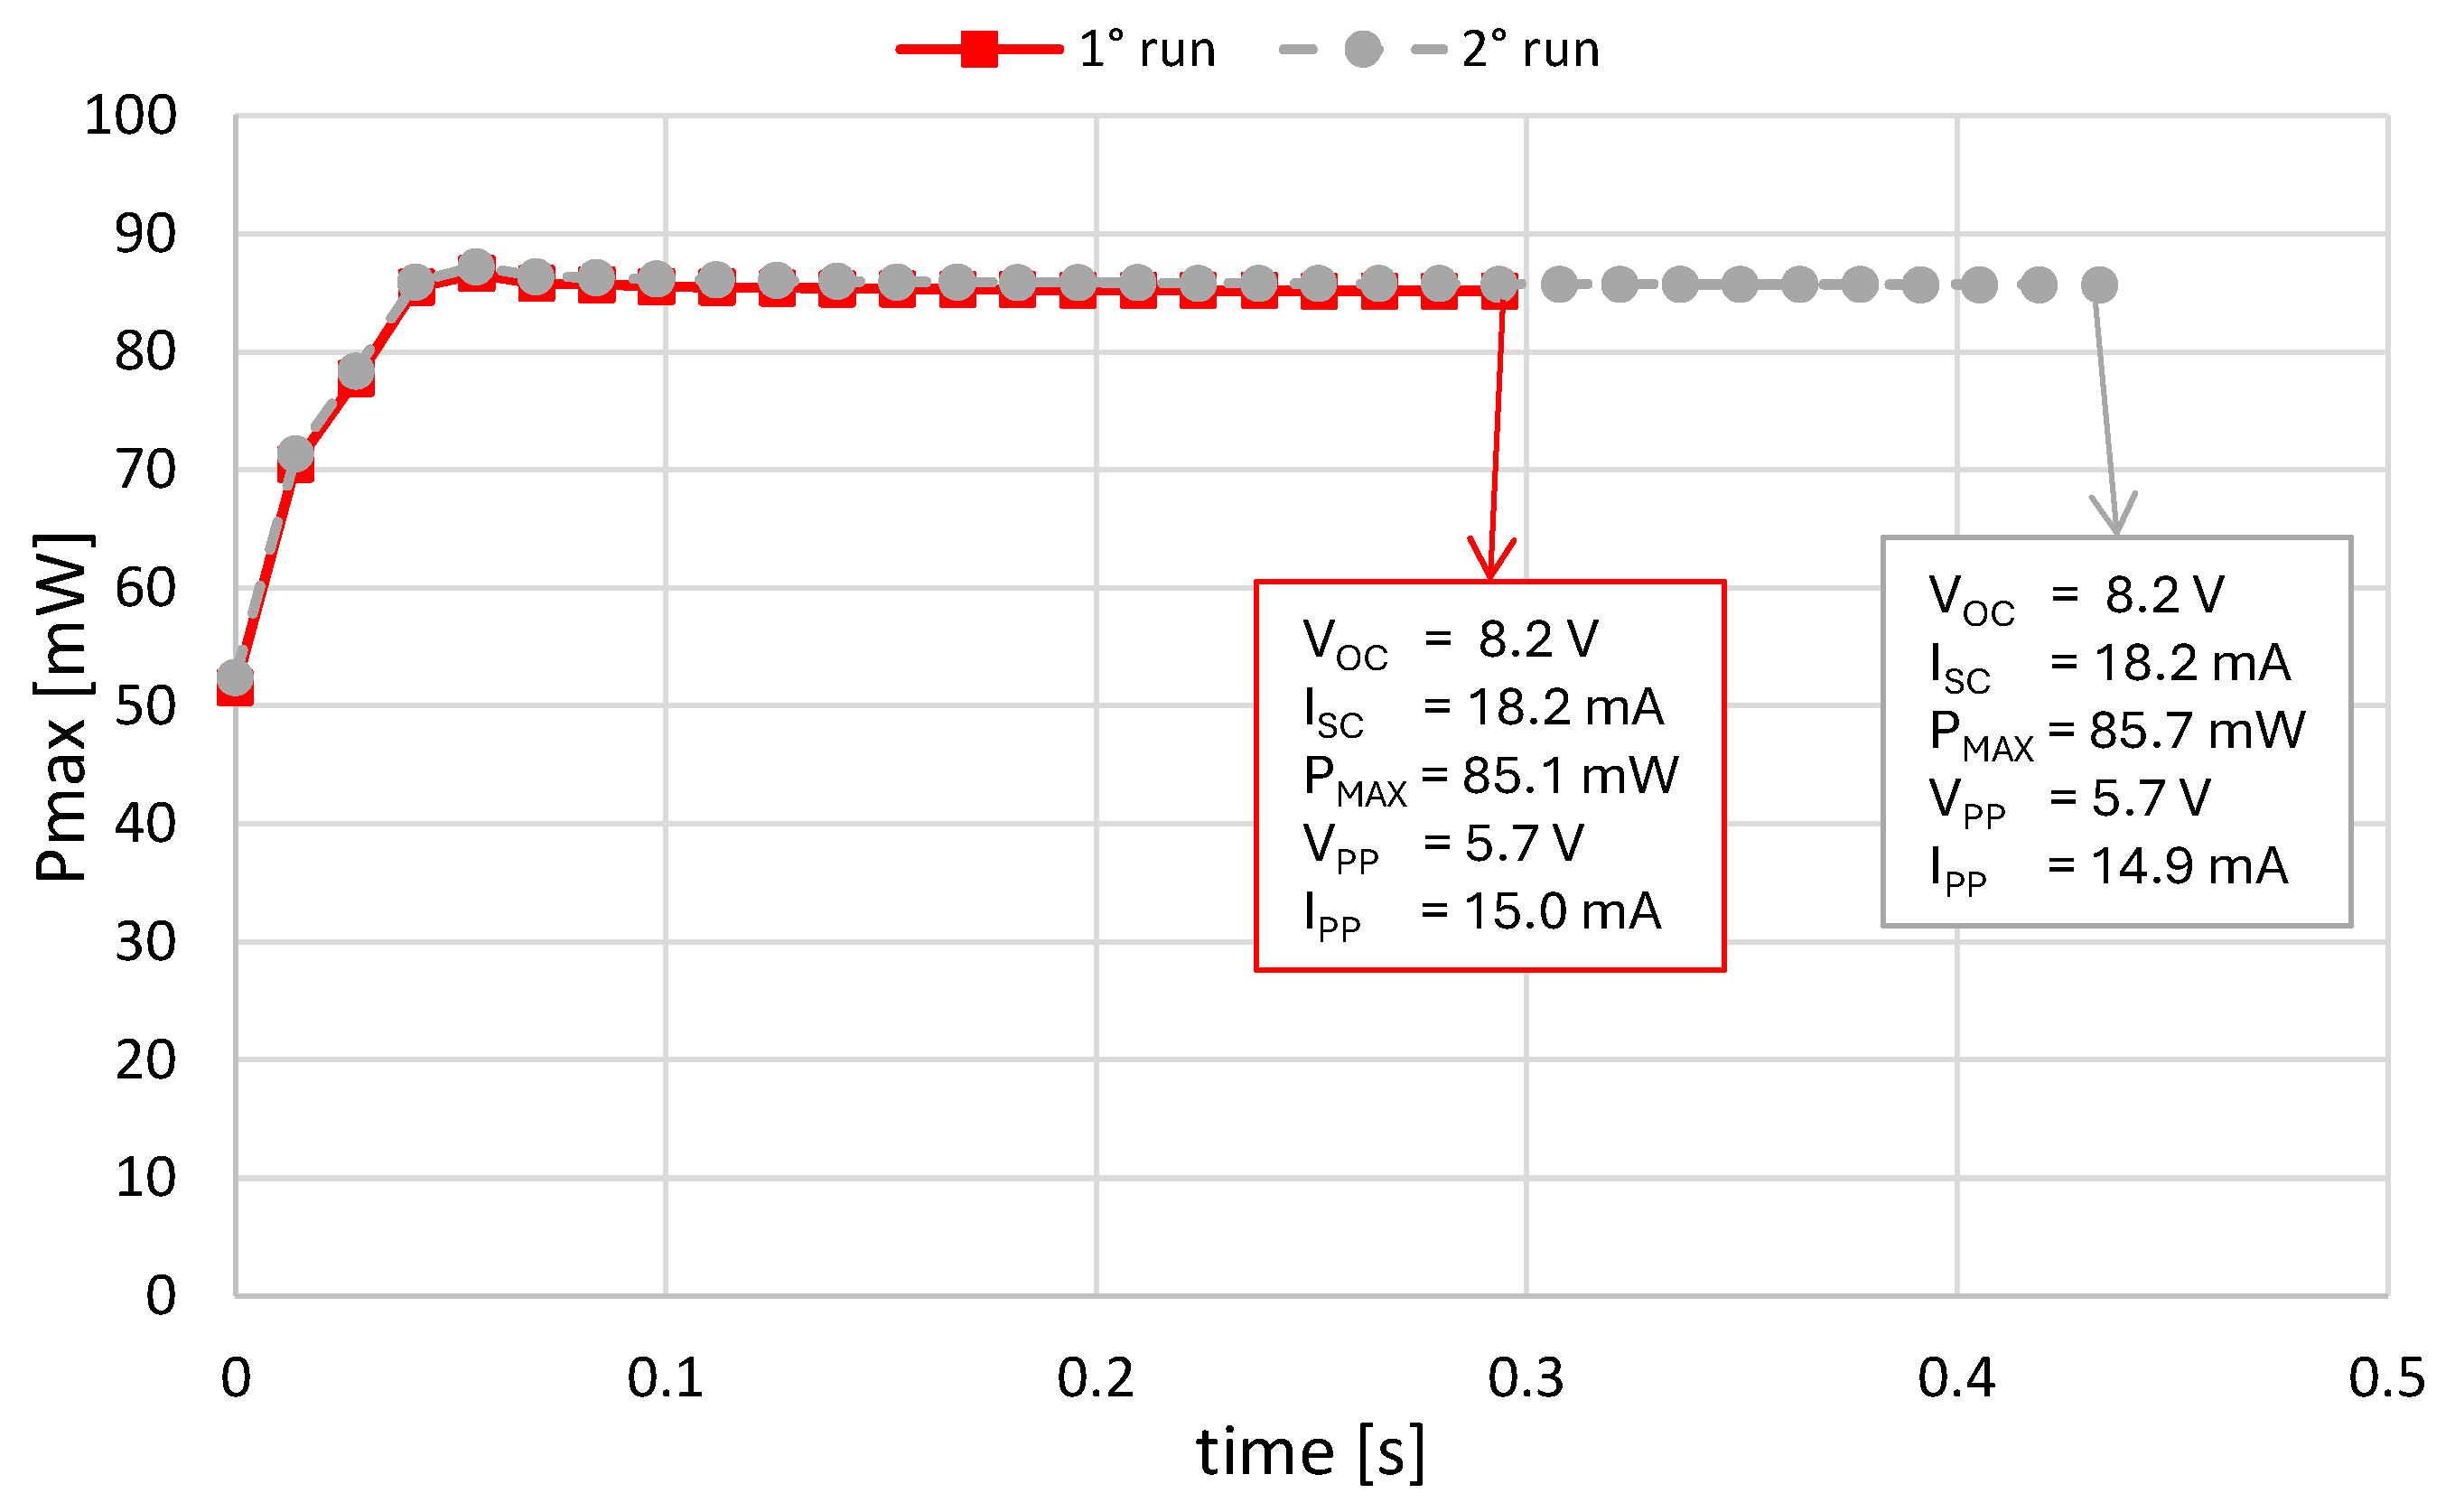
Figure 3 shows the result of our Fast-MPPT method. Clearly, this method is a more straightforward way to quantify devices’ maximum output power in less than 500 ms. Furthermore, our Fast-MPPT provides a higher repeatability, with a PMAX variability below 1% between consecutive measurements.
Based on the above observations, we suggest the use of MPPT instead of standard I-V sweeps for the quality assessment of perovskite-based PV devices (either small cells or modules). Therefore, tests in PV production lines should be performed according to the following procedure:
  • Illuminate the PV device with a calibrated solar simulator.
  • Individually evaluate the short-circuit current ISC by forcing 0 V across the device terminals and measuring the corresponding current.
  • Individually evaluate the open-circuit voltage VOC by forcing 0 A across the device terminals and measuring the corresponding voltage.
  • Perform a Fast-MPPT until the output power stabilizes with the desired precision (e.g., 10 µW).
  • Write a report with the measured ISC, VOC, PMAX, IPP, VPP.
We are aware that this procedure may still lead to some uncertainty, as the output power may differ depending on several factors including the stabilization method, which is not discussed here as it is outside the scope of this work. However, such a method is perfectly compliant with the fast standards of the market of solar panel production and presents little variability among consecutive tests.
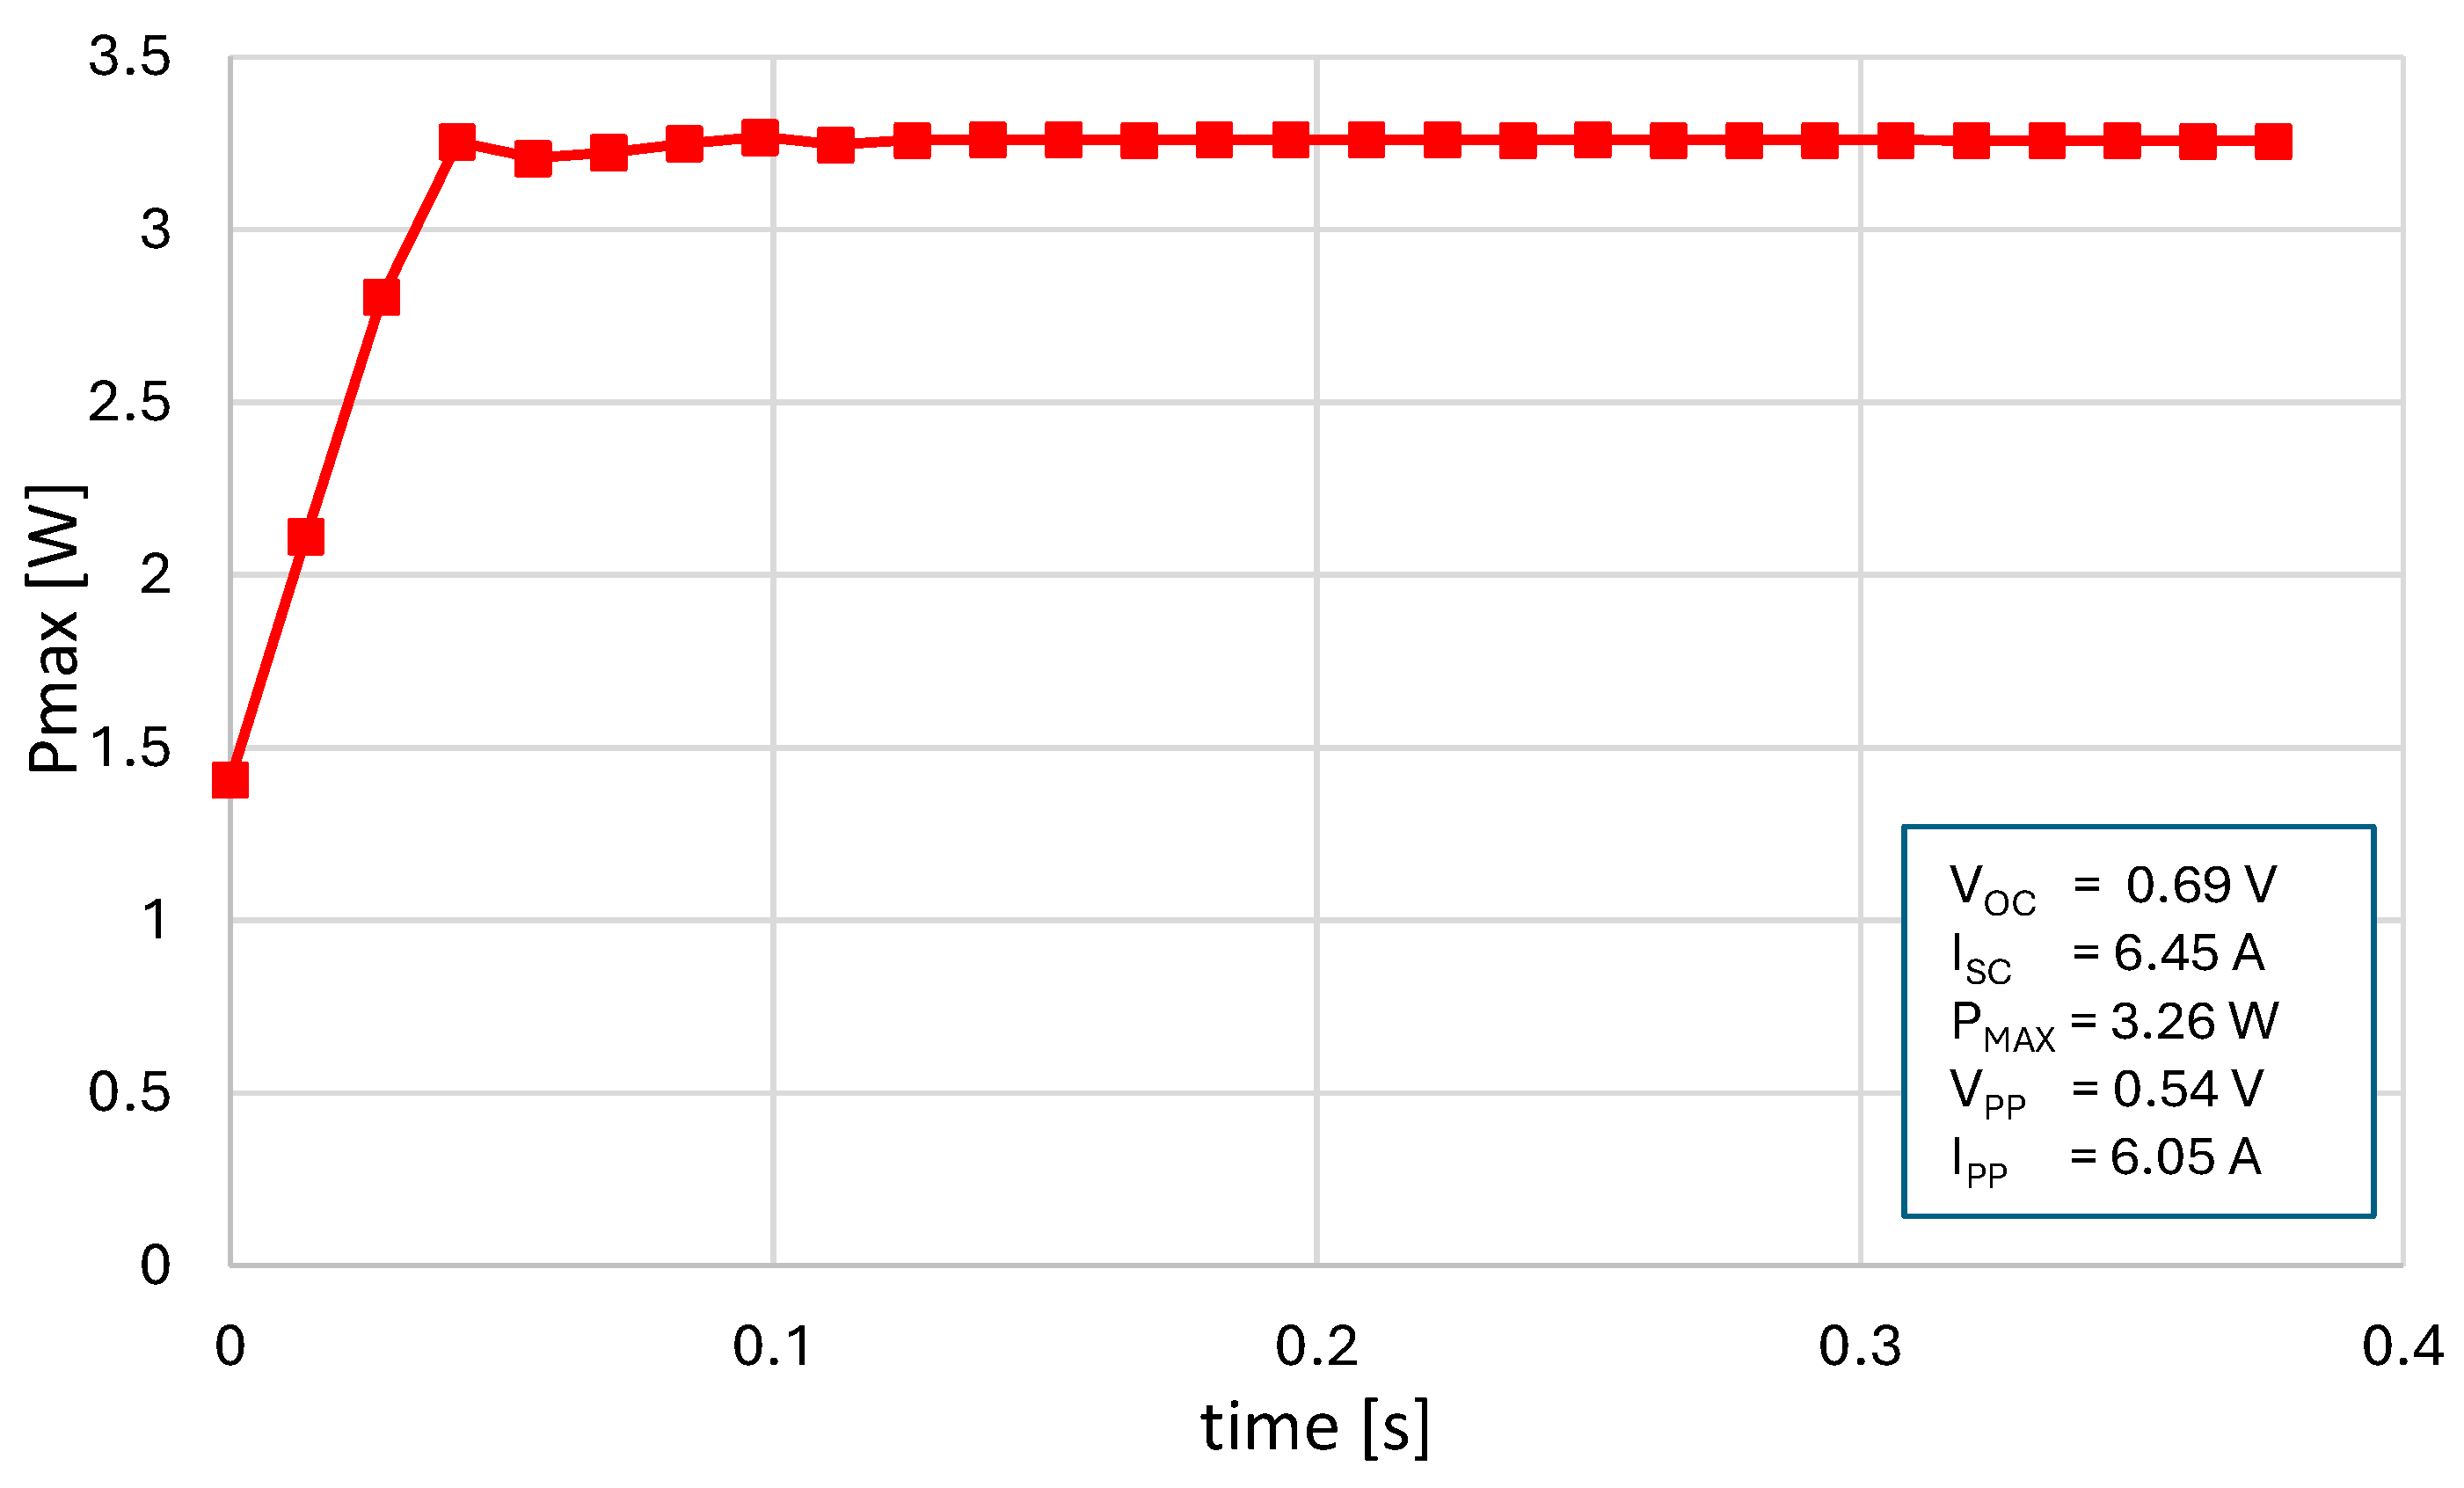
As a final remark, it is important to note that the applicability of this procedure is not limited to perovskite or other metastable devices but can also be successfully implemented without any modifications to the current PV technology in the market. To support this claim, we performed this procedure on commercially available PERC (passivated emitter and rear contact) and TOPCon (technology to tunnel oxide passivated contact) technology, and an example is reported in Figure 4, confirming the strength and validity of our approach.

4. Conclusions

In this communication, we evaluated the electrical characterization of perovskite mini-PV modules from an industrial point of view. In a PV production line, the time requirement for PV characterization is very strict (time equals money) and the quality evaluation of a PV module should be performed in no longer than 1 s.
Perovskite-based PV does not meet such requirements yet. Performing a full I-V scan can take much longer than 1 s, without giving a univocal result on the device’s figures of merit. Conversely, MPPT is less prone to misinterpretation, and fast algorithms can be implemented. Accordingly, we propose a fast and robust procedure to evaluate the quality of perovskite PV devices by extrapolating the main figures of merit.
We infer that this method does not present any critical issues in its applicability, and it can be extended to conventional PV technology as well as to emerging technologies.

Author Contributions

Conceptualization, N.L.; methodology, N.L.; software, N.L. and F.M. (Francesco Moretti); validation, N.L., F.M. (Francesco Moretti), F.M. (Fabio Matteocci) and J.B.; formal analysis, N.L.; investigation, N.L. and L.V.; resources, F.M. (Fabio Matteocci), A.D.C., A.C. (Andrea Cester) and F.Q.; data curation, N.L.; writing—original draft preparation, N.L.; writing—review and editing, N.L., A.D.C., L.V., N.T. (Noah Tormena), N.T. (Nicola Trivellin), A.C. (Alessandro Caria), M.B., C.D.S., G.M., E.Z. and M.M.; visualization, N.L.; supervision, A.D.C., N.T. (Nicola Trivellin), M.M. and F.Q.; project administration, F.Q.; funding acquisition, A.D.C., L.V. and F.Q. All authors have read and agreed to the published version of the manuscript.

Funding

This study was developed in the framework of the research activities carried out within the Project “Network 4 Energy Sustainable Transition—NEST”, Spoke 1 (Project code PE0000021), funded under the National Recovery and Resilience Plan (NRRP), Mission 4, Component 2, Investment 1.3—Call for tender No. 1561 of 11.10.2022 of Ministero dell’Università e della Ricerca (MUR); funded by the European Union—NextGenerationEU. L.V. acknowledges the European Union’s Horizon Europe program through a FET Proactive research and innovation action under grant agreement No. 101084124 (DIAMOND).

Institutional Review Board Statement

Not applicable.

Informed Consent Statement

Not applicable.

Data Availability Statement

Dataset available on request from the authors.

Conflicts of Interest

Authors Nicolò Lago, Francesco Moretti and Federico Quartiani are affiliated with the company Ecoprogetti S.r.l. The other authors declare no conflicts of interest.

References

  1. Best Research-Cell Efficiency Chart|Photovoltaic Research|NREL. Available online: https://www.nrel.gov/pv/assets/images/cell-pv-eff-emergingpv.jpg (accessed on 2 August 2024).
  2. Zhu, H.; Teale, S.; Lintangpradipto, M.N.; Mahesh, S.; Chen, B.; McGehee, M.D.; Sargent, E.H.; Bakr, O.M. Long-Term Operating Stability in Perovskite Photovoltaics. Nat. Rev. Mater. 2023, 8, 569–586. [Google Scholar] [CrossRef]
  3. Green, M.A.; Dunlop, E.D.; Hohl-Ebinger, J.; Yoshita, M.; Kopidakis, N.; Bothe, K.; Hinken, D.; Rauer, M.; Hao, X. Solar Cell Efficiency Tables (Version 60). Prog. Photovolt. Res. Appl. 2022, 30, 687–701. [Google Scholar] [CrossRef]
  4. Alberi, K.; Berry, J.J.; Cordell, J.J.; Friedman, D.J.; Geisz, J.F.; Kirmani, A.R.; Larson, B.W.; McMahon, W.E.; Mansfield, L.M.; Ndione, P.F.; et al. A Roadmap for Tandem Photovoltaics. Joule 2024, 8, 658–692. [Google Scholar] [CrossRef]
  5. Khenkin, M.V.; Katz, E.A.; Abate, A.; Bardizza, G.; Berry, J.J.; Brabec, C.; Brunetti, F.; Bulović, V.; Burlingame, Q.; Di Carlo, A.; et al. Consensus Statement for Stability Assessment and Reporting for Perovskite Photovoltaics Based on ISOS Procedures. Nat. Energy 2020, 5, 35–49. [Google Scholar] [CrossRef]
  6. IEC 60904-1:2020; Photovoltaic Devices—Part 1: Measurement of Photovoltaic Current-Voltage Characteristics. International Electrotechincal Commisson: Geneva, Switzerland. Available online: https://webstore.iec.ch/en/publication/32004 (accessed on 7 July 2020).
  7. Fell, C.J. Standardising Current-Voltage Measurements for Metastable Solar Cells. J. Phys. Energy 2020, 2, 011002. [Google Scholar] [CrossRef]
  8. IEC TR 63228:2019; Measurement Protocols for Photovoltaic Devices Based on Organic, Dye-Sensitized or Perovskite Materials. International Electrotechincal Commisson: Geneva, Switzerland. Available online: https://webstore.iec.ch/en/publication/64040 (accessed on 21 June 2024).
  9. Di Girolamo, D.; Vidon, G.; Barichello, J.; Di Giacomo, F.; Jafarzadeh, F.; Paci, B.; Generosi, A.; Kim, M.; Castriotta, L.A.; Frégnaux, M.; et al. Breaking 1.7 V Open Circuit Voltage in Large Area Transparent Perovskite Solar Cells Using Interfaces Passivation. Adv. Energy Mater. 2024, 14, 2400663. [Google Scholar] [CrossRef]
  10. Di Giacomo, F.; Castriotta, L.A.; Matteocci, F.; Di Carlo, A. Beyond 99.5% Geometrical Fill Factor in Perovskite Solar Minimodules with Advanced Laser Structuring. Adv. Energy Mater. 2024, 14, 2400115. [Google Scholar] [CrossRef]
  11. Hosseini, S.H.; Farakhor, A.; Khadem Haghighian, S. Novel Algorithm of MPPT for PV Array Based on Variable Step Newton-Raphson Method through Model Predictive Control. In Proceedings of the 2013 13th International Conference on Control, Automation and Systems (ICCAS 2013), Gwangju, Republic of Korea, 20–23 October 2013; pp. 1577–1582. [Google Scholar] [CrossRef]
  12. IEC 60904-9:2020; Photovoltaic Devices—Part 9: Classification of Solar Simulator Characteristics. International Electrotechincal Commisson: Geneva, Switzerland. Available online: https://webstore.iec.ch/en/publication/28973 (accessed on 7 July 2020).
  13. IEC 60904-7:2019; Photovoltaic Devices—Part 7: Computation of the Spectral Mismatch Correction for Measurements of Photovoltaic Devices. International Electrotechincal Commisson: Geneva, Switzerland. Available online: https://webstore.iec.ch/en/publication/65654 (accessed on 21 August 2019).
  14. Kang, D.H.; Park, N.G. On the Current–Voltage Hysteresis in Perovskite Solar Cells: Dependence on Perovskite Composition and Methods to Remove Hysteresis. Adv. Mater. 2019, 31, 1805214. [Google Scholar] [CrossRef] [PubMed]
  15. Rizzo, A.; Lamberti, F.; Buonomo, M.; Wrachien, N.; Torto, L.; Lago, N.; Sansoni, S.; Pilot, R.; Prato, M.; Michieli, N.; et al. Understanding Lead Iodide Perovskite Hysteresis and Degradation Causes by Extensive Electrical Characterization. Sol. Energy Mater. Sol. Cells 2019, 189, 43–52. [Google Scholar] [CrossRef]
  16. Lago, N.; Polo, A.; Reddy, S.H.; Di Carlo, A.D.; Cester, A. Intrinsic Instability of Perovskite Solar Cells: The Role of a Hole-Blocking Layer. Crystals 2023, 13, 185. [Google Scholar] [CrossRef]
Figure 1. (a) I-V voltage scan for extended (red solid line) and perovskite-friendly (gray dashed line) spectra; (b) ECOSUN extended (red solid line) and perovskite-friendly (gray dashed line) spectra used during the tests.
Photonics 11 00880 g001
Figure 2. I-V current sweep with perovskite-friendly spectrum (red solid line). The gray-dashed line reports the IV voltage sweep in Figure 1 for a direct comparison.
Photonics 11 00880 g002
Figure 3. Fast-MPPT with automatic end-of-measurement after convergence. The red squared line and the gray circle line are two consecutive measurements with a perovskite-friendly spectrum (1° and 2° runs, respectively).
Photonics 11 00880 g003
Figure 4. Example of Fast-MPPT with automatic end-of-measurement after convergence performed on standard 10 bus-bar half-cut PERC solar cell.
Photonics 11 00880 g004
Disclaimer/Publisher’s Note: The statements, opinions and data contained in all publications are solely those of the individual author(s) and contributor(s) and not of MDPI and/or the editor(s). MDPI and/or the editor(s) disclaim responsibility for any injury to people or property resulting from any ideas, methods, instructions or products referred to in the content.