Article

Room-Temperature Fiber-Coupled Single-Photon Source from CdTeSeS Core Quantum Dots

Department of Physics, Faculty of Science, Kasetsart University, Bangkok 10900, Thailand
Photonics 2025, 12(1), 52; https://doi.org/10.3390/photonics12010052
Submission received: 2 December 2024 / Revised: 3 January 2025 / Accepted: 7 January 2025 / Published: 9 January 2025
(This article belongs to the Special Issue Recent Progress in Single-Photon Generation and Detection)

Abstract

:
Single-photon sources with photon antibunching characteristics are essential for quantum information technologies. This paper investigates the potential of quaternary-alloy CdTeSeS colloidal core quantum dots (cQDs) as compact, room-temperature, and fiber-integrated single-photon sources. Single-photon emission from CdTeSeS cQDs was verified by measuring the second-order correlation function, g 2 τ , using a Hanbury-Brown and Twiss setup. A novel method to determine zero-time delay through afterpulsing analysis is presented. The results demonstrate strong photon antibunching with g 2 0 = 0.13 , confirming that the photoemission from the CdTeSeS cQDs function as a single-photon source. This work highlights the potential of CdTeSeS cQDs as reliable and efficient single-photon sources for practical use in fiber-based quantum information technologies.

1. Introduction

Single-photon sources capable of emitting one photon at a time (antibunching) with high purity and indistinguishability essential for applications in quantum computing and communication [1,2,3]. A high single-photon purity ensures the security of quantum key distribution [4] and reduces errors in quantum computation [5]. Single photons can be generated using methods such as faint laser pulses [6], spontaneous parametric down-conversion [7], or excitation of single emitters, including atoms, molecules, colloidal quantum dots (cQDs), and nitrogen-vacancy centers [8,9,10].
Among single-photon emitters, cQDs have emerged as promising candidates due to their unique optical properties, including brightness, photostability, and tunable emission wavelengths. These semiconductor nanoparticles are scalable, operate efficiently at room temperature, and are suitable for practical quantum applications [11,12,13], and biological imaging [14]. Notably, for single-photon sources, II-VI cQDs with core–shell structures, including CdSe/ZnS and CdSe/CdS, stand out for their ease of synthesis and compatibility with optical cavities [15,16]. These features provide significant advantages over other solid-state light sources, such as diamond color centers and epitaxially grown quantum dots, which typically require extremely low temperatures and involve complex manufacturing processes [17,18,19,20]. The nanofabrication of a CdSe/ZnSe quantum dot within a semiconductor tapered nanocolumn has achieved a single-photon generation rate of 5 MHz at 220 K [21]. Recent advancements in epitaxially grown quantum dots have further demonstrated single-photon emission at room temperature [22]. Additionally, exciton–photon coupling in organic cavities at room temperature has been demonstrated [23]. These studies highlight progress in addressing temperature constraints, which remain a critical limitation for many quantum light sources.
However, challenges such as limited coherence time [24,25], photoluminescence blinking [26,27], and integration with fiber-optic networks [28] persist and must be addressed to achieve practical and scalable quantum technologies.
CdTeSeS cQDs overcome some limitations of traditional core/shell systems, such as lattice mismatch and exciton confinement issues [29]. Previous studies on CdTeSeS cQDs have primarily focused on their high quantum yield, photostability, and tunable optical properties, enabling emission across a broad range from visible to near-infrared wavelengths [30,31]. These attributes make them versatile for optoelectronic and photonic applications [32].
Despite these advantages, their potential for efficient single-photon emission at room temperature remains largely unexplored. This gap can be attributed to several challenges, including insufficient understanding and control over the factors that affect quantum coherence and photon emission efficiency [24,25]. Key limitations include the quality of the quantum dots, the suppression of nonradiative recombination pathways, and the impact of thermal fluctuations [11,12,13].
This work aims to bridge this gap by investigating the single-photon emission properties of CdTeSeS QDs under continuous-wave (CW) excitation. It provides a detailed exploration of the photoluminescence (PL) properties of CdTeSeS cQDs, alongside a comprehensive analysis of photon statistics and single-photon emission under room-temperature conditions. The findings contribute to advancing practical single-photon sources for quantum information technologies, particularly enhancing quantum key distribution security. Additionally, they pave the way for integrating these sources into scalable quantum communication systems.
This study is organized as follows: First, the synthesis of CdTeSeS cQDs is described, followed by PL measurements of the synthesized cQDs. A novel approach to zero-time delay (ZTD) analysis, using afterpulsing in avalanche photodiodes (APDs) [33], is then introduced. Subsequently, photon statistics derived from the PL data are analyzed using a Hanbury–Brown and Twiss (HBT) interferometer [34] under CW excitation, revealing antibunching behavior. The study concludes with a discussion and summary of findings.

2. Materials and Methods

(1)
Chemicals
Cadmium oxide (CdO, 99.99%), trioctylphosphine (TOP, 90%), sulfur (S) powder (99.98%), selenium (Se) powder (99.99%), tellurium (Te) powder (99.8%), oleyl amine (OAm), and 1-octadecene (ODE, 90%) were purchased from Sigma Aldrich. 1-tetradecylphosphonic acid (TDPA, 98%) and oleic acid (OAc, 90%) were obtained from Alfa Aesar. Chemical-grade paraffin liquid was obtained from Shanghai Chemical Reagents Company. All chemicals were used without further purification.
(2)
Synthesis of CdSeTeS core quantum dots (cQDs) and quantum dot deposition
The cQDs were synthesized using a non-injection one-pot approach [35]. The process involves preparing cadmium (Cd), selenium (Se), tellurium (Te), and sulfur (S) precursors. For the Cd precursor, CdO was dissolved in a 1:3 mixture of OAc and paraffin liquid, heated to 200 °C under nitrogen (N2) to form a clear 0.1 M Cd stock solution. For the Se precursor, Se powder was dissolved in a 1:3 mixture of TOP and paraffin at 60 °C under N2, resulting in a 0.1 M Se solution. The Te precursor was prepared by dissolving Te powder in a 1:3 mixture of TOP and paraffin at 250 °C under N2, yielding a 0.1 M Te solution. For the S precursor, 0.2 g of sulfur was dissolved in 20 mL of OAc and 30 mL of ODE.
At room temperature, 0.5 mL each of the Se and Te precursor solutions were combined with 5.0 mL of the 0.1 M Cd stock solution in a three-neck flask, achieving a Cd:Se molar ratio of 10:1:1 and a total volume of 6.0 mL. The mixture was degassed at 110 °C under vacuum for 10 min to remove moisture and oxygen. Next, the degassed reaction system was heated to 320 °C at 10 °C/min under N2, stirring vigorously. Once 320 °C was reached, the temperature was maintained for 10 min to initiate nucleation. The temperature was then lowered to 260 °C, 2.0 mL of OAm was added, and stirring continued for 6 min. At this point, the sulfur precursor was added to initiate the formation of quaternary cQDs. The heat was removed, and the mixture was cooled to 60 °C. A total of 10.0 mL of a 1:1 hexane-methanol mixture was added to separate the nanocrystals. The CdTeSeS cQDs were purified by centrifugation, and then the supernatant was decanted.
CdTeSeS cQDs were deposited onto the tip of a 15 μm diameter, 0.5-m-long multimode fiber (Thorlabs, NJ, USA, FG050UGA) using a layer-by-layer dip-coating method [36]. The fiber was cleaned and cleaved at one end, and a 10 mW, 650 nm fiber-coupled laser diode (Link, Bangkok, Thailand, UF-2883) was used to verify light transmission. The deposition process was optimized to achieve minimal quantum dot occupancy by fine-tuning the solution concentration and performing a single dip to prevent clustering. The fiber tip was examined with high-resolution optical microscopy, and photon statistics from the HBT interferometer confirmed the successful isolation of a single quantum dot through the antibunching effect.
(3)
Photoluminescence measurement
The CdTeSeS cQDs were diluted in methanol and placed in a fused silica vial for photoluminescence (PL) spectra measurement. A fiber-coupled spectrometer (Ocean Optics, NY, USA, USB4000) was used to record the PL spectra. A 405 nm, 180 mW CW laser diode module (XinRui Technology, Jiangsu, China) was employed as the excitation source. The emitted photons were collected using a fiber collimator (Thorlabs, F240SMA-B) connected to an SMA fiber optic cable, which directed the light into the spectrometer for analysis. The spectrometer also investigated the spectral characteristics of the excitation laser diode (Figure 1).
(4)
The second-order correlation function
The second-order correlation function, g 2 τ , is an important measure to characterize the purity of photon emission in single-photon sources. It quantifies the probability of detecting two photons at a given time delay and is used to verify photon antibunching behavior. The second-order intensity correlation function is defined as [25]:
g 2 τ = I t I t + τ I t I t + τ
where I(t) is the intensity at time t, τ is the time delay between two intensity measurements, and the brackets 〈 〉 indicate a time average of the quantity inside.
The second-order correlation function is calculated following the method outlined in [37],
g 2 τ = n τ / R A R B Δ τ T
where R A and R B are the mean count rates at detectors D1 and D2, Δ τ is the time bin, and T is the total accumulation time.
For a basic three-level system with a single radiative transition characterized by a decay rate γ and one nonradiative transition, the second-order intensity correlation function is: [25]
g 2 τ = a 1 b exp γ τ
where a is a normalization constant, and b is a parameter that relates to the strength of the nonradiative transition. For normalizations (a = 1) the parameter, b, can be expressed as b = 1 g 2 0 , where g 2 0 represents the second-order intensity correlation at ZTD.
A true single-photon source demonstrates antibunching with g 2 0 = 0 , indicating that no two photons are emitted simultaneously. However, common practice often considers g 2 0 0.5 sufficient to indicate single-photon emission [16,24,38]. The second-order intensity correlation function is typically measured using the HBT interferometer (Figure 2), where a stream of photons is split by a 50/50 beam splitter and directed to two single-photon detectors. One detector starts the time measurement, and the other stops it. The recorded time differences are displayed as a histogram to calculate the second-order correlation function, g 2 τ [39,40].
(5)
Zero-time delay (ZTD) analysis of afterpulsing in APDs
Determining the ZTD is crucial because it serves as a reference point for accurately calculating the second-order intensity correlation function, g 2 0 , which is essential for analyzing the statistical properties of light and identifying photon antibunching [25,37]. In this work, ZTD is determined by analyzing afterpulsing in APDs. Afterpulsing is a phenomenon in which APDs re-emit photons after detecting an initial photon due to radiative recombinations of hot carriers generated during the avalanche process in the active area of APDs [41,42]. This analysis was performed using detection event data collected over 4 h. As shown in Figure 3, light enters port 1 of the 2 × 2 fiber coupler, with port 2 unconnected, while ports 3 and 4 are connected to APD1 and APD2, respectively, via optical fibers. The fiber coupler acts as a beamsplitter. Afterpulses from APD1 re-enter the fiber coupler through a collimator at port 3 and exit via port 1 or port 2, or are reflected to port 4, where they are detected by APD2. Similarly, afterpulses from APD2 re-enter through a collimator at port 4 and exit via port 1 or port 2, or are reflected to port 3, where they are detected by APD1. Afterpulsing is evident in the detection event histograms of the APDs, with two peaks corresponding to the photon propagation time in optical fiber between APD1 and APD2.
(6)
Experimental setup for second-order correlation measurements
The second-order correlation of PL from the CdTeSeS cQDs was measured over a period of 5 h using the HBT optical intensity interferometer (Figure 3). The cQDs were attached to the core of a multimode fiber, which was mounted on an x-y stage to align precisely with the focal point of a 405 nm CW laser diode. The laser beam was focused onto the CdTeSeS cQDs through an objective lens. The scattered emission from both the cQDs and the laser diode was coupled into the multimode fiber.
To isolate the CdTeSeS cQD photoluminescence, scattered photons from the laser diode were blocked using a long-pass filter (Thorlabs, FGL570) with a 570 nm cutoff wavelength. This filter, positioned between the fiber collimators (Thorlabs, F810FC-780) at the ends of the multimode fiber, allowed only the photoluminescence emitted by the CdTeSeS cQDs to pass through.
A 2 × 2 multimode fiber coupler (Newport, CA, USA, model F-CPL-M22855) with a 50:50 splitting ratio at 850 nm served as a beam splitter. Two single-photon-counting avalanche photodiodes (APDs) (Perkin-Elmer, CT, USA, SPCM-AQ4C) were used, one configured as the start signal (D1) and the other as the stop signal (D2) in a time-to-digital converter (TDC) (Texas Instruments, TX, USA, TDC7201) with 25 ps time resolution [43]. When detector D1 registered a photon at t = 0 , the TDC timer started, and when detector D2 detected a photon after a delay Δ t , it stopped the timer. Photons detected by detector D1 were ignored until detector D2 registered an event (see crossed-out pulses in Figure 2). A constant 100 ns electronic delay (Maxim, MA, USA, DS1100Z-100) was introduced in the stop channel to capture negative times in the time delay histogram, with simultaneous photon arrivals showing a 100 ns time difference. Each arm of the fiber coupler is connected to a 7 m multimode fiber, forming a 14 m optical link between the APDs.
The TDC7201 operated in measurement mode 1 to record the time difference between the start and stop pulses τ = t 2 t 1 . It was connected to an MSP430 microcontroller for data recording and a computer to generate and display histograms of photon time delays. The resulting time-delay histogram approximates the second-order intensity correlation function [44,45]. In comparison to the case where every photon is detected, this method is often used because it requires neither high-speed electronics nor complex analysis software [44,45,46].

3. Results

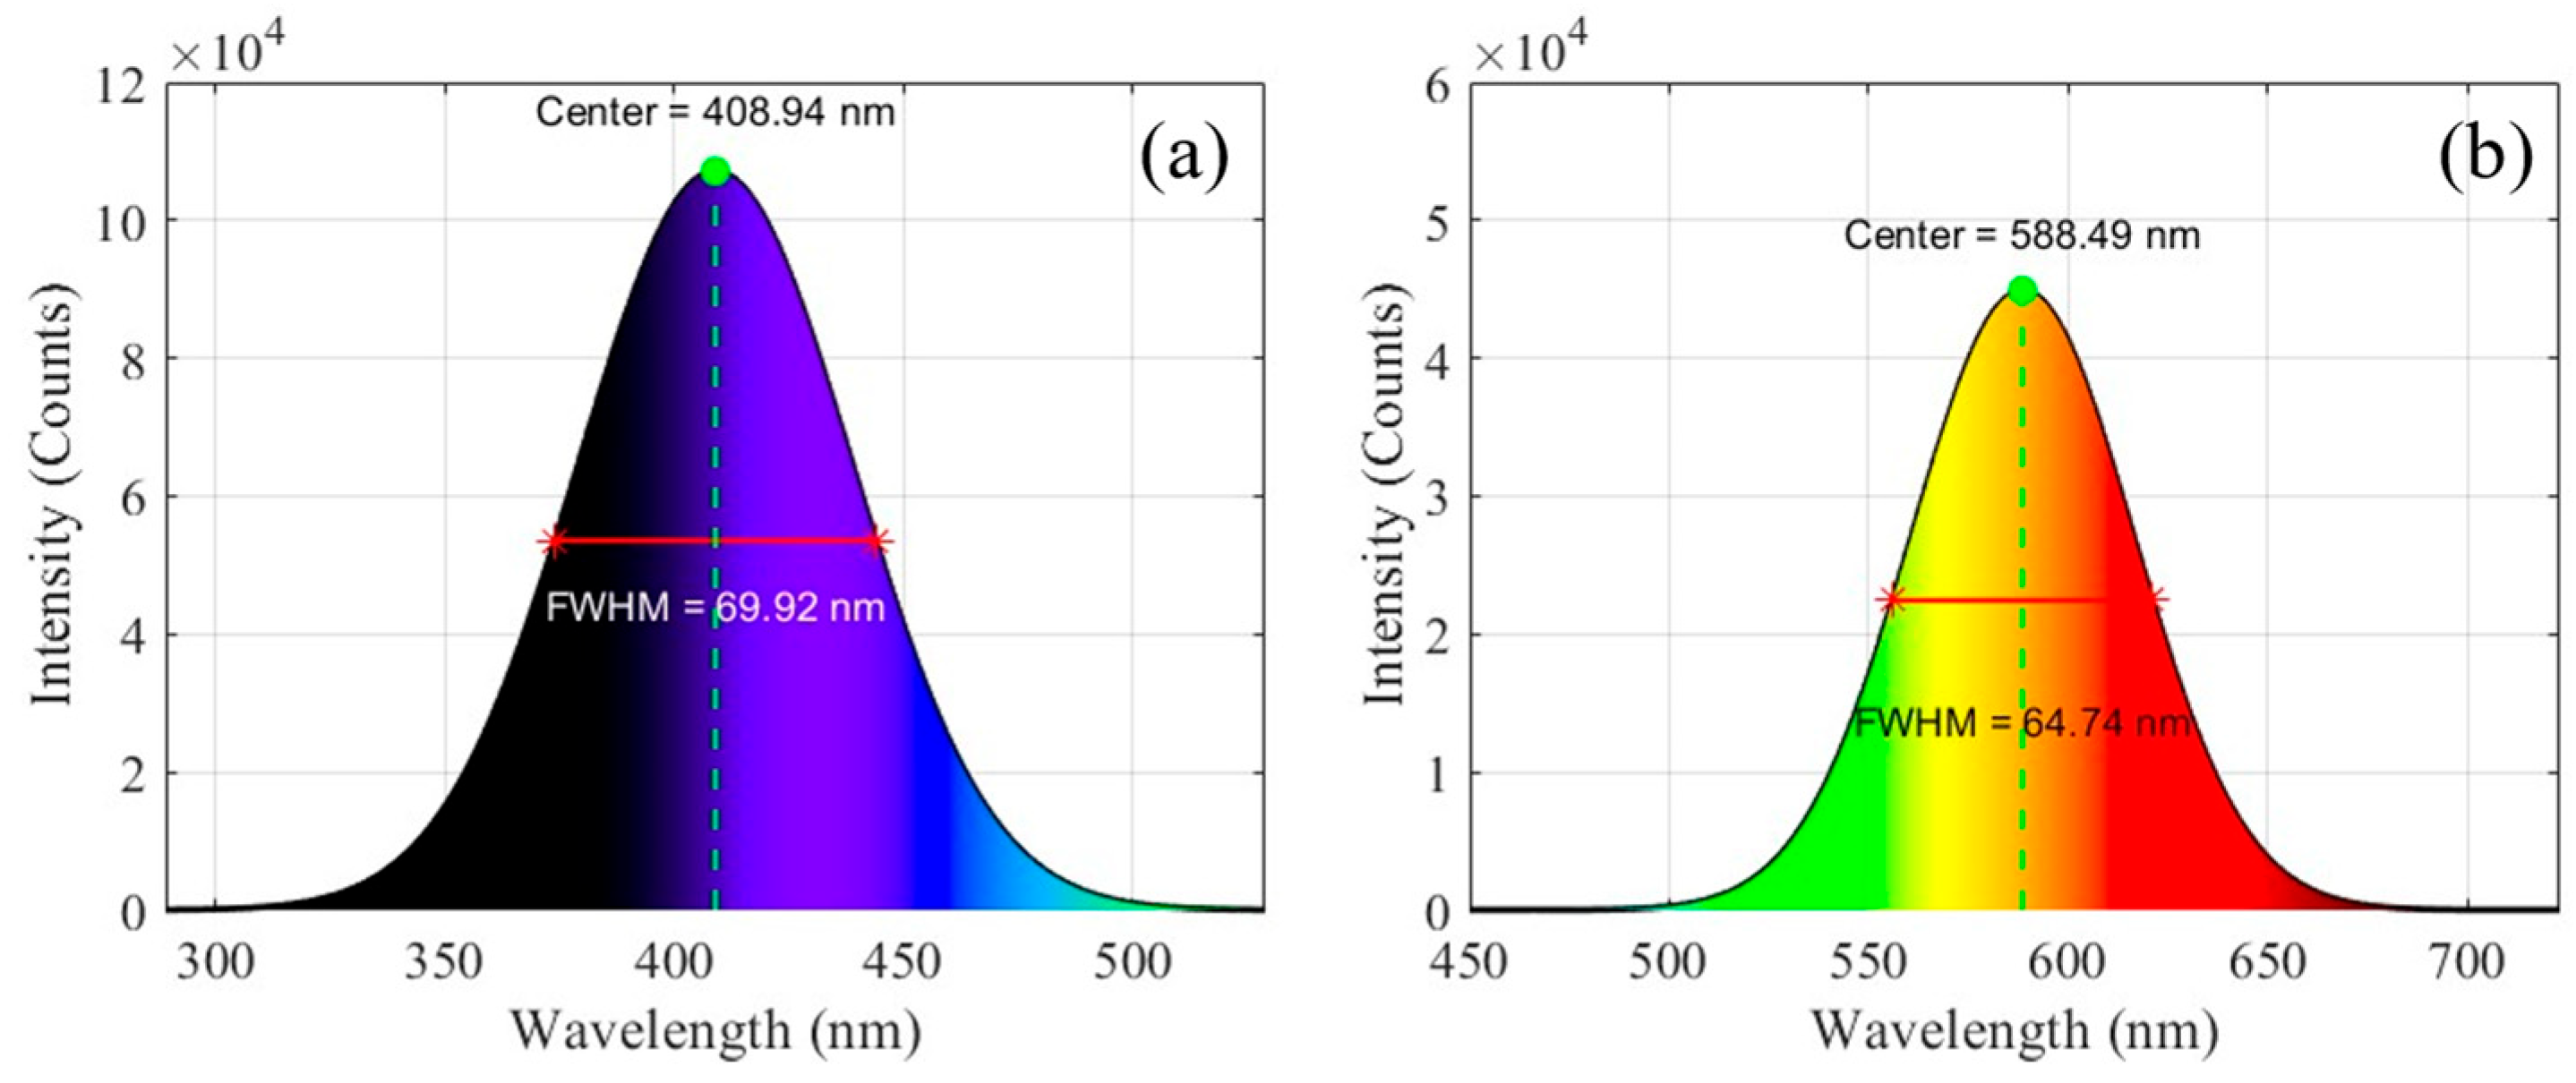
3.1. Photoluminescence Spectra

A Gaussian fit of the PL spectra indicates that the excitation diode laser operates at a centered wavelength of 408.94 nm with a full width at half maximum (FWHM) of 69.92 nm, as shown in Figure 4a. The PL spectra of CdTeSeS cQDs in methanol solution under CW diode laser excitation show a single peak with a centered emission wavelength of 588.49 nm and a FWHM of 64.74 nm, as shown in Figure 4b. The CdTeSeS cQDs presented here exhibit a 40 nm blue shift and a 5 nm peak narrowing compared to those synthesized via the organometallic hot-injection method [29]. They also display a 40 nm shorter shift and a 20 nm broadening compared to L-cysteine-capped CdTeSeS cQDs synthesized by the same method [30]. Additionally, relative to CdTe0.5Se0.5S cQDs produced through microwave-assisted aqueous synthesis [31], the cQDs presented here display spectra shifted approximately 20 nm to longer wavelengths.

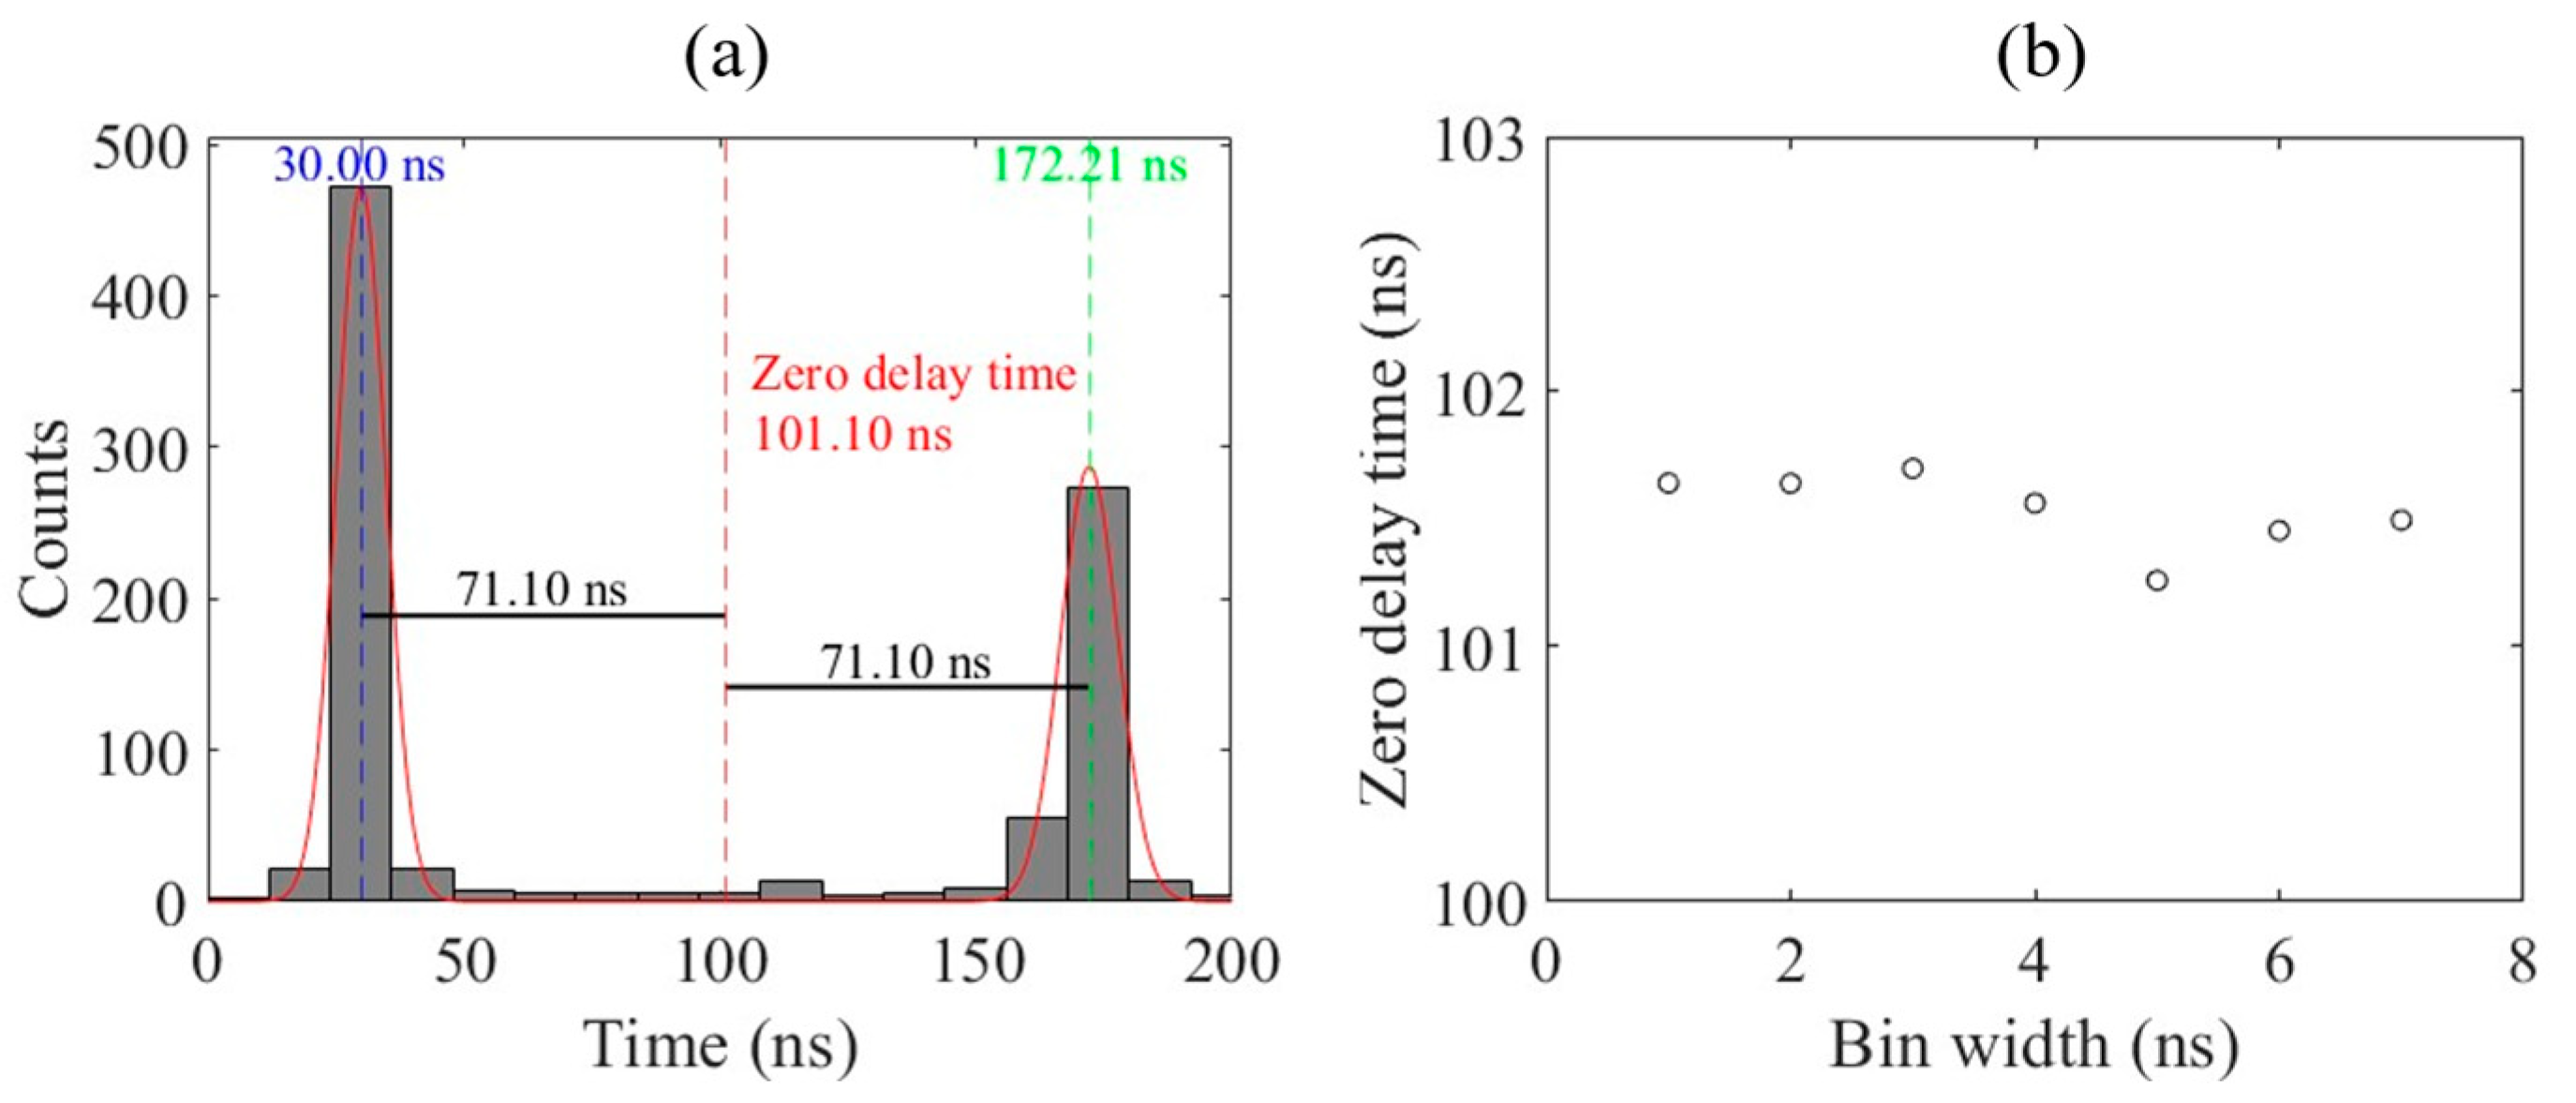
3.2. Determine the Zero Time Delay

Figure 5a presents the time-delay data for each photon pair, exhibiting delays ranging from 0 to 200 ns. The histogram, with a bin width of 12 ns, was derived from a 4 h integration period. Two distinct peaks are observed and fitted using Gaussian functions, centered at 30.00 ns and 172.21 ns.
For the peak centered at 172.21 ns, two scenarios explain the observed time difference. In the first scenario, a photon arrives at the start channel detector 70 ns earlier than a photon reaches the stop channel detector, resulting in a 170 ns delay. In the second scenario, the arrival of a photon at the start channel detector induces afterpulsing. The afterpulse propagates through a 14 m optical fiber, with a propagation time of 70 ns, and combines with an electronic delay of 100 ns, resulting in the same 170 ns delay. Since these scenarios are indistinguishable, the 170 ns delay is attributed to afterpulsing in the start channel detector.
For the peak centered at 30.00 ns, the time difference similarly arises from two indistinguishable scenarios. In the first scenario, a photon reaches the stop channel detector 70 ns earlier than another photon arrives at the start channel detector, resulting in a 30 ns delay. In the second scenario, a photon arriving at the stop channel detector causes afterpulsing, with the afterpulse propagating through the 14 m optical fiber (70 ns) to the start channel detector, similarly resulting in a 30 ns delay. This delay is thus attributed to afterpulsing in the stop channel detector. The peaks adjacent to the centers at 30.00 ns and 172.21 ns may be ascribed to the timing jitter of the electronic delay and the transient response of the quenching electronics [42].
Furthermore, the ZTD as a function of bin width, ranging from 1 ns to 7 ns, was calculated and is presented in Figure 5b. It was determined that the ZTD is 101.5 ns, which is consistent with the electronic delay.
After the fiber coupler, the single count rate of one APD was approximately 2500 counts per second (cps), while that of the other APD was around 3100 cps. However, this asymmetric fiber coupler does not impact the intensity autocorrelation of the photoluminescence of cQDs. Over a total measurement time of 4 h, approximately 800 flashes were detected. The background level was approximately the same as the dark count rate of 600 cps, which was quite low. Using the setup’s collection efficiency of 0.2, an average APD count rate of 3000 cps, and the quantum efficiency of the single-photon counting module (SPCM-AQ4C) of approximately 0.45 at the detection wavelength of interest, as specified by the manufacturer [47], this corresponds to an average of one afterpulse event per 108 detections.

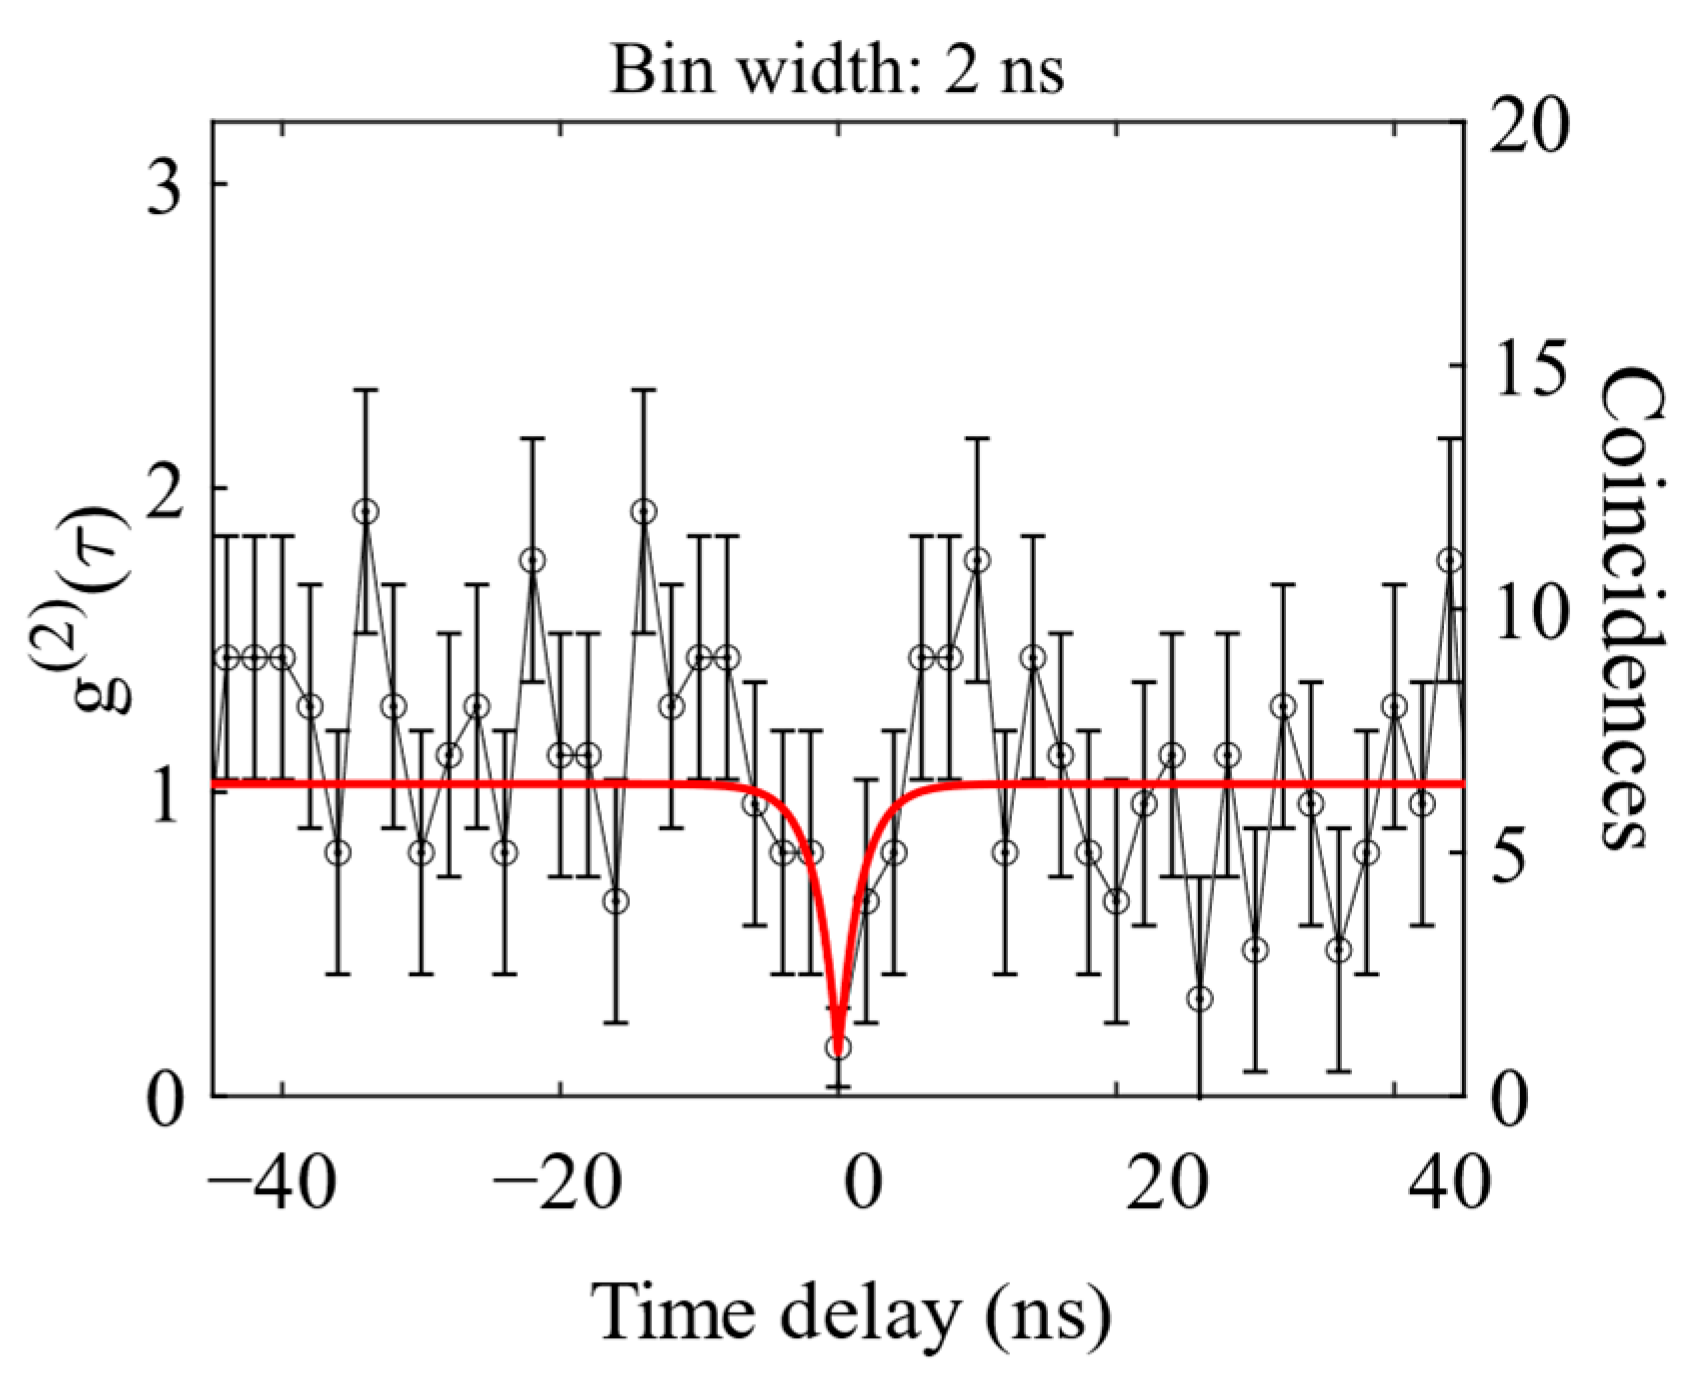
3.3. Second-Order Correlation

Figure 6 presents the second-order correlation function, g 2 τ , calculated from raw coincidence data over a 5 h period, and is binned with bin widths of 2 ns. The solid line displays a fit using Equation (3), yielding a = 1.03, b = 0.87, and a decay rate of γ = 1.66 ns. A clear dip at zero delay is observed, with g 2 0 = 0.13 as extracted from the fit. However, the measured correlation function g 2 0 does not achieve its theoretical minimum of zero due to the influence of residual scattered laser light and uncorrelated photon emission from nearby cQDs. The result indicates that the simultaneous emission of two photons is largely suppressed.

4. Discussion

The PL spectra of CdTeSeS cQDs (Figure 4) exhibit a single peak centered at 588 nm, which can be tuned toward the near-infrared by adjusting various experimental parameters. One key factor influencing the emission wavelength is the composition of the QDs. By modifying the ratio of the constituent elements (Cd, Se, Te, and S), the emission wavelength can be shifted. For instance, varying the Se and Te precursor ratios during synthesis can tune the emission peaks of CdSexTe1-xS QDs from 549 nm to 709 nm, depending on the value of x [31]. Another important factor is the size of the QDs. As the QD size increases, the emission peak shifts toward longer wavelengths, a phenomenon known as redshift. This size-dependent behavior can be controlled by adjusting the reaction time, with longer heating times generally leading to larger QDs and a redshifted emission [26,48]. Therefore, the length of the reaction time plays a crucial role in determining both the size of the QDs and the resulting emission wavelength, with longer reaction times typically producing larger QDs with longer emission wavelengths [26,31,48].
This experiment clearly demonstrates single-photon emission from CdTeSeS colloidal core quantum dots (cQDs) at a wavelength of approximately 590 nm, integrated with standard multimode fiber. This achievement highlights the potential of these quantum light sources in advancing quantum communication technologies and other applications. For quantum communication, the ability to produce true single-photon emission is essential for QKD, such as BB84 protocols that do not require indistinguishable photons [49]. While the 590 nm emission wavelength is not in the telecom band, it can be adapted for short-range QKD or combined with wavelength conversion technologies for long-range communication. Additionally, the integration of cQDs with standard multimode fibers simplifies their deployment within existing optical networks, offering a practical path for scaling up quantum communication systems.
Beyond communication, these quantum dots hold promise in other areas of quantum technology. Their precise single-photon emission properties make them suitable for photonic quantum computing, where they can encode and process quantum information. They also have potential in quantum metrology, enabling high-precision sensing and imaging techniques, as well as fundamental experiments in quantum mechanics. With their scalable and cost-effective fabrication, CdTeSeS cQDs could also serve as building blocks for generating entangled photon pairs, which are critical for quantum networking and repeater technologies [50].

5. Conclusions

This study investigates quaternary-alloy CdTeSeS colloidal core quantum dots (cQDs) as compact, room-temperature, fiber-integrated single-photon sources. The second-order correlation function, g 2 τ , of the room-temperature photoluminescence of fiber-integrated CdTeSeS cQDs was measured using a Hanbury–Brown and Twiss setup, yielding a value of g 2 0 = 0.13. Even within coincidence windows ranging from 1 to 7 ns, values remained below 0.5, confirming strong photon antibunching. A method for determining zero-time delay through afterpulsing analysis was also presented. These findings demonstrate that CdTeSeS cQDs can reliably emit single photons, underscoring their potential for secure fiber-based quantum communication and sensing. Future research could explore the stability of CdTeSeS cQDs as single-photon sources in ambient conditions and investigate their performance under pulsed excitation for on-demand single-photon generation.

Funding

This research received no external funding.

Institutional Review Board Statement

Not applicable.

Informed Consent Statement

Not applicable.

Data Availability Statement

Data are contained within the article.

Conflicts of Interest

The author declares no conflicts of interest.

References

  1. Eisaman, M.D.; Fan, J.; Migdall, A.; Polyakov, S.V. Invited Review Article: Single-Photon Sources and Detectors. Rev. Sci. Instrum. 2011, 82, 071101. [Google Scholar] [CrossRef] [PubMed]
  2. Walmsley, I.A. Quantum Optics: Science and Technology in a New Light. Science 2015, 348, 525–530. [Google Scholar] [CrossRef] [PubMed]
  3. Khalid, S.; Laussy, F.P. Perfect Single-Photon Sources. Sci. Rep. 2024, 14, 2684. [Google Scholar] [CrossRef]
  4. Brassard, G.; Lutkenhaus, N.; Mor, T.; Sanders, B.C. Limitations on Practical Quantum Cryptography. Phys. Rev. Lett. 2000, 85, 1330–1333. [Google Scholar] [CrossRef]
  5. Tillmann, M.; Daki?, B.; Heilmann, R.; Nolte, S.; Szameit, A.; Walther, P. Experimental Boson Sampling. Nat. Photonics 2013, 7, 540–544. [Google Scholar] [CrossRef]
  6. Chiangga, S.; Zarda, P.; Jennewein, T.; Weinfurter, H. Towards Practical Quantum Cryptography. Appl. Phys. B 1999, 69, 389–393. [Google Scholar] [CrossRef]
  7. Kwiat, P.G.; Waks, E.; White, A.G.; Appelbaum, I.; Eberhard, P.H. Ultrabright Source of Polarization-Entangled Photons. Phys. Rev. A 1999, 60, R773–R776. [Google Scholar] [CrossRef]
  8. Nayak, K.P.; Le Kien, F.; Morinaga, M.; Hakuta, K. Antibunching and Bunching of Photons in Resonance Fluorescence from a Few Atoms into Guided Modes of an Optical Nanofiber. Phys. Rev. A 2009, 79, 021801. [Google Scholar] [CrossRef]
  9. Nothaft, M.; Höhla, S.; Jelezko, F.; Frühauf, N.; Pflaum, J.; Wrachtrup, J. Electrically Driven Photon Antibunching from a Single Molecule at Room Temperature. Nat. Commun. 2012, 3, 628. [Google Scholar] [CrossRef]
  10. Kurtsiefer, C.; Mayer, S.; Zarda, P.; Weinfurter, H. Stable Solid-State Source of Single Photons. Phys. Rev. Lett. 2000, 85, 290–293. [Google Scholar] [CrossRef]
  11. Senellart, P.; Solomon, G.; White, A. High-performance semiconductor quantum-dot single-photon sources. Nat. Nanotech 2017, 12, 1026–1039. [Google Scholar] [CrossRef] [PubMed]
  12. Shan, G.-C.; Yin, Z.-Q.; Shek, C.H.; Huang, W. Single Photon Sources with Single Semiconductor Quantum Dots. Front. Phys. 2014, 9, 170–193. [Google Scholar] [CrossRef]
  13. García de Arquer, F.P.; Talapin, D.V.; Klimov, V.I.; Arakawa, Y.; Bayer, M.; Sargent, E.H. Semiconductor Quantum Dots: Technological Progress and Future Challenges. Science 2021, 373, eaaz8541. [Google Scholar] [CrossRef] [PubMed]
  14. Huang, S.; Huang, G. The Utilization of Quantum Dot Labeling as a Burgeoning Technique in the Field of Biological Imaging. RSC Adv. 2024, 14, 20884–20897. [Google Scholar] [CrossRef]
  15. Liu, S.; Lin, X.; Liu, F.; Lei, H.; Fang, W.; Jin, C. Observation of Photon Antibunching with Only One Standard Single-Photon Detector. Rev. Sci. Instrum. 2021, 92, 013105. [Google Scholar] [CrossRef]
  16. Hoang, T.B.; Akselrod, G.M.; Mikkelsen, M.H. Ultrafast Room-Temperature Single Photon Emission from Quantum Dots Coupled to Plasmonic Nanocavities. Nano Lett. 2016, 16, 270–275. [Google Scholar] [CrossRef]
  17. Xu, X.; Toft, I.; Phillips, R.T.; Mar, J.; Hammura, K.; Williams, D.A. “Plug and Play” Single-Photon Sources. Appl. Phys. Lett. 2007, 90, 061103. [Google Scholar] [CrossRef]
  18. Schweickert, L.; Jöns, K.D.; Zeuner, K.D.; Covre da Silva, S.F.; Huang, H.; Lettner, T.; Reindl, M.; Zichi, J.; Trotta, R.; Rastelli, A.; et al. On-demand generation of background-free single photons from a solid-state source. Appl. Phys. Lett. 2018, 112, 093106. [Google Scholar] [CrossRef]
  19. Osypiw, A.R.C.; Lee, S.; Jung, S.-M.; Leoni, S.; Smowton, P.M.; Hou, B.; Kim, J.M.; Amaratunga, G.A.J. Solution-Processed Colloidal Quantum Dots for Light Emission. Mater. Adv. 2022, 3, 6773–6790. [Google Scholar] [CrossRef]
  20. Ngan, K.; Zhan, Y.; Dory, C.; Vučković, J.; Sun, S. Quantum Photonic Circuits Integrated with Color Centers in Designer Nanodiamonds. Nano Lett. 2023, 23, 9360–9366. [Google Scholar] [CrossRef]
  21. Fedorych, O.; Kruse, C.; Ruban, A.; Hommel, D.; Bacher, G.; Kümmell, T. Room Temperature Single Photon Emission from an Epitaxially Grown Quantum Dot. Appl. Phys. Lett. 2012, 100, 061114. [Google Scholar] [CrossRef]
  22. Rakhlin, M.; Sorokin, S.; Kazanov, D.; Sedova, I.; Shubina, T.; Ivanov, S.; Mikhailovskii, V.; Toropov, A. Bright Single-Photon Emitters with a CdSe Quantum Dot and Multimode Tapered Nanoantenna for the Visible Spectral Range. Nanomaterials 2021, 11, 916. [Google Scholar] [CrossRef]
  23. Rozenman, G.G.; Peisakhov, A.; Zadok, N. Dispersion of Organic Exciton Polaritons-a Novel Undergraduate Experiment. Eur. J. Phys. 2022, 43, 035301. [Google Scholar] [CrossRef]
  24. Buckley, S.; Rivoire, K.; Vučković, J. Engineered Quantum Dot Single-Photon Sources. Rep. Prog. Phys. 2012, 75, 126503. [Google Scholar] [CrossRef]
  25. Messin, G.; Hermier, J.P.; Giacobino, E.; Desbiolles, P.; Dahan, M. Bunching and Antibunching in the Fluorescence of Semiconductor Nanocrystals. Opt. Lett. 2001, 26, 1891–1893. [Google Scholar] [CrossRef]
  26. Muñoz-Matutano, G.; Barrera, D.; Fernández-Pousa, C.R.; Chulia-Jordan, R.; Seravalli, L.; Trevisi, G.; Frigeri, P.; Sales, S.; Martínez-Pastor, J. All-Optical Fiber Hanbury Brown &Twiss Interferometer to Study 1300 Nm Single Photon Emission of a Metamorphic InAs Quantum Dot. Sci. Rep. 2016, 6, 27214. [Google Scholar] [CrossRef]
  27. Vajner, D.A.; Rickert, L.; Gao, T.; Kaymazlar, K.; Heindel, T. Quantum Communication Using Semiconductor Quantum Dots. Adv. Quantum Technol. 2022, 5, 2100116. [Google Scholar] [CrossRef]
  28. Jeon, W.B.; Moon, J.S.; Kim, K.-Y.; Ko, Y.-H.; Richardson, C.J.K.; Waks, E.; Kim, J.-H. Plug-and-play Single-photon Devices with Efficient Fiber-quantum Dot Interface. Adv. Quantum Technol. 2022, 5, 2200022. [Google Scholar] [CrossRef]
  29. Adegoke, O.; Nyokong, T.; Forbes, P.B.C. Structural and optical properties of alloyed quaternary CdSeTeS core and CdSeTeS/ZnS core–shell quantum dots. J. Alloys Compd. 2015, 645, 443–449. [Google Scholar] [CrossRef]
  30. Adegoke, O.; Nyokong, T.; Forbes, P.B.C. Photophysical properties of a series of alloyed and non-alloyed water-soluble l-cysteine-capped core quantum dots. J. Alloys Compd. 2017, 695, 1354–1361. [Google Scholar] [CrossRef]
  31. Yang, F.; Xu, Z.; Wang, J.; Zan, F.; Dong, C.; Ren, J. Microwave-assisted aqueous synthesis of new quaternary-alloyed CdSeTeS quantum dots; and their bioapplications in targeted imaging of cancer cells: New quaternary-alloyed CdSeTeS quantum dots. Luminescence 2013, 28, 392–400. [Google Scholar] [CrossRef] [PubMed]
  32. Prabhakaran, P.; Kim, W.J.; Lee, K.-S.; Prasad, P.N. Quantum Dots (QDs) for Photonic Applications. Opt. Mater. Express 2012, 2, 578. [Google Scholar] [CrossRef]
  33. Kurtsiefer, C.; Zarda, P.; Mayer, S.; Weinfurter, H. The Breakdown Flash of Silicon Avalanche Photodiodes-Back Door for Eavesdropper Attacks? J. Mod. Opt. 2001, 48, 2039–2047. [Google Scholar] [CrossRef]
  34. Brown, R.H.; Twiss, R.Q. Correlation between Photons in two Coherent Beams of Light. Nature 1956, 177, 27–29. [Google Scholar] [CrossRef]
  35. Liao, L.; Zhang, H.; Zhong, X. Facile Synthesis of Red-to Near-Infrared-Emitting CdTexSe1-x Alloyed Quantum Dots via a Noninjection One-Pot Route. J. Lumin. 2011, 131, 322–327. [Google Scholar] [CrossRef]
  36. Gao, F.; Wang, Y.; Liu, J.; Huang, Q.; Hu, Z.; Tang, M.; Liu, H. Optical fiber antenna employing quantum dots as gas molecule receptors. Sens. Actuators B Chem. 2022, 367, 132036. [Google Scholar] [CrossRef]
  37. Brouri, R.; Beveratos, A.; Poizat, J.P.; Grangier, P. Photon Antibunching in the Fluorescence of Individual Color Centers in Diamond. Opt. Lett. 2000, 25, 1294–1296. [Google Scholar] [CrossRef]
  38. Michler, P.; Kiraz, A.; Becher, C.; Schoenfeld, W.V.; Petroff, P.M.; Zhang, L.; Hu, E.; Imamoglu, A. A Quantum Dot Sin-gle-Photon Turnstile Device. Science 2000, 290, 2282–2285. [Google Scholar] [CrossRef]
  39. Michler, P.; Imamoglu, A.; Mason, M.D.; Carson, P.J.; Strouse, G.F.; Buratto, S.K. Quantum Correlation among Photons from a Single Quantum Dot at Room Temperature. Nature 2000, 406, 968–970. [Google Scholar] [CrossRef]
  40. Lounis, B.; Bechtel, H.A.; Gerion, D.; Alivisatos, P.; Moerner, W.E. Photon Antibunching in Single CdSe/ZnS Quantum Dot Fluorescence. Chem. Phys. Lett. 2000, 329, 399–404. [Google Scholar] [CrossRef]
  41. Koehler-Sidki, A.; Dynes, J.F.; Paraïso, T.K.; Lucamarini, M.; Sharpe, A.W.; Yuan, Z.L.; Shields, A.J. Backflashes from Fast-Gated Avalanche Photodiodes in Quantum Key Distribution. Appl. Phys. Lett. 2020, 116, 154001. [Google Scholar] [CrossRef]
  42. Marini, L.; Camphausen, R.; Eggleton, B.J.; Palomba, S. Deterministic Filtering of Breakdown Flashing at Telecom Wavelengths. Appl. Phys. Lett. 2017, 111, 213501. [Google Scholar] [CrossRef]
  43. Texas Instruments. “User’s Guide, TDC7201-ZAXEVM” SNAU198A, May 2016. Available online: https://www.ti.com/lit/ug/snau198a/snau198a.pdf (accessed on 4 January 2025).
  44. Huang, C.-H.; Wen, Y.-H.; Liu, Y.-W. Measuring the Second Order Correlation Function and the Coherence Time Using Random Phase Modulation. Opt. Express 2016, 24, 4278–4288. [Google Scholar] [CrossRef] [PubMed]
  45. Lukishova, S.G.; Schmid, A.W.; McNamara, A.J.; Boyd, R.W.; Stroud, C.R. Room Temperature Single-Photon Source: Single-Dye Molecule Fluorescence in Liquid Crystal Host. IEEE J. Sel. Top. Quantum Electron. 2003, 9, 1512–1518. [Google Scholar] [CrossRef]
  46. Fishman, R.E.K.; Patel, R.N.; Hopper, D.A.; Huang, T.-Y.; Bassett, L.C. Photon-Emission-Correlation Spectroscopy as an Analytical Tool for Solid-State Quantum Defects. PRX Quantum 2023, 4, 010202. [Google Scholar] [CrossRef]
  47. PerkinElmer SPCM-AQ4C Single Photon Counting Module Array, Data Sheet, PerkinElmer. 2005. Available online: https://www.excelitas.com/product/spcm-aq4c (accessed on 4 January 2025).
  48. Pan, Z.; Zhao, K.; Wang, J.; Zhang, H.; Feng, Y.; Zhong, X. Near infrared absorption of CdSe(x)Te(1-x) alloyed quantum dot sensitized solar cells with more than 6% efficiency and high stability. ACS Nano 2013, 7, 5215–5222. [Google Scholar] [CrossRef]
  49. Bennett, C.H.; Brassard, G. Quantum cryptography: Public-key distribution and coin tossing. In Proceedings of the IEEE International Conference on Computers, Systems, and Signal Processing, Bangalore, India, 9–12 December 1984; IEEE: New York, NY, USA, 1984; pp. 175–179. [Google Scholar]
  50. O’Brien, J.L.; Furusawa, A.; Vučković, J. Photonic Quantum Technologies. Nat. Photonics 2009, 3, 687–695. [Google Scholar] [CrossRef]
Figure 1. Schematic of the experimental setup for photoluminescence measurement.
Photonics 12 00052 g001
Figure 2. Schematic diagram of the setup. A stream of photons is incident on a beam splitter, directing them to single-photon counting detectors, D1 (start) and D2 (stop). The output pulses from D1 and D2 are fed into the start and stop inputs of a time-to-digital converter (TDC), which records the time interval between photon detection events.
Photonics 12 00052 g002
Figure 3. Schematic diagram of the setup. LD: laser diode, QDs: CdTeSeS colloidal core quantum dots, FC: fiber collimator, F: filter, APD: avalanche photodetector, TDC: time-to-digital converter.
Photonics 12 00052 g003
Figure 4. Color map of (a) the 405 nm laser diode spectra and (b) the photoluminescence spectra of CdTeSeS core quantum dots in a methanol solution.
Photonics 12 00052 g004
Figure 5. (a) Histogram of time delays between photon pairs with a time bin width of 12 ns. (b) Zero delay time as a function of bin width in nanoseconds.
Photonics 12 00052 g005
Figure 6. Measured second-order correlation function, g 2 τ , showing single-photon antibunching with g 2 0 = 0.13 . The solid line represents a fit based on Equation (3).
Photonics 12 00052 g006
Disclaimer/Publisher’s Note: The statements, opinions and data contained in all publications are solely those of the individual author(s) and contributor(s) and not of MDPI and/or the editor(s). MDPI and/or the editor(s) disclaim responsibility for any injury to people or property resulting from any ideas, methods, instructions or products referred to in the content.

