Article

Research on Sugar Concentration Sensing Based on Real-Time Polarization and Interaction Effects

1
School of Optoelectronic Engineering, Guilin University of Electronic Technology, Guilin 541004, China
2
Guangxi Key Laboratory of Optoelectronic Information Processing, Guilin 541004, China
*
Author to whom correspondence should be addressed.
Photonics 2025, 12(4), 308; https://doi.org/10.3390/photonics12040308
Submission received: 17 February 2025 / Revised: 22 March 2025 / Accepted: 26 March 2025 / Published: 27 March 2025

Abstract

:
This paper presents a non-contact method for detecting the sugar concentration in solutions based on real-time polarization characteristics and an interaction effects model. The feasibility of using polarization imaging technology for sugar concentration detection is analyzed. By analyzing the Stokes parameters, a linear regression model is developed to establish the interaction effects between sugar concentration and both the degree of linear polarization (DoLP) and the angle of linear polarization (AoLP). A three-beam polarization imaging system is used to simultaneously capture the polarization images of sucrose solutions with varying concentrations, and the SIFT algorithm is employed to eliminate image shifts. The results show a strong linear correlation between sugar concentration and both AoLP (R2 = 0.998) and DoLP (R2 = 0.968). The addition of the interaction effect model significantly improves the prediction accuracy, with an RMSE of 0.36934 and a relative error within ±5%. This method features a simple experimental setup, enables multi-angle simultaneous measurements, and offers advantages such as non-contact operation, ease of use, and high precision (average relative error < 5%). It provides a new approach for sugar concentration detection in food, industry, and other fields.

1. Introduction

The sugar concentration of a solution (i.e., the mass of dissolved sugar in a unit volume of solution) is a key parameter in food processing, medical testing, and chemical production, directly affecting the product’s physicochemical properties and quality stability [1,2,3]. For example, high-sugar foods are more resistant to storage due to their low water activity, while low-sugar products are more prone to microbial contamination [4]. In the medical field, blood glucose level measurement plays a crucial role in disease diagnosis and guiding proper medication. Especially with the growing prevalence of chronic conditions such as diabetes, glucose monitoring has become a vital tool for controlling the sugar concentration in food and safeguarding public health [5,6]. However, traditional measurement methods (such as colorimetry [7] and optical low-coherence interferometry [8]) require the strict control of experimental conditions and are susceptible to interference from environmental factors, meaning that they have difficulty meeting the fast detection needs of food, industrial, and other scenarios. Therefore, developing a non-contact, high-precision, and easy-to-operate method for sugar concentration measurement is of urgent importance.
Currently, various innovative sugar concentration detection methods have been developed. For example, Aksorn, J. et al. [9] used colorimetry to develop an integrated multi-enzyme system based on a microfluidic paper-based analysis device combined with smartphone imaging and color gradient algorithms, enabling the simultaneous colorimetric detection and accurate quantification of sucrose, fructose, and glucose. Thomason, S. J. et al. [10] utilized dielectric spectroscopy to measure the dielectric response of solutions with different sugar concentrations, and the experimental results revealed a significant correlation between the dielectric response parameters and the sugar concentration. Dhaulaniya, A. S. et al. [11] established an analytical model combining Fourier transform infrared spectroscopy (FTIR) with chemometrics to accurately detect the adulteration of apple juice with the inexpensive additive sucrose. These methods show significant advantages in terms of detection sensitivity, multi-target analysis capabilities, and specificity. However, these existing methods also have certain limitations, such as cumbersome and time-consuming measurement processes, which are not suitable for real-time detection and cannot meet the urgent needs of fast screening and real-time monitoring in the food industry.
In recent years, optical polarization technology has become a research hotspot for sugar concentration detection due to its non-contact nature and strong anti-interference capabilities. Both sucrose and its hydrolysis products (fructose and glucose) exhibit optical rotation. When linearly polarized light passes through a sugar-containing solution, the direction of polarization rotates, and the angle of rotation is positively correlated with the sugar concentration [12,13]. Compton, R. N. et al. [14] utilized a laser light scattering method to observe the propagation of linearly polarized light and the variation in scattering intensity with path length in sucrose solutions. This method demonstrates the phenomenon of optical rotation dispersion (ORD) and is used to measure the specific rotation of sucrose at different wavelengths. However, this method is limited to merely demonstrating the ORD phenomenon and only considers the specific rotation as a single variable related to sugar concentration. This method can involve human error during optical path calibration and detector movement, preventing the more precise quantification of sugar concentration. Yu Zhenfang et al. [15] designed a dual-modulation polarization detection system, employing the synergistic mechanism of laser modulation and Faraday modulation. This system achieved a linear relationship between the mixed-frequency signal generated by dual-frequency modulation and the glucose concentration within the range of 0–600 mg/dL, enabling the accurate detection of glucose concentration in samples. However, the system used an 830 nm infrared laser, which has a narrow wavelength range and lacks universality. Xu Ting et al. [16] analyzed the Faraday magneto-optical rotation characteristics of a mixed solution of glucose and its oxidase using a 532 nm laser polarization detection system, confirming that the optical rotation angle increases linearly with both magnetic induction strength and glucose concentration. However, this method also uses a single-wavelength light source which lacks universality, and the integrated magnetic field device depends on the stability of the magnetic field, which could introduce errors from external electromagnetic interference. Additionally, the experimental conditions are relatively strict.
This paper proposes a non-contact sugar concentration measurement method based on Stokes parameters and an interaction effect model. Through multi-angle synchronous imaging with a fixed polarization direction, the variations in the angle of linear polarization (AoLP) and the degree of linear polarization (DoLP) with the sugar concentration are directly obtained. The interaction effect linear regression model is then used to achieve the high-precision prediction of sugar concentration. Experimental results show that this method is less constrained by laboratory conditions, and the experimental apparatus and sample solutions are relatively easy to obtain, providing a feasible solution for rapid detection in food, industrial, and other applications.

2. Materials and Methods

2.1. Simultaneous Division-of-Amplitude Polarization Imaging System

To achieve the dynamic detection of the sugar concentration in solutions, this study employs a Simultaneous Division-of-Amplitude Polarization Imaging System to acquire high-precision polarization information [17]. The system synchronously captures polarization images of the target at three fixed polarization directions (0°, 45°, and 90°) with a single exposure, thus avoiding the timing errors that occur in traditional methods due to the manual rotation of polarizers or movement of the target. Its core advantage lies in the stable design of the spectral division module—where the light intensity distribution across the three imaging channels is 35%, 35%, and 30%, respectively. This ensures the synchronized calculation accuracy of the polarization parameters ( I , Q , U , V ) T , meeting the need for rapid and non-destructive detection.

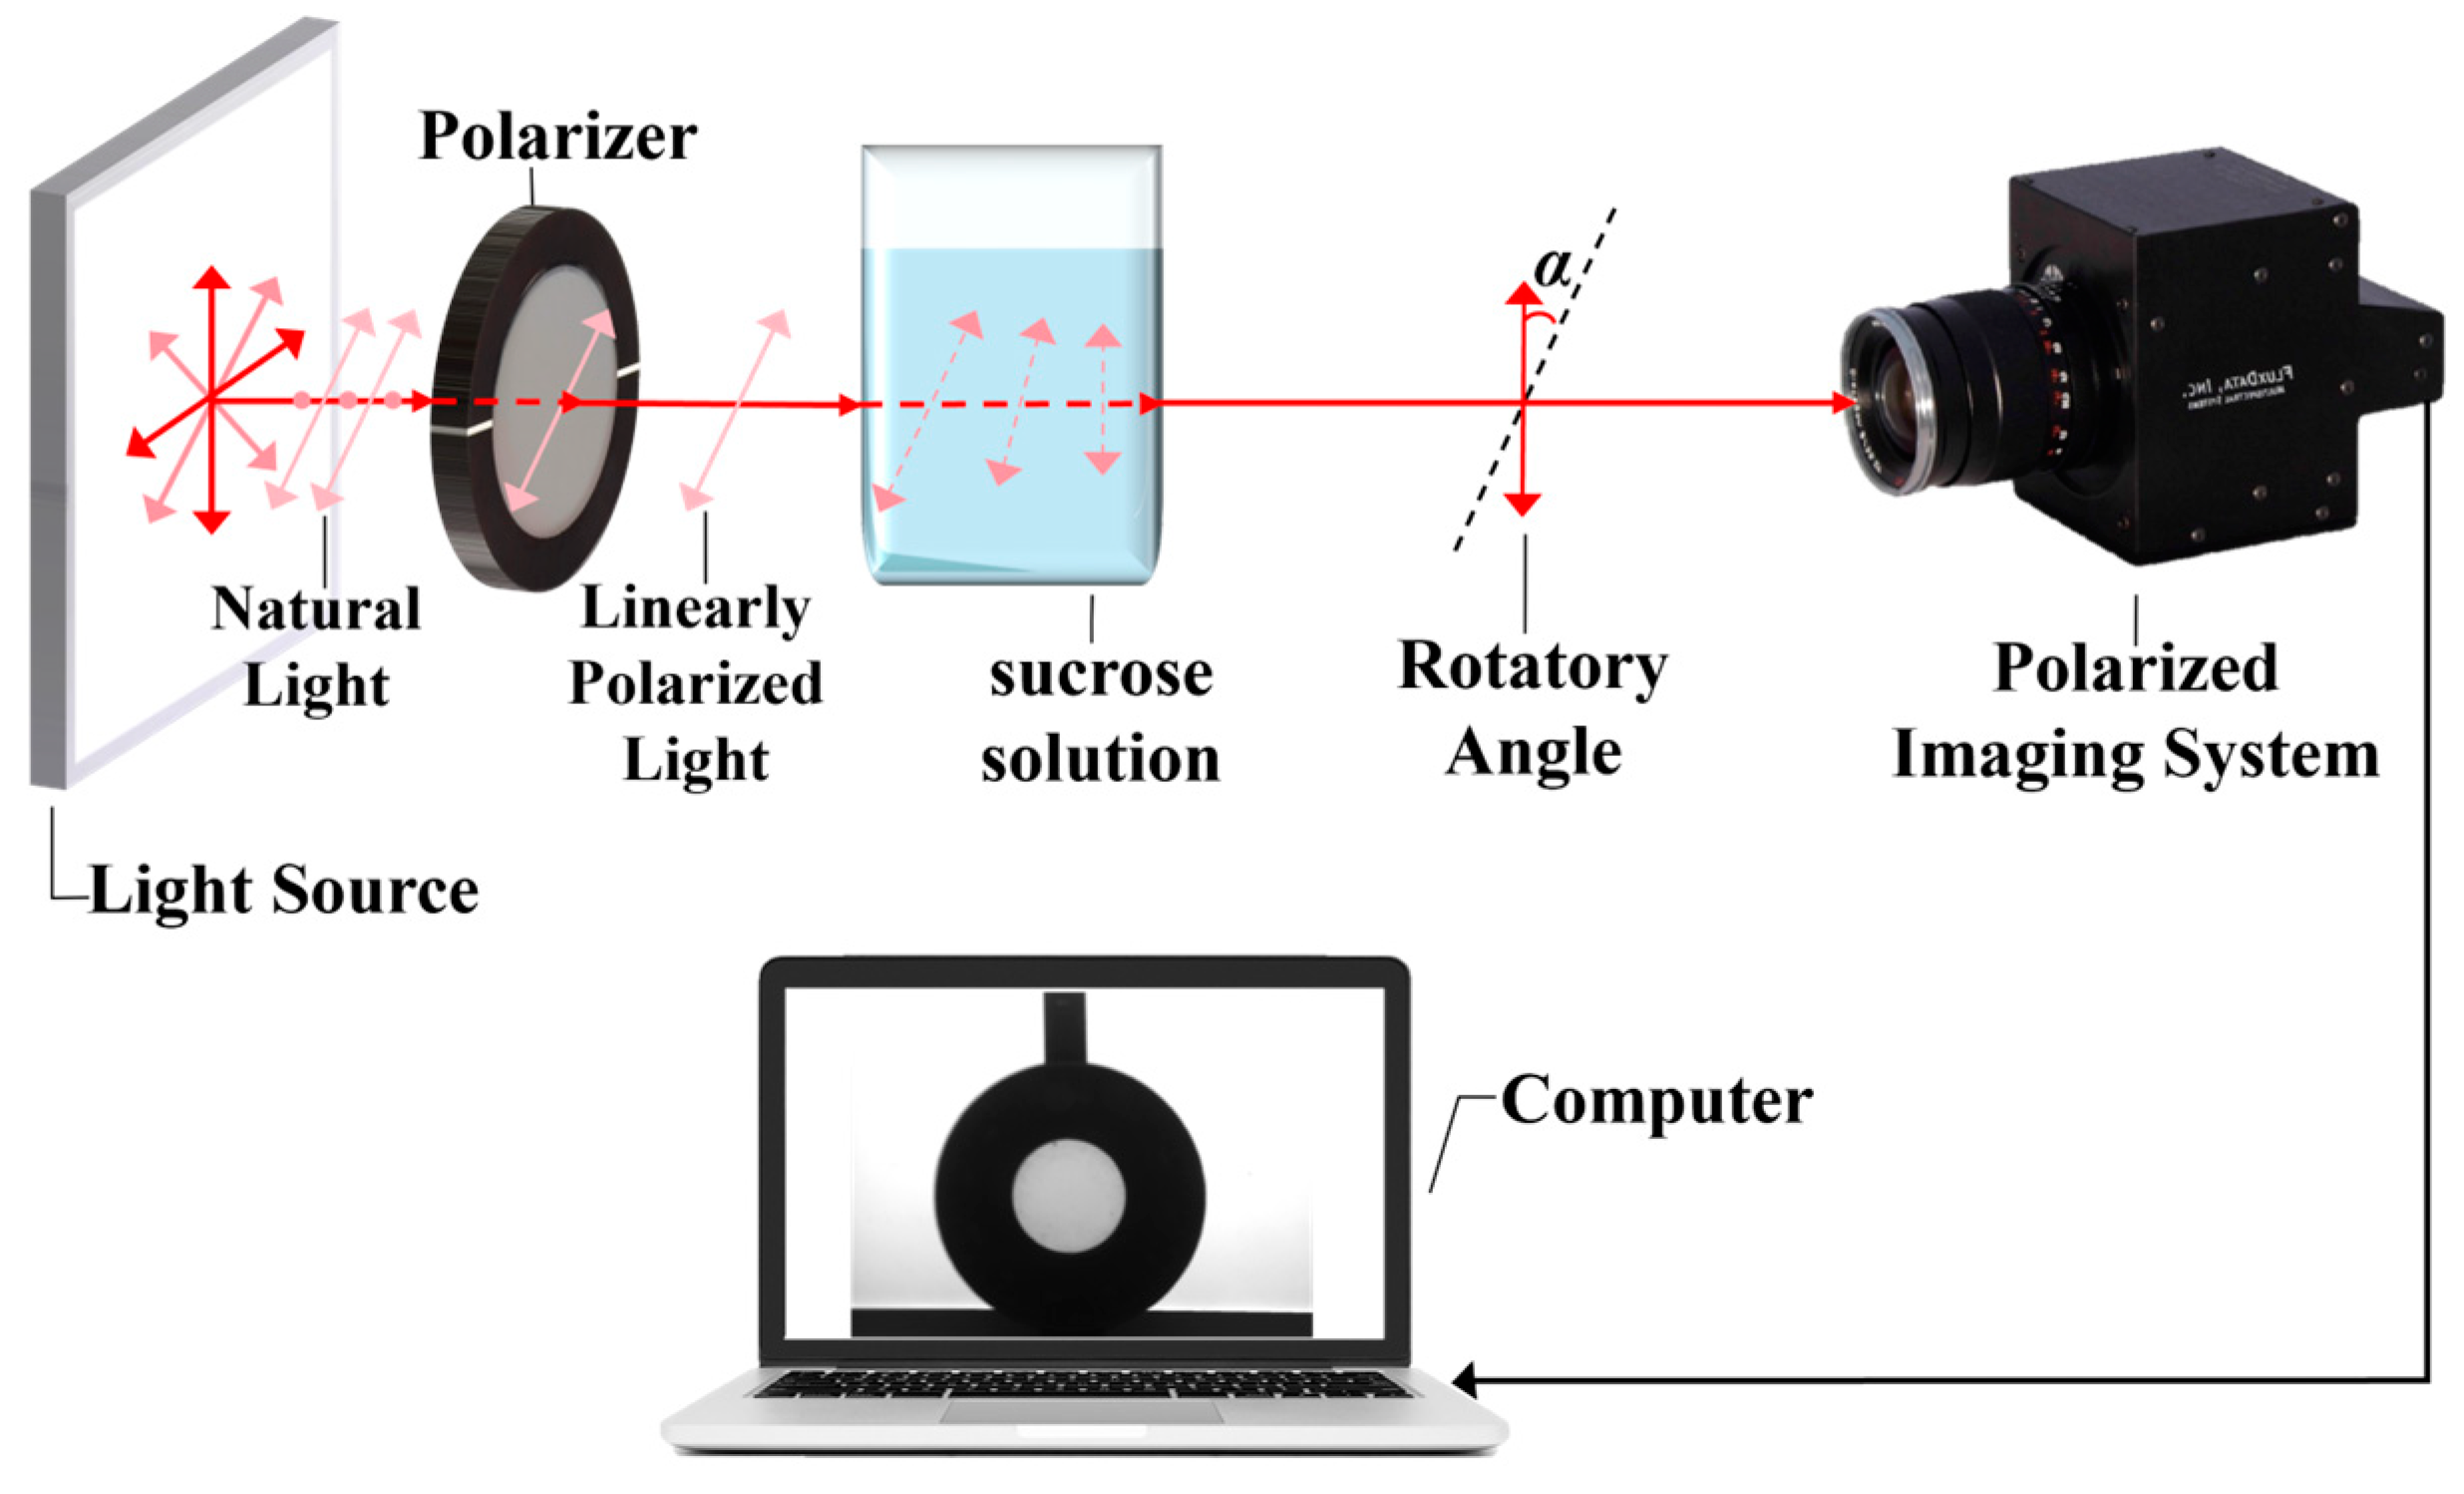
2.2. Experimental Principle

In real-time polarization-based detection of sugar in solutions, the Stokes vector can describe fully polarized light, partially polarized light, and fully unpolarized light, making it more comprehensive than other vectors. Therefore, the Stokes vector is chosen to describe the polarization information of the polarized light in this experiment [18]. When using the Stokes vector to fully describe the polarization state of light, it is usually necessary to introduce two important parameters: DoLP (abbreviated as P) and AoLP (abbreviated as θ).
The Stokes vector is typically represented in the form of ( I , Q , U , V ) T , where I represents the intensity of unpolarized light, which is related to the incident light intensity; Q and U represent linearly polarized light in the 0° and 45° directions, respectively; and V represents circularly polarized light. In this study, the light emitted by the light source passes through a polarizer and then through a sucrose solution before entering the polarization camera. The information captured by the polarization camera is that of linearly polarized light. Since the sucrose solution is an optically active substance, it does not alter the linear polarization characteristics of the light. Therefore, the information does not include circularly polarized light, and so V is set to 0 in the actual calculations [19]. The transmitted light intensity after the incident light passes through an ideal polarizer can be expressed using the Stokes vector, as follows [20]:
I ( α ) = 1 2 ( I + Q cos 2 α + U sin 2 α )
In the formula, α represents the azimuthal angle of the polarizer, which is the angle between the polarizer’s maximum transmission axis and the incident plane of the light source, with a range of [0°, 180°]. By rotating the polarizer to three or four different angles, the three Stokes parameters I, Q, and U can be determined. For convenience in the calculations, specific polarizer orientation angles are typically selected for the experiment. Based on the experimental setup in the laboratory, polarizer orientation angles of 0°, 45°, and 90° are often chosen, which can then be used to obtain [21]:
I = I ( 0 ) + I ( 90 ) Q = I ( 0 ) I ( 90 ) U = 2 I ( 45 ) I ( 0 ) I ( 90 ) ,
The degree of linear polarization (P) and the angle of linear polarization (θ) of the sample sucrose solution can be further derived from Equation (2), as follows:
P = Q 2 + U 2 I ( 0 P 1 ) θ = 1 2 arctan ( U Q )
The degree of polarization, P, ranges from [0, 1] and is defined as the ratio of the total intensity of the polarized component of the light wave to the total light intensity. The polarization angle, θ, is measured in degrees (°), and can be either positive or negative. A negative value indicates that the polarization direction of the light is opposite to the reference direction. The influence of this characteristic of the polarization angle will be explained in detail in the subsequent regression model calculations.

2.3. Sample Preparation

In this study, the sucrose solution samples to be tested are prepared by dissolving white sugar (with a sucrose concentration of 99%) in laboratory-grade purified water. The container used to hold the sucrose solution sample to be tested is a transparent, colorless cubic glass cup. The wall thickness of the cup is 0.1 cm, its length is 5 cm, its width is 5 cm, and its height is 15 cm. The volume is approximately 400 mL. Sucrose is gradually added in specific amounts to the purified water, resulting in a total of 32 different samples with varying sugar concentrations. The concentrations range from 0 g/dL to 20 g/dL (with sucrose added in increments of 1 g each time) and from 20 g/dL to 50 g/dL (with sucrose added in increments of 5 g each time).

2.4. Experimental Setup

The experiment is conducted using a three-way polarized imaging system (FD-1665P, Sony ICX28 sensor) produced by Flux Data Inc. (Rochester, NY, USA), along with its accompanying software, Pylon Viewer (pylon_7.0.0.24651). The instrument features three imaging channels with fixed polarization angles, allowing for the simultaneous capturing of polarized images at three polarization azimuths. It offers a high signal-to-noise ratio, high precision, and strong stability, greatly simplifying the operation process and improving the efficiency of extracting polarization information.
Considering the stability of the light source and in order to meet the requirements of polarization imaging experiments, this study selects a commonly available LED panel light source that can effectively fulfill the experimental needs. The parameters of the light source are as follows: the luminous area is 30 cm × 30 cm, the color temperature is 6500 K, and it operates in the visible light spectrum.

2.5. Experimental Methods

After setting up the experimental platform, place the glass cup containing the sucrose solution to be measured at the focal plane of the imaging system. Adjust the distance between the LED panel light source and the glass cup to an appropriate level, ensuring that the incident light axis coincides with the optical axis of the imaging system. Once the light source is turned on, the incident light passes through a polarizer to form linearly polarized light, which then transmits through the glass cup containing the sucrose solution, forming a light spot on its surface.
The experimental steps are as follows: (1) Set up the experimental system according to the multi-angle polarization imaging system schematic shown in Figure 1. (2) Start the three-beam multi-angle polarization imaging system and its accompanying Pylon Viewer software. (3) Turn on the light source, select the 90° observation direction in the software, and rotate the polarizer until the brightness level reaches its darkest, achieving the extinction state, with the polarizer angle set to 90°. (4) Use a beaker to take 200 mL of pure water and place it into the glass cup, then prepare a sucrose solution by adding the required amount of sucrose to achieve the desired concentration. Once the liquid surface stabilizes, simultaneously capture the three-channel polarization images (0°, 45°, 90°), repeating the data collection three times for each concentration. (5) Perform image distortion geometric correction and image registration preprocessing on the acquired polarization image data to eliminate the offset errors from the original images and extract the central region of the images (200 × 150 pixels). (6) Use the Stokes vector to calculate the angle of linear polarization (θ) and the degree of linear polarization (P).

2.6. Modeling

The 32 samples (with sucrose concentrations ranging from 0 to 50 g/dL) are randomly divided into a training set (26 samples) and a validation set (6 samples) at a 4:1 ratio, forming the experimental group. Based on the experimental group, two sets of test samples are prepared: one with sucrose concentrations ranging from 0 g/dL to 20 g/dL (with 1 g increments), and the other with concentrations ranging from 20 g/dL to 50 g/dL (with 5 g increments), resulting in a total of 32 different sugar concentration levels, which are used to evaluate the model’s generalization ability. The interaction effect linear regression model used is as follows [22]:
Y = β 0 + β 1 X 1 + β 2 X 2 + β 3 X 1 X 2 + e ,
where Y represents the predicted value of the dependent variable; X1 and X2 are the independent variables; β0, β1, β2, and β3 are the regression coefficients; and X1X2 represents the interaction terms. The residual term e is assumed to follow a normal distribution, e ~ N ( 0 , σ 2 ) , where σ represents the population variance of the residuals. In this study, the solution’s sugar level is the dependent variable Y, and the angle of linear polarization (θ) and the degree of linear polarization (P) are the independent variables X1 and X2, respectively. Additionally, the R2, Mean Squared Error (MSE), Root Mean Squared Error (RMSE), and Mean Absolute Error (MAE) for both the validation and test groups are used to assess the model’s performance.

3. Results and Discussions

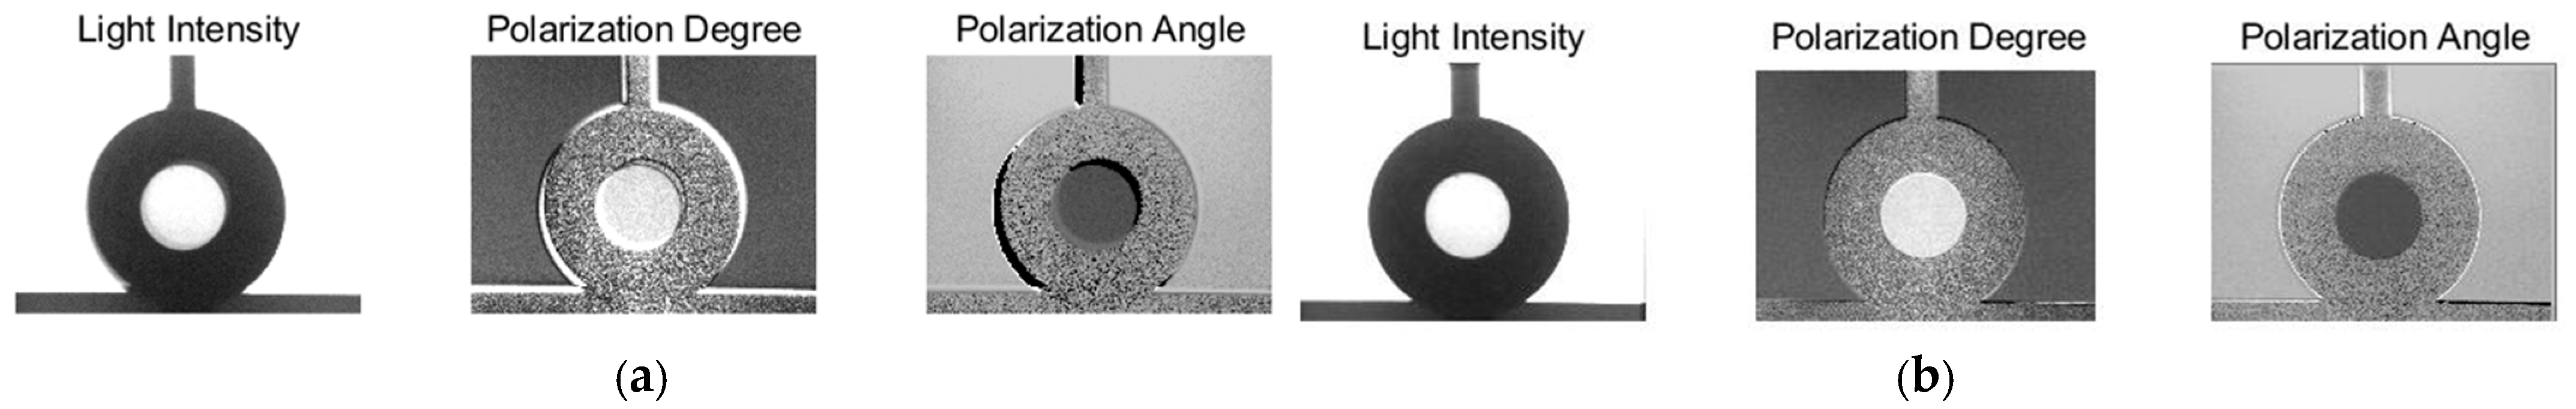
3.1. Image Alignment

The preliminary substitution of the original polarization images into the Stokes vector calculation reveals a shift in the calculated intensity, polarization angle, and polarization degree of the images, leading to large errors in the results. The three-channel polarization imaging camera used in this experiment is typically influenced by factors such as photosensitive surface materials and the manufacturing process, which cause differences in the response speed of the probe’s pixels. The transmittance of various polarization analyzers and the response speed of detectors also differ, and various uncontrollable factors prevent the imaging system from ensuring proper light splitting according to a reasonable 35%, 35%, and 30% ratio. Therefore, before extracting valid data, image registration of the original polarization images at three different polarization angles is necessary to obtain standardized image data and ensure the accuracy of the values for I(0°), I(45°), and I(90°).
The Scale Invariant Feature Transform (SIFT) algorithm is a method for finding extrema in the spatial scale and extracting their position, scale, rotation invariance, and other local features. It is widely recognized as one of the best methods for feature point registration [23]. In this experiment, after image registration using the SIFT algorithm, the polarization images in each direction overlap well. The polarization information images before and after registration are shown in Figure 2.

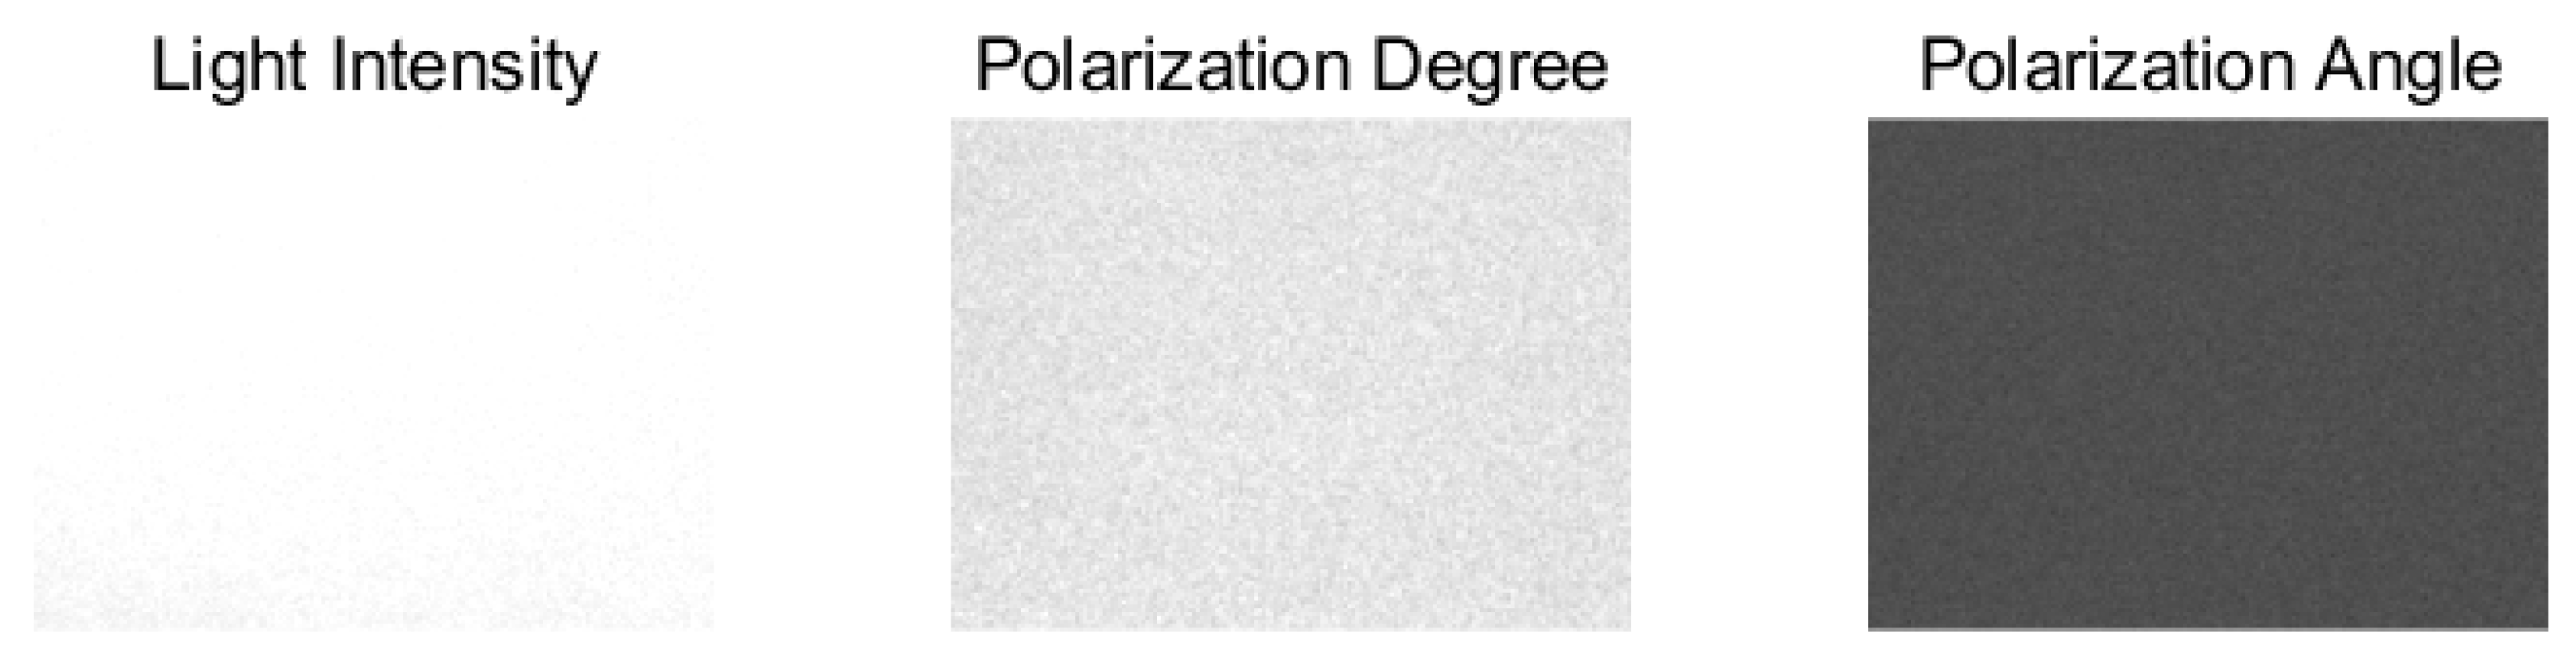
3.2. Value Calculation
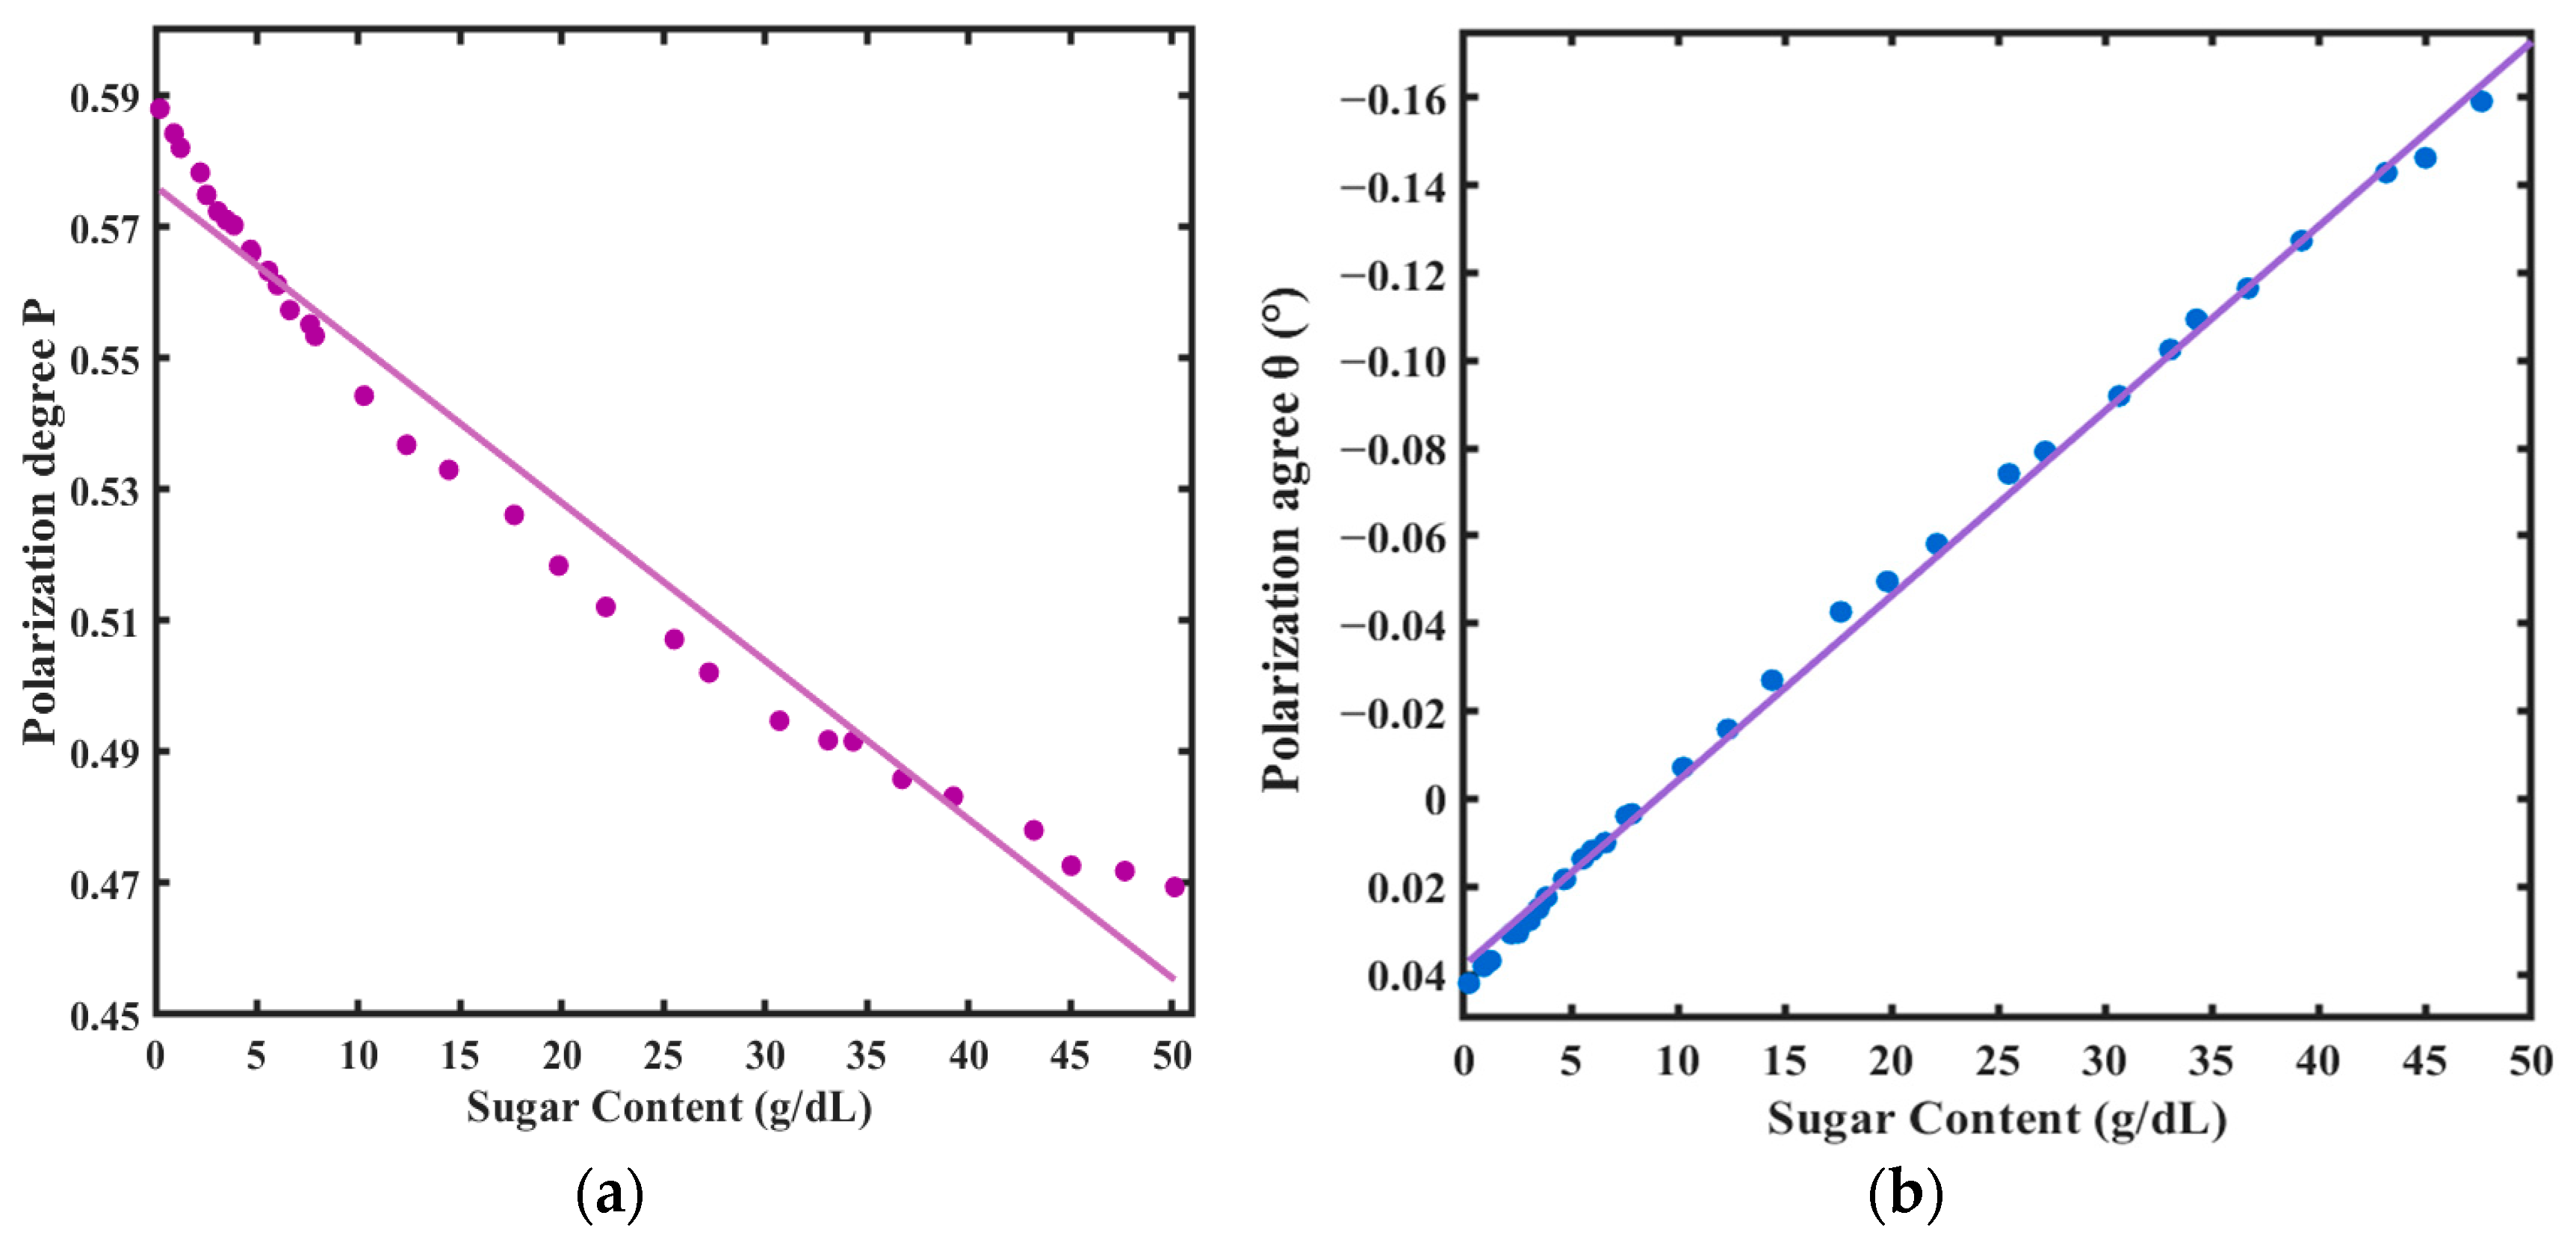
For all of the registered polarization images, the same location and region of equal size are selected for extracting valid data, with a total of 30,000 pixel values. The average of these 30,000 pixel values is then calculated to obtain the average (P) and average (θ) for each polarization direction at each sugar concentration level. The extracted region is shown in Figure 3. The valid data obtained are then used in the Stokes algorithm to calculate the corresponding I(0°), I(45°), I(90°), P, and θ for each sugar concentration level.

3.3. Linear Fitting

In order to make the data more intuitive, the relationship between the sucrose solution sugar level, the angle of linear polarization (θ), and the degree of linear polarization (P) are analyzed by linear fitting, as shown in Figure 4, with the parameters of the fitting indices shown in Table 1.
The linear fitting parameters in Table 1 and the results from the linear fitting in Figure 4a indicate a strong linear correlation between the sugar concentration of the sucrose solution and the degree of linear polarization (P). The coefficient of determination R2 is 0.9677, indicating a very high goodness of fit for this regression model. However, this value is slightly smaller than that of the relationship between the angle of linear polarization (θ) and the sugar concentration, suggesting that the degree of linear polarization (P) has a slightly smaller effect on the sugar concentration of the solution compared to the angle of linear polarization (θ). The covariance is −0.6277, indicating a negative correlation between the sugar concentration of the solution and the degree of linear polarization (P). This means that as the sugar concentration of the sucrose solution increases, the degree of linear polarization (P) gradually decreases.
The linear fitting parameters in Table 1 and the results from the linear fitting in Figure 4b indicate a strong linear correlation between the sugar concentration of the sucrose solution and the angle of linear polarization (θ). The coefficient of determination R2 is 0.9980, indicating a very high goodness of fit for this regression model, which is close to 1 and aligns with the optical rotation property of the sucrose solution. The covariance is −1.0880. As previously mentioned, the polarization angle can be positive or negative, with the negative value simply indicating that the direction of polarization is opposite to the reference direction. Therefore, despite the negative covariance, the data still suggest a positive correlation between the sugar concentration of the solution and the angle of linear polarization (θ). This means that as the sugar concentration of the sucrose solution increases, the angle of linear polarization (θ) gradually increases.

3.4. Interaction Linear Effect Regression Model

Although the basic linear fitting results show a certain linear relationship between the solution’s sugar concentration, DoLP, and AoLP, when considering only a single variable, the error remains relatively large, and it does not intuitively meet the requirement of accurately predicting the solution’s sugar concentration using polarization information. Therefore, based on this, this study comprehensively considers both DoLP and AoLP, and employs an interaction linear effect regression model to improve the prediction accuracy.
Interaction effects refer to the effect generated when two or more factors depend on each other and interact [24]. The concept of interaction effects can also be expressed through the mode of interaction effects (additive or multiplicative modes). Currently, the most common approach is to include product terms in the regression equation for analysis, generally considering the linear regression model as an additive model, with the product term reflecting whether there is an additive interaction effect between the factors [25].
The experimental group data from the previous work are used as the input, with the angle of linear polarization (θ) set as the independent variable X1, the degree of linear polarization (P) as the independent variable X2, and the solution’s sugar concentration as the dependent variable Y. A cross-validation method is used to train the regression model, evaluating its generalization ability on different datasets. The accuracy of the model is validated by calculating metrics such as Root Mean Squared Error (RMSE) and Mean Squared Error (MSE). Then, the polarization data obtained from the test group are input into the trained model, with the output being the predicted sugar concentration value. The model’s predictive ability is verified by comparing the actual sugar concentration with the predicted values. The resulting interaction linear regression model is as follows:
Y = 74 . 398 - 618 . 63 × θ - 119 . 7 × P + 910 . 47 × ( θ × P ) + e ,
where Y represents the sugar concentration of the solution, with the unit in g/dL; and e ~ N ( 0 , 1 ) .
The coefficient of the polarization angle θ (−618.63) is affected by the sign of θ, as mentioned earlier. A negative sign indicates that the polarization direction of the light is opposite to the reference direction. Therefore, this coefficient suggests that when other variables remain constant, an increase of 1° in θ will result in an increase of 618.63 g/dL in the sugar concentration Y of the solution. In other words, θ has a positive correlation with the sugar content Y of the solution, and the effect of each unit change on Y is significant, which is consistent with the previous linear fitting trend.
The coefficient of the polarization degree P (−119.7) indicates that, when other variables are held constant, each unit increase in the polarization degree P will result in a decrease of 119.7 g/dL in the sugar concentration Y of the solution. In other words, the polarization degree P has a negative correlation with the sugar concentration Y. Compared to the polarization angle θ, the effect of P on Y is smaller, which is consistent with the linear fitting trend discussed earlier.
The coefficient of the interaction term between θ and P (910.47) indicates that their interaction has a significant effect on the solution’s sugar concentration Y. The interaction term being positive suggests that when both θ and P change simultaneously, the resulting change in the sugar concentration Y is greater than when either variable changes independently. The presence of the interaction term implies that θ and P do not affect the sugar concentration Y independently; rather, their combination produces an additional effect.
The error metrics for the validation and test groups in the obtained models are shown in Table 2.
The error metrics of the validation group model perform excellently. The RMSE is 0.37982, which is relatively low, indicating that the difference between the model’s predicted values and the actual values is small. The MSE is 0.14431, showing that the squared difference between the predicted and true values is also small. The R2 value is 0.99826, demonstrating an excellent fit. The MAE is 0.27724, which means that the average deviation of the model’s predicted values is approximately 0.27 g/dL, further reflecting the model’s strong performance.
The error metrics of the test set also perform well, with a slight decrease compared to the validation set. The RMSE is 0.36934, which is 3% lower than the validation set, meeting the requirement of the error metrics within a ±5% range. The MSE is 0.14095, which is 2% lower than the validation set. The R2 value is 0.98331, indicating the good fit of the model on the test set. The MAE is 0.27523, which is 1% lower than the validation set. Overall, the relative error between the validation and test sets is within the ±5% range, suggesting that the model generalizes well to new unseen data and performs stably.
In order to more intuitively and clearly reflect the relationship between the true and predicted sugar content values, fitting is performed on the true and predicted values, as shown in Figure 5a. It can be seen that the predicted sugar content values match the true values better than the results obtained by using DoLP and AoLP (optical rotation effect method) alone, as shown in Figure 4. The percentage error of the predicted sugar content values compared to the true values, as shown in Figure 5b, is within ±3%, which meets the requirement that the model error should be less than ±5%.

4. Conclusions

This paper proposes a non-contact method to measure a solution’s sugar concentration based on real-time polarization characteristics and an interaction effect model. By using a simultaneous amplitude-modulated polarization imaging system to synchronously capture the polarization images of sucrose solutions with varying sugar concentrations, the SIFT algorithm is employed to eliminate image offsets. Stokes parameters are then used to extract DoLP and AoLP as the core feature parameters.
The experimental results indicate the following: (1) The sugar concentration of the solution shows a significant linear correlation with AoLP (R2 = 0.998) and DoLP (R2 = 0.968), and with AoLP having a dominant effect on the sugar concentration, which aligns with the theory of sucrose optical rotation. (2) After introducing the interaction effect model, the synergistic effect between the polarization parameters is quantified, significantly improving the prediction accuracy with the RMSE of the test set being 0.36934 and the relative error being within ±3%; (3) The method used in this experiment is minimally affected by environmental factors, features a simple optical path, and is easy to operate. It enables non-contact detection, with an average relative error of less than 5%.
This study provides a feasible solution for rapid detection in scenarios such as food and industrial applications. Future work will further explore the impact of external factors, such as ambient light, temperature variations, and impurities in the solution, on the polarization measurements.

Author Contributions

Conceptualization, Q.G. and X.W.; methodology, Q.G.; software, T.L.; validation, Q.G. and T.L.; formal analysis, X.W.; investigation, Q.G.; resources, S.Y.; data curation, Q.G. and T.L.; visualization, Q.G.; writing—original draft preparation, Q.G.; writing—review and editing, T.L.; supervision, X.W.; project administration, S.Y.; funding acquisition, S.Y. All authors have read and agreed to the published version of the manuscript.

Funding

This work was supported by The National Key Research and Development Program of China (No. 2022YFB3901800, No. 2022YFB3901803).

Institutional Review Board Statement

Not applicable.

Informed Consent Statement

Not applicable.

Data Availability Statement

The data presented in this study are available on request from the corresponding author due to the sensitive nature of the research and the confidential nature of the data.

Acknowledgments

We would like to express our sincere gratitude to all those who have supported us throughout this research. In particular, we would like to thank Chuanpei Xu for her invaluable expertise and guidance, which have been crucial in shaping the direction of this study. Her insights and support have significantly contributed to the success of this work.

Conflicts of Interest

The authors declare no conflicts of interest.

References

  1. Zhao, Y.; Li, B.-R.; Mo, F.-Z.; Niu, X.-W.; Min, T. Accurate sugar concentration measurements based on optical inspection technology. J. Tsinghua Univ. (Sci. Technol.) 2006, 46, 477–479,487. [Google Scholar]
  2. Tian, X.; Chen, L.; Wang, Q.; Li, J.; Yang, Y.; Fan, S.; Huang, W. Optimization of online detection model for whole apple sugar concentration using full transmission near-infrared spectroscopy. Spectrosc. Spectr. Anal. 2022, 6, 1907–1914. [Google Scholar]
  3. Wojtczak, M.; Antczak, A.; Lisik, K. Starch concentration in various types of cane sugars as a criterion of quality and authenticity. Int. J. Food Prop. 2014, 17, 610–616. [Google Scholar] [CrossRef]
  4. Ozana, N.; Arbel, N.; Beiderman, Y.; Mico, V.; Sanz, M.; Garcia, J.; Anand, A.; Javidi, B.; Epstein, Y.; Zalevsky, Z. Improved noncontact optical sensor for detection of glucose concentration and indication of dehydration level. Biomed. Opt. Express 2014, 5, 1926–1940. [Google Scholar] [PubMed]
  5. Emily, E.V.; Jaimie, N.D.; Michael, I.G. Sugar Concentration of Popular Sweetened Beverages Based on Objective Laboratory Analysis: Focus on Fructose Concentration. Obesity 2011, 19, 868–874. [Google Scholar]
  6. Jindahra, P.; Phumpradab, P. Label copresence for healthier choices: How sugar concentration per daily limit and sugar warning labels balance out the health halos of nutrient-concentration claim. Food Qual. Prefer. 2023, 107, 104853. [Google Scholar] [CrossRef]
  7. Brasiunas, B.; Popov, A.; Ramanavicius, A.; Ramanaviciene, A. Gold nanoparticle based colorimetric sensing strategy for the determination of reducing sugars. Food Chem. 2021, 351, 129238. [Google Scholar] [PubMed]
  8. Zhang, H.; Chen, M.-H.; Li, Z.-Y.; Wang, C.; Zheng, G. The measurement of the concentration of glucose solution by using optical low coherence interferometry. Opt. Tech. 2018, 44, 287. [Google Scholar]
  9. Aksorn, J.; Teepoo, S. Development of the simultaneous colorimetric enzymatic detection of sucrose, fructose and glucose using a microfluidic paper-based analytical device. Talanta 2020, 207, 120302. [Google Scholar]
  10. Thomason, S.J.; Bialkowski, K.S. Dielectric spectroscopy based determination of sugar concentration in solution. IEEE Sens. Lett. 2019, 3, 1–4. [Google Scholar] [CrossRef]
  11. Dhaulaniya, A.S.; Balan, B.; Yadav, A.; Jamwal, R.; Kelly, S.; Cannavan, A.; Singh, D.K. Development of an FTIR based chemometric model for the qualitative and quantitative evaluation of cane sugar as an added sugar adulterant in apple fruit juices. Food Addit. Contam. Part A 2020, 37, 539–551. [Google Scholar]
  12. Chen, T.-L.; Lo, Y.-L.; Liao, C.-C.; Phan, Q.-H. Noninvasive measurement of glucose concentration on human fingertip by optical coherence tomography. J. Biomed. Opt. 2018, 23, 1–9. [Google Scholar]
  13. Gomez, P.; Hernandez, C. High-accuracy universal polarimeter measurement of optical activity and birefringence of α-quartz in the presence of multiple reflections. JOSA B 1998, 15, 1147–1154. [Google Scholar]
  14. Compton, R.N.; Mahurin, S.M.; Zare, R.N. Demonstration of Optical Rotatory Dispersion of Sucrose. J. Chem. Educ. 1999, 76, 1234. [Google Scholar]
  15. Yu, Z.-F.; Qiu, Q.; Guo, Y. Dual modulation optical polarimetry for glucose monitoring. Acta Opt. Sin. 2016, 36, 0117001. [Google Scholar]
  16. Xu, T.; Peng, Y.-F.; Han, X.-Y. Research on glucose concentration sensing based on Faraday rotation effect. J. Optoelectron.·Laser 2021, 32, 173–180. [Google Scholar]
  17. Wang, Y.; Su, Y.; Sun, X.; Hao, X.; Liu, Y.; Zhao, X.; Yang, J. Principle and implementation of stokes vector polarization imaging technology. Appl. Sci. 2022, 12, 6613. [Google Scholar] [CrossRef]
  18. Xue, P.; Wang, Z.-B.; Zhang, R.; Wang, Y.-L.; Liu, S. Highly efficient measurement technology based on hyper-spectropolarimetric imaging. Chin. J. Lasers 2016, 43, 107–128. [Google Scholar]
  19. Goldstein, D.; Goldstein, D.H. Stokes Polarization Parameters: 5.3 Stokes Vector. In Polarized Light, 2nd ed.; CRC Press: Boca Raton, FL, USA, 2003; Chapter 5; pp. 59–67. [Google Scholar]
  20. Ye, S.; Ma, Y.; Zhang, Y.-T.; Li, S.; Wang, X.-Q.; Wang, F.-Y. Research on camouflage target recognition method based on polarization fusion. Laser J. 2020, 10, 25–28. [Google Scholar]
  21. Ren, L.-Y.; Liang, J.; Qu, E.-S.; Zhang, W.-F.; Du, B.-J.; Ma, F.-Y.; Guo, S.-B.; Zhang, J. Polarimetric optical imaging: Devices, technologies, and applications (Invited). Acta Photonica Sin. 2022, 51, 0851505. [Google Scholar]
  22. Paternina-Arboleda, C.D.; Agudelo-Castañeda, D.; Voß, S.; Das, S. Towards cleaner ports: Predictive modeling of sulfur dioxide shipping emissions in maritime facilities using machine learning. Sustainability 2023, 15, 12171. [Google Scholar] [CrossRef]
  23. Lakshmi, K.D.; Vaithiyanathan, V. Image registration techniques based on the scale invariant feature transform. IETE Tech. Rev. 2017, 34, 22–29. [Google Scholar]
  24. Mize, T.D. Best practices for estimating, interpreting, and presenting nonlinear interaction effects. Sociol. Sci. 2019, 6, 81–117. [Google Scholar]
  25. Xu, L.; Deng, Y.-J. Spatiotemporal pattern evolution and driving factors of brucellosis in China, 2003–2019. Int. J. Environ. Res. Public Health 2022, 19, 10082. [Google Scholar] [CrossRef] [PubMed]
Figure 1. Schematic diagram of the sugar concentration detection system for the solutions using multi-angle polarization imaging.
Photonics 12 00308 g001
Figure 2. Polarization information images before and after image registration: (a) before the registration process, and (b) after the registration process.
Photonics 12 00308 g002
Figure 3. Crop the valid data portion of the image.
Photonics 12 00308 g003
Figure 4. The figure illustrates the linear fittings of the solutions’ sugar concentrations with both the polarization degree and polarization angle, respectively: (a) the sugar concentration of the solution and the degree of linear polarization (P) exhibit a linear fit; and (b) the sugar concentration of the solution and the angle of linear polarization (θ) and exhibit a linear fit.
Photonics 12 00308 g004
Figure 5. (a) The fitting between the actual sugar concentration values and the predicted sugar concentration values. (b) Percentage error between the predicted and actual values.
Photonics 12 00308 g005
Table 1. Linear fit indicator parameters.
VariableRegression EquationUncertainty SE ( β ^ )R2Covariance
Polarization Degree P y = 0.0024 x + 0.5762 −0.0024 ± 0.00020.9677−0.6277
0.5762 ± 0.0019
Polarization Angle θ (°) y = 0.0042 x + 0.038 0.0042 ± 0.00010.9980−1.0880
0.0380 ± 0.0008
Table 2. Parameters of the interaction effect linear regression model.
Indicator ParametersValidationTestError Metrics (<±5%)
RMSE (g/dL)0.379820.36934−3%
MSE (g/dL)20.144310.14095−2%
R20.998260.98331−2%
MAE (g/dL)0.277240.27523−1%
Disclaimer/Publisher’s Note: The statements, opinions and data contained in all publications are solely those of the individual author(s) and contributor(s) and not of MDPI and/or the editor(s). MDPI and/or the editor(s) disclaim responsibility for any injury to people or property resulting from any ideas, methods, instructions or products referred to in the content.

