Article

Sizing Single Gold Nanoparticles with Bright-Field Microscopy

by
Antonio Sotelo-López
1,
Salvador Mendoza-Acevedo
2,
José Abraham Balderas-López
1,* and
Braulio Gutiérrez-Medina
3,*
1
Departamento de Ciencias Básicas, Unidad Profesional Interdisciplinaria de Biotecnología, Instituto Politécnico Nacional, Av. Acueducto, La Laguna Ticomán, Gustavo A. Madero, Mexico City 07340, Mexico
2
Centro de Nanociencias y Micro y Nanotecnologías, Unidad Profesional Adolfo López Mateos, Instituto Politécnico Nacional, Av. Luis Enrique Erro S/N, Zacatenco, Gustavo A. Madero, Mexico City 07738, Mexico
3
Division of Advanced Materials, Instituto Potosino de Investigación Científica y Tecnológica, Camino a la Presa San José 2055, San Luis Potosí 78216, Mexico
*
Authors to whom correspondence should be addressed.
Photonics 2025, 12(4), 314; https://doi.org/10.3390/photonics12040314
Submission received: 20 February 2025 / Revised: 15 March 2025 / Accepted: 20 March 2025 / Published: 28 March 2025

Abstract

:
We present an experimental procedure for determining the diameter of spherical gold nanoparticles (AuNPs) using a basic bright-field microscopy apparatus. We achieved high-contrast imaging by constructing a bright-field microscopy system with ultrabright LEDs (incorporating low-cost components), employing Köhler illumination near the coherence limit, and using digital processing to perform image averaging and background subtraction. Our system allows for the detection of 80 nm, 150 nm, and 300 nm diameter AuNPs immobilized on functionalized glass substrates. Through-focus images of the particles show characteristic contrast inversion, from where we find a nearly linear relationship between the minimum intensity contrast and particle diameter (as determined from scanning electron microscopy) for the three sizes studied and for three different illumination wavelengths covering the corresponding AuNP plasmon band (λ = 460 nm, 520 nm, and 620 nm). This behavior was found to be consistent with the corresponding scattering and absorption cross-sections of the AuNPs under the illumination wavelengths considered.

1. Introduction

Nanoparticles have diverse applications in scientific research, spanning fields like biology, chemistry, physics, materials engineering, pharmaceuticals, and healthcare [1,2,3]. The consumer nanotechnology industry has also incorporated nanoparticles into various commercial products. Precise control of nanoparticle size and functionalization is crucial across all applications, emphasizing the importance of thorough characterization, both during synthesis and after functionalization or complex formation [4].
Traditional characterization techniques for nanoparticles, like UV–Vis, DLS, TEM, SEM, and AFM, have been supplemented with alternative methods like nanoparticle tracking analysis (NTA) [5,6], photothermal techniques [7], and microfluidics [4,8]. These alternatives are especially useful for polydisperse colloids or functionalized nanoparticles, overcoming some limitations of the traditional techniques [9].
Photon microscopy techniques continue to find applications in biomedicine and microbiology, providing real-time visualization of microorganisms using fluorescent markers. Interferometric techniques like phase-contrast microscopy (PCM), differential interference contrast microscopy (DIC), and interferometric scattering microscopy (iSCAT) have evolved, enabling marker-free microscopy and the visualization of single molecules [10,11,12]. iSCAT, in particular, has significantly advanced research in nanoscience and biology due to its ability to detect metallic nanoparticles [13]. Unlike fluorescence-based techniques, which present limitations such as sample light saturation, interferometry-based microscopy allows for the control of the photon flux and improves the temporal and spatial resolution. Recent developments in such techniques have led to the detection of nanoparticles as small as 5 nm in aqueous media [14]. The detection of nanometric objects through light scattering depends not on the emission of photons from the sample itself but on the intensity of the light interacting with the object and its effective scattering cross-section (SCS). Whereas dark-field microscopy depends purely on the light scattered by the object while the background light is rejected, interferometric techniques, such as iSCAT, take the background light as a reference for detecting the object of interest [15]. Recent advancements in DIC microscopy have shown that it can be modified to selectively image plasmonic nanoparticles, such as gold nanoparticles (AuNPs), by exploiting their wavelength-dependent contrast near plasmon resonances (PRs). This allows for the high-contrast imaging of NPs within a narrow spectral band, enabling the differentiation from other subcellular features, which is useful for live-cell imaging applications [16].
One challenge that remains is the possibility of correlating the detection signal with the particle size. Previous attempts to meet this need include differential interference contrast microscopy, where DIC is used at two different illumination wavelengths to correlate the image contrast with the particle size [16], and widefield extinction microscopy [17], where the particle size is obtained through measurements of extinction cross-sections. As an alternative, traditional bright-field microscopy (BF) with improved contrast, including background subtraction and through-focus scanning, offers valuable advantages, enabling the marker-free imaging of phase objects [18] and the detection of strong scatterers, such as metallic nanoparticles, for prolonged periods at the nanometric scale. Moreover, BF is universally available and can provide excellent image contrast with low-cost elements (such as LEDs and motorized translation stages). Here, we explore the BF imaging of AuNPs at three illumination wavelengths, finding a linear relationship of the image contrast with the size of the particles as determined with SEM microscopy. We discuss a low-cost, homemade microscopy setup, immobilizing AuNPs on functionalized glass surfaces and relating the image contrast with the particle size. Finally, we provide insight into our experimental observations from Mie’s theory of light scattering from small particles.

2. Materials and Methods

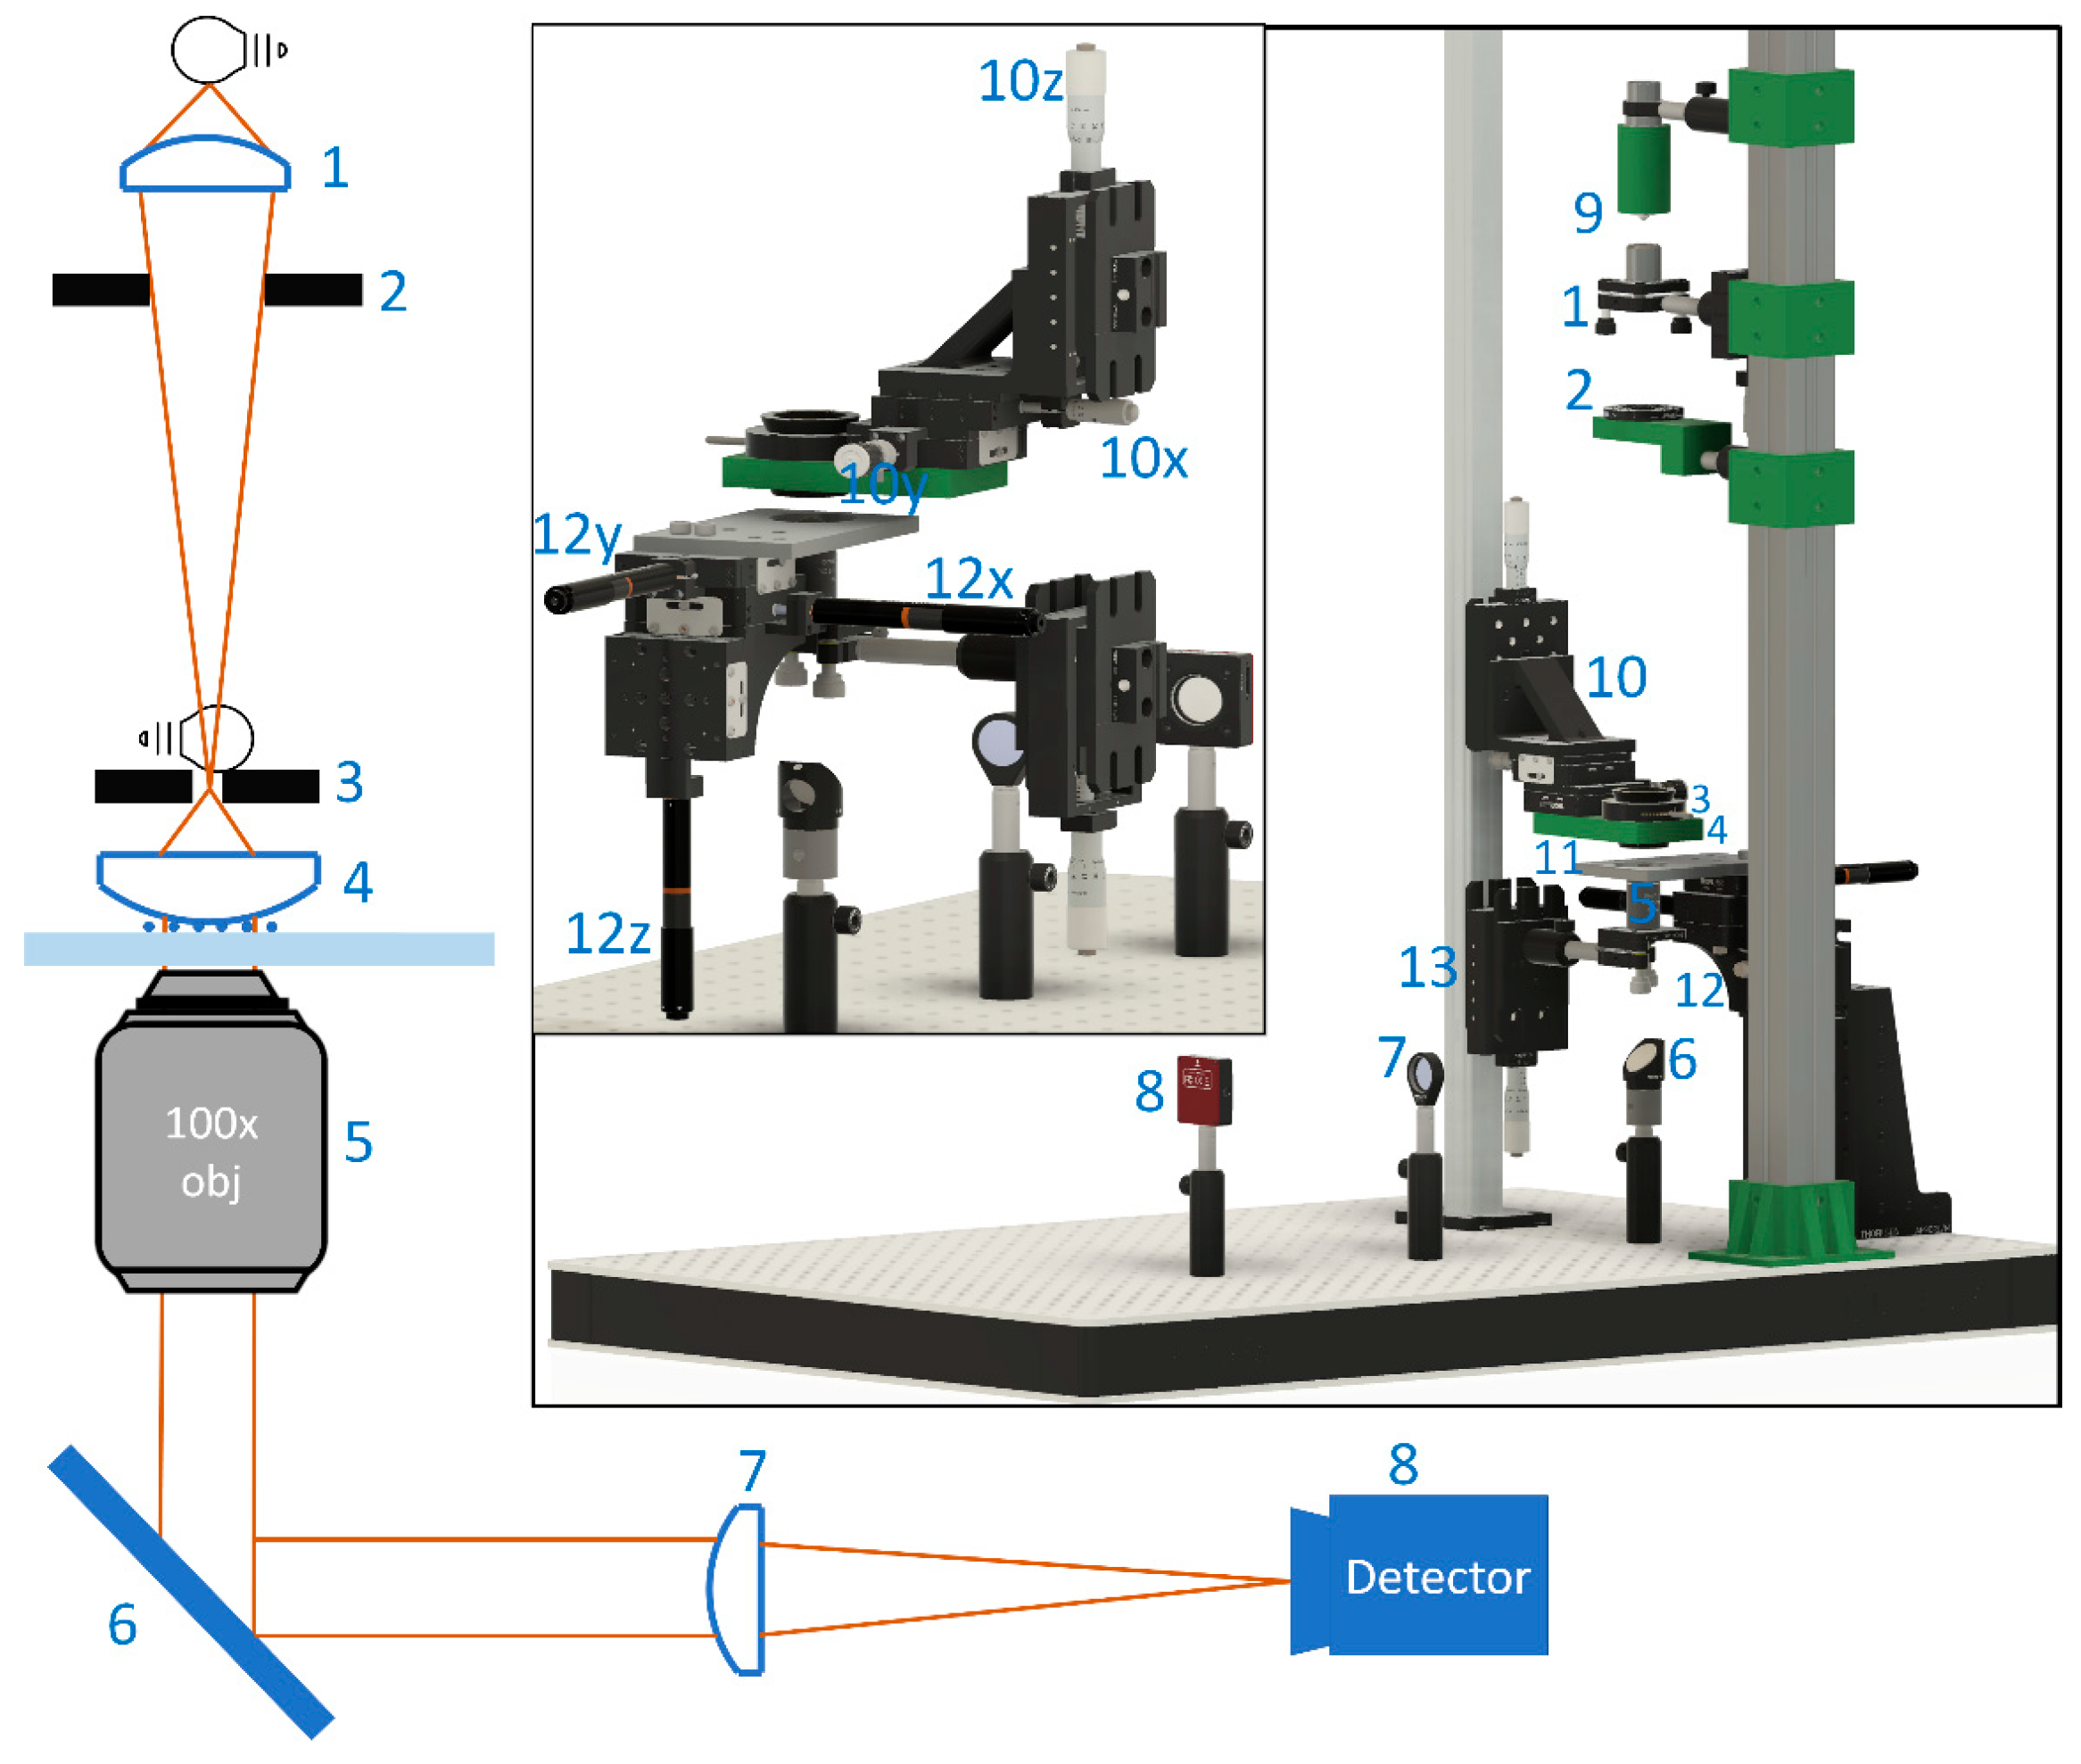
2.1. Microscopy System and Image Acquisition

An inverted, bright-field microscope was built (Figure 1) featuring three 3-W ultra-bright LEDs as the illumination light source, with wavelengths centered at λ = 460 nm, 520 nm, and 620 nm. To attain the standard Köhler illumination, the light source and the condenser diaphragm were placed at conjugated planes through a wide-field lens (Figure 1, L1; f = 15 mm), resulting in a plane wavefront illumination transmitted across the sample. To maximize the image contrast, the oil immersion condenser (Figure 1, L2) (1.4 NA) was used with the condenser diaphragm aperture nearly closed; we estimated that the effective NA of the condenser was NAcond ~ 0.1, which is near the coherent illumination limit. The sample was mounted on a steel platform to provide mechanical stability, driven by a 3-axis motorized translation stage (Figure 1, inset, element 7) (MT3-Z8, Thorlabs, Newton, NJ, USA), and we used a 100× infinite-corrected immersion objective, with the numerical aperture NAobj = 1.25 (Figure 1, L3) (Velab, Mexico City, Mexico). The image of the sample was formed with an f = 150 mm plano-concave lens (Figure 1, L4) and detected with a 10-bit, monochromatic CMOS camera (Zelux CS165MU/M, Thorlabs). The system provides uniform illumination over a 46 µm × 34.5 µm field of view. A camera exposure time of 12 ms was used throughout. For all of the illumination wavelengths and AuNP sizes, the intensity of the illumination light was adjusted to attain a background of 768-pixel counts (averaged over the entire field of view).
A custom-made routine in C# was written to control the instrument (with image acquisition and stage control using Thorlabs APIs to address the motors of the XYZ stage; Z812B, Thorlabs). After the user sets the position where the sample plane is in focus (z = 0), the program automatically captures a 10 × 10 matrix of images in ΔX,Y = 5 µm step increments in the XY plane, just below the in-focus plane (z = −20 µm). These images are averaged to obtain a single background plane, which is later subtracted from each acquired frame. Next, a stack of 100 through-focus images is acquired, each generated by averaging 20 background-free frames. The z-stack planes are taken from z = −10 µm to z = 10 µm relative to the in-focus plane in steps of ΔZ = 0.2 µm. The entire routine takes ~12 min for aquiring and processing one field of view, including 2100 captured frames for averaging and background subtraction. Flowcharts for background and z-stack through-focus acquisition algorithms are shown in Figure S1 and Figure S2, respectively (Supplementary Materials).

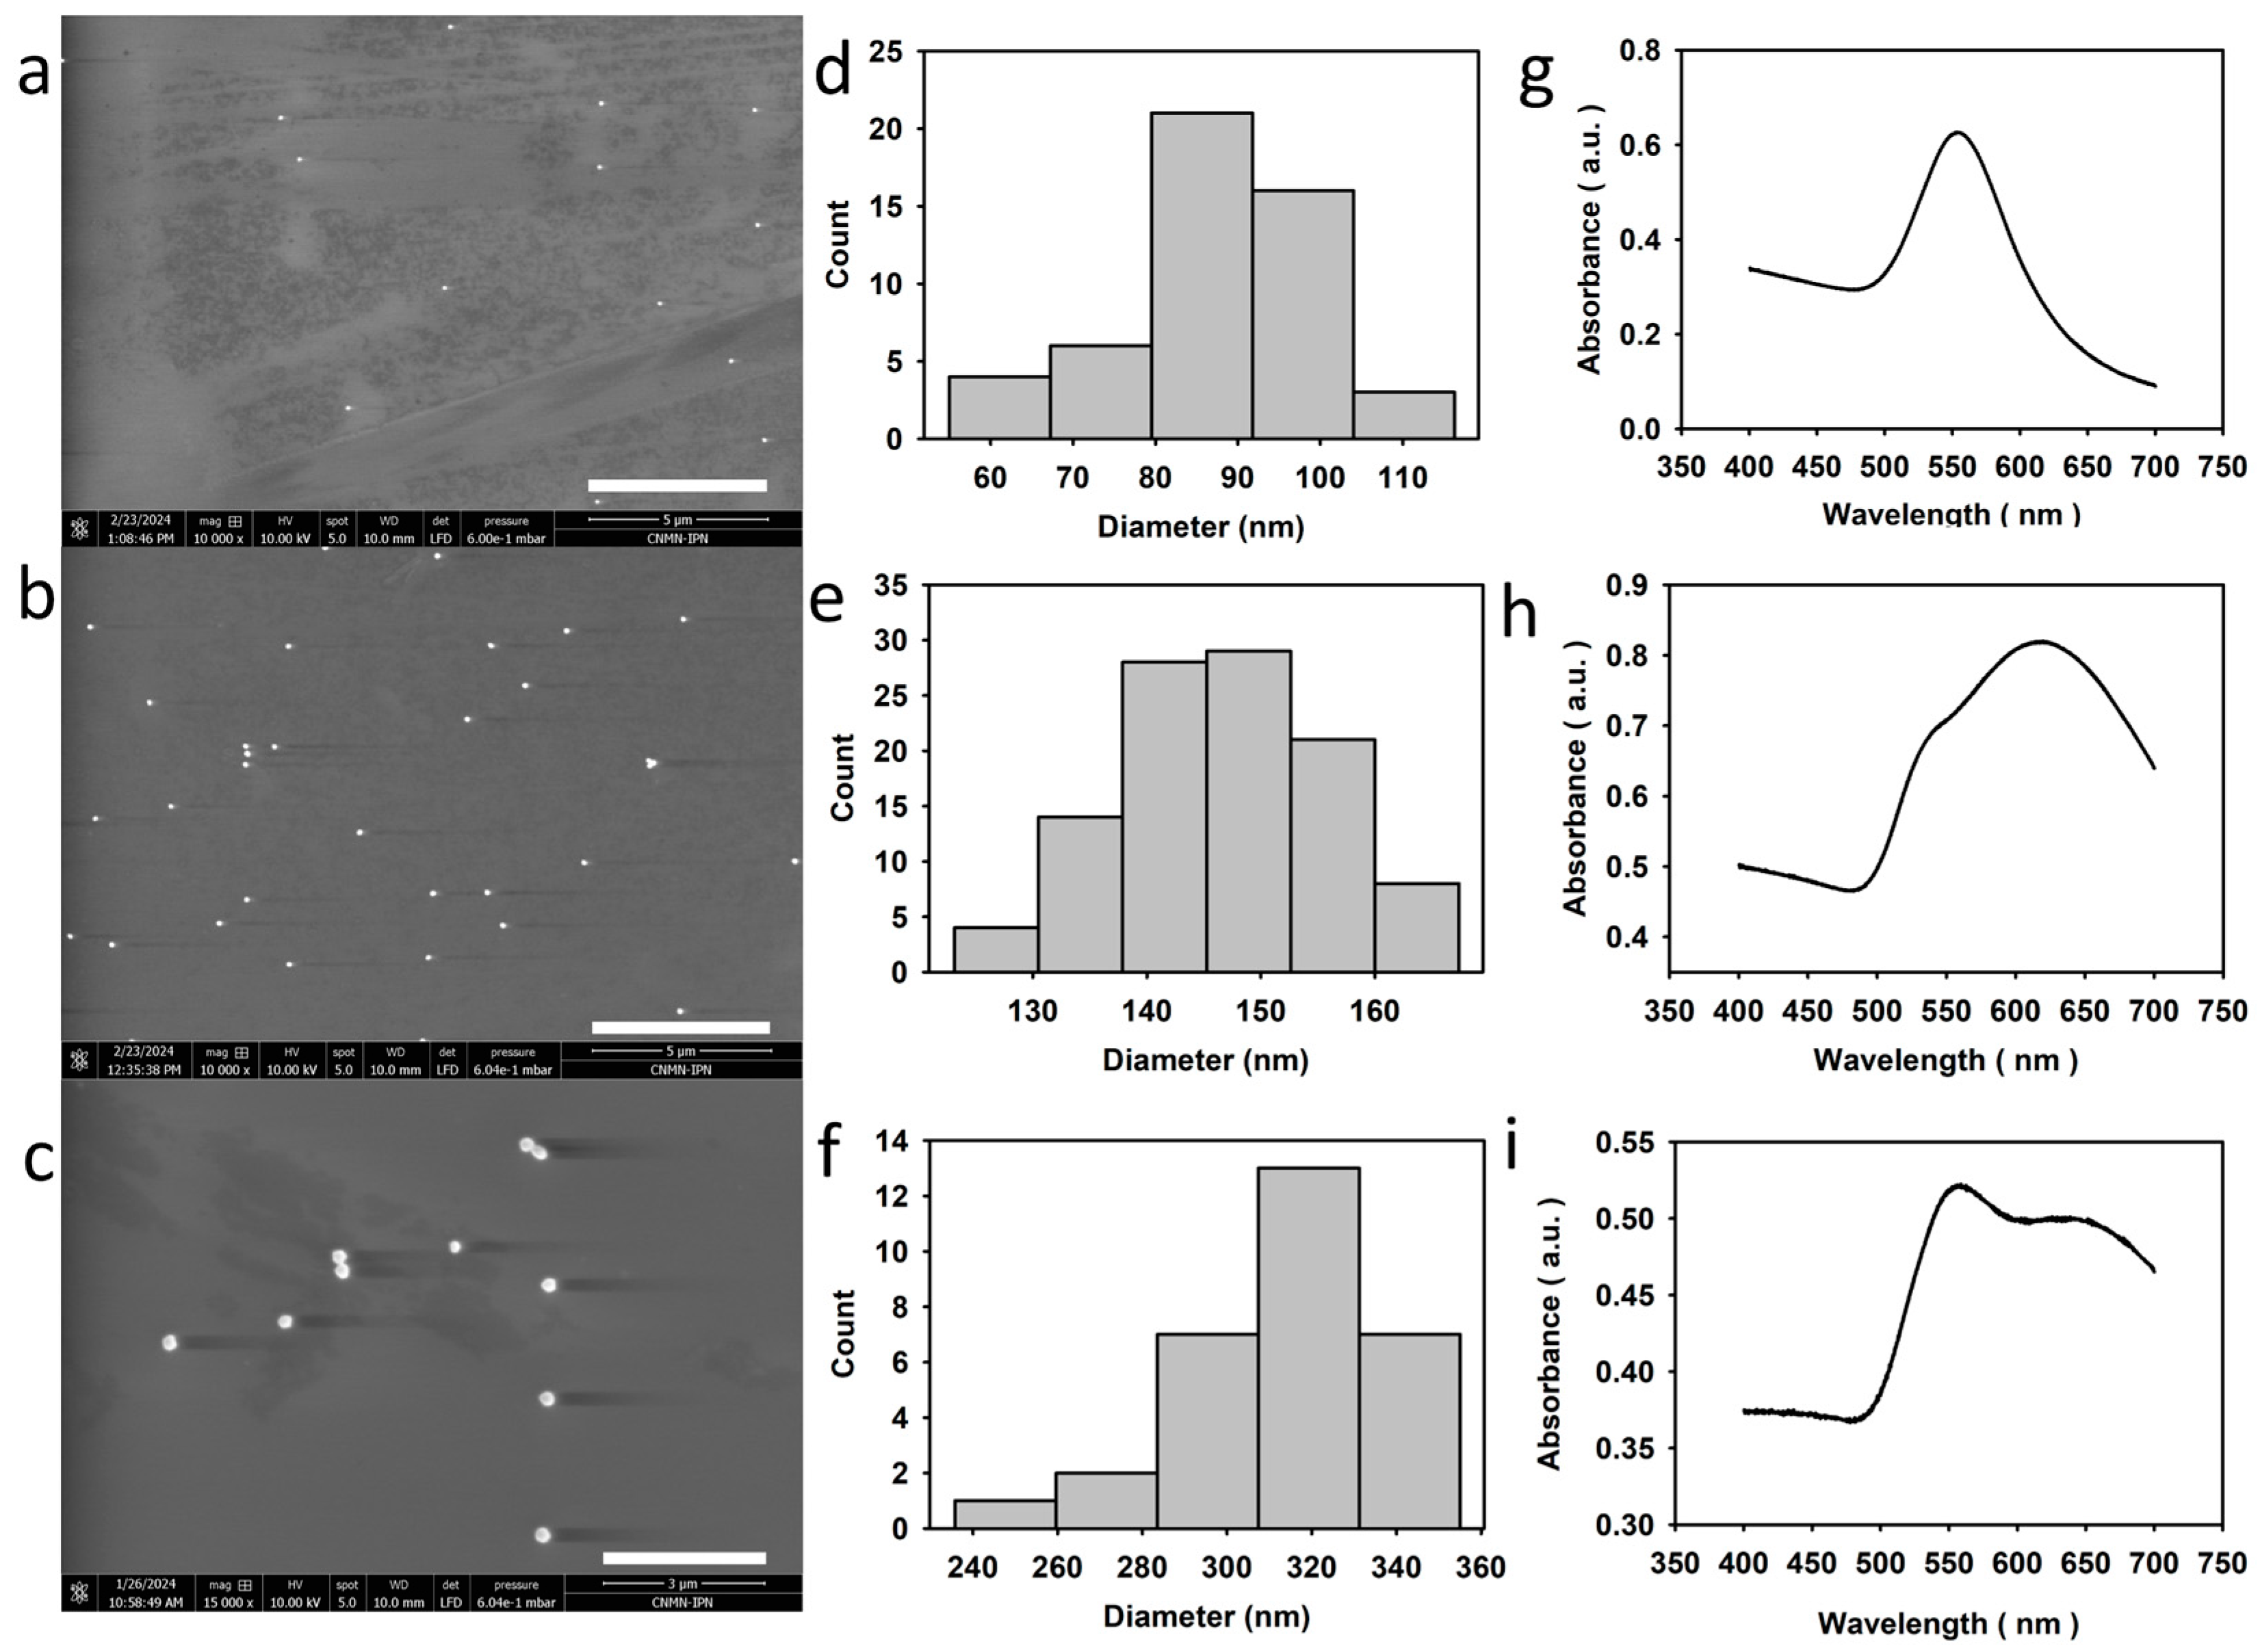
2.2. Nanoparticle Characterization

SEM. Gold nanoparticles (AuNPs) with 80 nm, 150 nm, and 300 nm nominal diameters were acquired (Sigma, Estado de Mexico, Mexico). The particles were characterized using scanning electron microscopy (SEM, Quanta FEG 250, FEI Company, Hillsboro, OR, USA), as shown in Figure 2a–f. Particles were immobilized on the surface of the microscope coverslips (instead of slides) to reduce the deleterious effect of the glass substrate electric charge during observation. The SEM equipment was operated under a low-vacuum configuration to allow for electrostatic discharge through the environment of the SEM chamber. The equipment was operated at 6 × 10⁻¹ mbar, 5–10 kV.
UV–Vis. Absorbance spectra records of gold nanoparticle dispersions were obtained by UV–Vis spectroscopy (Perkin Elmer Lambda 35, Perkin Elmer, Waltham, MA, USA) in the range λ = 400–700 nm. The absorption peak of 80 nm AuNPs was observed at 553 nm (Figure 2g), consistent with the expected localized surface plasmon resonance (LSPR) absorption band [19]. Similarly, the 300 nm AuNPs showed a primary absorption peak at 559 nm, with a secondary peak at 630 nm (Figure 2i), while the 150 nm AuNPs exhibited a peak at 620 nm and a secondary maximum at 550 nm, in accordance with previous reports (Figure 2h) [1,19,20].
Sample preparation for optical microscopy. The immobilization of particles in the glass substrate enabled detection by increased imaging contrast within a glass–water interface and by overcoming the limitations posed by the dynamics of suspended nanoparticles. Before the chemical functionalization of glass coverslips to immobilize the gold particles, the glass surfaces were marked with an engraver rotary tool for future reference and the easy localization of the same region of interests in the SEM and BF microscopies. Gold nanoparticles were immobilized over the surface of the coverslips following the methodology reported by Kyaw [21,22], with a few modifications. Briefly, all of the glass slides and coverslips were washed before sonicating in four steps of 15 min each, with extran, ethanol, acetone, and Milli-Q water, and then dried at 90 °C. Piranha solution (3:1 H2SO4/H2O2) was used for the hydroxylation of the glass coverslips at 100 °C for 2 h (compared to 70 °C and 30 min, so to compensate for the lack of access to a plasma cleaner, as used in [22]), and then rinsed with Milli-Q water and dried overnight at 60 °C. Surface silanization was performed by immersion in a 10% APTES solution for 2 h, followed by sonication with ethanol and Milli-Q water for 5 min each. The functionalized coverslips were finally dried at 120 °C for 3 h; drying at this temperature is essential to reduce the formation of overlapped layers of APTES. Subsequently, 200 µL of AuNP suspension was deposited over the functionalized glass surfaces, leaving for 24 h to ensure the immobilization of the particles. Next, Milli-Q water was used to rinse the surfaces thoroughly before sonicating for 30 min. Functionalized coverslips were dried at 90 °C for 2 h. The samples of immobilized AuNPs on glass coverslips were placed on top of two parallel double-sided tape pieces and covered with a microscope slide, leaving a channel of approximately 1 mm filled with Milli-Q water and sealed with nail polish.

3. Results

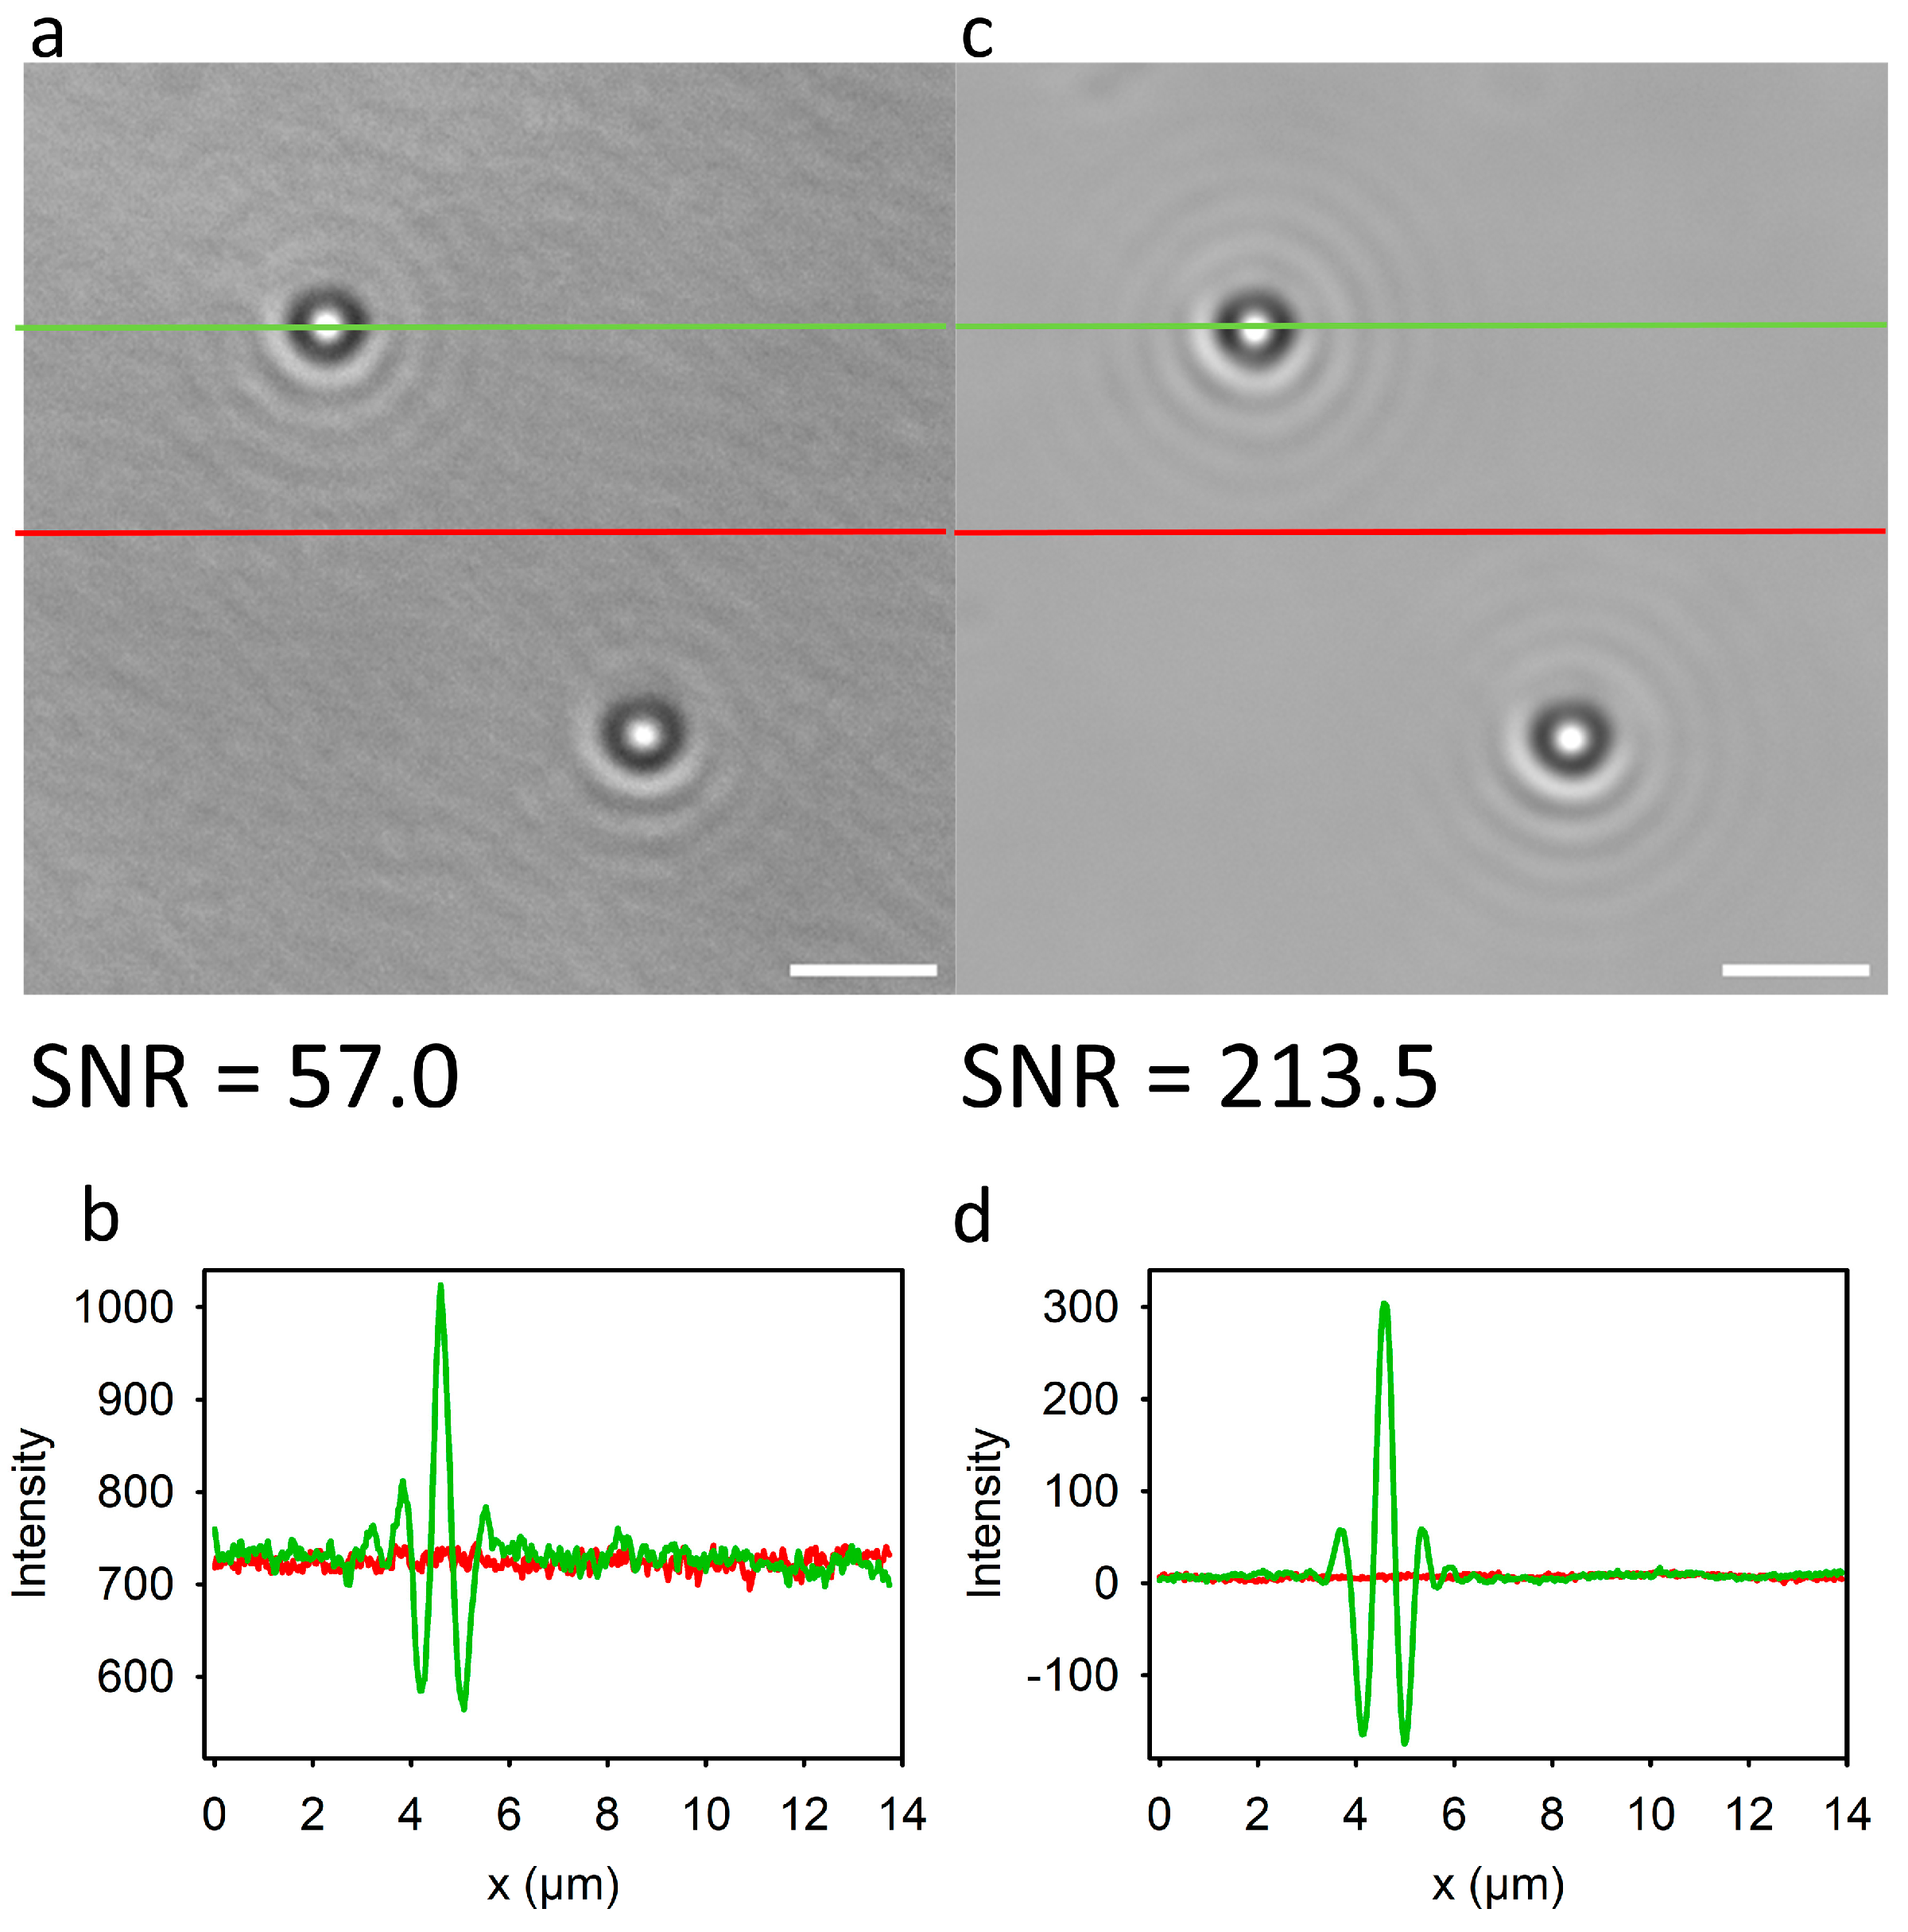
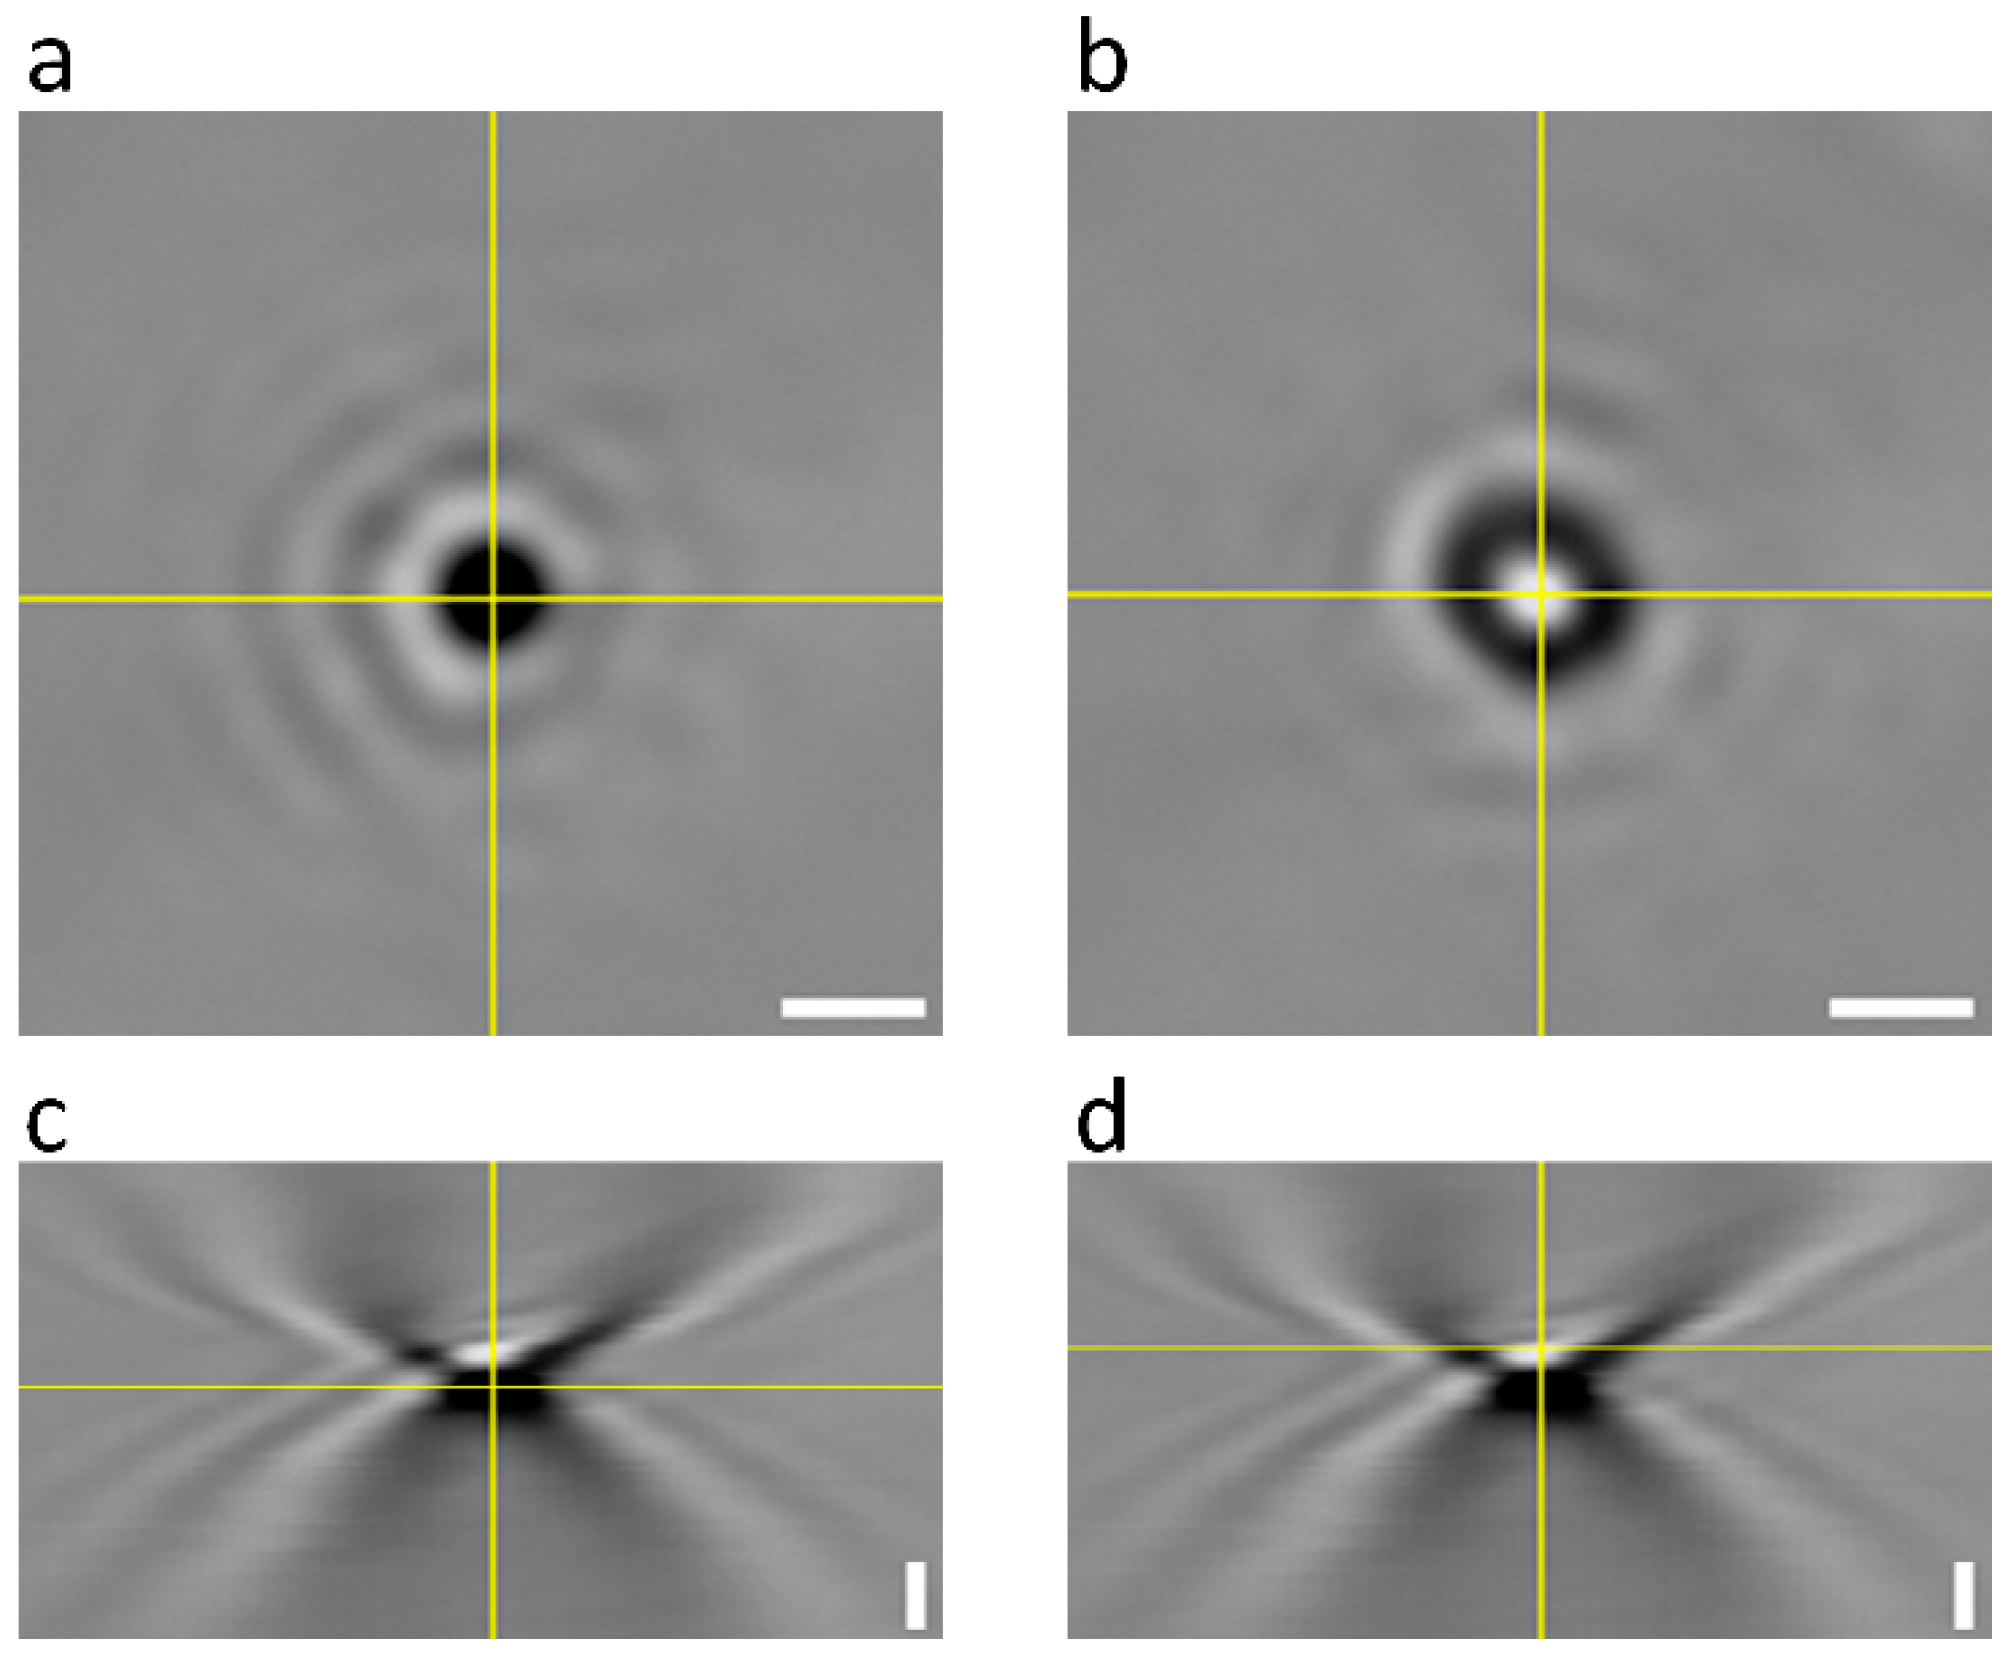
3.1. Signal-to-Noise of AuNPs Visualized by Bright-Field Microscopy

An initial BF microscopy exploration of the glass surface was performed to map the engraving marks as a spatial reference for the areas of interest. This step is particularly helpful for accurately locating the same particles tested in the BF for the posterior SEM characterization. After determining the position of the fields of interest, BF image acquisition was performed, as described, under the following three test illumination wavelengths: λ = 460, 520, and 620 nm.
Figure 3a,c show the representative micrographs of two 150 nm gold nanoparticles before and after digital processing. The corresponding intensity profiles (Figure 3b,d) show the improvement of the SNR by a factor of 3.7. The SNR was obtained by dividing the maximum particle pixel intensity by the standard deviation of the background noise, obtaining SNR = 57.0 for the raw images and SNR = 213.5 for the processed images.

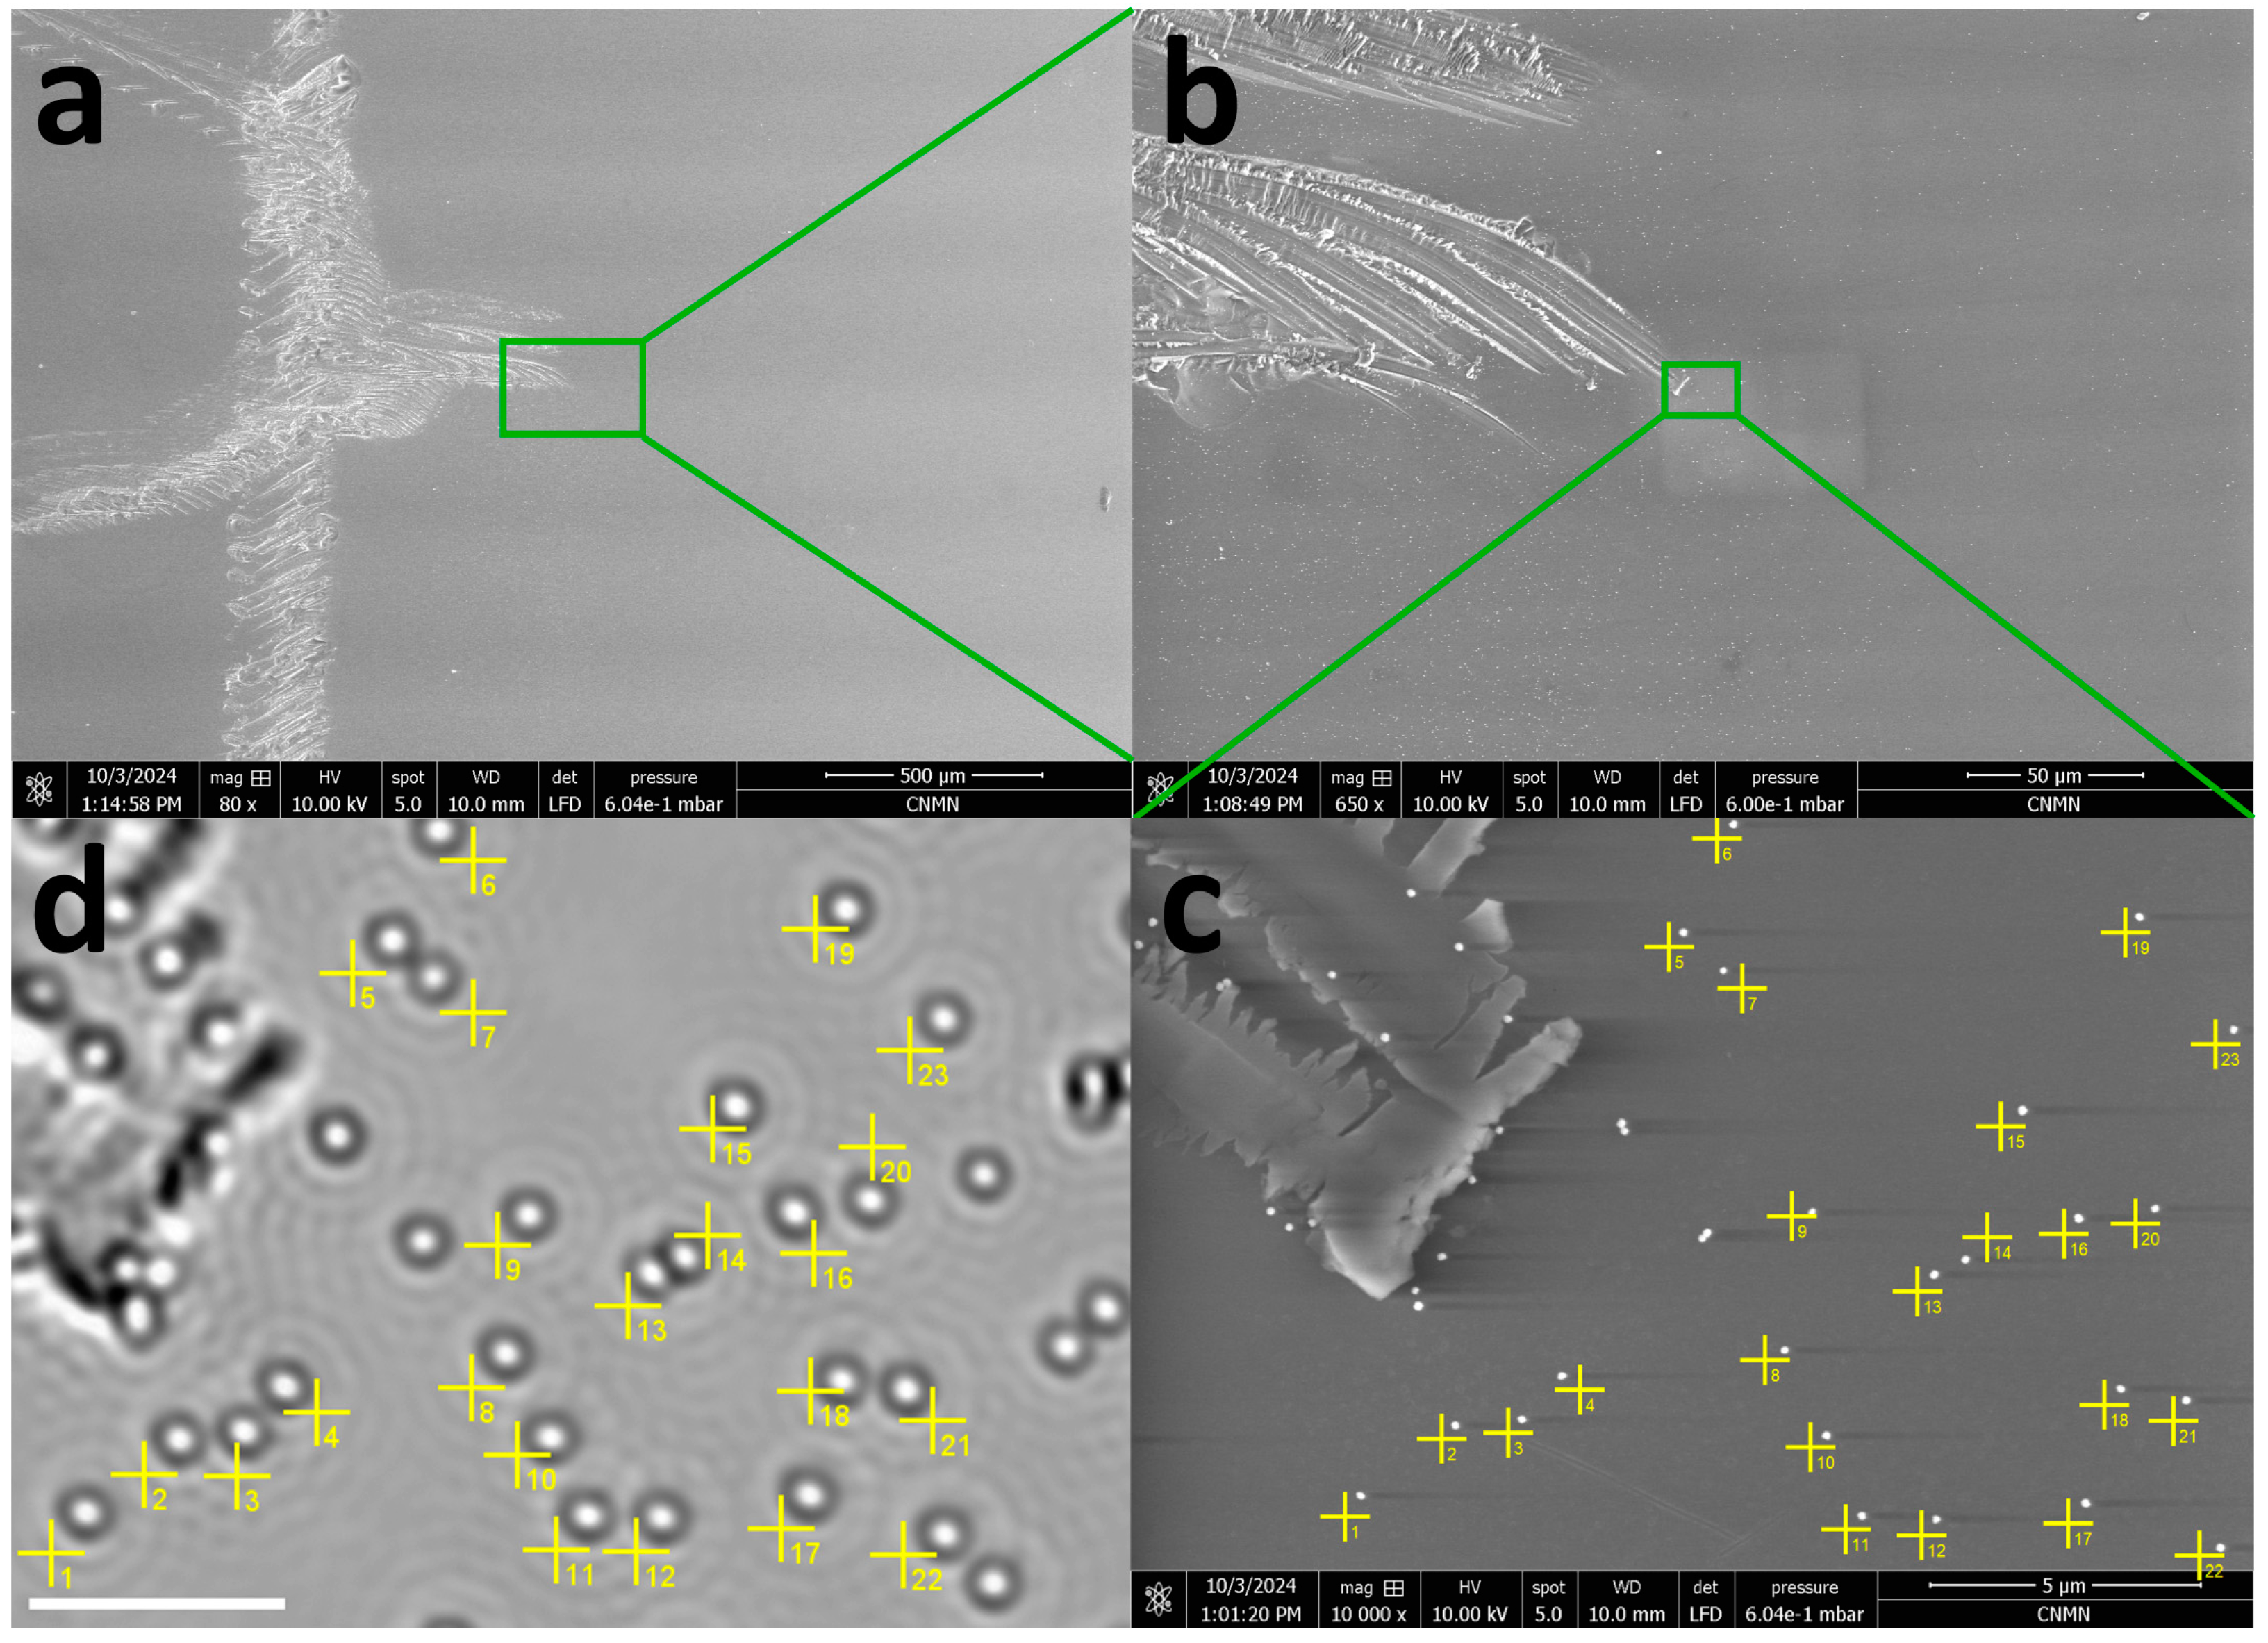
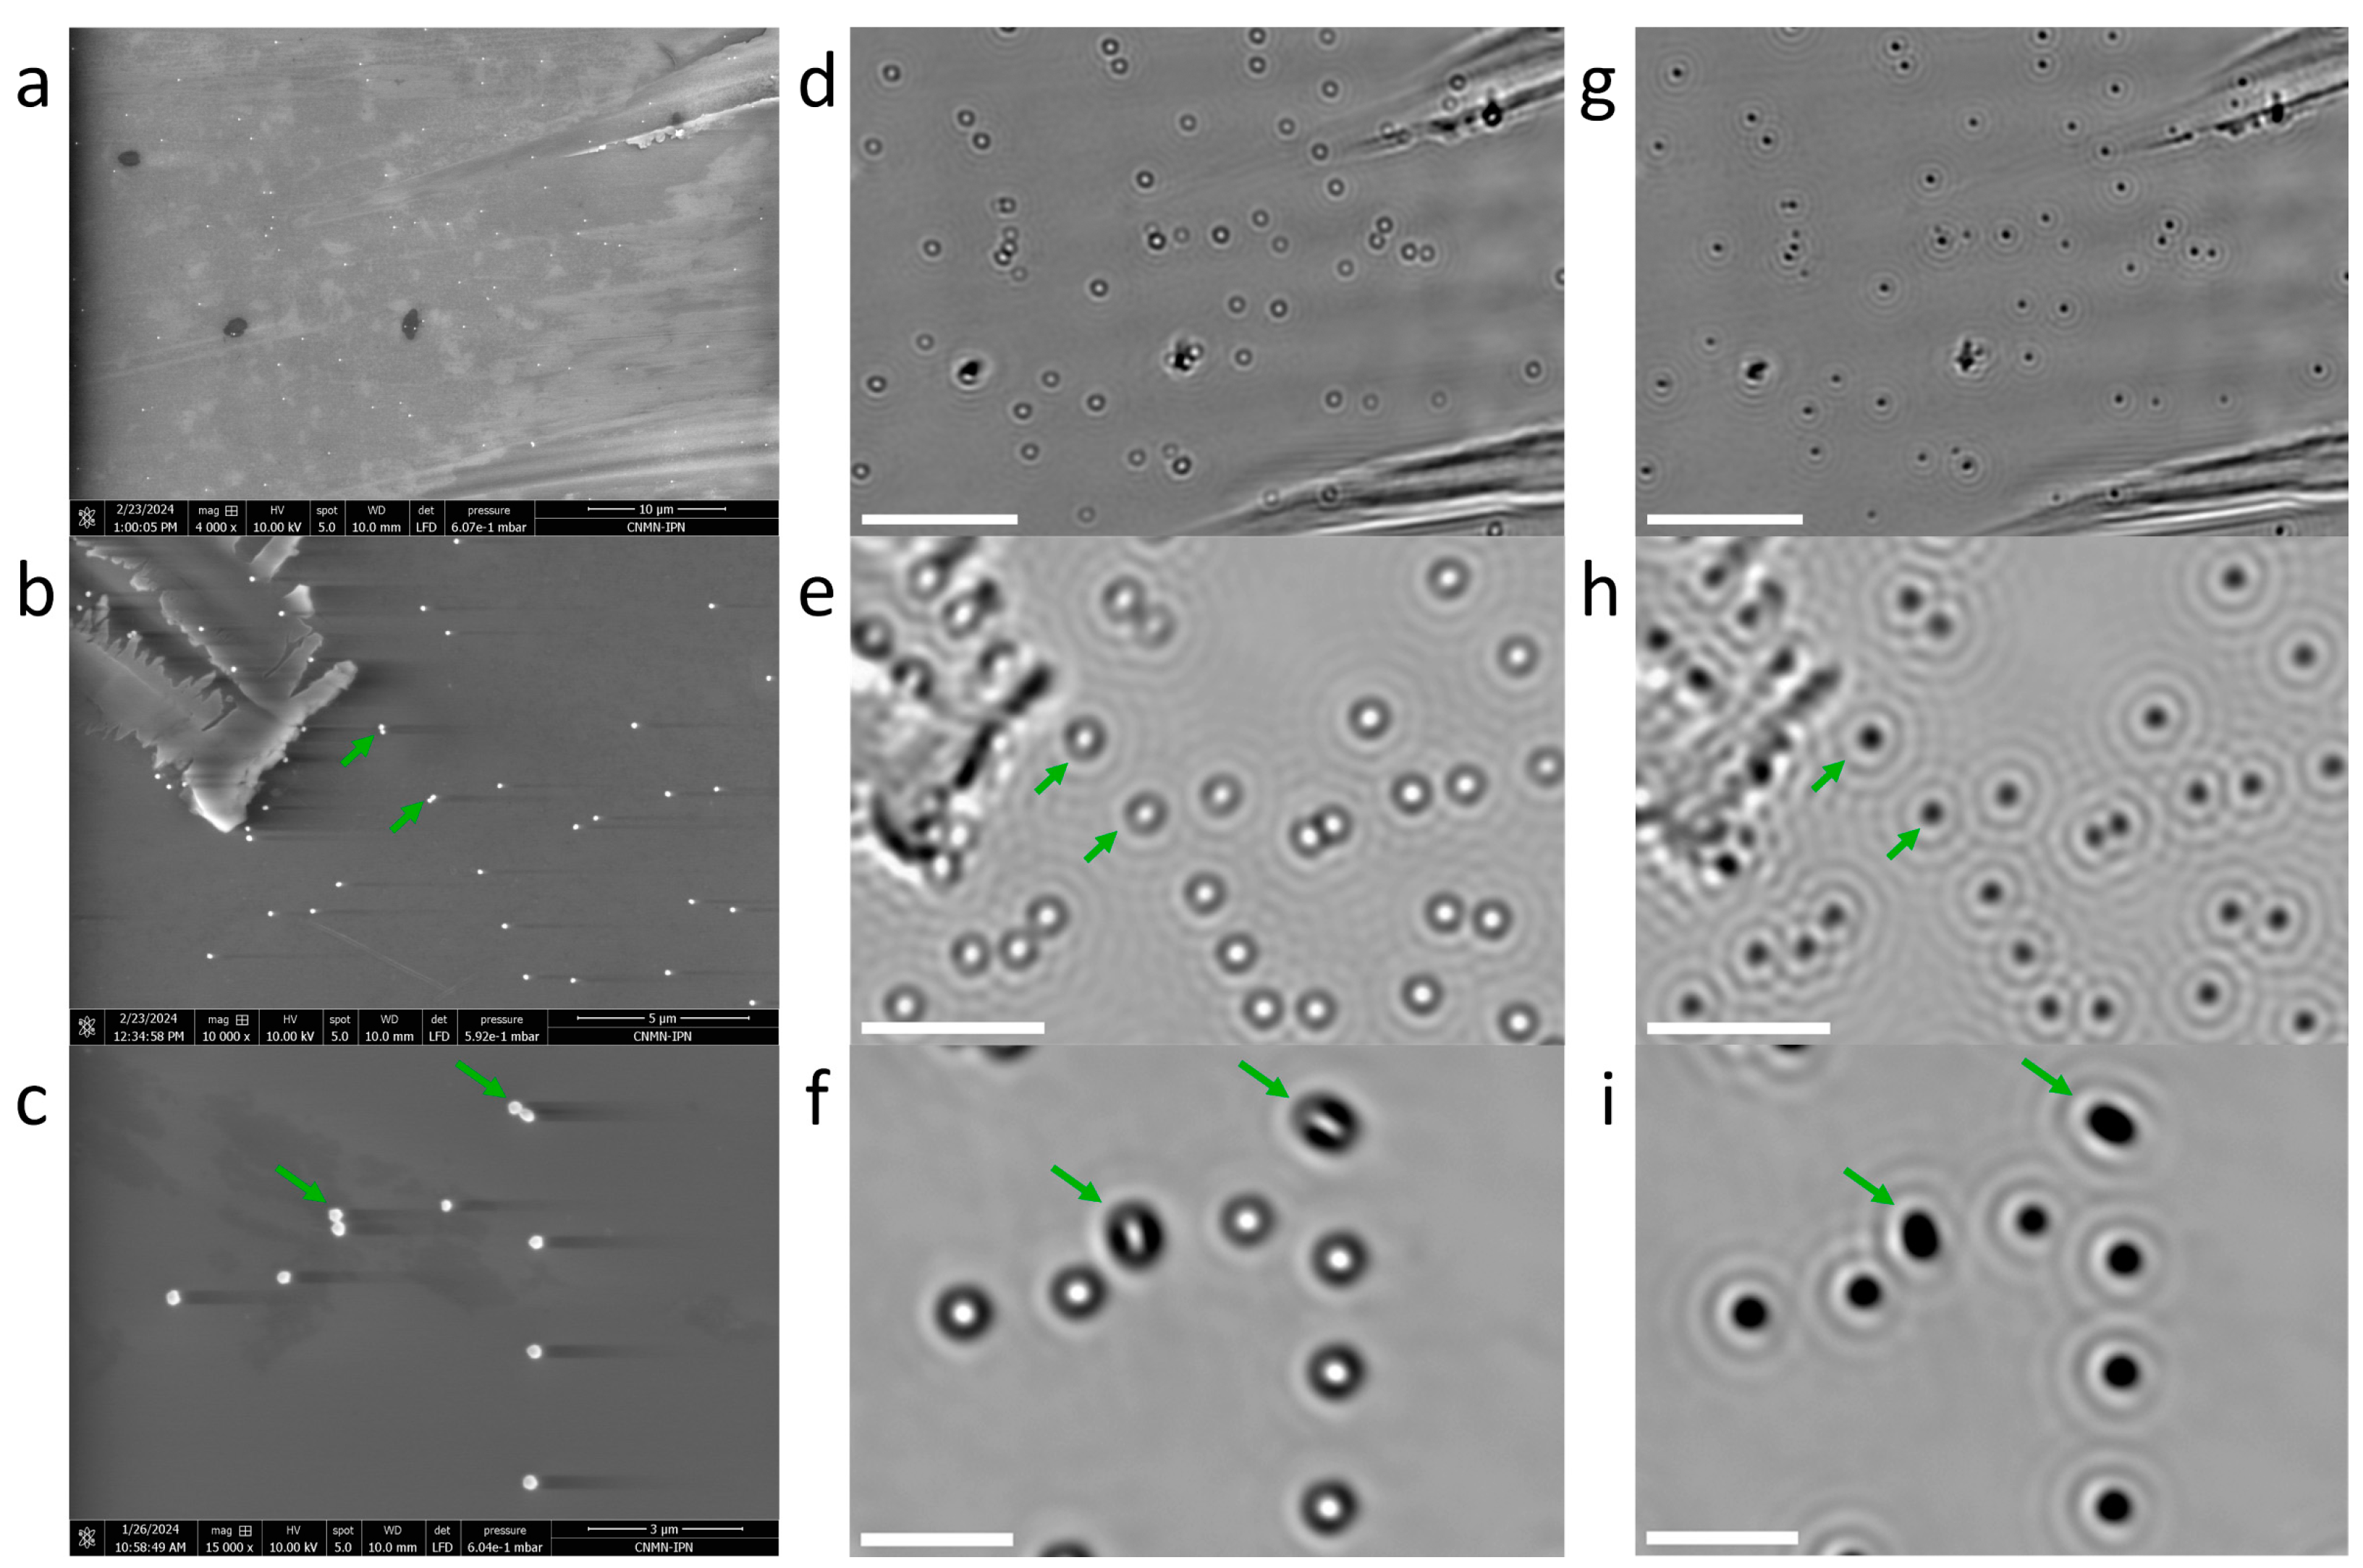
3.2. Sample Alignment in Optical and Electron Microscopies

A comparison of the bright-field signal vs. the size determined by the SEM for the AuNPs requires the acquisition of the same field of view under both types of microscopy. To perform this task, we engraved the glass surfaces with reference markers; then, we observed the samples under the optical microscope, followed by observation in the SEM. At the start of the procedure in the SEM, the glass surfaces were explored using a low magnification to enable the recognition of the engraved marks on the glass (Figure 4a) and the finding of the same particles previously observed with the optical microscope (Figure 4c). After finding the corresponding region of interest, the SEM images of the immobilized particles were obtained at 10,000× to estimate the AuNP diameters. Figure 4c shows a representative BF image with 150 nm gold particles and the corresponding SEM image showing the same particles.
AuNPs with nominal diameters of 80 nm, 150 nm, and 300 nm registered mean diameters (±SD) of 87.5 ± 12.7 nm, 146.7 ± 8.9 nm, and 315.4 ± 25.2 nm, respectively, as determined by SEM microscopy. Figure 2a–c show the representative SEM micrographs with their respective diameter distribution histograms (d–f), including the corresponding UV–Vis spectrum (g–i), as discussed above.

3.3. Bright-Field Microscopy Signal vs. Size for AuNPs

The z-stack of the averaged, background-free, through-focus images of the AuNPs constitute our fundamental data and the starting point of the analysis. These stacks reveal a 3D intensity distribution where the intensity contrast transitions from negative to positive as the axial position is changed (Figure 5). We define the image contrast as C = Iobject − Ibackground, where Iobject and Ibackground correspond to the image pixel intensity of the object and background, respectively. These 3D intensity patterns are reminiscent of the phase point spread function of the bright-field microscopes [23].
Figure 6 shows the SEM micrographs of the AuNPs for the three tested diameters of 80 nm (a), 150 nm (b), and 300 nm (c), along with their respective bright-field micrographs at the planes for positive (d–f) and negative (g–i) intensity contrasts, respectively. The SEM images enable us to distinguish between individual particles and agglomerates, facilitating the analysis of BF images solely on individual AuNPs.
From the central spots corresponding to particles in the BF images, we determined the maximum (Cmax) and the minimum contrast (Cmin) values for each particle (the freely available software ImageJ was used for the image analysis throughout). This procedure on each particle was followed for each of three illumination wavelengths available. The mean values of Cmax and Cmin for each set of particles are summarized in Table 1. As none of the datasets presented a normal distribution, one-way ANOVA on ranks was performed among the Cmax and Cmin for each illumination wavelength. Statistically significant differences were found between all particle sizes, except between the Cmax values for the 150 nm and 300 nm particles under green illumination and between the Cmax values for the 150 nm and 300 nm particles with red illumination. These results indicate that the Cmin values at all illumination wavelengths may be adequate to distinguish between the tested particle sizes.
Figure 7 displays the BF image intensity contrast (C) vs. the SEM diameter (DSEM) for the 184 AuNPs tested. Overall, the behavior of the data shows two main salient features. (1) The negative contrast (Cmin) values display a systematic trend, where Cmin vs. DSEM are well-described by linear fits for the three illumination wavelengths available, and Cmin values increase as the illumination wavelength increases. (2) The positive contrast (Cmax) data are not symmetric with respect to the Cmin values; further, they do not follow well-defined relationships. Linear fits to the Cmin vs. DSEM data (Figure 7) yield the following slopes (±error from the fit): −1.27 ± 0.02 (λ = 460 nm), −1.82 ± 0.03 (λ = 520 nm), and −1.71 ± 0.06 (λ = 620 nm). These results indicate that the Cmin values can be used to assess the AuNP size (within the range of diameters probed, ~80–300 nm) with an excellent S/N, particularly under green and red illumination wavelengths.

3.4. Scattering and Absorption Cross-Sections of AuNPs

Although a full description of the behavior of the BF intensity contrast for various AuNP sizes requires considering not only the optical properties of the AuNPs, but also all of the processes at play during the BF imaging (particularly the phase effects introduced by the scattering object and the various refractive elements within the imaging optics train) [24], it is possible to gain insight into our experimental observations by computing the scattering and absorption cross-sections (σsca and σabs, respectively) for the AuNPs tested here, as scattering and absorption are mechanisms that generate object contrast in BF imaging.
To compute σsca, σabs, and σext (the extinction cross-section = σabs + σsca), we used Mie’s theory for spheres, where the optical fields involved are obtained as multipole components of the order L. Following the approach and notation described [25,26,27,28], we state the following equations used for evaluation:
σ ext = 2 π k 2 L = 1 2 L + 1 Re a L + b L
σ sca = 2 π k 2 L = 1 2 L + 1 ( a L 2 + b L 2 )
where k = 2 π n m / λ is the wavenumber and n m is the refractive index of the surrounding medium. The coefficients a L and b are given by
a L = m ψ L m x ψ L x ψ L x ψ L m x m ψ L m x ξ L x ξ L x ψ L m x
b L = ψ L m x ψ L x m ψ L x ψ L m x ψ L m x ξ L x m ξ L x ψ L m x
where ψ L x = π x 2 1 2 J L + 1 2 ( x ) , ξ L x = π x 2 1 2 J L + 1 2 x + i Y L + 1 2 x ; J ν and Y are the first- and second-order Bessel functions, respectively; x is the size parameter x = k r and r is the sphere radius; the primes denote the derivative of the function with respect to x , with the result evaluated at the variable in parenthesis. Finally, m = n AuNPs / n m , where n AuNPs , is the gold nanoparticle frequency-dependent, complex refractive index, obtained through the measured dielectric function of gold [28]. To compute the cross-sections (using Mathematica), we considered the first five terms in Equations (1) and (2), and n m = 1.33 .
Figure 8a–c show the scattering, absorption, and extinction cross-sections as a function of the illumination wavelength for 80 nm (a), 150 nm (b), and 300 nm (c) diameter gold spheres in water. The computed σext values nicely match our UV–Vis-measured spectra (Figure 2g–i), thus supporting our approach. From these results, we present the scattering (Figure 8d), absorption (Figure 8e), and extintion (Figure 8f) coefficients for the three illumination wavelengths considered in this work (λ = 460 nm, 520 nm, and 620 nm) as a function of the gold particle diameter. This result is an approximate linear behavior in the diameter range ~100–300 nm, in accordance with previous results obtained by Payne et al., who demonstrated that it is possible to quantify the linear optical response of individual AuNPs with conventional wide-field microscopy [29]. For diameter values well below 100 nm, the scattering and absorption coefficients depart from linear behavior with respect to the particle size. These results are consistent with our experimental measurements of the image contrast in the BF vs. particle size, therefore supporting the proposal that BF microscopy, through image contrast, can be used to size AuNPs. Further, the cross-section results suggest that this simple BF methodology might not be suitable to asses the AuNP size due to limited signal and non-linear behavior.

4. Discussion

The results show a linear relationship between the minimum imaging contrast and AuNP diameters in the 80 to 300 nm range for the three illumination wavelengths. These findings suggest that BF microscopy and appropriate digital processing provide a good complementary technique for nanoparticle characterization as an alternative to conventional microscopies such as SEM or AFM. As shown in Section 3.1, along with through-focus imaging, the key method consisted of background subtraction and image averaging, which allowed us to improve the SNR by a factor of 3.7. As part of the main advantages of the proposed methodology, we may mention its accessibility and ease of implementation in laboratories with limited resources. It is possible to obtain quantitative information about the optical properties of nanoparticles without the need for specialized interferometry or advanced spectroscopy equipment using low-cost LED illumination and immersion objectives. Compared to techniques based on optical extinction or scattering detection, our method offers a lower cost and complexity without sacrificing accuracy in estimating the size of AuNPs within the range of 80 to 300 nm.
As shown in Section 3.4, the results obtained are consistent with the expected relationship between the particle size and the scattering and absorption cross-sections. This result reinforces the notion that bright-field microscopy, although a conventional technique, can yield detailed information about nanoparticles when paired with appropriate contrast analysis and image processing. A full model of the optical microscope could help in identifying key parameters to optimize the imaging.
In this work, we tested isolated sphere-shaped nanoparticles, as they provide well-defined size parameters and shapes for the Mie cross-section calculations. Our sizing methodology could be used for in vitro experiments, for example, in the context of single-particle tracking during the transport of AuNPs by molecular motor proteins [30]. Moving beyond this regime, it is important to ask whether our methodology could be applicable in contexts such as intracellular labeling, where it is well known that AuNPs tend to aggregate as they enter the cytoplasm of cells. In this case, aggregated particles will lead to an increase in the contrast in bright-field images, although not necessarily scaling, in a linear fashion. Therefore, our methodology may be currently limited to isolated particles.
Regarding the spatial resolution of our proposed method, from Figure 7, we estimate that bright-field imaging might be able to distinguish AuNPs of ~80 nm. That is, our technique shows a linear relationship between the image contrast and particle size in the range 80–350 nm. For particles with diameters below 80 nm, the image contrast in bright-field microscopy is very small (Cmin < 50). The use of illumination light with an increased coherence parameter (we currently use a coherence parameter of NAcondenser/NAobjective ~0.2) may produce increased contrast to quantify AuNPs below 50 nm. In this case, TEM or AFM could be required to determine the ground truth diameters of the AuNPs.
One area of potential improvement to the methodology presented in this study is the time required to perform the acquisition and processing of bright-field image data. The use of high-end equipment (fast-acquisition, higher-bit-depth cameras; piezoelectric stages; multiple-wavelength illumination sources) should increase the data throughput rates significantly. Alternatively, low-cost equipment could significantly improve the processing time by employing a deep-learning approach [31].

5. Conclusions

We provide an alternative methodology to determine AuNP sizes from BF images using digital image processing. The key experimental parameter is a negative intensity contrast, which shows a linear behavior as a function of the AuNP diameter (80–300 nm) over a wide range of illumination wavelengths. This technique introduces several developments aimed at nanoperticle sizing in a simple, straightforward way. First, a method is presented to localize the same field of immobilized AuNPs on glass by means of optical and electron microscopies. Second, the advantages of image processing as a means of noise reduction is highlighted. Third, the observation that image contrast increases with the nanoparticle size is supported by scattering cross-section calculations. Finally, our low-cost BF microscopy system demonstrates that a minimal setup can perform well for this task, and we can only expect that high-end equipment should enable faster, more accurate evaluations.

Supplementary Materials

The following supporting information can be downloaded at: https://www.mdpi.com/article/10.3390/photonics12040314/s1, Figure S1: Flowchart of the background acquisition algorithm; Figure S2: Flowchart of the z-stack through-focus acquisition algorithm.

Author Contributions

Conceptualization, B.G.-M., J.A.B.-L. and A.S.-L.; methodology, B.G.-M. and A.S.-L.; software, A.S.-L.; validation, B.G.-M., J.A.B.-L. and A.S.-L.; formal analysis, B.G.-M. and A.S.-L.; investigation, B.G.-M., S.M.-A. and A.S.-L.; resources, B.G.-M. and J.A.B.-L.; writing—original draft preparation, B.G.-M. and A.S.-L.; writing—review and editing, B.G.-M., J.A.B.-L., S.M.-A. and A.S.-L.; supervision, B.G.-M. and J.A.B.-L.; funding acquisition, B.G.-M., J.A.B.-L. and A.S.-L. All authors have read and agreed to the published version of the manuscript.

Funding

This work was supported by the CONACYT (Mexico) grant CF-2023-G-542 to B.G.-M. This work was supported by the CONACYT (Mexico) Ph.D. scholarship to A.S.-L.

Data Availability Statement

All data will be available under request.

Acknowledgments

This work was supported by the Instituto Politécnico Nacional (Mexico).

Conflicts of Interest

The authors declare no conflicts of interest.

Abbreviations

The following abbreviations are used in this manuscript:
AuNPsGold nanoparticles
SEMScanning electron microscopy
TEMTransmission electron microscopy
AFMAtomic force microscopy
UV–VisUltraviolet–visible spectroscopy
DLSDynamic light scattering
PCMPhase-contrast microscopy
DICDifferential interference contrast microscopy
iSCATInterferometric scattering microscopy
SCSScattering cross-section
PRPlasmon resonance
NANumerical aperture
CMOSComplementary metal–oxide–semiconductor
LSPRLocalized surface plasmon resonance
APTES(3-Aminopropyl)triethoxysilane

References

  1. Boisselier, E.; Astruc, D. Gold Nanoparticles in Nanomedicine: Preparations, Imaging, Diagnostics, Therapies and Toxicity. Chem. Soc. Rev. 2009, 38, 1759–1782. [Google Scholar] [CrossRef] [PubMed]
  2. Webster, T.J.; Gorth, D.; Rand, D. Silver Nanoparticle Toxicity in Drosophila: Size Does Matter. Int. J. Nanomed. 2011, 2011, 343–350. [Google Scholar] [CrossRef]
  3. von der Kammer, F.; Legros, S.; Hofmann, T.; Larsen, E.H.; Loeschner, K. Separation and Characterization of Nanoparticles in Complex Food and Environmental Samples by Field-Flow Fractionation. TrAC Trends Anal. Chem. 2011, 30, 425–436. [Google Scholar] [CrossRef]
  4. Salafi, T.; Zeming, K.K.; Zhang, Y. Advancements in Microfluidics for Nanoparticle Separation. Lab Chip 2017, 17, 11–33. [Google Scholar] [CrossRef] [PubMed]
  5. Gardiner, C.; Dragovic, R. Nanoparticle Tracking Analysis. In Extracellular Vesicles in Health and Disease; Harrison, P., Gardiner, C., Sargent, I.L., Eds.; Jenny Stanford Publishing: Singapore, 2014. [Google Scholar] [CrossRef]
  6. Lee, K.; Shao, H.; Weissleder, R.; Lee, H. Acoustic Purification of Extracellular Microvesicles. ACS Nano 2015, 9, 2321–2327. [Google Scholar] [CrossRef] [PubMed]
  7. Abrica-González, P.; Zamora-Justo, J.A.; Chavez-Sandoval, B.E.; Vázquez-Martínez, G.R.; Balderas-López, J.A. Measurement of the Optical Properties of Gold Colloids by Photoacoustic Spectroscopy. Int. J. Thermophys. 2018, 39, 93. [Google Scholar] [CrossRef]
  8. Yang, Y.; Shi, Y.Z.; Chin, L.K.; Zhang, J.B.; Tsai, D.P.; Liu, A.Q. Optofluidic Nanoparticles Sorting by Hydrodynamic Optical Force. In Proceedings of the 2013 Transducers & Eurosensors XXVII: The 17th International Conference on Solid-State Sensors, Actuators and Microsystems (TRANSDUCERS & EUROSENSORS XXVII), Barcelona, Spain, 16–20 June 2013; pp. 2122–2125. [Google Scholar] [CrossRef]
  9. Tomaszewska, E.; Soliwoda, K.; Kadziola, K.; Tkacz-Szczesna, B.; Celichowski, G.; Cichomski, M.; Szmaja, W.; Grobelny, J. Detection Limits of DLS and UV-Vis Spectroscopy in Characterization of Polydisperse Nanoparticles Colloids. J. Nanomater. 2013, 2013, 1–10. [Google Scholar] [CrossRef]
  10. Taylor, R.W.; Sandoghdar, V. Interferometric Scattering Microscopy: Seeing Single Nanoparticles and Molecules via Rayleigh Scattering. Nano Lett. 2019, 19, 4827–4835. [Google Scholar] [CrossRef]
  11. Kukura, P.; Ewers, H.; Müller, C.; Renn, A.; Helenius, A.; Sandoghdar, V. High-Speed Nanoscopic Tracking of the Position and Orientation of a Single Virus. Nat. Methods 2009, 6, 923–927. [Google Scholar] [CrossRef]
  12. De Brabander, M.; Nuydens, R.; Geuens, G.; Moeremans, M.; Mey, D. The Use of Submicroscopic Gold Particles Combined With Video Contrast Enhancement Living Cell. Cell Motil. 1986, 113, 105–113. [Google Scholar]
  13. Taylor, R.W.; Sandoghdar, V. Interferometric Scattering (ISCAT) Microscopy and Related Techniques. In Biological and Medical Physics, Biomedical Engineering; Astratov, V., Ed.; Biological and Medical Physics, Biomedical Engineering; Springer International Publishing: Cham, Switzerland, 2019; pp. 25–65. ISBN 978-3-030-21721-1. [Google Scholar]
  14. Ortega-Arroyo, J.; Kukura, P. Interferometric Scattering Microscopy (ISCAT): New Frontiers in Ultrafast and Ultrasensitive Optical Microscopy. Phys. Chem. Chem. Phys. 2012, 14, 15625. [Google Scholar] [CrossRef] [PubMed]
  15. Dong, J.; Maestre, D.; Conrad-Billroth, C.; Juffmann, T. Fundamental Bounds on the Precision of ISCAT, COBRI and Dark-Field Microscopy for 3D Localization and Mass Photometry. J. Phys. D Appl. Phys. 2021, 54, 394002. [Google Scholar] [CrossRef]
  16. Sun, W.; Wang, G.; Fang, N.; Yeung, E.S. Wavelength-Dependent Differential Interference Contrast Microscopy: Selectively Imaging Nanoparticle Probes in Live Cells. Anal. Chem. 2009, 81, 9203–9208. [Google Scholar] [CrossRef] [PubMed]
  17. Payne, L.; Zilli, A.; Wang, Y.; Langbein, W.; Borri, P. Quantitative High-Throughput Optical Sizing of Individual Colloidal Nanoparticles by Wide-Field Imaging Extinction Microscopy. In Proceedings of the Colloidal Nanoparticles for Biomedical Applications XIV, San Francisco, CA, USA, 2–4 February 2019; Parak, W.J., Osiński, M., Eds.; SPIE: Bellingham, WA, USA, 2019; p. 17. [Google Scholar]
  18. Gutierrez-Medina, B. Optical Sectioning of Unlabeled Samples Using Bright-Field Microscopy. Proc. Natl. Acad. Sci. USA 2022, 119, e2122937119. [Google Scholar] [CrossRef]
  19. Yahaya, M.L.; Zakaria, N.D.; Noordin, R.; Abdul Razak, K. Synthesis of Large and Stable Colloidal Gold Nanoparticles (AuNPs) by Seeding-Growth Method. Mater. Today Proc. 2022, 66, 2943–2947. [Google Scholar] [CrossRef]
  20. Abrica-González, P.; Zamora-Justo, J.A.; Sotelo-López, A.; Vázquez-Martínez, G.R.; Balderas-López, J.A.; Muñoz-Diosdado, A.; Ibáñez-Hernández, M. Gold Nanoparticles with Chitosan, N-Acylated Chitosan, and Chitosan Oligosaccharide as DNA Carriers. Nanoscale Res. Lett. 2019, 14, 258. [Google Scholar] [CrossRef]
  21. Bujak, L.; Piliarik, M. Interferometric Scattering (ISCAT) Microscopy for High Fidelity Tracking at Microseconds Timescales. In Nanoimaging and Nanospectroscopy VI; SPIE: Bellingham, WA, USA, 2018; Volume 10726, pp. 53–60. [Google Scholar] [CrossRef]
  22. Kyaw, H.H.; Al-Harthi, S.H.; Sellai, A.; Dutta, J. Self-Organization of Gold Nanoparticles on Silanated Surfaces. Beilstein J. Nanotechnol. 2015, 6, 2345–2353. [Google Scholar] [CrossRef]
  23. Gutiérrez-Medina, B.; de J. Sánchez Miranda, M. Quantitative Image Restoration in Bright Field Optical Microscopy. Biophys. J. 2017, 113, 1916–1919. [Google Scholar] [CrossRef]
  24. Streibl, N. Three-Dimensional Imaging by a Microscope. J. Opt. Soc. Am. A 1985, 2, 121. [Google Scholar] [CrossRef]
  25. Kreibig, U.; Vollmer, M. Optical Properties of Metal Clusters; Springer: Berlin/Heidelberg, Germany, 2013; Volume 25, ISBN 3662091097. [Google Scholar]
  26. Bohren, C.F.; Huffman, D.R. Absorption and Scattering of Light by Small Particles; John Wiley & Sons: Hoboken, NJ, USA, 2008; ISBN 3527618163. [Google Scholar]
  27. Olson, J.; Dominguez-Medina, S.; Hoggard, A.; Wang, L.Y.; Chang, W.S.; Link, S. Optical Characterization of Single Plasmonic Nanoparticles. Chem. Soc. Rev. 2015, 44, 40–57. [Google Scholar] [CrossRef]
  28. Johnson, P.B.; Christy, R.-W. Optical Constants of the Noble Metals. Phys. Rev. B 1972, 6, 4370. [Google Scholar] [CrossRef]
  29. Payne, L.M.; Langbein, W.; Borri, P. Polarization-Resolved Extinction and Scattering Cross-Sections of Individual Gold Nanoparticles Measured by Wide-Field Microscopy on a Large Ensemble. Appl. Phys. Lett. 2013, 102, 131107. [Google Scholar] [CrossRef]
  30. Ando, J.; Nakamura, A.; Visootsat, A.; Yamamoto, M.; Song, C.; Murata, K.; Iino, R. Single-Nanoparticle Tracking with Angstrom Localization Precision and Microsecond Time Resolution. Biophys. J. 2018, 115, 2413–2427. [Google Scholar] [CrossRef] [PubMed]
  31. Kefer, P.; Iqbal, F.; Locatelli, M.; Lawrimore, J.; Zhang, M.; Bloom, K.; Bonin, K.; Vidi, P.-A.; Liu, J. Performance of deep learning restoration methods for the extraction of particle dynamics in noisy microscopy image sequences. Mol. Biol. Cell 2021, 32, 903–914. [Google Scholar] [CrossRef] [PubMed]
Figure 1. Schematic diagram and 3D model of the microscopy system: (1) field lens (f = 15 mm); (2) field diaphragm; (3) condenser aperture diaphragm; (4) condenser lens; (5) 1.25 NA, 100× immersion objective; (6) UV-fused silica cold mirror; (7) tube lens (f = 200 mm). (8) Detector, CMOS camera; (9) 3W ultra-bright LED; (10) XYZ translation stage for condenser adjustment; (4) condenser (with aperture diaphragm (3)); (11) sample stage; (12) XYZ translation stage for the sample; (13) Z-translation stage for the objective. Inset: detail of the XYZ stages for the condenser ((10) xyz), and sample stage ((12) xyz).
Photonics 12 00314 g001
Figure 2. SEM micrographs for AuNPs with nominal diameters of 80 nm (a), 150 nm (b), and 300 nm (c), together with their respective SEM diameter distribution histograms, (d), (e), and (f), respectively. UV–Vis spectra (gi) showing the corresponding characteristic absorption peaks. Scale bars in (a,b): 5 µm, (c): 3 µm.
Photonics 12 00314 g002
Figure 3. (a) Raw image of a pair of 150 nm gold nanoparticles. (b) Intensity profiles across one of the particles (green) and background (red), corresponding to the green and red lines shown in (a), respectively. (c) Digitally processed image of the same particles, with the intensity profile of the corresponding particle (d). The SNR was improved by a factor of 3.7 (scale bar, 2 µm).
Photonics 12 00314 g003
Figure 4. Macroscopic marks on the glass slide aid in the location of the same particles in the BF and SEM microscopies (a). After defining the ROI in the BF microscopy (c), the same samples were processed in the SEM microscope, gradually increasing the magnification (green squares) (b) to find the same ROI (c). The same particles are located and labeled (using ImageJ software v. 1.54g) in SEM (c) and BF (d) microscopies (scale bar, 5 µm).
Photonics 12 00314 g004
Figure 5. Through-focus x-y images of a single AuNPs at two distinct z planes, corresponding to positive (a) and negative (b) image intensity contrasts. The corresponding x-z images are shown in (c,d). Yellow lines indicate the locations of the image slices (scale bar, 1 µm).
Photonics 12 00314 g005
Figure 6. SEM micrographs for the AuNPs of nominal diameters of 80 nm (a), 150 nm (b), and 300 nm (c). The engraved mark on the substrate (b) is helpful to find the corresponding field in the BF microscopy. Positive contrast micrographs for the 80 nm (d) (scale bar, 10 µm), 150 nm (e) (scale bar, 5 µm), and 300 nm (f) (scale bar, 3 µm) AuNPs, with the corresponding negative contrast images, (g), (h), and (i), respectively. Green arrows indicate particle agglomerations, which were not considered in the further analysis.
Photonics 12 00314 g006
Figure 7. BF maximum and minimum contrast for the AuNPs as a function of the SEM diameter. Data shown include the Cmax, λ = 620 nm (upright red triangles), Cmax, λ = 520 nm (upright green triangles), Cmax, λ =460 nm (upright blue triangles), Cmin, λ = 460 nm (inverted blue triangles), Cmin, λ = 520 nm (inverted green triangles), and Cmin, λ = 620 nm (inverted red triangles). Lines correspond to linear fits to data: Cmin, λ = 460 nm (blue), Cmin, λ = 520 nm (green), Cmin, λ = 620 nm (red). The inset shows the slope values from the linear fits (error bars from linear fits).
Photonics 12 00314 g007
Figure 8. Scattering (blue), absorption (black), and extinction (red) cross-sections vs. illumination wavelengths for gold spheres of 80 nm (a), 150 nm (b), 300 nm (c) in diameter. From these data, the scattering (d), absorption (e), and extinction (f) cross-sections vs. gold sphere diameters are shown for the following three illumination wavelengths: 620 nm (red), 520 nm (green), and 460 nm (blue).
Photonics 12 00314 g008
Table 1. Mean contrast values (±SD) at three different wavelengths for each nanoparticle size.
80 nm150 nm300 nm
Cmin, λ = 460 nm−51.8 ± 11.8−137.2 ± 15.8−346.1 ± 39.1
Cmax, λ = 460 nm4.3 ± 5.013.3 ± 7.9123.0 ± 78.8
Cmin, λ = 520 nm−122.7 ± 21.0−235.7 ± 23.6−545.7 ± 42.9
Cmax, λ = 520 nm75.4 ± 22.9201.5 ± 30.4 *204.4 ± 62.7 *
Cmin, λ = 620 nm−177.4 ± 49.0−360.4 ± 25.5−589.4 ± 89.9
Cmax, λ = 620 nm87.7 ± 32.7265.0 ± 18.1 ‡ 272.1 ± 27.0 ‡
‡ and * indicate no statistically significant difference.
Disclaimer/Publisher’s Note: The statements, opinions and data contained in all publications are solely those of the individual author(s) and contributor(s) and not of MDPI and/or the editor(s). MDPI and/or the editor(s) disclaim responsibility for any injury to people or property resulting from any ideas, methods, instructions or products referred to in the content.

