Article

Multi-Channel Sparse-Frequency-Scanning White-Light Interferometry with Adaptive Mode Locking for Pulse Wave Velocity Measurement

1
Department of Geriatrics, Nanjing Drum Tower Hospital, Affiliated Hospital of Medical School, Nanjing University, Nanjing 210008, China
2
School of Computer and Electronic Information, Nanjing Normal University, Nanjing 210023, China
*
Authors to whom correspondence should be addressed.
Photonics 2025, 12(4), 316; https://doi.org/10.3390/photonics12040316
Submission received: 7 March 2025 / Revised: 25 March 2025 / Accepted: 27 March 2025 / Published: 28 March 2025

Abstract

:
Fiber-optic Fabry–Pérot (F–P) sensors offer significant potential for non-invasive hemodynamic monitoring, but existing sensing systems face limitations in multi-channel measurement capabilities and dynamic demodulation accuracy. This study introduces a sparse-frequency-scanning white-light interferometry (SFS-WLI) system with an adaptive mode-locked cross-correlation (MLCC) algorithm to address these challenges. The system leverages telecom-grade semiconductor lasers (191.2–196.15 THz sweep range, 50 GHz step) and a Fibonacci-optimized MLCC algorithm to achieve real-time cavity length demodulation at 5 kHz. Compared to normal MLCC algorithm, the Fibonacci-optimized algorithm reduces the number of computational iterations by 57 times while maintaining sub-nanometer resolution under dynamic perturbations. Experimental validation demonstrated a carotid–radial pulse wave velocity of 5.12 m/s in a healthy male volunteer. This work provides a scalable and cost-effective solution for cardiovascular monitoring with potential applications in point-of-care testing (POCT) and telemedicine.

1. Introduction

Optical fiber sensors [1,2,3,4] have emerged as a pivotal technology in biomedical monitoring due to their inherent advantages, including high sensitivity, immunity to electromagnetic interference, biocompatibility, and rapid dynamic response. These attributes make them particularly suitable for tracking physiological parameters such as respiration [5,6], pulse waves [7], and heart sounds [8]. For instance, intracranial pressure (ICP) monitoring systems based on Fabry–Pérot (F–P) interferometry [9] utilize implantable flexible fiber-optic F–P composite sensing probes to enable real-time ICP tracking in patients with traumatic brain injuries or brain tumors. Furthermore, fiber-optic sensors have expanded their utility in dynamic physiological assessments, such as fracture healing evaluation [10] via micro-strain detection during fracture recovery. Recent advancements in wearable fiber-optic sensing systems—exemplified by smart wristbands integrated with fiber sensors—have achieved continuous blood pressure monitoring [11] with an average error of <3 mmHg, demonstrating clinical viability. Collectively, these developments underscore the indispensable role of fiber-optic sensing in modern medical diagnostics.
Currently, there are approximately 330 million people with cardiovascular diseases in China. Early detection and intervention of arterial lesions and their risk factors can significantly reduce the occurrence of cardiovascular events. Pulse wave analysis allows for real-time monitoring of cardiac output and hemodynamic status, especially during fluid therapy or interventions, enabling timely adjustments to treatment plans. Synchronous multi-site pulse wave measurement holds critical value for evaluating arterial structural integrity and functional states [12], enabling the early detection of vascular pathologies like arteriosclerosis and the prediction of cardiovascular risks. This capability is vital for population-wide screening and preventive cardiology. However, existing multiplexing strategies face significant limitations. Frequency-division multiplexing (FDM), which modulates the reflection spectra of multiple F–P sensors [13,14,15], imposes stringent cavity length matching requirements, thereby restricting channel scalability and necessitating costly near-infrared spectral equipment. Tunable laser-based systems, such as commercial FBG interrogators [16], exhibit superior performance in static measurements but suffer from Doppler-induced free spectral range (FSR) distortion during dynamic interferometry due to wavelength scanning delays [17,18], leading to substantial errors in traditional peak-to-peak [19,20], fast Fourier transform (FFT)-based [21], and cross-correlation [22,23] algorithms.
To address these challenges, we propose a multi-channel sparse-frequency-scanning white-light interferometry (SFS-WLI) system integrated with an adaptive mode-locked cross-correlation (MLCC) algorithm for high-precision dynamic cavity length demodulation. Employing telecom-grade semiconductor lasers (frequency sweep range: 191.2–196.15 THz, step: 50 GHz, 100 sampling points), the system achieves a 5 kHz spectral sampling rate, balancing hardware cost reduction with dynamic measurement adaptability. The MLCC algorithm effectively suppresses Doppler-induced measurement errors compared to conventional cross-correlation methods. Experimental validation confirms the system’s capability to synchronously demodulate multiple F–P sensors for pulse wave velocity detection. This approach offers a novel paradigm for cost-effective, multi-channel medical diagnostics, particularly suited for point-of-care testing (POCT) [24] and telemedicine applications.

2. Sensors and Interrogators

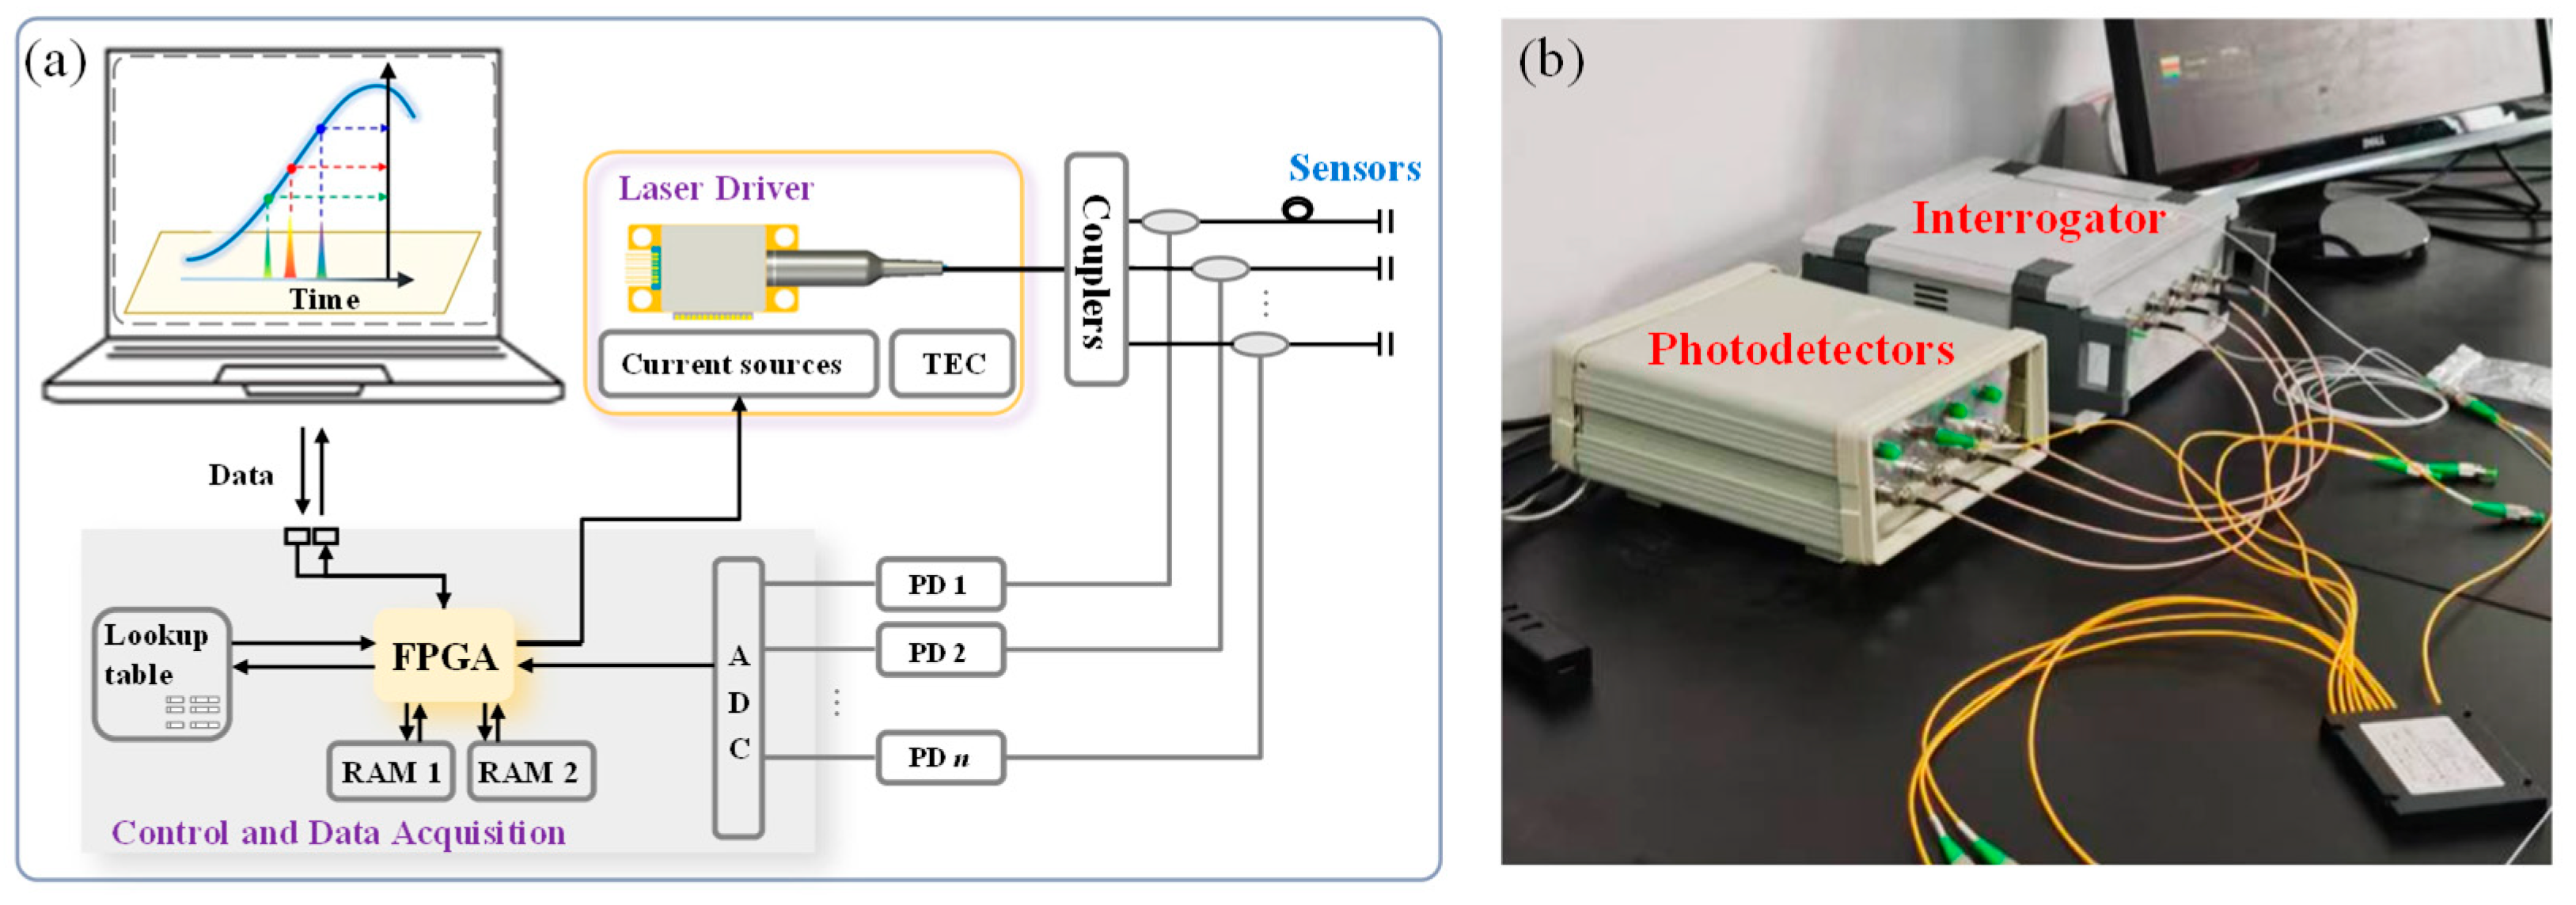
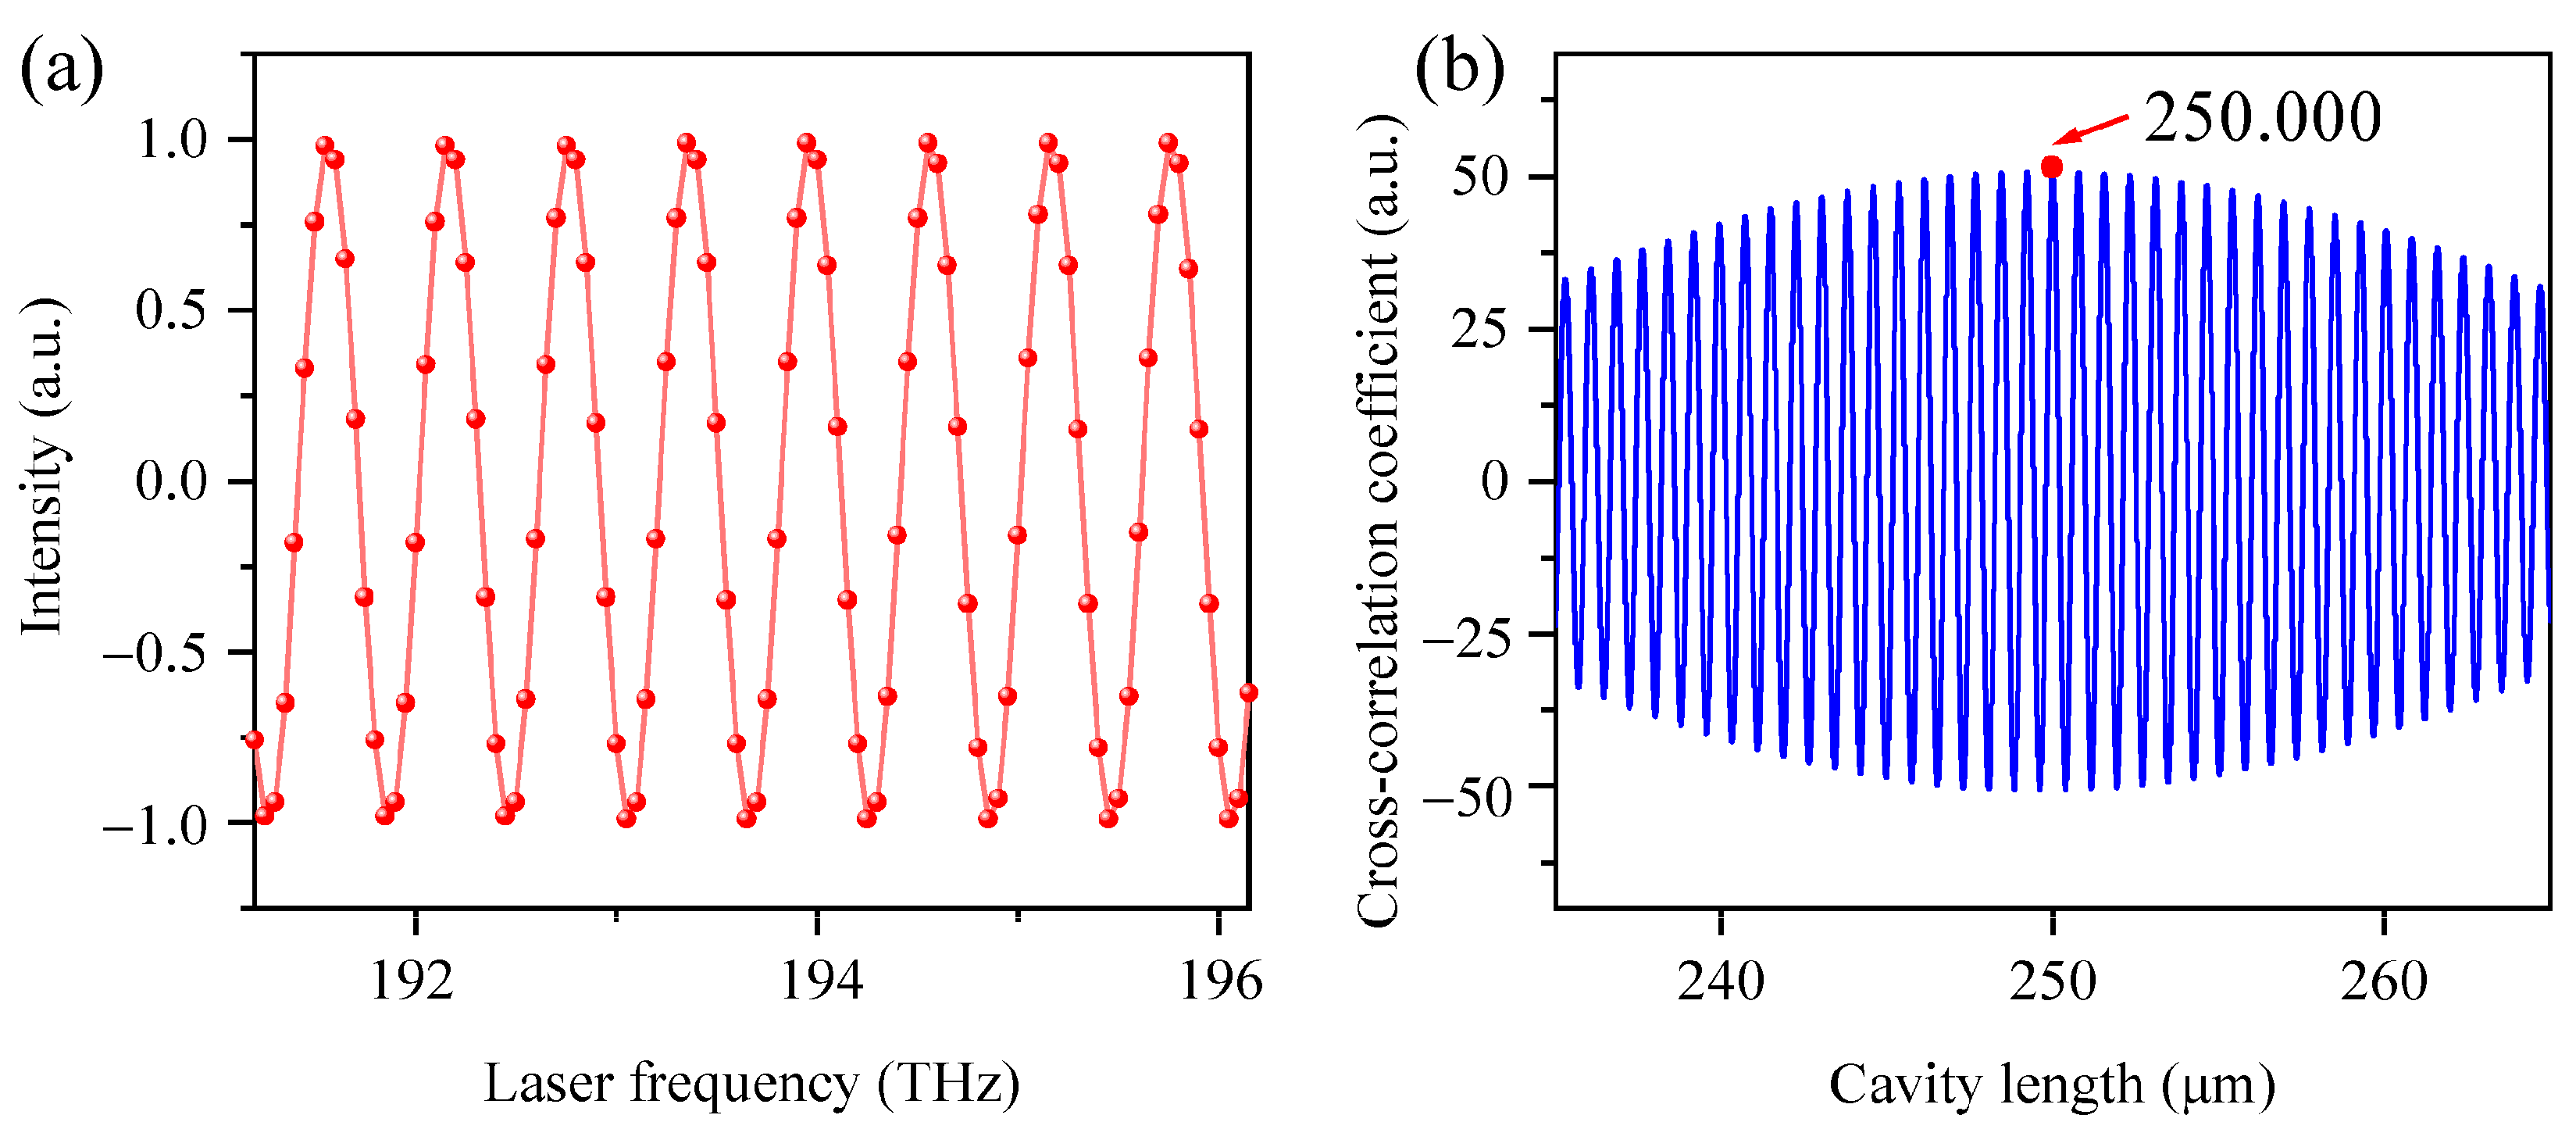
2.1. Sparse-Frequency-Scanning White-Light Interferometry System

To address the demand for low-cost, multi-channel pulse wave detection in medical diagnostics, we developed a WLI system based on monolithically integrated semiconductor tunable lasers. The system employs a modulated grating Y-branch (MG-Y) laser—a mature distributed Bragg reflector (DBR) laser technology originally developed for dense wavelength division multiplexing (DWDM) in telecommunications. Wavelength tuning is achieved through precise current injection into the left/right grating reflectors and phase section, leveraging the vernier effect to achieve broad spectral scanning across the C-band with rapid wavelength switching capability [25].
Notably, the current-driven tuning mechanism demonstrated stable discrete wavelength switching at frequencies of up to 10 MHz [26]. To overcome challenges in dynamic measurements, we propose a novel sparse-frequency-scanning architecture that reduces hardware costs while ensuring a high spectral sampling rate. Figure 1a presents a schematic diagram of the SFS-WLI system, while Figure 1b shows the physical implementation of the four-channel measurement setup.
The control system integrates five high-precision current sources with independent regulation of the left/right reflector currents (ILR and IRR), phase section current (Iphase), gain section current (Igain), and semiconductor optical amplifier (ISOA) current. A field-programmable gate array (FPGA) provides cost-effective control of laser modulation and multi-channel spectral data acquisition. Operating at 500 kHz modulation frequency, the system achieves full-spectrum sampling at 5 kHz while covering a spectral range from 191.2 THz to 196.15 THz. By adding photodetectors and corresponding analog-to-digital converters, the number of detection channels can be further expanded.

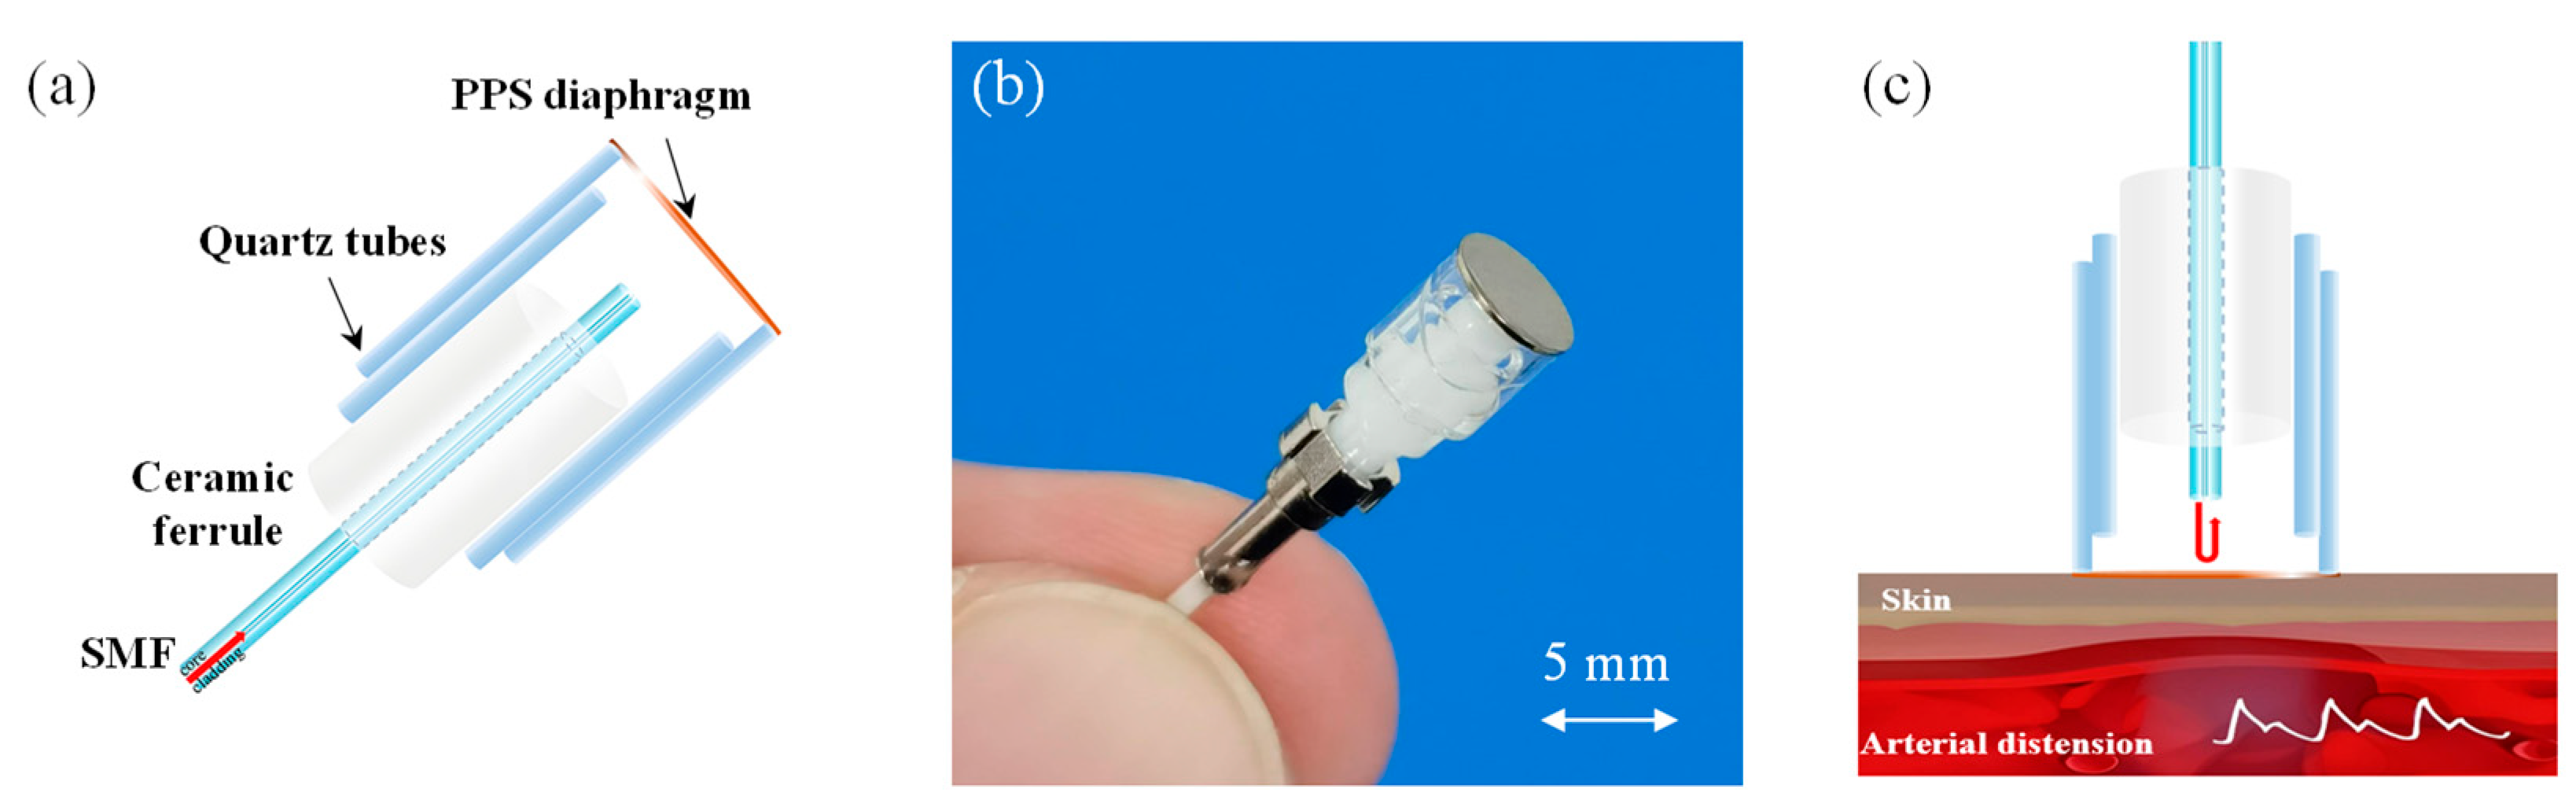
2.2. Diaphragm-Based Fabry–Pérot Pulse Wave Sensor

The fiber-optic pulse wave sensor was constructed through the assembly of single-mode fiber (SMF), ceramic ferrule (126 μm inner diameter, 2.5 mm outer diameter), precision quartz tubes (inner/outer diameters: 2.5/4 mm and 4/5 mm), and metal–polymer composite film as schematically illustrated in Figure 2a. The zirconia ceramic ferrule, serving as the fiber alignment structure, features a 126 μm bore for SMF fixation and a 2.5 mm-outer diameter surface designed for graded mechanical matching with the two-step quartz tubes. This multi-stage coaxial alignment configuration enables self-aligned assembly through UV adhesive bonding. A sputter-deposited nickel layer (≈100 nm) was applied to the polyphenylene sulfide (PPS) substrate to form a high-reflectivity composite membrane. The optical sensing architecture establishes a Fabry–Pérot interferometer where the polished fiber end-face serves as the first reflective interface, while the nickel-coated PPS membrane (5 mm diameter, 2 μm thickness) acts as the second reflective surface. The composite membrane, as shown in the prototype photograph (Figure 2b), enables effective coupling with arterial pulsations.
As demonstrated in Figure 2c, when the PPS composite membrane interfaces with the radial artery in the wrist, arterial distension induces micrometer-scale membrane deflection (Δd). This deflection modulates the F–P cavity length between the fiber tip and membrane center, which is detected in real time. The non-contact detection mechanism ensures non-invasive acquisition of the pulse waveform.

3. Fibonacci-Optimized Adaptive Mode-Locking Algorithm

For air cavity low-finesse F–P interferometers, the reflected light intensity as a function of optical frequency can be expressed as
I ( ν i ) = A ( ν i ) + B ( ν i ) cos 4 π L ν i c + π
where ν denotes the optical frequency, c represents the speed of light in vacuum, and L is the cavity length. A(ν) and B(ν) correspond to the DC component and amplitude of the interference spectrum, respectively. In this experimental configuration, the wavelength-stabilized output power of the MG-Y laser is achieved through injection current tuning, allowing A(ν) and B(ν) to be treated as constants.
Conventional white-light interferometry algorithms, including FFT, peak-to-peak, and cross-correlation algorithms, are typically employed to extract absolute cavity length information. After eliminating source envelope effects and DC components, the normalized intensity at a specific optical frequency simplifies to
I ( ν i ) = cos ( 4 π ν i c L + π )
The cross-correlation coefficient for a given cavity length estimate L ^  is defined as
R ( L ^ ) = i = 1 N I ( ν i ) cos 4 π ν i c L ^ + π
where N represents the number of discrete spectral points. By iterating through a predefined cavity length search range with appropriate step sizes, the optimal estimate corresponds to the L ^ value maximizing R ( L ^ ) . Figure 3a displays simulated interference spectra for a 250 μm F–P sensor, with the corresponding cross-correlation profile shown in Figure 3b. The peak position at 250 μm confirms the theoretical predictions.
The computational load of the cross-correlation algorithm is substantial, and there is a tendency for errors to misidentify adjacent peaks during the maximum value selection, resulting in a mode jumping phenomenon [27,28]. By initially obtaining a rough cavity length of the sensor using FFT or Buneman frequency estimation (BFE) [21] and then applying the cross-correlation algorithm in the vicinity of this rough cavity length to obtain a refined cavity length, the number of cross-correlation operations can be significantly reduced, and mode jumping can be suppressed. However, for dynamically varying F–P cavities, time-dependent phase modulation arises during frequency scanning. The cavity length under sinusoidal modulation can be modeled as
L t = L 0 + C sin ( 2 π f t )
where L0, C, and f denote the initial cavity length, vibration amplitude, and vibration frequency, respectively. Figure 4a illustrates interferometric spectra acquired under different dynamic conditions (laser modulation rate: 500 kHz, 0.002 ms sampling intervals). For the first interference spectrum obtained after applying vibrations, the theoretical cavity lengths for vibrations of (50 Hz, 1000 nm), (500 Hz, 200 nm), and (500 Hz, 500 nm) are 250.031 μm, 250.060 μm, and 250.151 μm, respectively. The demodulation results from using the conventional cross-correlation algorithm are 252.352 μm, 254.704 μm, and 261.762 μm, respectively. Due to the distortion of the free spectral range (FSR) caused by dynamic changes in the cavity, conventional algorithms, including cross-correlation, FFT, and peak-to-peak methods, will exhibit significant demodulation errors. The higher the vibration frequency and the greater the amplitude, the more pronounced the introduced errors will be.
The initial cavity length was determined as 250 μm through prior calibration. By constraining cavity length variations within one mode spacing, we established a restricted search window centered at 250 μm with a ±0.4 μm range (total span 0.8 μm) for cross-correlation analysis. Within this optimized parameter space, maximum cross-correlation coefficients were systematically identified through discrete cavity length scanning. As shown in Figure 4b–d, the demodulated cavity lengths obtained through this constrained optimization method yielded values of 250.030 μm, 250.060 μm, and 250.153 μm. These results demonstrate significant error reduction compared to conventional cross-correlation algorithms without mode locking.
In addition, to minimize redundant computations, we propose a mode-locked cross-correlation (MLCC) algorithm integrated with Fibonacci optimization:
  • Search range confinement: restrict template matching to a ±0.4 μm neighborhood around the initial cavity length L0;
  • Computational optimization: implement a Fibonacci search strategy to reduce algorithmic complexity.
Figure 5 shows a flowchart of the MLCC algorithm assisted by the Fibonacci search method.
The Fibonacci coefficients are generated in advance, which satisfy
F k + 1 = F k + F k 1 , k = 1 , 2 , 3 ,
where F0 = F1 = 1. The Fibonacci-optimized search procedure comprises the following steps:
(1)
Initialization:
Define the initial search interval [a, b] based on L0.
(2)
Calculate the partition points:
In the kth iteration, x1 and x2 represent the partition points in the search interval.
x 1 = a + F n k F n k + 2 ( b a )
x 2 = a + F n k + 1 F n k + 2 ( b a )
Only in the first iteration do both points R(x1) and R(x2) need to be calculated.
(3)
Narrow the search interval. Calculate the cross-correlation coefficient based on Equation (3):
If R(x1) > R(x2), set b = x2 and use x1 as x2 for the next round; one only needs to calculate the new x1.
If R(x1) ≤ R(x2), set a = x1 and use x2 as x1 for the next round; one only needs to calculate the new x2.
(4)
Output the estimated cavity length Le:
When k > n, the iteration process is completed. The estimated cavity length is the center value of the final search interval.
(5)
Adaptive mode locking:
Update L0 to Le to achieve adaptive mode locking during continuous spectrum acquisition and demodulation.
Under dynamic loading at 50 Hz with a 1000 nm amplitude, Figure 6 compares the cross-correlation coefficient distributions of the standard MLCC algorithm versus the Fibonacci-optimized MLCC variant. The Fibonacci–MLCC algorithm achieves sub-nanometer accuracy, yielding a demodulated value of 250.0308 μm with <1 nm deviation from theory. For a 0.8 μm search range with 1 nm resolution, traditional exhaustive search requires 800 computations, while the Fibonacci-optimized method achieves an equivalent precision (n = 13) with only 14 evaluations—a 57-fold efficiency improvement. Table 1 lists the theoretical cavity length values under an initial cavity length of 250 μm, with different applied vibration frequencies and amplitudes, along with a comparison of demodulation results using various demodulation algorithms.
We further investigated the demodulation performance under varying initial cavity lengths and vibrational conditions. Figure 7 compares the demodulated waveforms of the conventional BFE-CC algorithm and the Fibonacci–MLCC algorithm. Three configurations were examined: Case 1 (Figure 7a) featured a 150 μm cavity with 10 Hz/5000 nm vibration, Case 2 (Figure 7b) employed a 250 μm cavity under 50 Hz/1000 nm excitation, and Case 3 (Figure 7c) implemented a 350 μm cavity subjected to 500 Hz/200 nm dynamic loading. The traditional BFE-CC algorithm shows peak demodulation errors at the maximum slope of the vibration waveform, while in the region of minimum slope (such as at the waveform peak), the demodulation results are similar to those of the Fibonacci–MLCC algorithm. This phenomenon is attributed to Doppler-induced phase errors, which escalate with the cavity length variation rate during spectral sampling [29,30]. In contrast, the theoretical value and the demodulation curve of the Fibonacci–MLCC algorithm basically overlap, the Fibonacci–MLCC algorithm maintains a sub-2 nm root-mean-square error (RMSE) across all the above cases (1.93 nm, 1.47 nm, and 1.06 nm for Cases 1–3).
The adaptive mode-locking algorithm effectively reduces dynamic cavity length demodulation errors, while the integrated Fibonacci search method maintains demodulation accuracy with reduced computational complexity. This synergistic approach effectively addresses dynamic demodulation challenges in fiber-optic sensing systems, providing a robust solution for dynamic monitoring applications.

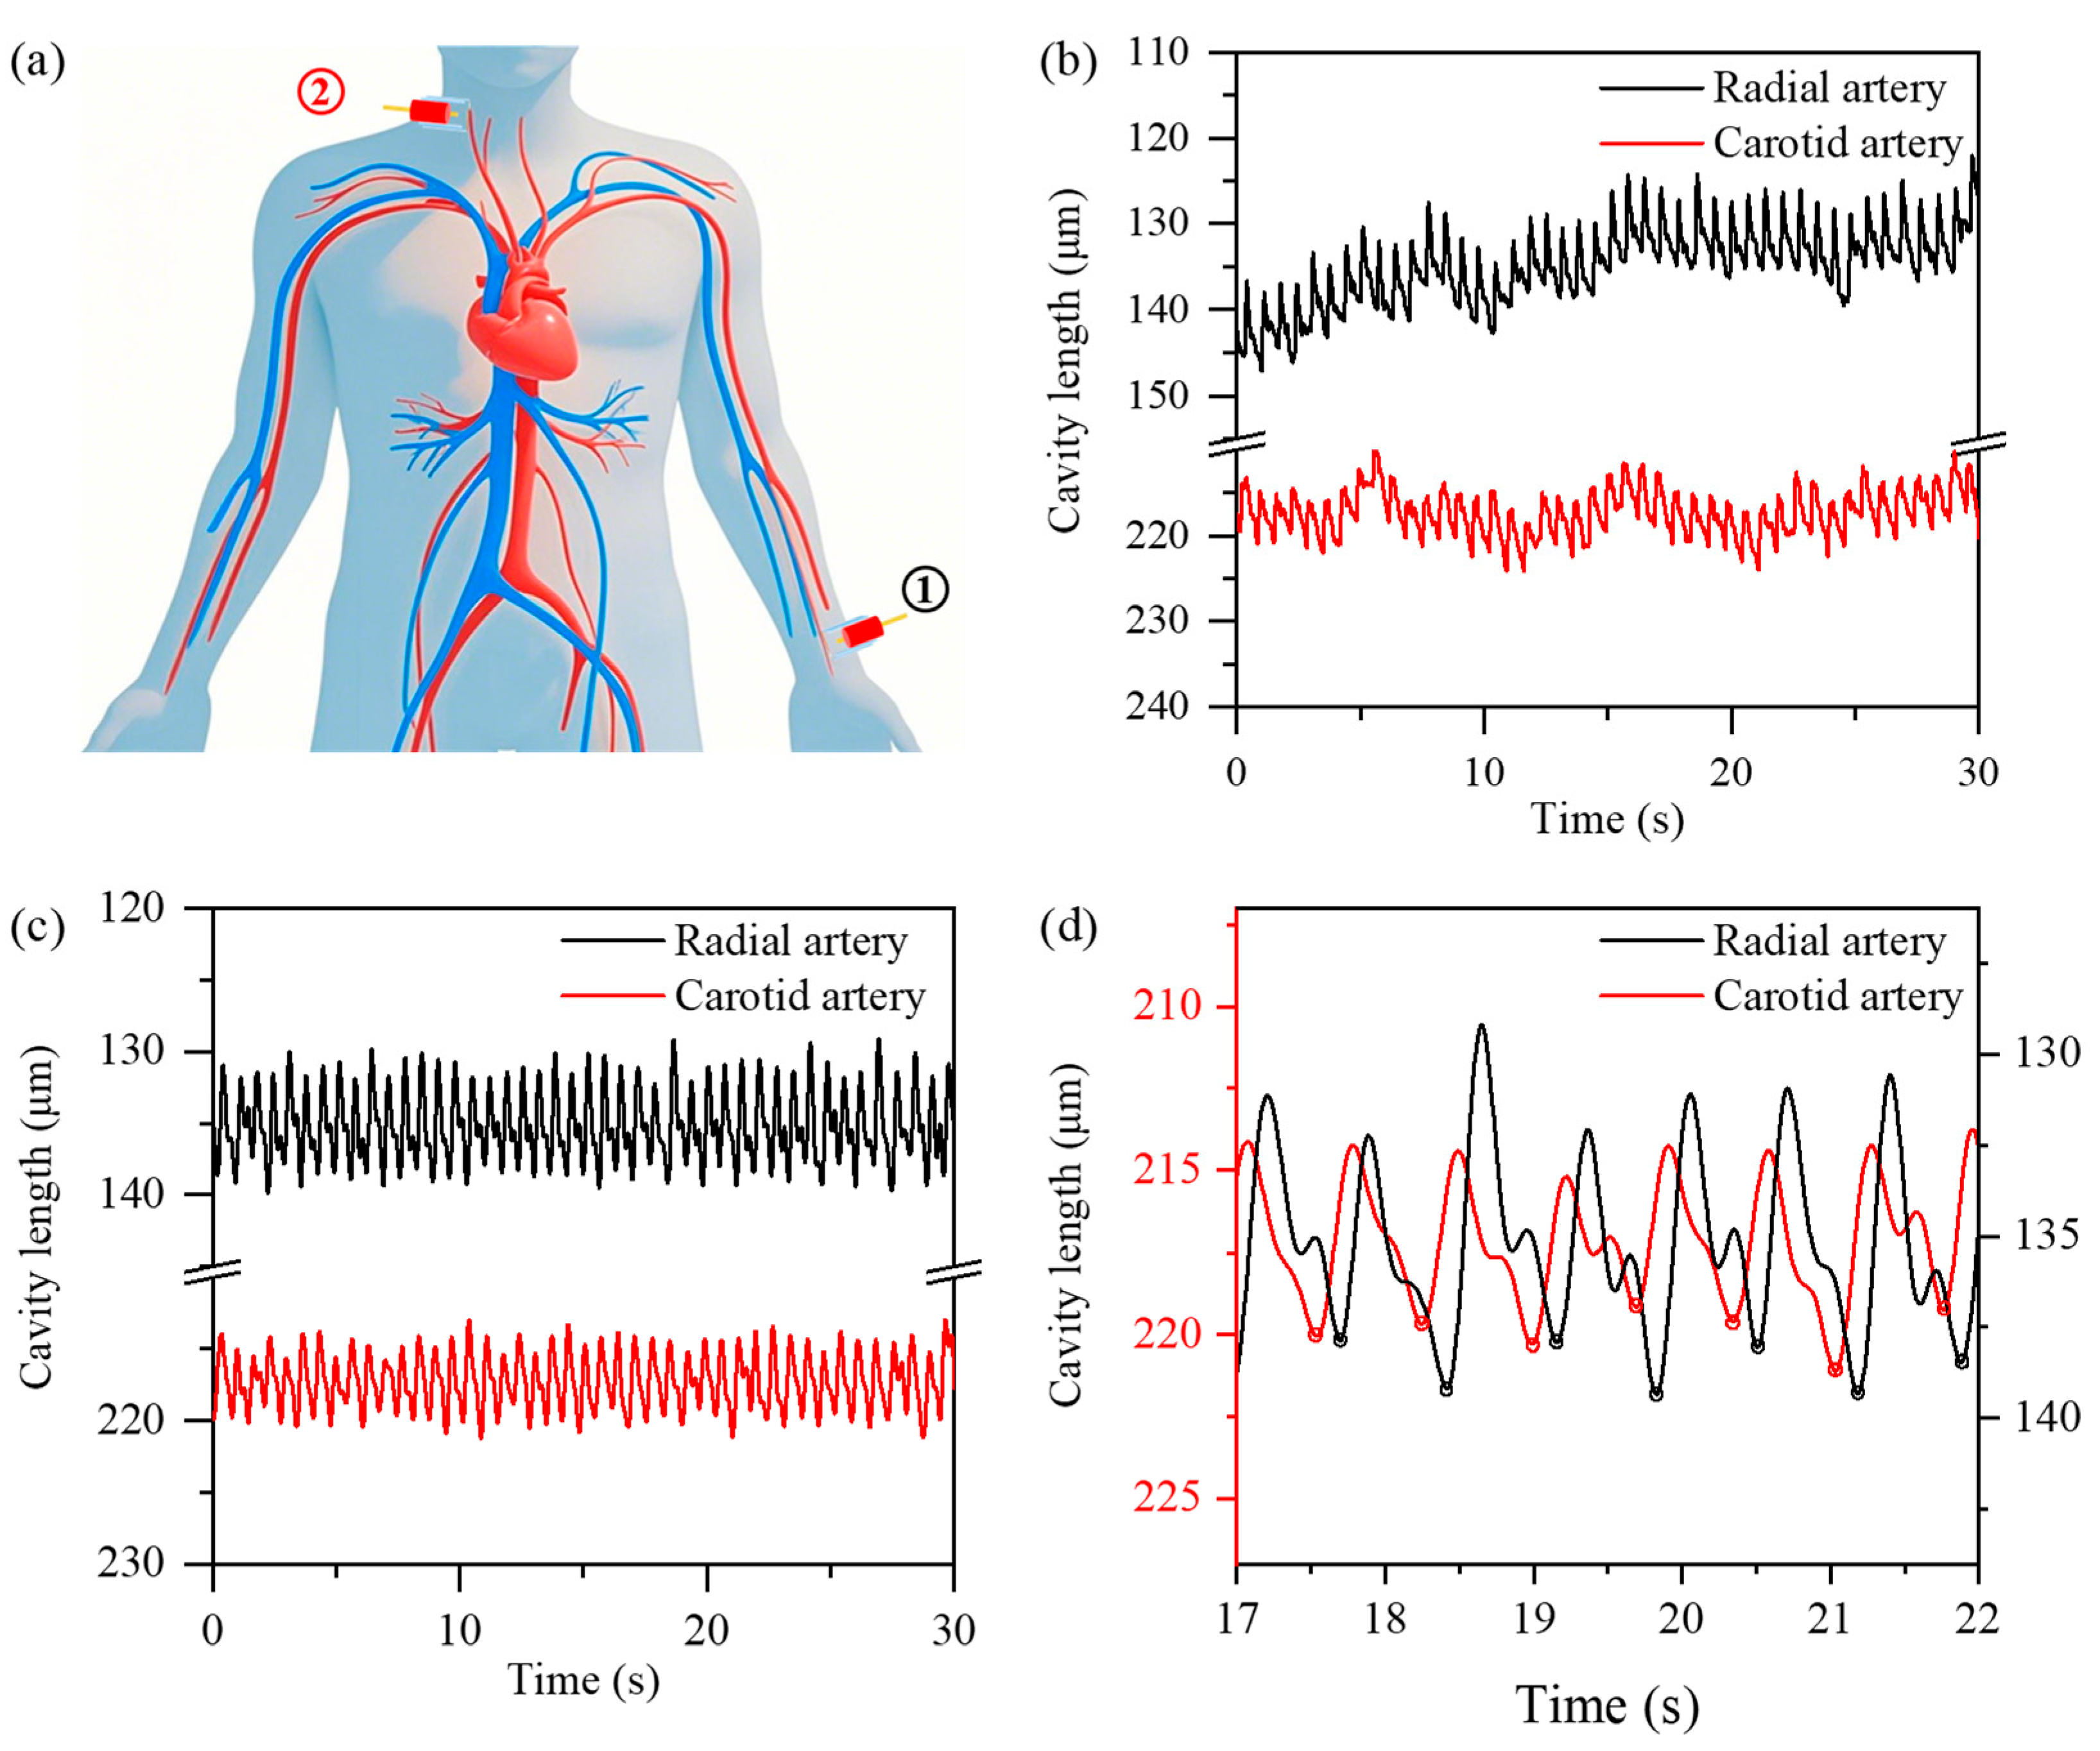
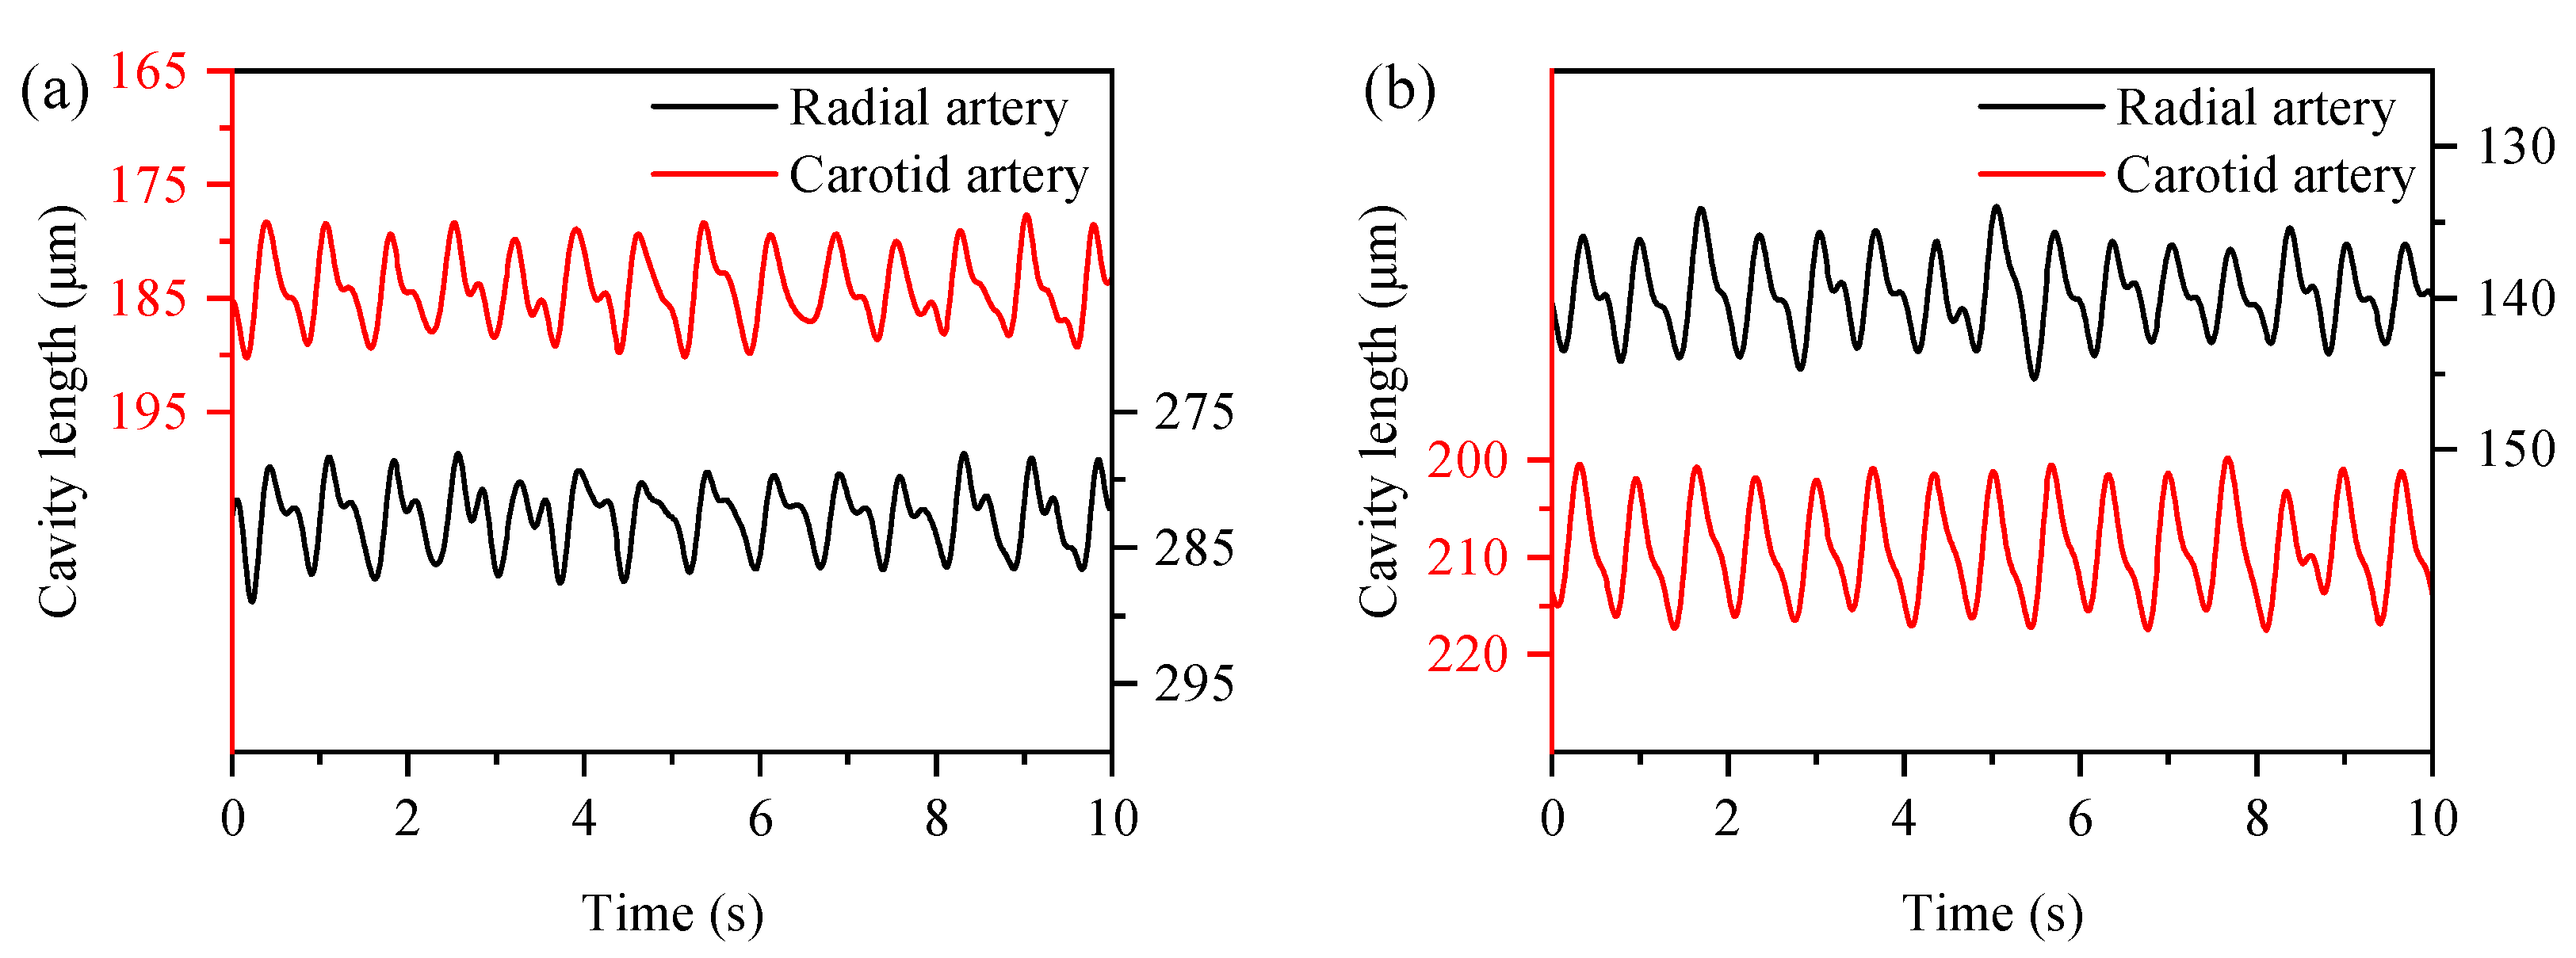
4. Pulse Wave Velocity Measurement

A 32-year-old healthy male volunteer participated in this study. The experimental protocol was approved by the Institutional Ethics Committee, and written informed consent was obtained prior to the experiment. Two fiber-optic F–P pulse wave sensors were non-invasively attached to the participant’s carotid artery (neck) and radial artery (wrist) at anatomically identified pulsation points (Figure 8a). The sensor diaphragms were secured to the skin surface using medical-grade adhesive tape to minimize motion artifacts. The participant maintained a relaxed seated posture (room temperature: 18 ± 1 °C, humidity: 50 ± 5%) during the recording session.
Raw cavity length waveforms (Figure 8b) were sampled at 5 kHz and processed through a bandpass filter (cutoff frequencies: 0.5 Hz and 4 Hz) to suppress respiratory interference (0.1–0.3 Hz) and high-frequency noise. The filtered carotid and radial artery waveforms (Figure 8c) exhibited a mean heart rate of 88 beats per minute (BPM). The time delay (Δt) was measured between the foot points of corresponding cardiac cycles in the carotid (red curve) and radial (black curve) waveforms (Figure 8d). The average Δt was about 0.16 s. The vascular path length (D) between measurement sites was determined as 0.82 m using a flexible tape measure along the body surface trajectory. Pulse wave velocity was calculated as 5.12 m/s. This result aligns with reported carotid–radial pulse wave velocity values in healthy adults [31,32], confirming the validity of the proposed system.
We then expanded the human testing to include two additional volunteers (a 26-year-old male and a 24-year-old female) and switched the sensor placement between the radial and carotid arteries. The carotid–radial pulse waveforms for these subjects are presented in Figure 9, with measured heart rates of 84 BPM and 90 BPM, respectively. These results align closely with parallel measurements from a Huawei Watch FIT 3 (84 BPM and 93 BPM), demonstrating the sensor’s reliability.

5. Discussion

Widely used near-infrared band fiber-optic sensing demodulators, such as Luna’s si155, are priced at around 40,000 US dollars; Ibsen’s I-MON 512 USB is priced around 5000 US dollars. If more channels or higher sampling rates are needed, the prices will be higher. The SFS-WLI system employs a mature semiconductor scanning laser as the light source, achieving high sampling rates through sparse sampling frequency scanning on conventional performance FPGA and ADC modules. By using spatial division multiplexing, adding photodetectors allows for the expansion of detection channels, significantly reducing system costs compared to conventional WLI based on broad-spectrum light sources and spectrometers.
By modulating the injection currents, the MG-Y laser can output specific optical frequencies or wavelengths. The switching frequency for discrete wavelengths is 500 kHz. For the range covering 191.2–196.15 THz, a spectrum with 100 sampling points has a scanning frequency of 5 kHz. During dynamic measurements, the 5 kHz spectral sampling rate satisfies the Nyquist criterion for signals up to 2.5 kHz. This paper provides a feasible solution for dynamic interferometric sensor measurement based on a scanning light source. However, it should be noted that adaptive mode locking requires continuous sampling, and the actual cavity length change between adjacent sampling spectra cannot exceed the mode locking range.
In addition to measuring the radial artery and carotid artery, the femoral artery, brachial artery, and other locations can also be measured at the same time. The fiber-optic F–P sensor array demonstrates promising potential for non-invasive hemodynamic monitoring.

6. Conclusions

In summary, we developed a novel SFS-WLI system integrated with an adaptive MLCC algorithm for measuring pulse wave velocity. The system demonstrated robust performance in resolving micrometer-scale arterial pulsations. The Fibonacci-optimized MLCC algorithm significantly enhanced computational efficiency (14 cross-correlation operations versus 800 in conventional searches) while suppressing Doppler-induced errors under dynamic vibrations. This will aid in the advancement of next-generation hemodynamic monitoring systems utilizing fiber-optic sensors. In the future, the combination of wearable devices and machine learning-based signal processing is expected to achieve real-time cardiovascular risk stratification in outpatient settings.

Author Contributions

Conceptualization, Y.X. and Q.L.; sensor fabrication, L.G. and C.Q.; software, Q.L.; validation, W.L. and X.C.; investigation, Y.X.; writing—original draft preparation, Y.X.; writing—review and editing, W.L.; supervision, Y.W.; project administration, Q.L. All authors have read and agreed to the published version of the manuscript.

Funding

This work was supported in part by the National Natural Science Foundation of China (62405139) and the Cultivation Project of the Chinese Hospital Reform and Development Research Institute of Nanjing University (NDYGN2023059, NDYG2022072).

Institutional Review Board Statement

Not applicable.

Informed Consent Statement

Informed consent was obtained from all subjects involved in this study.

Data Availability Statement

Dataset is available on request from the authors.

Conflicts of Interest

The authors declare no conflicts of interest.

References

  1. Sarabi, M.R.; Jiang, N.; Ozturk, E.; Yetisen, A.K.; Tasoglu, S. Biomedical optical fibers. Lab Chip 2021, 21, 627–640. [Google Scholar] [CrossRef]
  2. Zhang, X.; Wang, C.; Zheng, T.; Wu, H.; Wu, Q.; Wang, Y. Wearable optical fiber sensors in medical monitoring applications: A review. Sensors 2023, 23, 6671. [Google Scholar] [CrossRef] [PubMed]
  3. Yang, L.; Li, Y.; Fang, F.; Li, L.; Yan, Z.; Zhang, L.; Sun, Q. Highly sensitive and miniature microfiber-based ultrasound sensor for photoacoustic tomography. Opto-Electron. Adv. 2022, 5, 200076-1–200076-8. [Google Scholar] [CrossRef]
  4. Jha, R.; Mishra, P.; Kumar, S. Advancements in optical fiber-based wearable sensors for smart health monitoring. Biosens. Bioelectron. 2024, 254, 116232. [Google Scholar] [CrossRef] [PubMed]
  5. Zhao, C.; Liu, D.; Cai, Z.; Du, B.; Zou, M.; Tang, S.; Li, B.; Xiong, C.; Ji, P.; Zhang, L. A wearable breath sensor based on fiber-tip microcantilever. Biosensors 2022, 12, 168. [Google Scholar] [CrossRef] [PubMed]
  6. Shao, M.; Yuan, Y.; Wang, M.; Liu, Y.; Qiao, X. Optical fiber sensor for wearable and accurate human respiratory monitoring. Biomed. Opt. Express 2024, 15, 4132–4146. [Google Scholar] [CrossRef]
  7. Xiong, L.; Zhong, H.; Wan, S.; Yu, J. Single-point curved fiber optic pulse sensor for physiological signal prediction based on the genetic algorithm-support vector regression model. Opt. Fiber Technol. 2024, 82, 103583. [Google Scholar] [CrossRef]
  8. Martinek, R.; Nedoma, J.; Fajkus, M.; Kahankova, R.; Konecny, J.; Janku, P.; Kepak, S.; Bilik, P.; Nazeran, H. A phonocardiographic-based fiber-optic sensor and adaptive filtering system for noninvasive continuous fetal heart rate monitoring. Sensors 2017, 17, 890. [Google Scholar] [CrossRef]
  9. Shin, J.; Liu, Z.; Bai, W.; Liu, Y.; Yan, Y.; Xue, Y.; Kandela, I.; Pezhouh, M.; MacEwan, M.R.; Huang, Y.; et al. Bioresorbable optical sensor systems for monitoring of intracranial pressure and temperature. Sci. Adv. 2019, 5, eaaw1899. [Google Scholar] [CrossRef]
  10. Najafzadeh, A.; Serandi Gunawardena, D.; Liu, Z.; Tran, T.; Tam, H.-Y.; Fu, J.; Chen, B.K. Application of fibre bragg grating sensors in strain monitoring and fracture recovery of human femur bone. Bioengineering 2020, 7, 98. [Google Scholar] [CrossRef]
  11. Li, L.; Li, Y.; Yang, L.; Fang, F.; Yan, Z.; Sun, Q. Continuous and Accurate Blood Pressure Monitoring Based on Wearable Optical Fiber Wristband. IEEE Sens. J. 2021, 21, 3049–3057. [Google Scholar]
  12. Peltokangas, M.; Telembeci, A.A.; Verho, J.; Mattila, V.M.; Romsi, P.; Vehkaoja, A.; Lekkala, J.; Oksala, N. Parameters Extracted From Arterial Pulse Waves as Markers of Atherosclerotic Changes: Performance and Repeatability. IEEE J. Biomed. Health Inform. 2018, 22, 750–757. [Google Scholar] [PubMed]
  13. Li, C.; Guo, M.; Wang, Z.; Zhao, X.; Qi, H.; Han, X.; Cui, D.; Zhao, J.; Peng, W.; Chen, K. Fiber-Optic Photoacoustic Gas Sensor with Multiplexed Fabry–Pérot Interferometric Cantilevers. Anal. Chem. 2023, 95, 17477–17485. [Google Scholar]
  14. Qi, X.; Binghe, M.; Zhiyong, T.; Ruofei, L.; Zhibo, M. Dynamic Demodulation Technique for Tandem Dual-Cavity EFPI Sensors Enabling Simultaneous Temperature Measurement in Harsh Environment. IEEE Sens. J. 2024, 24, 28844–28851. [Google Scholar] [CrossRef]
  15. Lee, C.-L.; Ma, C.-T.; Yeh, K.-C.; Chen, Y.-M. A Dual-Cavity Fiber Fabry–Pérot Interferometer for Simultaneous Measurement of Thermo-Optic and Thermal Expansion Coefficients of a Polymer. Polymers 2022, 14, 4966. [Google Scholar] [CrossRef] [PubMed]
  16. Wang, X.; Yang, Y.; Zheng, Y.; Yi, S.; Chen, S.; Duan, C.; Tian, Y.; Zhang, J. Vector magnetic field characteristics of magneto-shape effect with high figure of merit based on fiber optic vernier effect. Opt. Laser Technol. 2025, 181, 111670. [Google Scholar] [CrossRef]
  17. Chen, Y.; Lei, X.; Zhang, P.; Liu, X.; Zhang, W.; Shao, B.; Liu, H. Dynamic demodulation of low-finesse fabry-perot sensors based on instantaneous frequency analysis. J. Light. Technol. 2022, 40, 2996–3002. [Google Scholar]
  18. Ren, Y.; Zhang, P.; Shao, B.; Han, G.; Chang, X.; Liu, X.; Lei, X. Adaptive active reconstruction algorithm for dynamic clearance frequency-sweep interference signals. Measurement 2025, 245, 116562. [Google Scholar]
  19. Jiang, Y. High-resolution interrogation technique for fiber optic extrinsic Fabry–Perot interferometric sensors by the peak-to-peak method. Appl. Opt. 2008, 47, 925–932. [Google Scholar]
  20. Zheng, H.; Ma, L.; Li, C.; Jie, R.; Zhuang, Y.; Zhu, C.; Rao, Y. Detection of large dynamic range acoustic signal using OPD-based fiber-optic interferometric demodulation with SNR enhancement. J. Light. Technol. 2024, 42, 4689–4697. [Google Scholar] [CrossRef]
  21. Yu, Z.; Wang, A. Fast white light interferometry demodulation algorithm for low-finesse Fabry–Pérot sensors. IEEE Photonics Technol. Lett. 2015, 27, 817–820. [Google Scholar] [CrossRef]
  22. Zhou, X.; Yu, Q. Wide-range displacement sensor based on fiber-optic Fabry–Perot interferometer for subnanometer measurement. IEEE Sens. J. 2010, 11, 1602–1606. [Google Scholar] [CrossRef]
  23. Xie, J.; Wang, F.; Pan, Y.; Wang, J.; Hu, Z.; Hu, Y. High resolution signal-processing method for extrinsic Fabry–Perot interferometric sensors. Opt. Fiber Technol. 2015, 22, 1–6. [Google Scholar] [CrossRef]
  24. Jain, S.; Nehra, M.; Kumar, R.; Dilbaghi, N.; Hu, T.; Kumar, S.; Kaushik, A.; Li, C.-z. Internet of medical things (IoMT)-integrated biosensors for point-of-care testing of infectious diseases. Biosens. Bioelectron. 2021, 179, 113074. [Google Scholar] [CrossRef] [PubMed]
  25. Liu, Q.; Jing, Z.; Li, A.; Liu, Y.; Huang, Z.; Zhang, Y.; Peng, W. Common-path dual-wavelength quadrature phase demodulation of EFPI sensors using a broadly tunable MG-Y laser. Opt. Express 2019, 27, 27873–27881. [Google Scholar] [CrossRef]
  26. Liu, Q.; Jing, Z.; Xia, Z.; Huang, Z.; Peng, W. Fiber-Optic Ultrasonic Sensing via Quasi-Continuous Quadrature Frequency Modulation. IEEE Photonics Technol. Lett. 2020, 32, 1385–1388. [Google Scholar] [CrossRef]
  27. Chen, H.; Liu, J.; Zhang, X.; Wang, W.; Ma, Z.; Lv, W.; Guo, Z. High-Order Harmonic-Frequency Cross-Correlation Algorithm for Absolute Cavity Length Interrogation of White-Light Fiber-Optic Fabry-Perot Sensors. J. Light. Technol. 2020, 38, 953–960. [Google Scholar] [CrossRef]
  28. Ushakov, N.A.; Liokumovich, L.B. Abrupt λ/2 demodulation errors in spectral interferometry: Origins and suppression. IEEE Photonics Technol. Lett. 2020, 32, 1159–1162. [Google Scholar] [CrossRef]
  29. Shao, B.; Zhang, W.; Zhang, P.; Chen, W. Dynamic Clearance Measurement Using Fiber-Optic Frequency-Swept and Frequency-Fixed Interferometry. IEEE Photonics Technol. Lett. 2020, 32, 1331–1334. [Google Scholar] [CrossRef]
  30. Liu, H.; Zhang, W.; Shao, B.; Zhang, P.; Chen, W. Algorithm of Doppler error suppression in frequency-swept interferometry for the dynamic axial clearance measurement of high-speed rotating machinery. Opt. Express 2021, 29, 42471–42484. [Google Scholar] [CrossRef]
  31. Ushakov, N.A.; Markvart, A.A.; Liokumovich, L.B. Pulse Wave Velocity Measurement With Multiplexed Fiber Optic Fabry–Perot Interferometric Sensors. IEEE Sens. J. 2020, 20, 11302–11312. [Google Scholar] [CrossRef]
  32. Hsu, Y.P.; Young, D.J. Skin-Coupled Personal Wearable Ambulatory Pulse Wave Velocity Monitoring System Using Microelectromechanical Sensors. IEEE Sens. J. 2014, 14, 3490–3497. [Google Scholar]
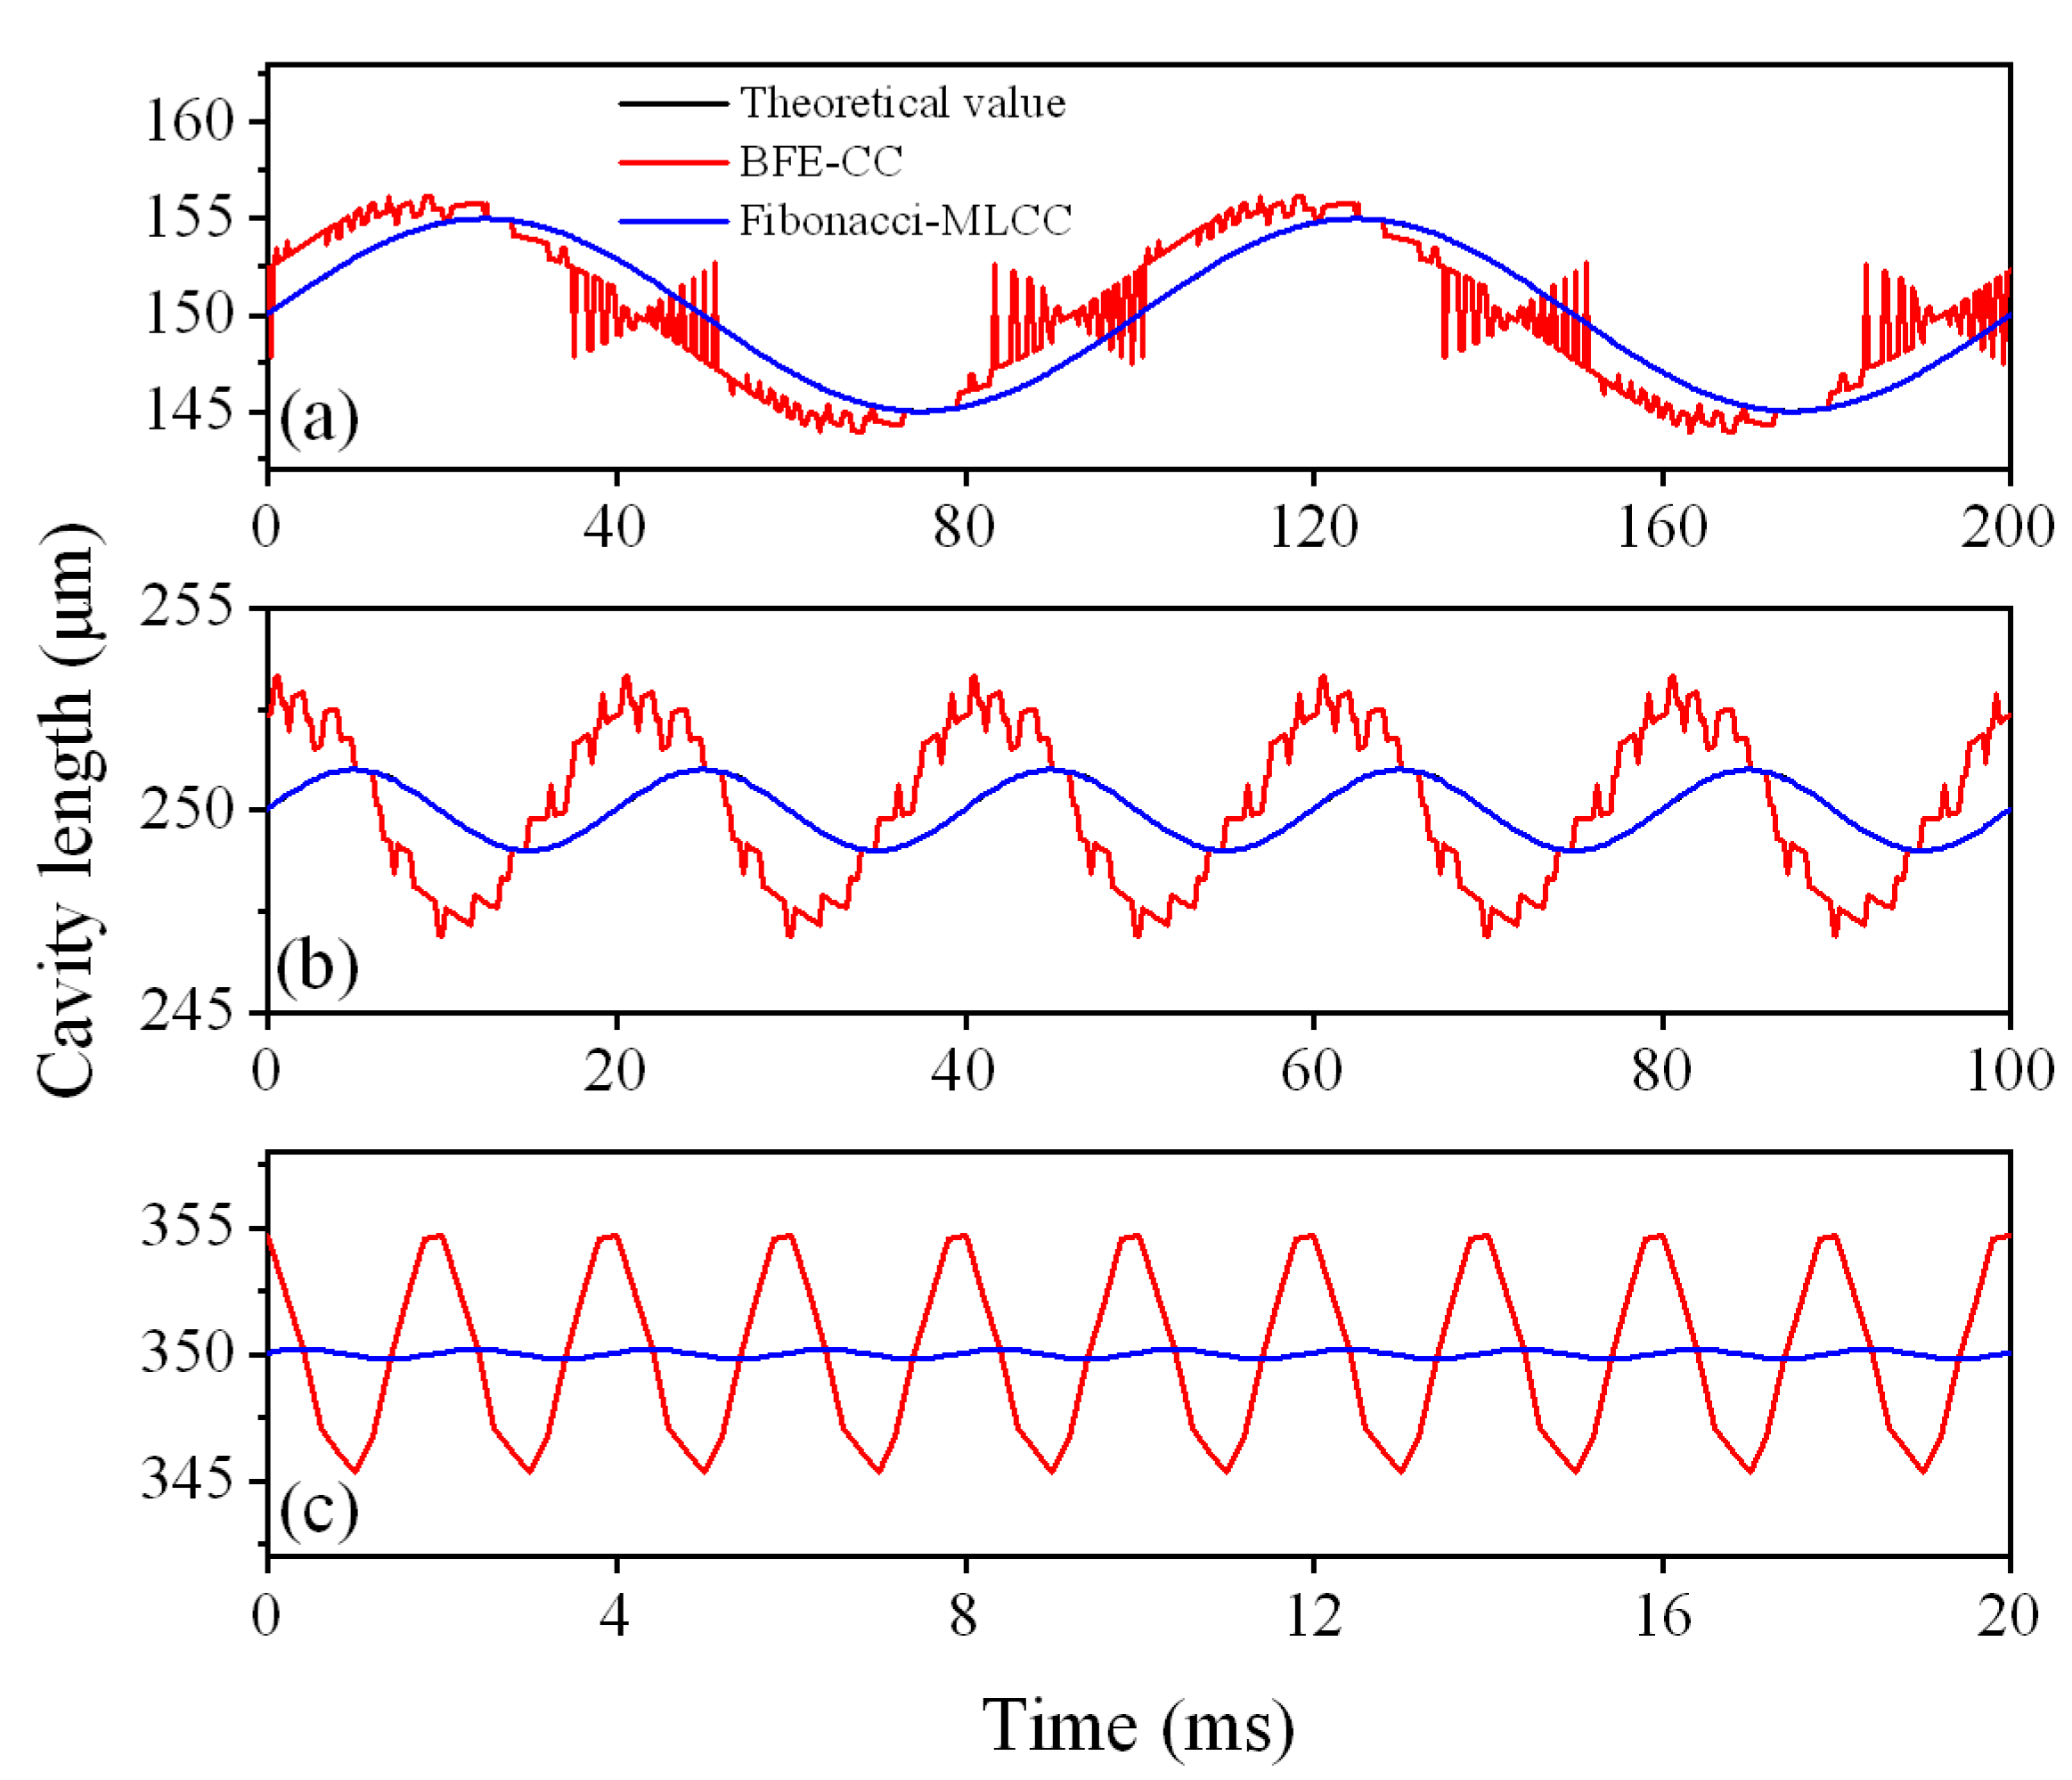
Figure 1. Sparse-frequency-scanning white-light interferometry (SFS-WLI) system. (a) Schematic diagram of system; (b) picture of the multi-channel measurement system.
Photonics 12 00316 g001
Figure 2. Structural configuration and operational principle of the fiber-optic Fabry–Pérot pulse wave sensor. (a) Sensor assembly structure; (b) prototype of the sensor probe; (c) mechanism of membrane deflection induced by arterial pulsation.
Photonics 12 00316 g002
Figure 3. Cross-correlation algorithm validation for static cavity length determination. (a) Simulated interference spectra of a 250 μm Fabry–Pérot sensor; (b) cross-correlation profile demonstrating unambiguous peak localization at the theoretical cavity length.
Photonics 12 00316 g003
Figure 4. Dynamic demodulation performance evaluation. (a) Acquired interference spectra under controlled vibrations; (bd) cavity length demodulation results for three dynamic conditions: (b) 50 Hz/1000 nm, (c) 500 Hz/200 nm, and (d) 500 Hz/500 nm.
Photonics 12 00316 g004
Figure 5. Flowchart of Fibonacci-optimized MLCC algorithm.
Photonics 12 00316 g005
Figure 6. Comparative analysis of MLCC algorithms: standard implementation versus Fibonacci-optimized architecture under dynamic loading conditions.
Photonics 12 00316 g006
Figure 7. Dynamic demodulation performance comparison between conventional Buneman frequency estimation cross-correlation (BFE-CC) and Fibonacci-optimized mode-locked cross-correlation (MLCC) algorithms: (a) 150 μm initial cavity length with 10 Hz/5000 nm vibration; (b) 250 μm cavity with 50 Hz/1000 nm vibration; (c) 350 μm cavity with 500 Hz/200 nm vibration.
Photonics 12 00316 g007
Figure 8. Pulse wave acquisition. (a) Placement of two fiber-optic F–P pulse wave sensors on the carotid artery (neck) and radial artery (wrist); (b) raw signal; (c) bandpass-filtered (0.5–4 Hz) pulse waveforms from the carotid and radial arteries; (d) pulse wave delay time measurement.
Photonics 12 00316 g008
Figure 9. Multi-channel pulse wave measurement results of two other subjects. (a) 26-year-old male; (b) 24-year-old female.
Photonics 12 00316 g009
Table 1. Theoretical values compared to demodulation results from five spectral processing algorithms. Buneman frequency estimation (BFE), conventional cross-correlation (CC), hybrid BFE-CC, mode-locked cross-correlation (MLCC), and Fibonacci-optimized MLCC.
Applied VibrationTheoretical ValueBFECCBFE-CCMLCCFibonacci–MLCC
0 Hz, 0 nm250.000249.593250.000250.000250.000205.0007
2 Hz, 20 μm250.025251.604251.572251.572250.024250.0243
50 Hz, 1000 nm250.031252.119252.352252.352250.030250.0308
100 Hz, 1000 nm250.062254.753254.706254.706250.062250.0623
500 Hz, 200 nm250.060254.466254.704254.704250.060250.0610
500 Hz, 500 nm250.151261.953261.762261.762250.153250.1528
Disclaimer/Publisher’s Note: The statements, opinions and data contained in all publications are solely those of the individual author(s) and contributor(s) and not of MDPI and/or the editor(s). MDPI and/or the editor(s) disclaim responsibility for any injury to people or property resulting from any ideas, methods, instructions or products referred to in the content.

