Article

Investigation on the Full-Aperture Diffraction Efficiency of AOTF Based on Tellurium Dioxide Crystals

1
School of Instrumentation Science & Opto-Electronics Engineering, Beihang University, No. 37 Xueyuan Road, Haidian District, Beijing 100191, China
2
Key Laboratory of “Precision Opto-Mechatronics Technology”, Ministry of Education, No. 37 Xueyuan Road, Haidian District, Beijing 100191, China
3
Institute of Artificial Intelligence, Beihang University, No. 37 Xueyuan Road, Haidian District, Beijing 100191, China
*
Authors to whom correspondence should be addressed.
Photonics 2025, 12(4), 335; https://doi.org/10.3390/photonics12040335
Submission received: 17 February 2025 / Revised: 22 March 2025 / Accepted: 1 April 2025 / Published: 2 April 2025

Abstract

:
The influence of acoustic field distribution and temperature variations on the full-aperture diffraction efficiency of non-collinear acousto-optic tunable filters (AOTFs) was investigated based on tellurium dioxide crystals. The strong acoustic anisotropy of the crystal induces non-uniform acoustic energy distribution, limiting the overall diffraction efficiency. To analyze this effect, the acoustic field distribution within a large-aperture AOTF was simulated, and the diffraction efficiency across different aperture regions was evaluated and experimentally validated. The results demonstrate that sound beam contraction and acoustic energy non-uniformity significantly reduce the peak diffraction efficiency and increase the power required to achieve high diffraction efficiency. Additionally, temperature-induced variations in acoustic velocity alter the acoustic field structure, leading to spatially non-uniform changes in diffraction efficiency. Both simulations and experimental measurements confirm that while the overall impact of temperature on full-aperture diffraction efficiency remains relatively small, localized variations are pronounced, highlighting potential inaccuracies in single-beam-based efficiency measurements.

1. Introduction

Acousto-optic (AO) devices are widely used for spectroscopy [1,2,3], ultrashort laser pulse shaping [4,5], and laser beam control [4,6]. They offer several advantages, including compact size, rapid tuning, wide spectral range, and all-solid-state construction [7,8,9]. The non-collinear AOTF is a notable acousto-optic device, which facilitates better separation of diffracted light. Such AOTFs typically feature large optical apertures (usually greater than 10 × 10 mm2, up to 25 × 25 mm2) to enhance light throughput [8,9]. They are widely used in fields such as deep space exploration [10,11,12], agriculture [13], and medicine [14].
The performance of AOTF devices is primarily determined by their acousto-optic materials. Among various acousto-optic materials, tellurium dioxide (TeO2) is one of the most widely used to date due to its exceptional properties [15,16]. Due to its slow shear wave near the [110] axis, TeO2 exhibits a high AO figure of merit and a wide optical transparency range [17,18].
However, TeO2 crystals exhibit strong acoustic anisotropy, leading to acoustic field walk-off and non-uniformity. Notably, the impact of non-uniform acoustic fields on the performance of AOTF devices has attracted considerable attention from researchers. Balakshy [19] proposed an improved angular spectrum method, providing a valuable tool for studying acoustic field propagation in anisotropic materials. Mantsevich [20,21,22] had investigated the impact of non-uniform acoustic fields on narrow beams or individual light rays, primarily focusing on the effects of acoustic field distribution in the acousto-optic interaction plane. Their findings suggest that the non-uniform acoustic field in this plane results in a decrease in the peak diffraction efficiency of narrow beams and affects spectral band shaping.
However, for non-collinear AOTF devices, the diffraction efficiency depends on the average efficiency of all beams within the optical aperture, rather than the diffraction efficiency of a single beam. The acoustic anisotropy of TeO2 crystal exists in all planes [19], and clearly, the diffraction efficiency of narrow beams and full-aperture beams exhibits different characteristics. However, existing studies mainly focus on single or narrow beams, and these results do not fully explain the impact of the acoustic field on full-aperture diffraction efficiency.
Additionally, the temperature effects on the acoustic field distribution and diffraction efficiency have been underexplored. The wavelength-temperature drift has been extensively studied [23,24]. Temperature variations can influence both the sound velocity and the anisotropic properties of the crystal, which in turn affect the acoustic field structure and the diffraction efficiency of AOTFs. However, the influence of temperature on diffraction efficiency has received limited attention. The conclusions of existing studies are based on results after coupling the temperature response of the RF driver with the temperature response of the device itself [24].
This present study investigates the impact of acoustic field distribution and temperature on the full-aperture diffraction efficiency of AOTF devices. Both theoretical and experimental studies were conducted on the impact of the acoustic field on the full-aperture diffraction efficiency of AOTF devices. The three-dimensional distribution of the acoustic field was simulated, and based on this, the full-aperture diffraction efficiency was calculated. Additionally, necessary electrical tests were performed to establish the relationship between the AOTF power consumption and diffraction efficiency under the influence of the acoustic field. The non-uniform field distribution caused the peak diffraction efficiency to decrease, while the power corresponding to the peak diffraction efficiency increased.
Simulations and experimental validations were carried out to investigate the impact of temperature on the acoustic field structure and, consequently, on diffraction efficiency. Experimental results show that while temperature does not significantly affect the overall full-aperture diffraction efficiency, temperature-induced variations in diffraction efficiency are more pronounced in local regions. This suggests that using a single beam to characterize changes in full-aperture diffraction efficiency could lead to significant errors.

2. Methods

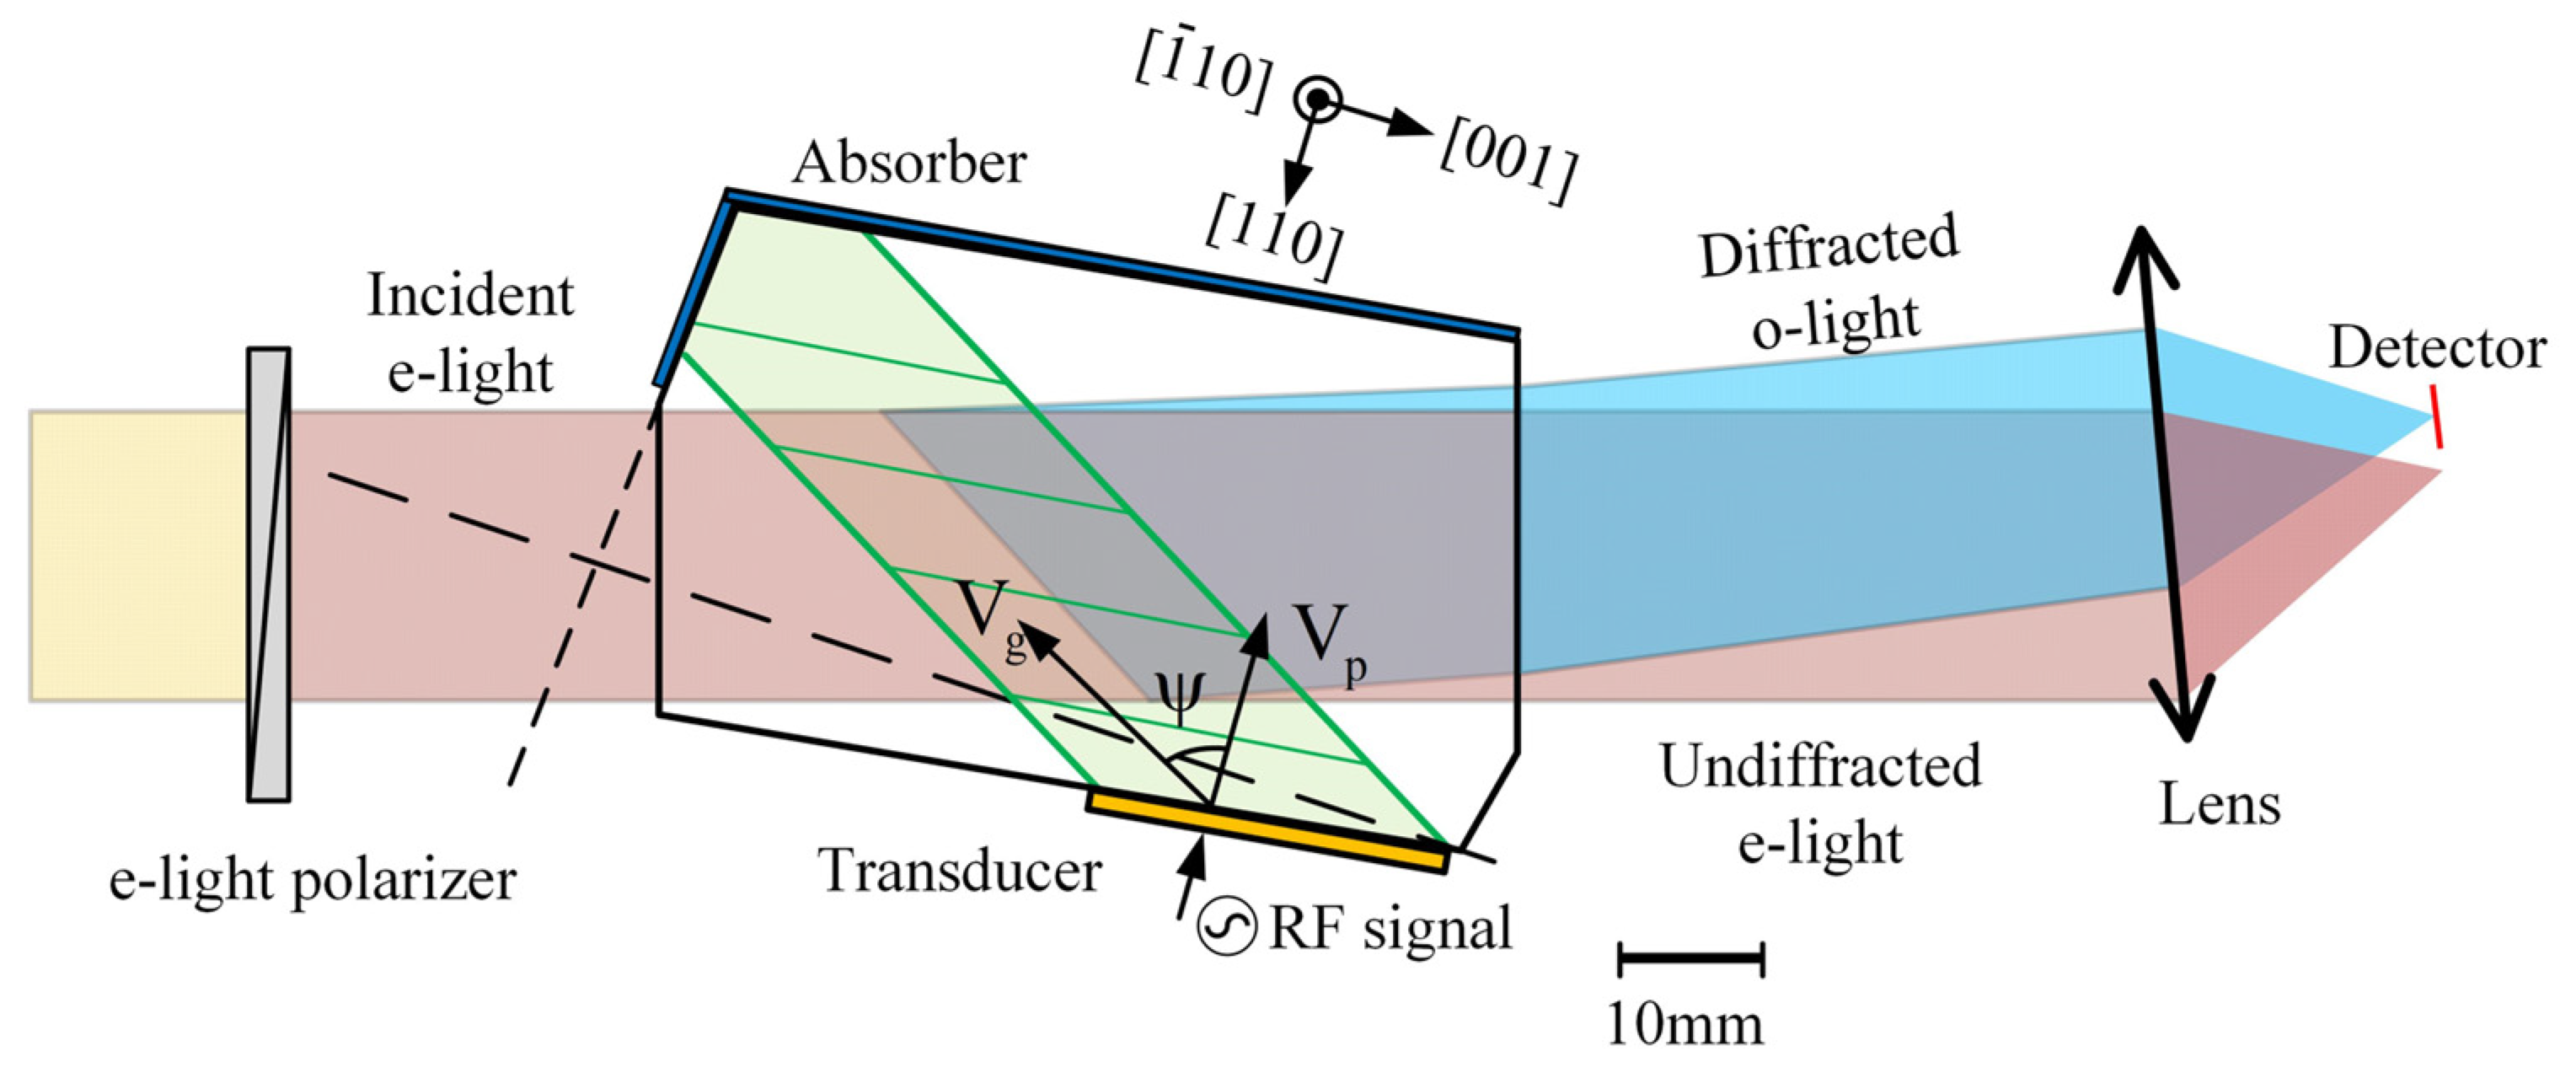
2.1. Configuration of AOTF

For non-collinear AOTF devices, shear acoustic waves induce changes in the refractive index of the TeO2 crystal, rotating the principal axes of the refractive index ellipsoid. This alters the eigen polarization modes, causing the incident light to decompose into diffracted and transmitted beams with orthogonal polarization states. The AO interaction geometry in the AOTF used in this paper is illustrated by the wave vector diagram in Figure 1.
where k i = 2 π n i / λ ; k d = 2 π n d / λ ; K a = 2 π f / V , f , V , λ represent the wave vectors of the incident light, diffracted light, and acoustic wave, ultrasound frequency, ultrasound velocity and optical radiation wavelength respectively. Using the presented vector diagram, it is possible to obtain the equation that defines the AO interaction phase matching frequency:
λ = V ( T ) f n i 2 + n d 2 2 n i n d cos θ i θ α
where θ i and θ d represent the incident and diffraction angles, respectively, n i and n d denote the intrinsic refractive indices of the TeO2 crystal, T represent the temperature. Since temperature influences the sound velocity, this equation is temperature dependent.
In this study, a non-collinear TeO2 AOTF (SGL18-3000/4800-20LG) was used, manufactured by the 26th Research Institute of China Electronics Technology Group (Chongqing, China). It operates at 11–19 MHz with a wavelength range of 3–4.8 μm. The size of the crystal is approximately 57 × 35 × 22 mm3, and the aperture size of the crystal is 22 × 22 mm2 (actual used area: 20 × 20 mm2). The transducer size is 24 × 20 mm2 (length × height).
The geometric structure of the device relative to the crystal axis is shown in Figure 2. The ultrasonic beam within the crystal is displayed in green and propagates with noticeable energy drift, indicating that the wavefront (phase velocity) and the wave energy (group velocity) propagate in different directions.

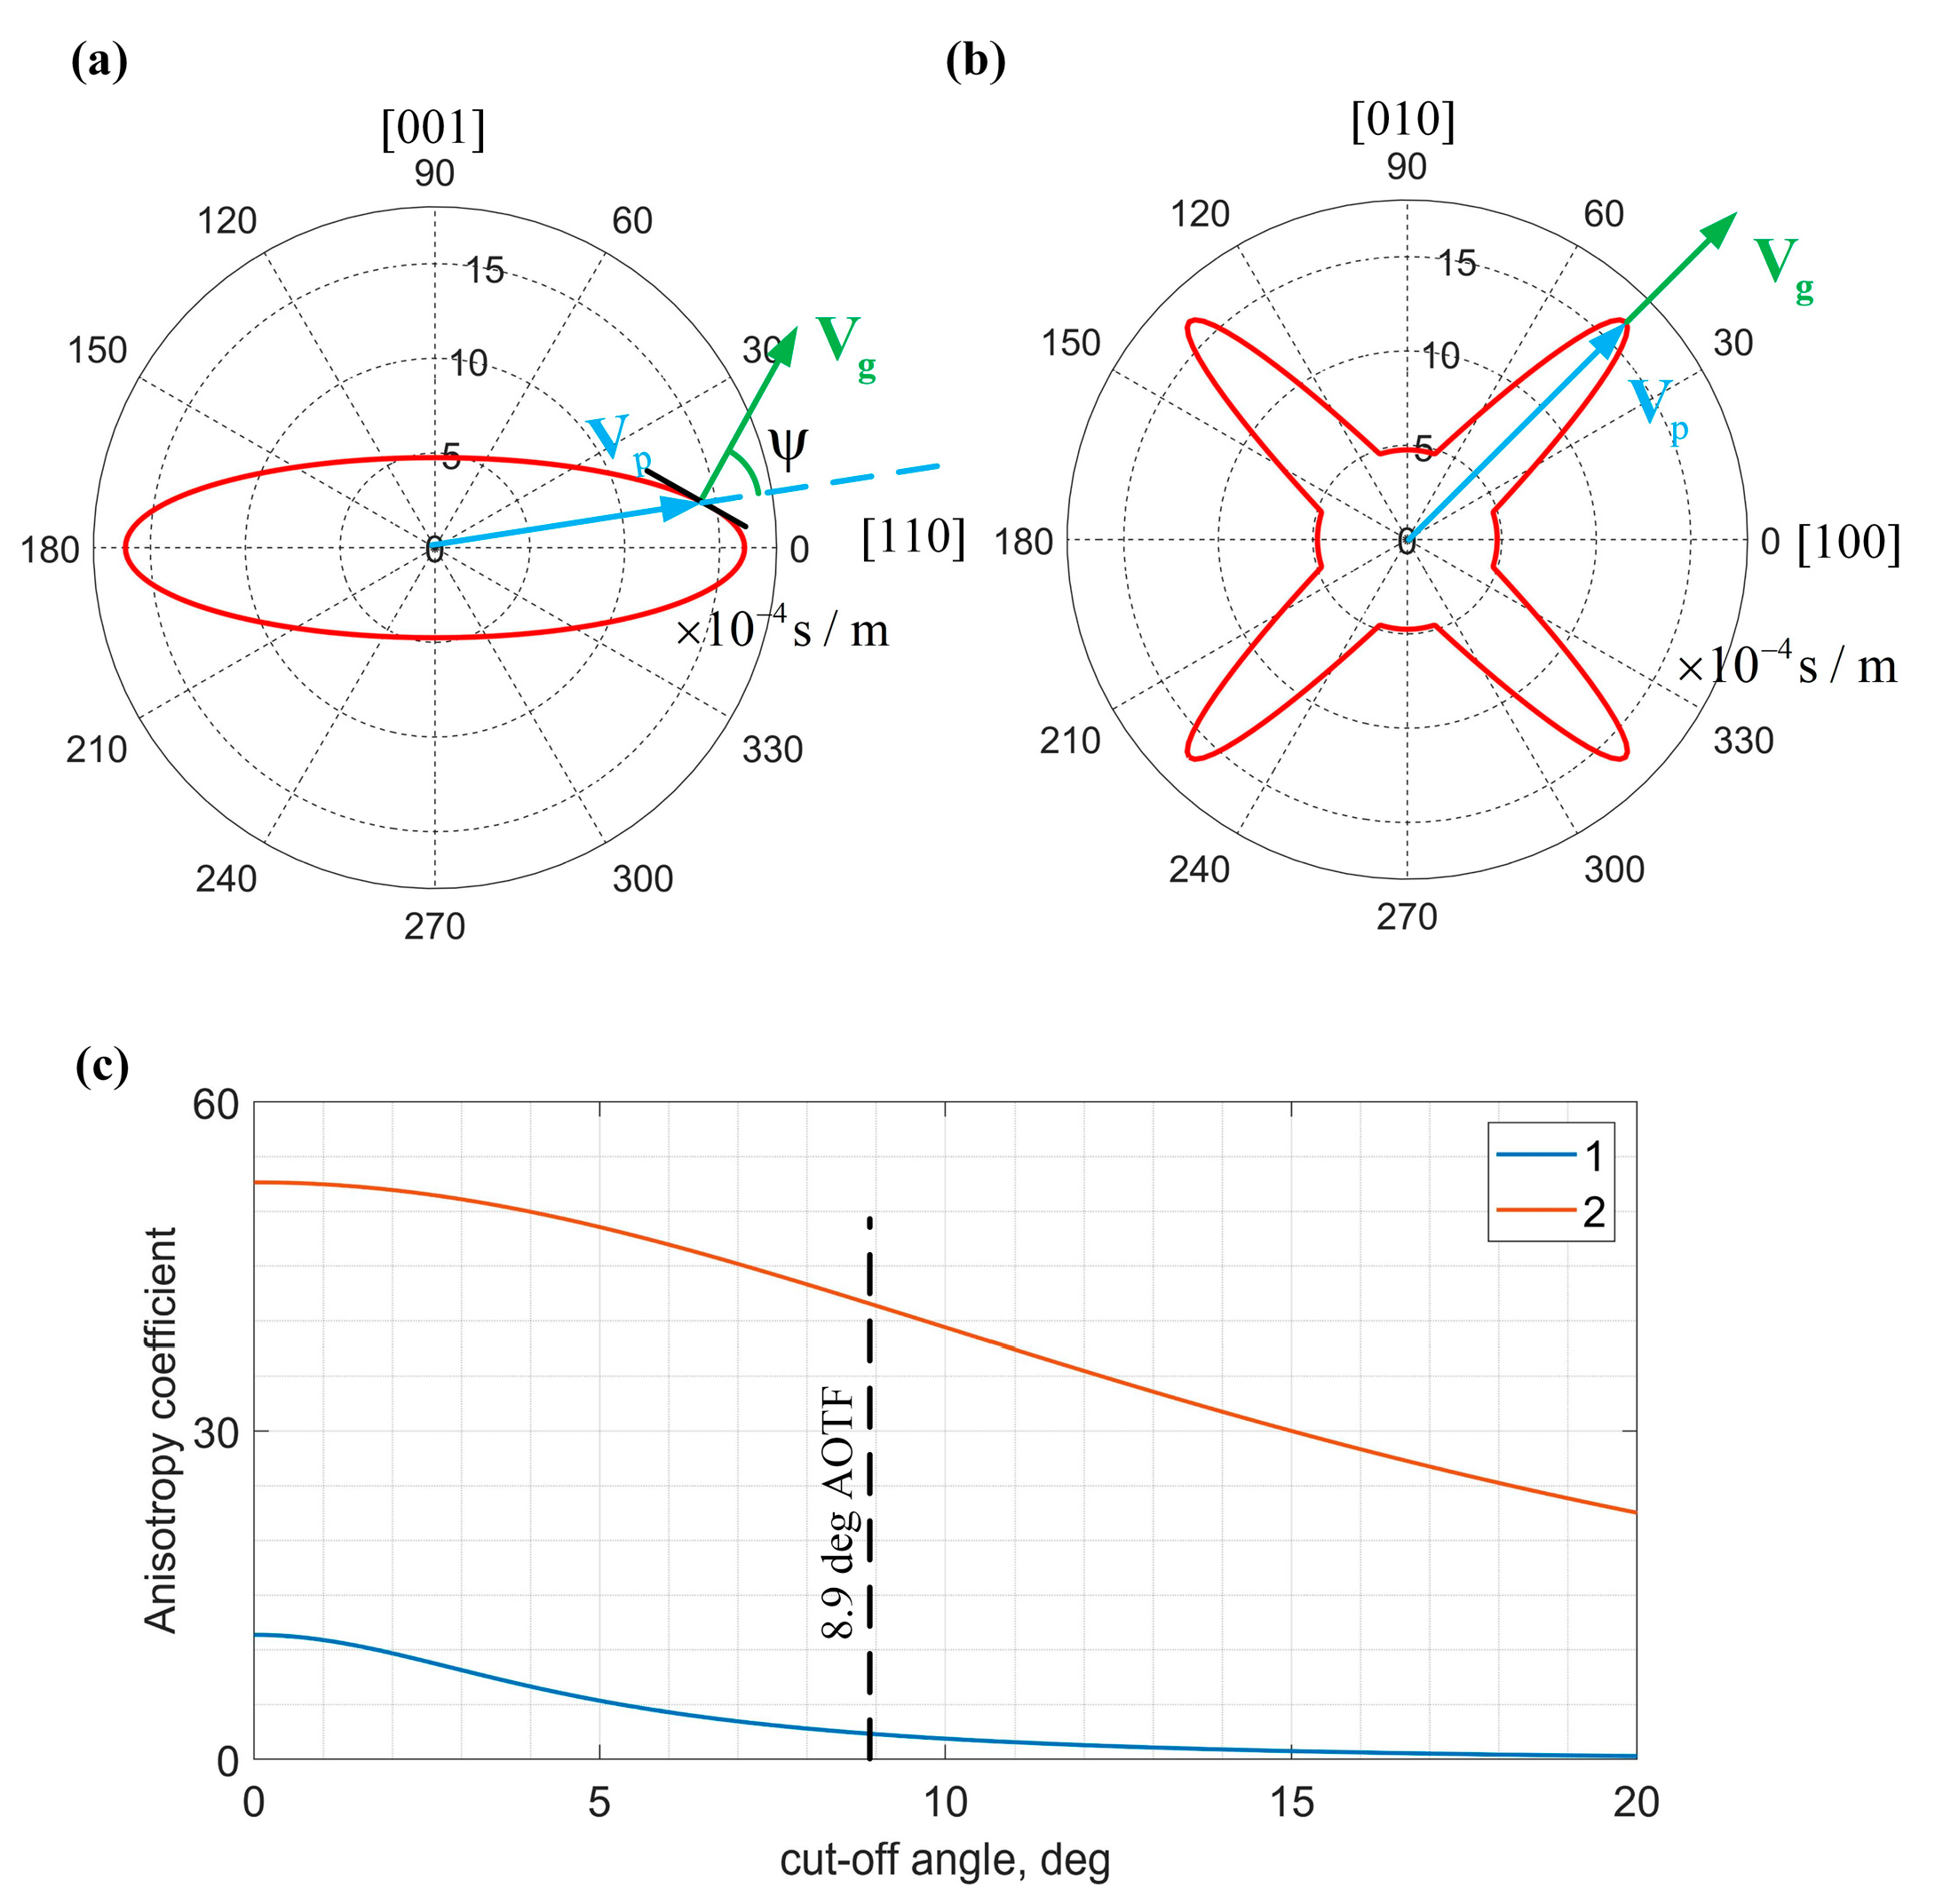
2.2. Simulation of Acoustic Filed

In TeO2 crystals, sound velocity varies significantly with propagation direction. Compared to isotropic materials, this anisotropy leads to notable differences in acoustic field propagation, including walk-off and rapid beam divergence. Figure 3 illustrates the cross-sections of the slowness surfaces of tellurium dioxide. In Figure 3a, the ( 1 1 ¯ 0 ) crystallographic plane is parallel to the acousto-optic interaction plane, with the AOTF device cut-off angle of α = 8.9°. At the selected point, the energy velocity of the sound wave is perpendicular to the tangent of the slowness surface, resulting in a walk-off angle of ψ = 52.4°. In contrast, Figure 3b depicts the plane orthogonal to the ( 1 1 ¯ 0 ) plane, where phase velocity and group velocity align, eliminating the walk-off effect.
A significant effect of walk-off is the amplification of phase velocity differences in the direction of energy velocity, leading to increased diffraction compared to isotropic materials over the same distance. The anisotropy coefficient is a convenient parameter for describing this characteristic [19,20], quantifying the increase in acoustic field diffraction relative to isotropic materials. This coefficient is proportional to the rate of change of the slowness surface in a given direction. The AOTF device used in this study has anisotropy coefficients of 2.3 and 41.6 in the two planes, respectively.
The method of acoustic field structure simulation is almost identical to those described in [21,22]. The field of acoustic structure excited by a plane rectangular AO transducer (located in the plane z = 0) has the form:
s ( x , y , z ) = S 0 H y ( z , y ) H x ( z , x z tan ψ ) × exp j ω z / v .
Here, S 0 is the amplitude of oscillations at the transducer, v is the phase velocity of the acoustic wave, ω is the cyclic frequency of oscillations, and ψ is the sound walk-off angle in the AO diffraction plane. H y ( z , y ) and H x ( z , x ) are 2D complex profiles of the acoustic field, which describe its spatial structure. the profiles in normalized coordinates Z y , Z x have identical forms:
H y ( z , y ) = H Z y , y l y ,      Z y = Λ κ y π l y 2 z , H x ( z , x ) = H Z x , z l x ,      Z x = Λ κ x π l x 2 z ,
Here, Λ = 2 π v / ω is the acoustic wavelength; κ y , κ x are anisotropy coefficients at two different planes mentioned earlier.
The acoustic field energy distribution of two planes at a frequency of 14 MHz was simulated, with the acoustic field power being normalized based on the transducer’s initial input. The magnitude of the acoustic field power is represented by color (see Figure 4a,b); ignore the angle of departure of the ultrasound beam on the ( 1 1 ¯ 0 ) plane. Black contour lines have been plotted on the acoustic field simulation, where the contour lines represent sound power set to half of the peak power value. It is evident that the acoustic field distribution on the optical aperture is much more non-uniform than on the ( 1 1 ¯ 0 ) plane. Considering the angle of departure, the simulated acoustic field inside the crystal is shown in Figure 4c. Two coordinate systems are labelled in the figure: XYZ represents the acoustic field simulation coordinate system, and the other coordinate system corresponds to the acousto-optic interaction calculation coordinate system.

2.3. AO Interation Function

As illustrated in Figure 4c, the geometric relationship between the acoustic field and incident light within the crystal is shown. The acoustic field data obtained from Equation (2) were transformed into a new coordinate system X Y Z . Then the AO diffraction is described by Raman–Nath equations modified for the inhomogeneous acoustic field [20,21]:
d C 0 ( y , z ) d x = S ( x , y , z ) 2 C 1 ( y , z ) exp [ j ( ξ x Φ ( x , y , z ) ) ] d C 1 ( y , z ) d x = S ( x , y , z ) 2 C 0 ( y , z ) exp [ j ( ξ x Φ ( x , y , z ) ) ]
where C 0 ( y , z ) and C 1 ( y , z ) are normalized magnitudes of zero- and first-order diffracted waves, ξ is the AO interaction phase mismatch, S ( x , y , z ) and Φ ( x , y , z ) describe the acoustic field amplitude distribution and phase distribution.
The system of Equation (4) is solved numerically in order to calculate the diffraction efficiency. Under the plane wave assumption, the above differential equations can be solved to yield an analytical solution. When the AO interaction phase matching condition is fulfilled, the well-known AO diffraction efficiency calculation is defined by:
η = I d I i = sin 2 q l 2
where η is the efficiency, I i and I d are incident and diffracted light intensities, respectively. Moreover, q l is the Raman–Nath parameters, defined as:
q l = π λ 2 M P a L a o L t H t
Here, M is the AO figure of merit, P a is ultrasound power, L a o is AO interaction length, and L t , H t is the acoustic beam height.

2.4. The Temperature Effect of Acoustic Filed and Diffartion Effiency

Temperature affects the sound velocity within the crystal [24], and generally, the change in sound velocity with temperature is uneven along different directions within the crystal. This directly leads to changes in the crystal’s slowness surface. As discussed in Section 2.2, the shape of the slowness surface directly determines the walk-off angle and the acoustic anisotropy coefficient. Changes in the slowness surface at different temperatures result in changes in the walk-off angle and acoustic anisotropy coefficient, which in turn alter the acoustic field structure.
Regarding the temperature effect on diffraction efficiency, aside from the direct changes in the acoustic field structure, the magnitude of the sound velocity directly determines the acousto-optic diffraction capability of the crystal, typically characterized by the acousto-optic figure of merit, defined as:
M ( T ) = n i 3 ( λ ) n d 3 ( λ ) p 2 ρ V ( T ) 3
When the sound velocity changes with temperature, it results in alterations to the acoustic field structure, the matching center wavelength, and the acousto-optic figure of merit. For TeO2 crystals, as temperature increases, the sound velocity increases, decreasing the acousto-optic figure of merit and increasing the wavelength, both of which contribute to a reduction in diffraction efficiency. The impact of changes in sound field structure will be more complex, so we will not discuss it in detail here for now.
Based on our understanding [25,26,27], report data on the variation in TeO2 crystal sound velocity with temperature are not consistent. Therefore, further measurements are required to compare the datasets, confirm the sound velocity variation, and validate diffraction efficiency experimentally. The refractive index of TeO2 crystal also varies with temperature. According to Balakshy et al. [28], its relative change is within 0.4% of the effect caused by sound velocity. Therefore, we have neglected the temperature dependence of the refractive index in this study.

3. Experiment and Results

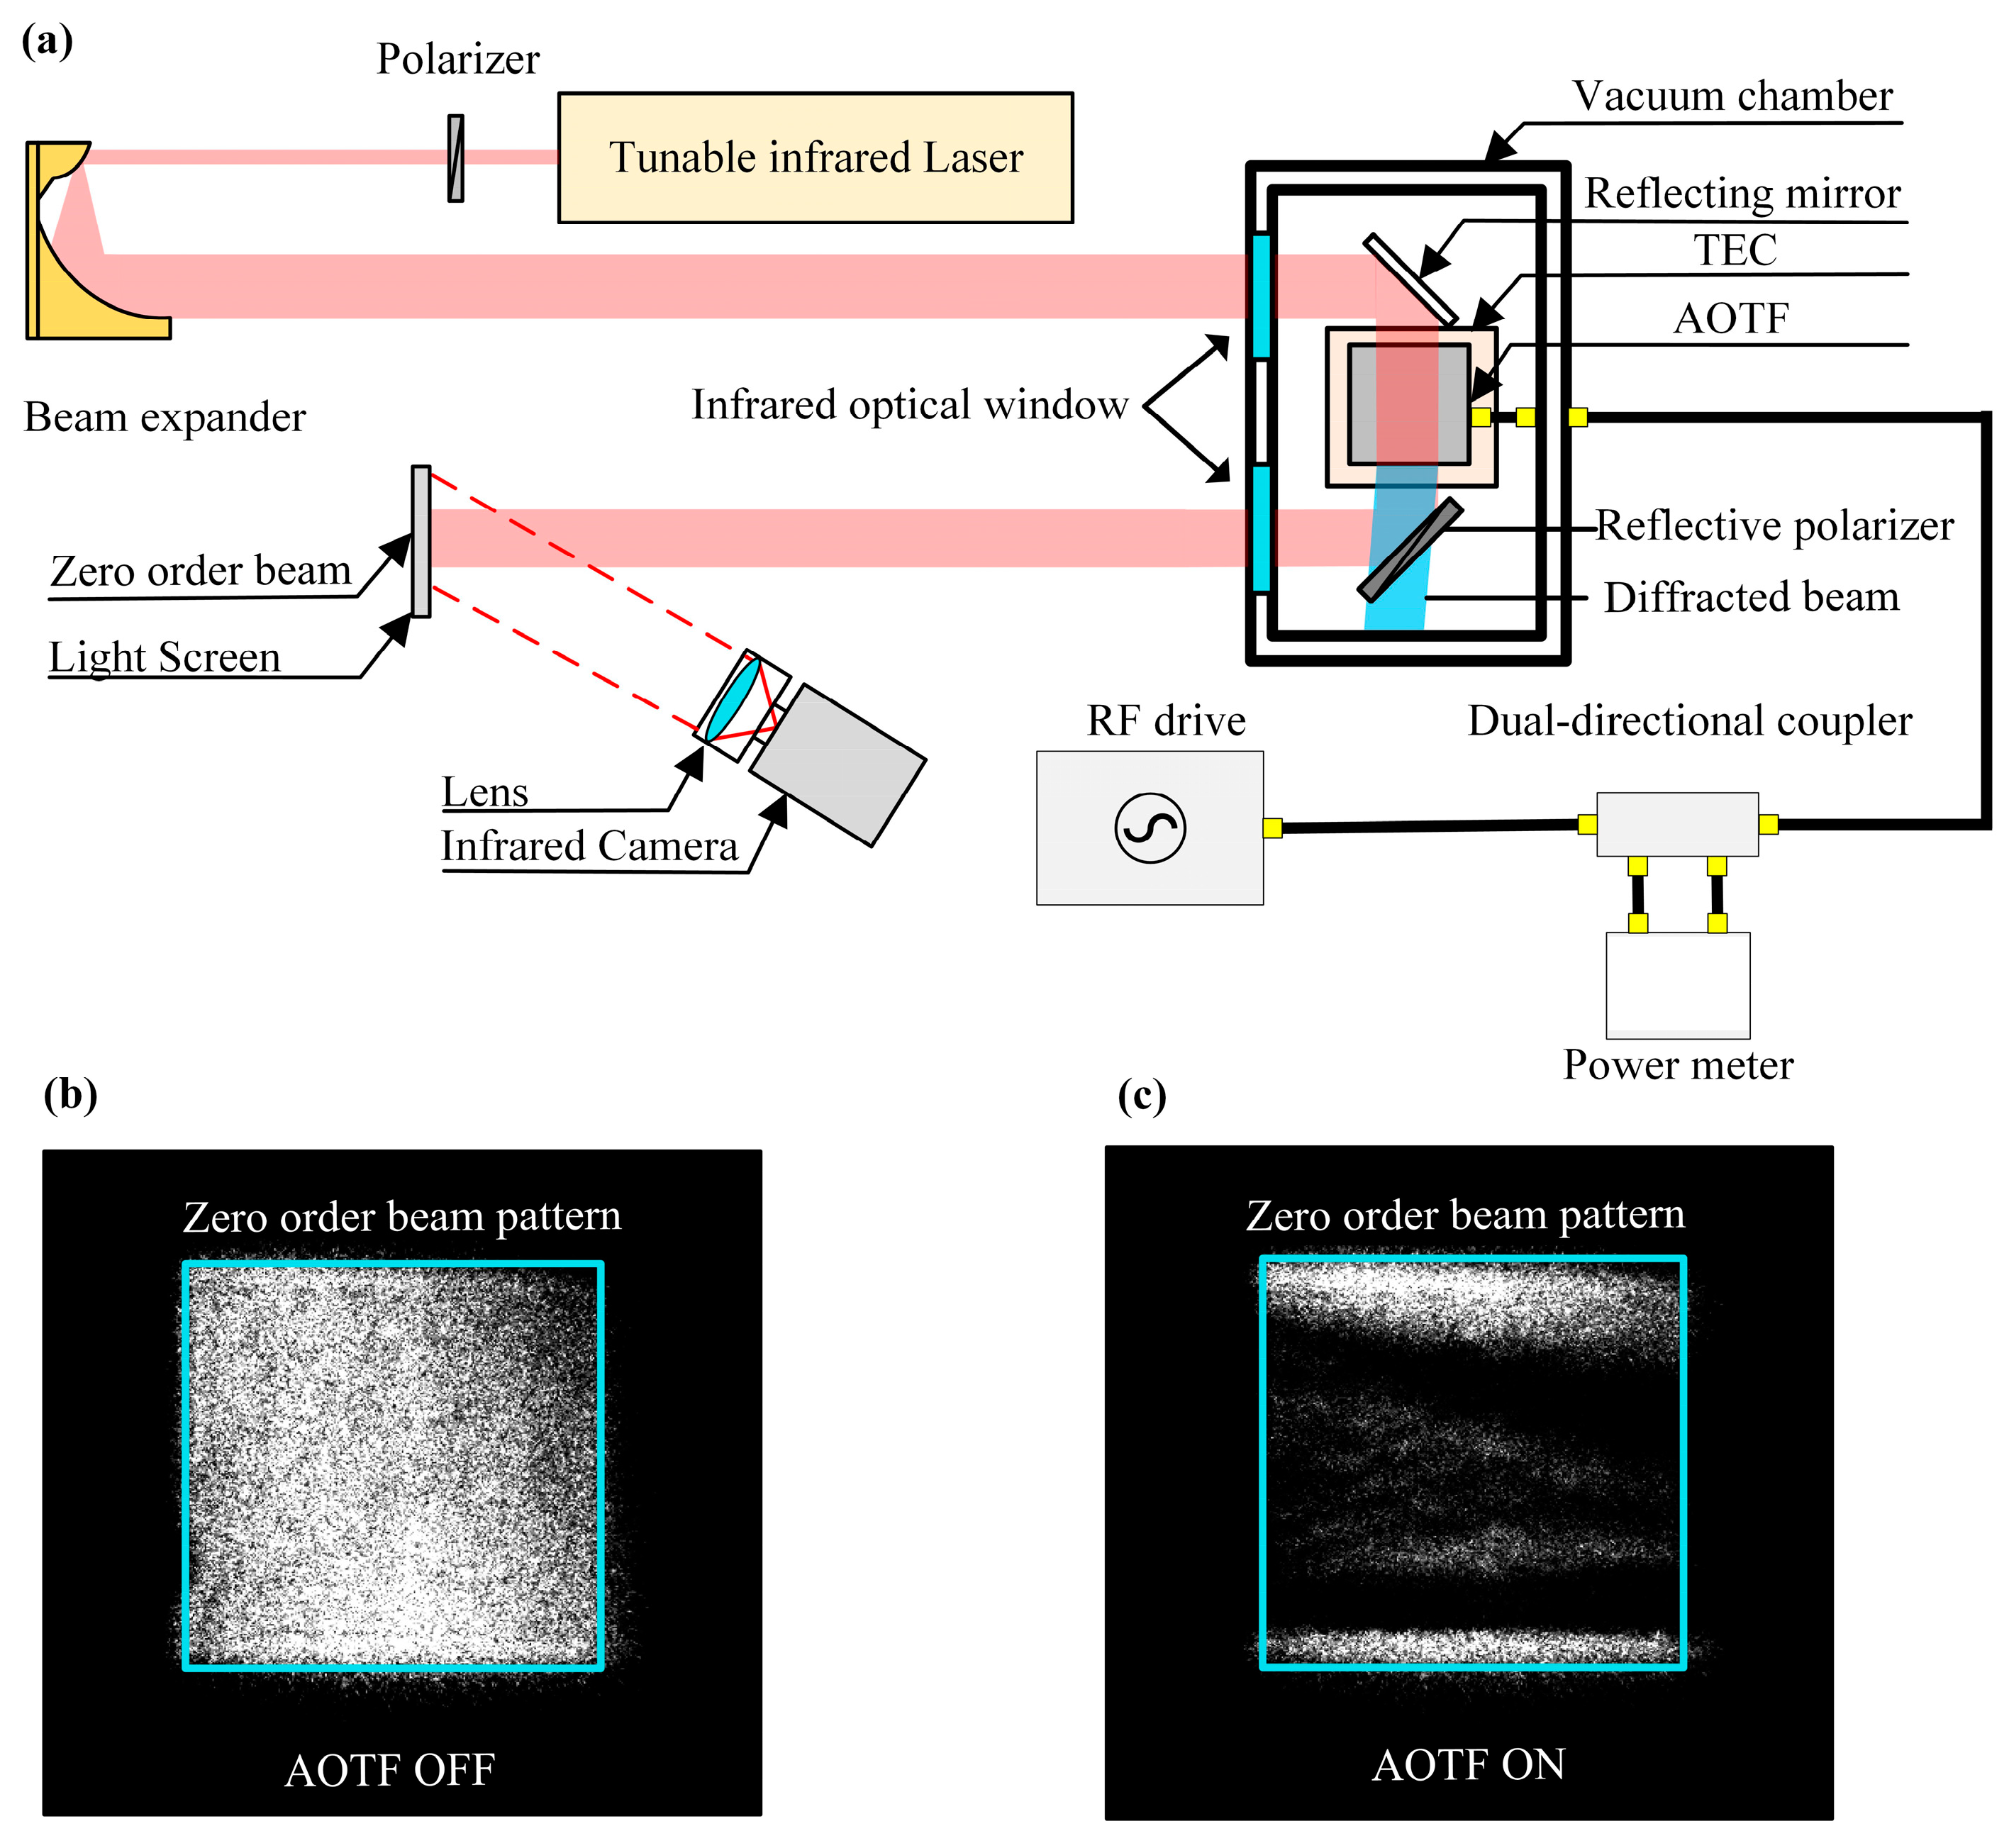
3.1. Experiment Setup

The experiment requires the measurement of the power consumption of the AOTF device and the full-aperture diffraction efficiency. The driving power measurement and full-aperture surface diffraction efficiency method follows the method described in [29,30]. The following sections will provide a detailed description of the electrical and optical experiment setup.

3.1.1. AOTF Consumed Power Test

The AOTF device is driven by an RF driver, which typically consists of an RF signal source and a power amplifier. The RF signal source generates an RF signal at a specific frequency, which is then amplified by a power amplifier by a certain factor and transmitted through the RF transmission line. By controlling the signal generator and adjusting the amplification factor of the power amplifier, the RF drive can output RF signals with different frequencies and power levels.
As shown in the down-right corner of Figure 5a, the power test setup consisted of the RF driver, AOTF, and a power meter connected to a bidirectional coupler. The combination of the coupler and power meter allows for independent measurement of the input RF power and reflection RF power transmitted along the RF transmission line. All parts of the setup were calibrated with vector network analyzer. Based on the following equation, it gives the power consumed by the AOTF device:
P A O T F ( f ) = P I n p u t ( f ) P R e f l e c t i o n ( f )
Once the power consumption of the AOTF has been accurately measured, the acoustic power within the crystal can be estimated by considering the losses in both the matching network and the transducer. The matching network consists of LC circuits, which are generally considered to have negligible or minimal losses. The transducer losses P P Z T   l o s s ( f ) can be evaluated using the simplified model proposed by [31,32]. Ignoring the losses in the matching circuitry and considering the quantified transducer losses, the acoustic power transmitted into the crystal P A c o u s t c ( f ) is calculated using the following equation:
P A c o u s t c ( f ) = P A O T F ( f ) P P Z T   l o s s ( f )
RF drivers are paired with AOTF devices and are provided by the manufacturers. However, the output power limits for the various channels have been presented by the manufacturer to prevent excessive power input or reflections from damaging the device and the RF driver. The 14 MHz channel was selected for diffraction efficiency testing, as it permits a maximum power consumption of approximately 16 W. The experimental design involved selecting 20 power levels, from zero to the maximum capacity, and evaluating the diffraction efficiency of the AOTF device at each level.

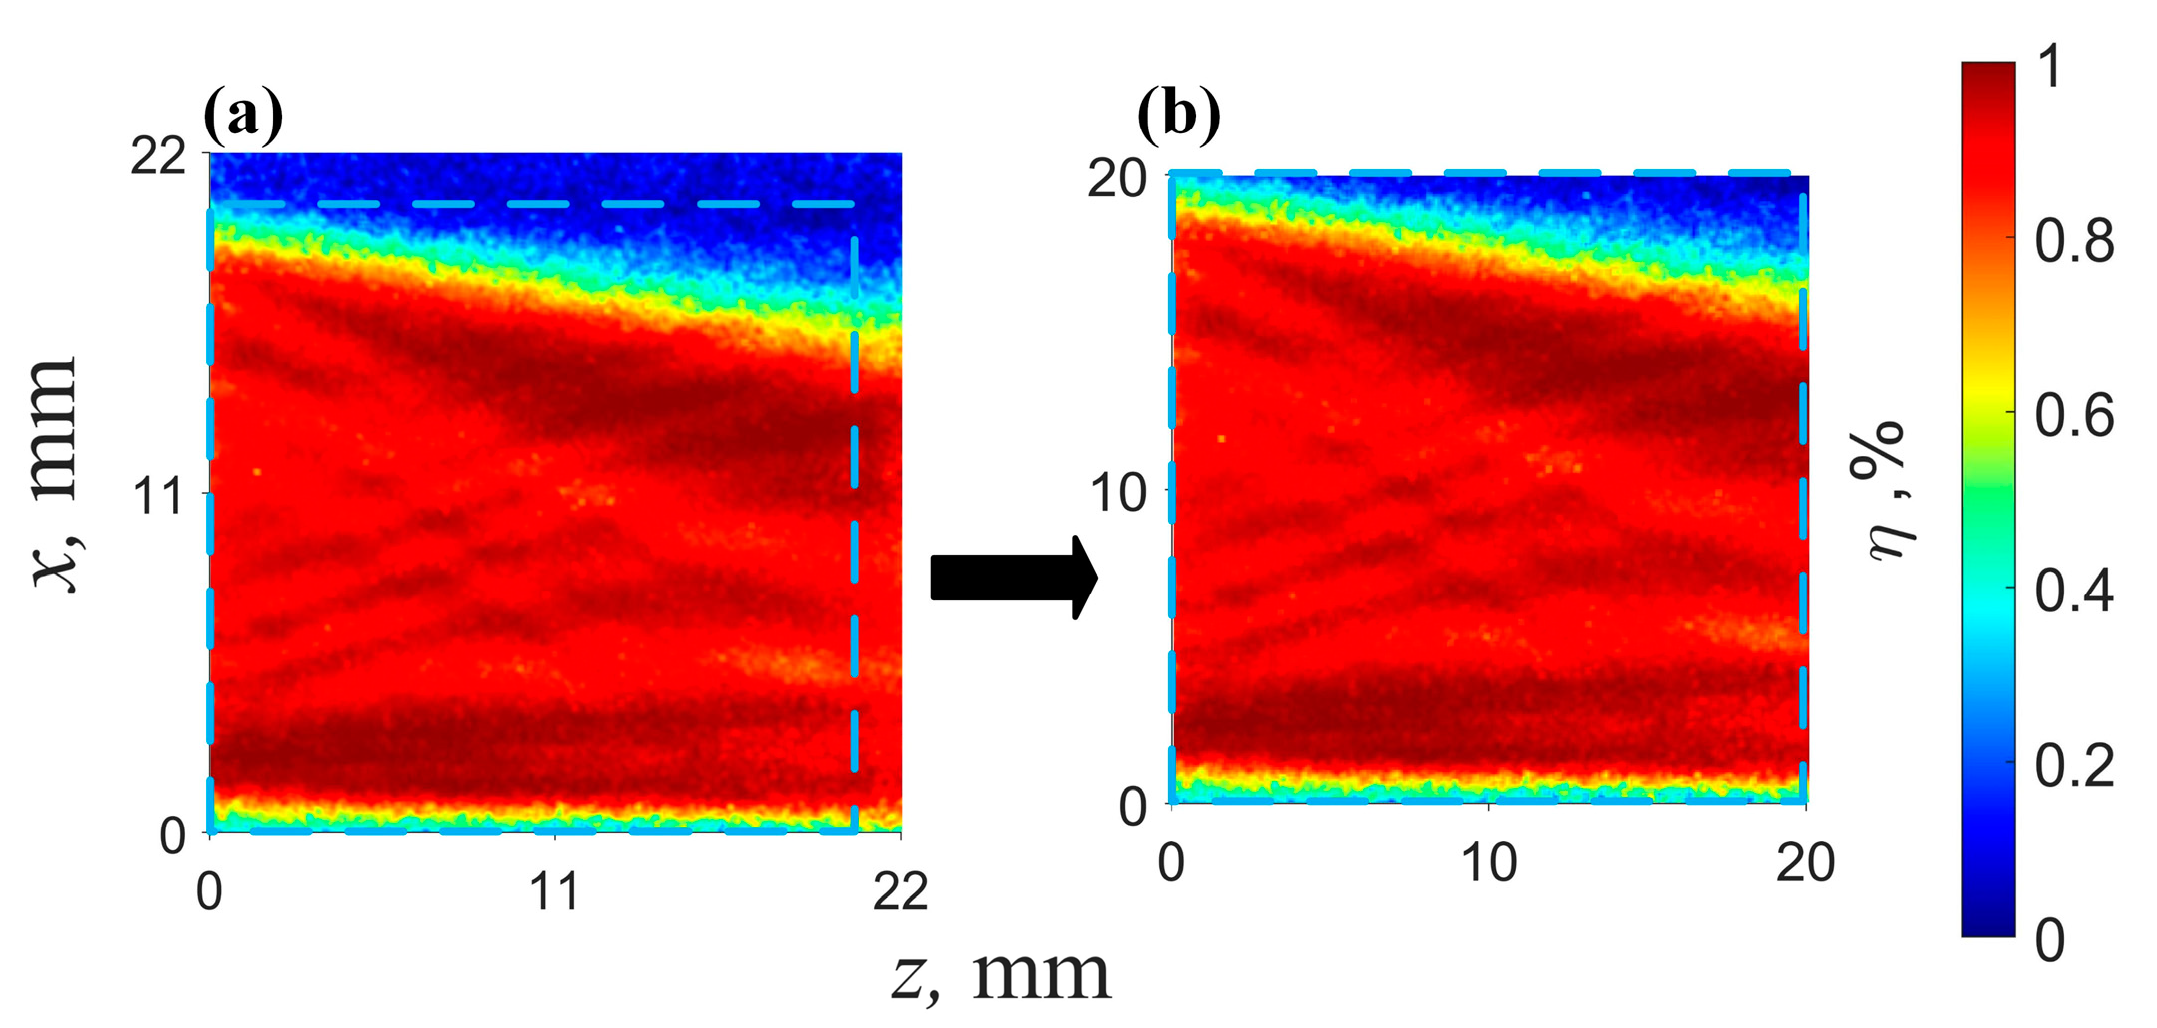
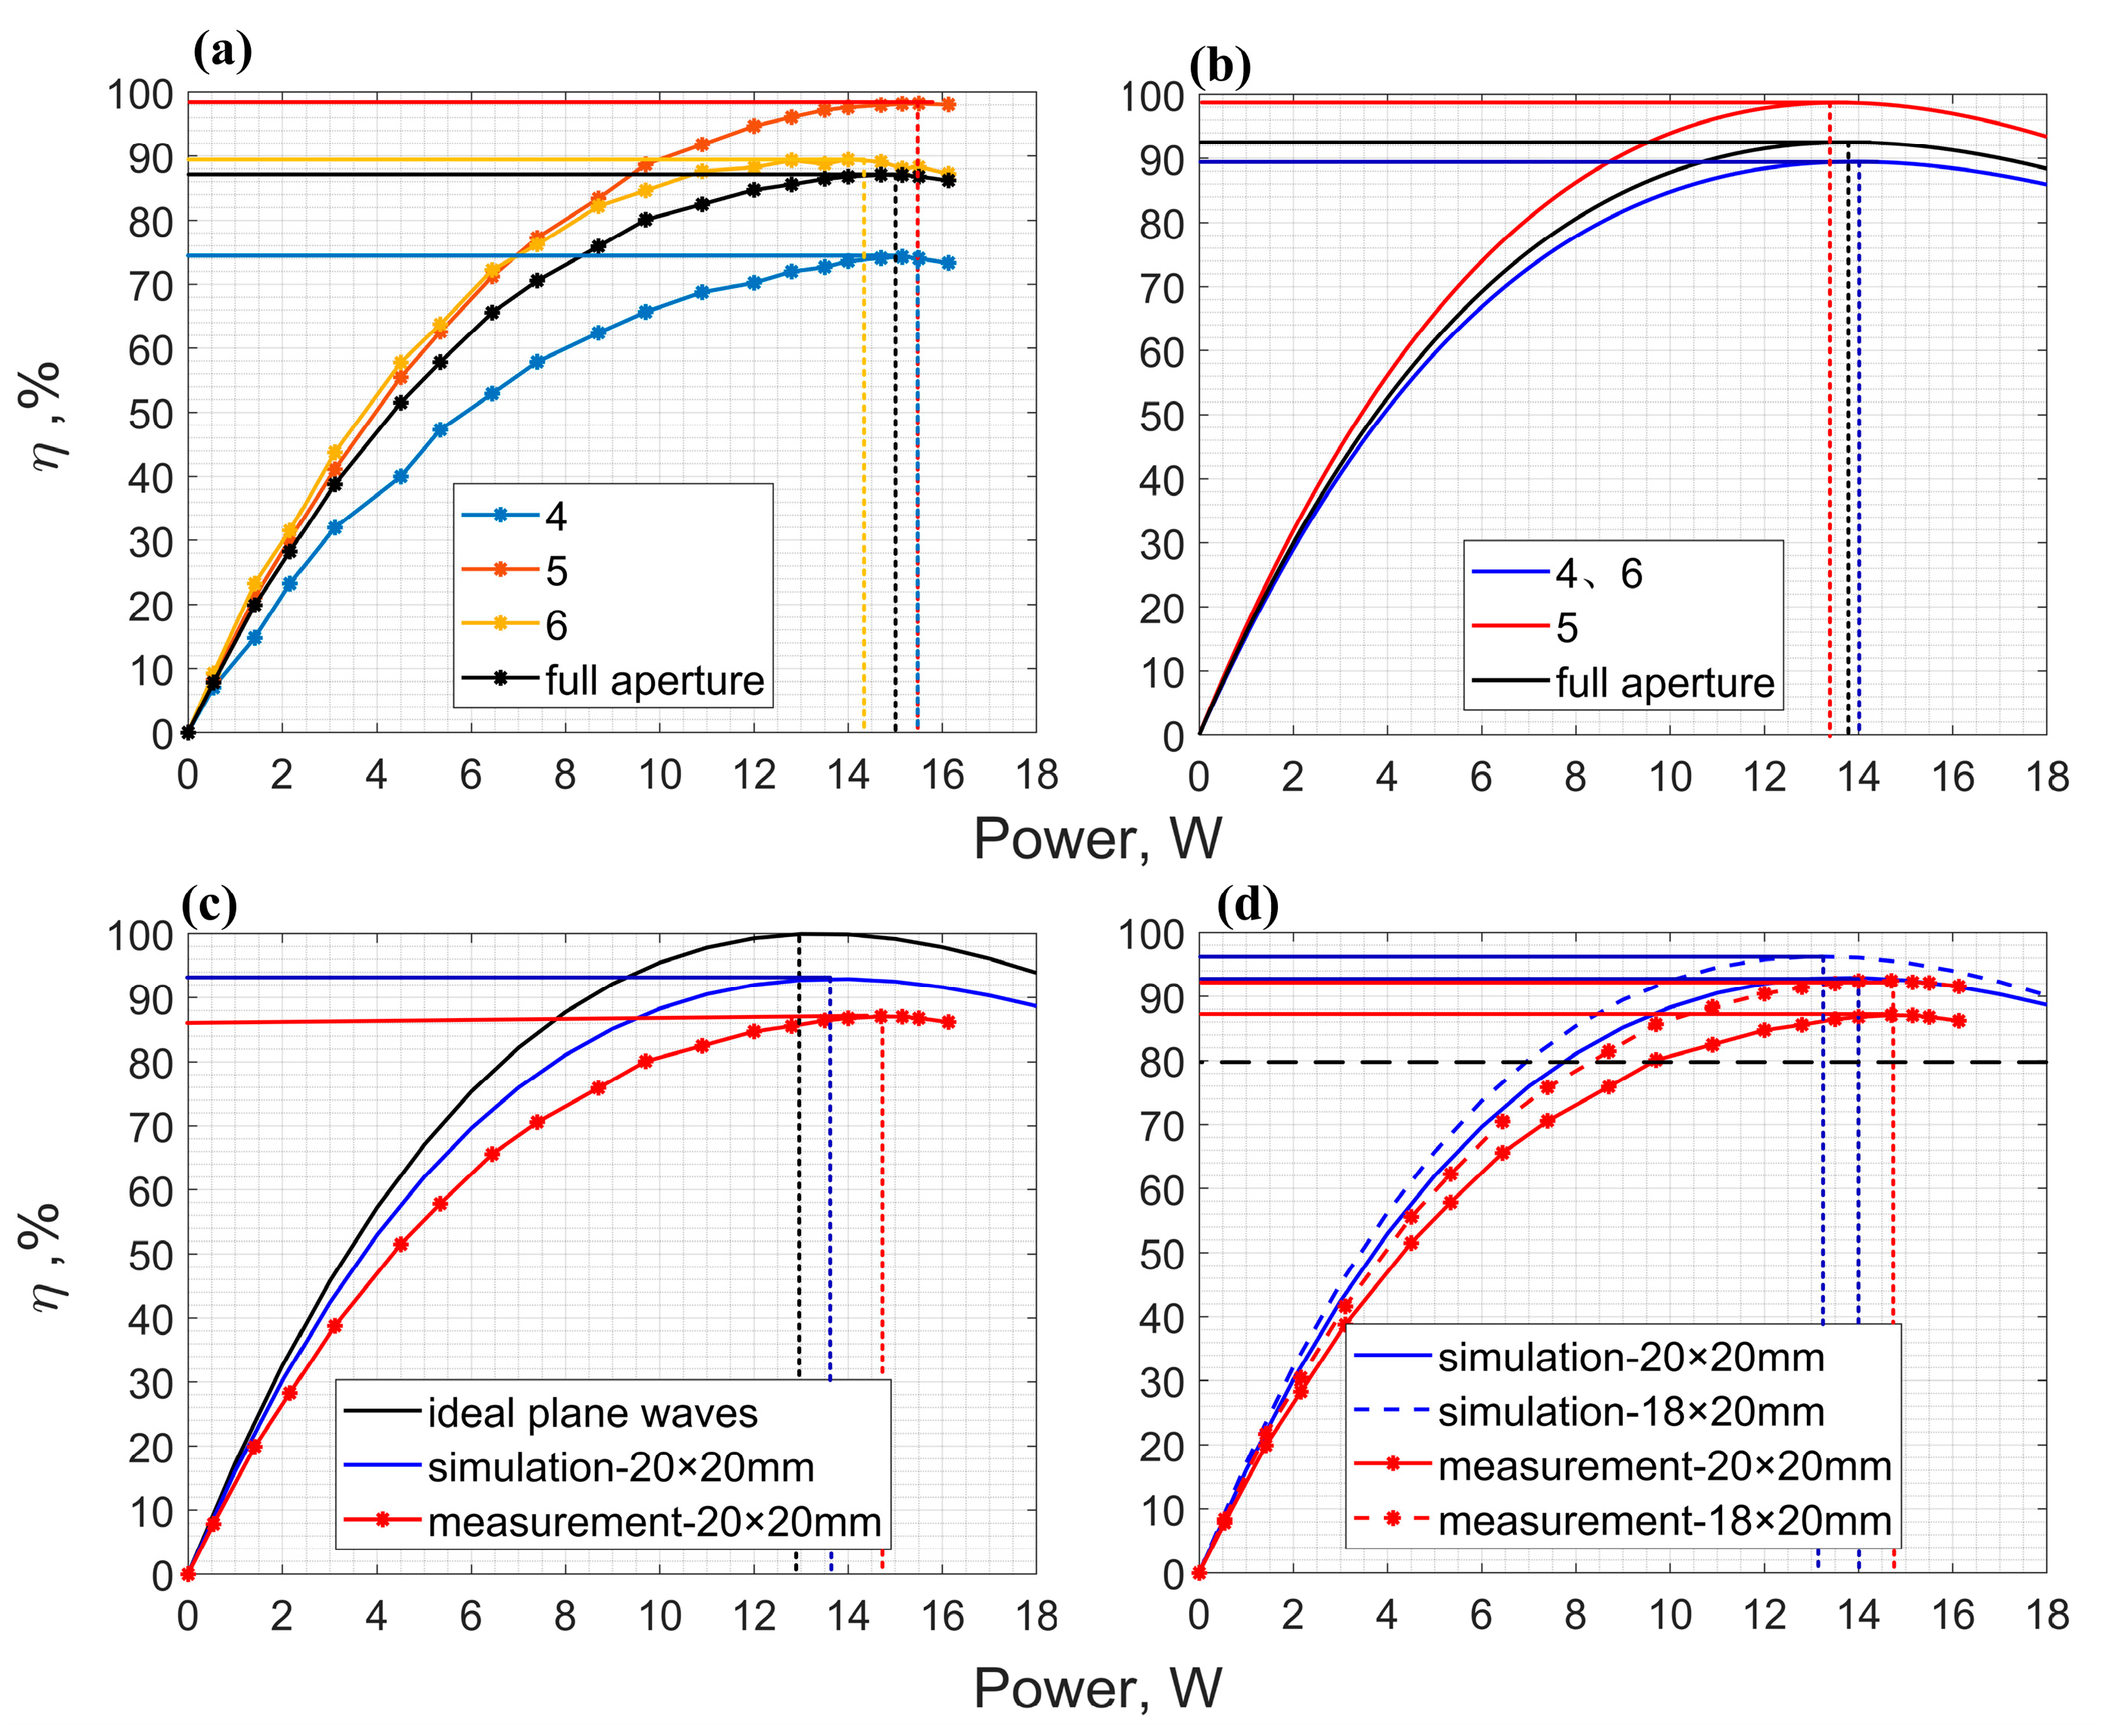
3.1.2. AOTF Diffraction Efficiency Test

The diffraction efficiency measurement setup is shown in Figure 5a. A tunable infrared laser (Firefly, 3.7–4.5 μm) emits laser light that passes through an E-light polarizer and a reflective beam expander, forming a 40 mm collimated beam that fully covers the AOTF aperture. The AOTF is placed inside a vacuum chamber, with the beam entering and outputting through an optical window. After passing through the AOTF, the beam is projected onto a light screen, and its intensity distribution is recorded by an infrared camera. Since different regions of the acoustic field affect the incident light differently, the diffracted light carries spatial information about the field, which is reflected in the peak diffraction efficiency. Analyzing the diffraction efficiency distribution allows for the validation of the simulation results.
To improve spatial resolution, a large-aperture 100 mm focal length lens was used. However, due to the limited pixel count of the infrared camera, only zero-order light images were captured. A self-developed software synchronized the infrared camera and AOTF driver to acquire images both with and without the AOTF on. The infrared camera used was the TB-M640 model (LUSTER Light Tech Co., Beijing, China).
The AOTF is housed inside a vacuum chamber and temperature-controlled via a thermoelectric cooler (TEC) with a sensor on its metal housing. During the acoustic field influence tests, the AOTF temperature was maintained at room temperature (20 °C). In the temperature effect tests, the AOTF temperature was varied between 0 °C and 40 °C in 10 °C intervals. The limited temperature range was chosen to prevent thermal stress damage due to the device’s large crystal size. After each diffraction efficiency test at different power levels, a 30 s pause was allowed for the crystal temperature to stabilize, preventing interference from temperature gradients. Figure 5b,c shows images with the AOTF on and off, respectively. Background images were recorded after each test by turning off the laser.
The central wavelength was determined to be 3979.8 nm at 20 °C. Diffraction efficiency was measured at predefined RF power levels with the laser wavelength fixed, as shown in Figure 6a. The acoustic field exhibited slight asymmetry, with wave propagation tilting toward the lower surface. This may be due to misalignment in the TeO2 crystal cutting angle or an angular error in the lithium niobate transducer. The tilt relative to the XZ plane causes reflections at the lower crystal surface, enhancing the acoustic field intensity near this region and affecting the overall field distribution. The transducer height is 20 mm, and the crystal aperture is approximately 22 × 22 mm. Diffraction efficiency was analyzed over a 20 mm × 20 mm region, selected near the lower surface to capture the strongest acoustic field, as shown by the blue dashed line in Figure 6a.

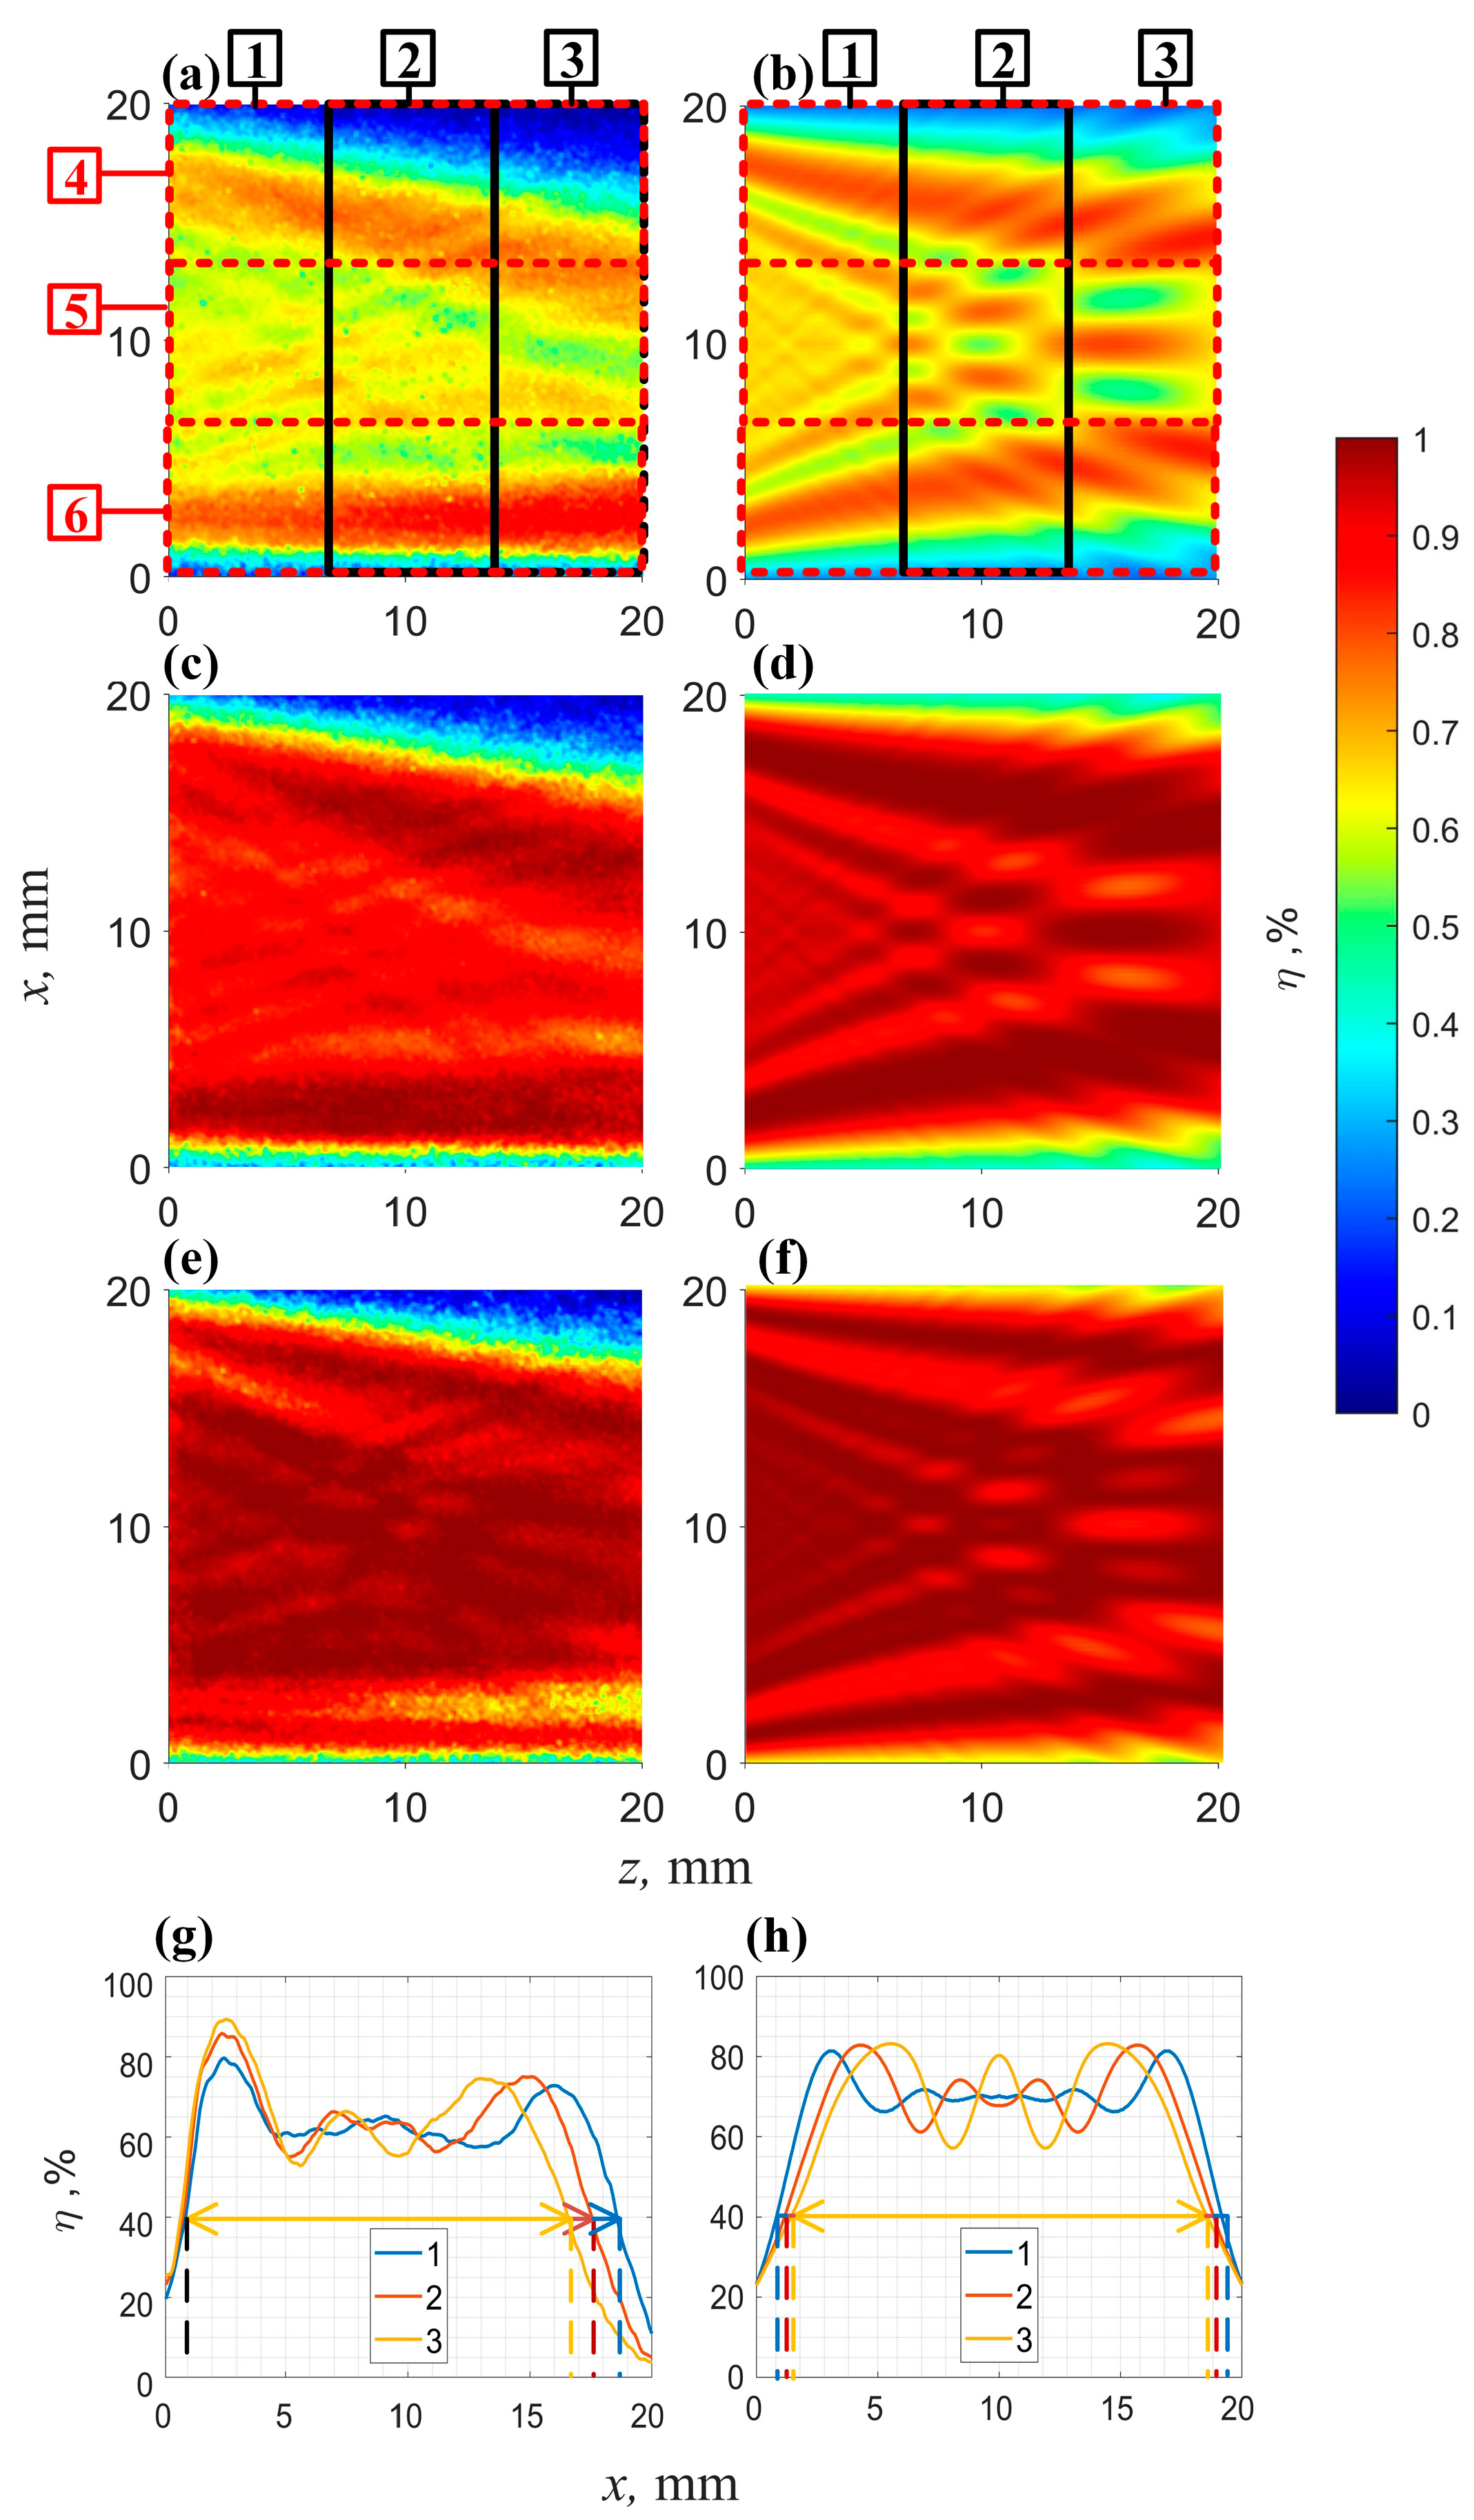
3.2. Experiment of Acoustic Field Influence on the Diffration Effiency

The transducer losses at 14 MHz were evaluated, with electrode ohmic loss, acoustic attenuation loss, and dielectric loss measured at 1.8%, 0.3%, and 3.0%, respectively, resulting in a total loss of 5.1%. Based on this loss ratio, the acoustic power was calculated to facilitate the simulation of diffraction efficiency.
Figure 7 presents diffraction efficiency measurements (panels a, c, e) and simulation results (panels b, d, f) for the full aperture at three input power levels: P A O T F = 5.34, 9.70, 14.70 W. The diffraction efficiency, shown in color, is highest near the top and bottom of the optical aperture, with the central region showing more uniform energy, corresponding to the acoustic field simulation in Figure 4b. As power increases to 9.70 W, the diffraction efficiency near the top and bottom regions approaches the peak value, though the central region still lags. At 14.70 W, side lobes decrease in efficiency due to over modulation, while the central region’s efficiency reaches the peak. These results demonstrate good consistency between the theoretical model and experimental findings.
To facilitate a detailed comparison of diffraction efficiency across the full aperture, the optical aperture was divided into three regions based on sound propagation distance, labeled 1, 2, and 3 (Figure 7a,b). Diffraction efficiencies in these regions were averaged along the z-axis at an input power of 5.34 W, as shown in Figure 7g,h.
The figures reveal that the acoustic beam width decreases with propagation. Based on the diffraction efficiency distribution along the x-axis, we roughly estimated the full-width at half-maximum (FWHM) of the acoustic beam. In regions 1, 2, and 3, the beam widths were 18.4 mm, 17.8 mm, and 16.8 mm, respectively, in simulations, and 17.7 mm, 16.4 mm, and 15.7 mm in measurements. This contraction narrows the effective optical aperture, reducing overall diffraction efficiency.
A significant non-uniform distribution of acoustic field energy within the effective region. For acousto-optic (AO) diffraction, there is an optimal acoustic power. Deviations from this value, whether higher or lower, reduce diffraction efficiency. The non-uniform acoustic field prevents all light rays from achieving peak diffraction efficiency simultaneously, further decreasing overall system efficiency.
To assess the impact of this non-uniformity on diffraction efficiency, the aperture was divided into three regions along the transducer height, marked as 4, 5, and 6 (Figure 7a,b). Figure 8a,b shows the experimental and simulation results of the average diffraction efficiency for these regions and the full aperture as a function of input power.
In region 5, which approximates a plane wave, peak diffraction efficiencies of 98.7% and 98.2% were achieved in the simulation and experiment, respectively. For the non-uniform regions 4 and 6, the simulation showed a peak diffraction efficiency of 89.5%, with a minor change in power (about 0.2 W). In the experiment, the diffraction efficiencies for regions 4 and 6 were 74.3% and 89.4%, respectively. The decrease in region 4 was due to the asymmetry of the acoustic field, while in region 6, the diffraction efficiency remained relatively constant with a power change of about 0.5 W. The primary impact of the acoustic field non-uniformity was a reduction in peak diffraction efficiency, with minimal effect on the power required to reach it.
Figure 8c shows the average diffraction efficiency for the entire aperture. An ideal plane wave would achieve a maximum diffraction efficiency of 100.0% at 13.41 W. The simulation results suggest a maximum diffraction efficiency of 92.4% at 13.84 W, while the experimental data show 87.1% at 14.70 W.
Based on the full-aperture diffraction efficiency, we can back-calculate the corresponding acoustic power. We evaluated the ratio of the acoustic power to the input electrical power for the current device P A c o u s t c / P A O T F , which is approximately 0.87. This value is lower than the ratio considering only the transducer losses. A part of the reason is the presence of an acoustic field tilt in the current device, where the acoustic field coverage in the 20 mm × 20 mm area is smaller, which clearly reduces the full-aperture diffraction efficiency.
We attempted to reduce the aperture height to mitigate the impact of the acoustic field contraction. Based on prior analysis, the aperture height was set to 18 mm, approximately matching the beam’s half-width of 17.8 mm in region 2. The simulation calculations focused on the central region, while the experimental results were based on the region near the lower surface. After reducing the aperture height, the relationship between diffraction efficiency and power is shown in Figure 8d. The simulation results show that the 18 × 20 mm aperture achieves a peak diffraction efficiency of 96.1% at 13.21 W, while the 20 × 20 mm aperture reaches 92.4% at 13.84 W. Experimentally, the 18 × 20 mm aperture shows 92.2% diffraction efficiency, and the 20 × 20 mm aperture drops to 87.1%. After reducing the aperture size, the power corresponding to peak diffraction efficiency in the experimental data remained unchanged, likely due to the discrete testing method, with a power test interval of 0.3–0.4 W. This error could result in the observed phenomenon if power changes are smaller than half the test interval (0.15–0.2 W).
This result indicates that reducing the aperture size mitigates the effect of acoustic field contraction, increases the peak diffraction efficiency, and undoubtedly lowers the power required to achieve high diffraction efficiency.

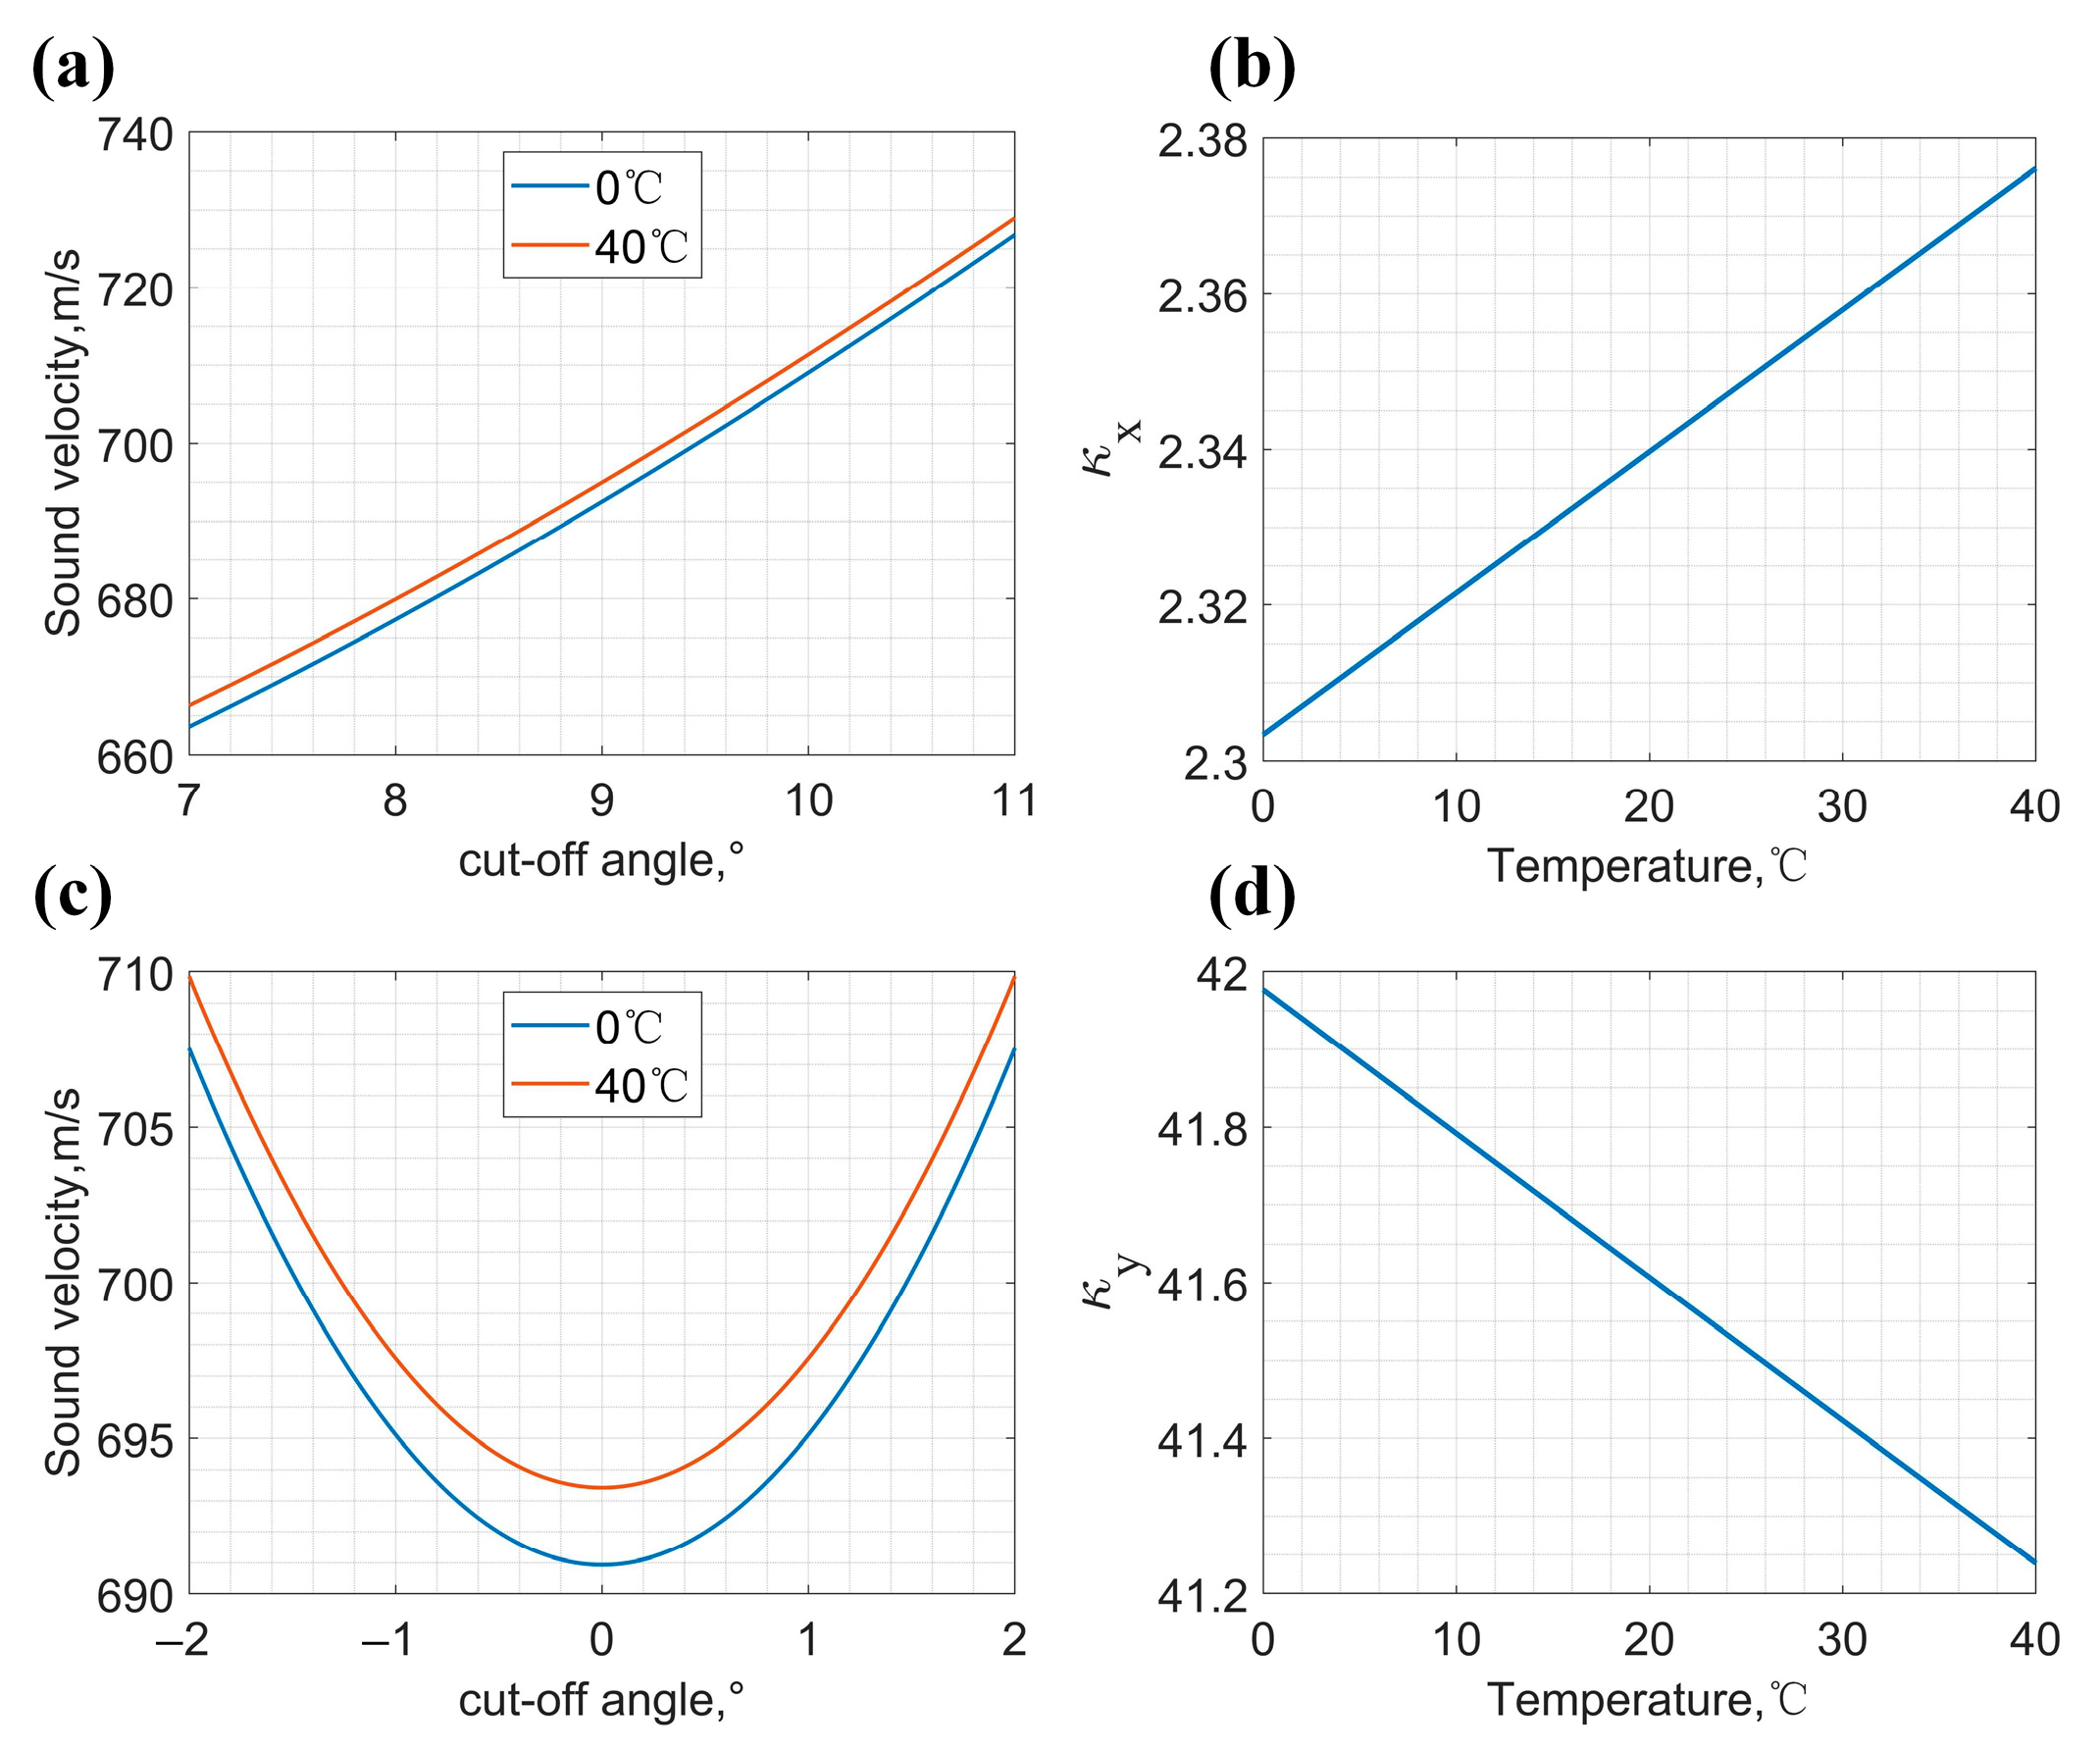
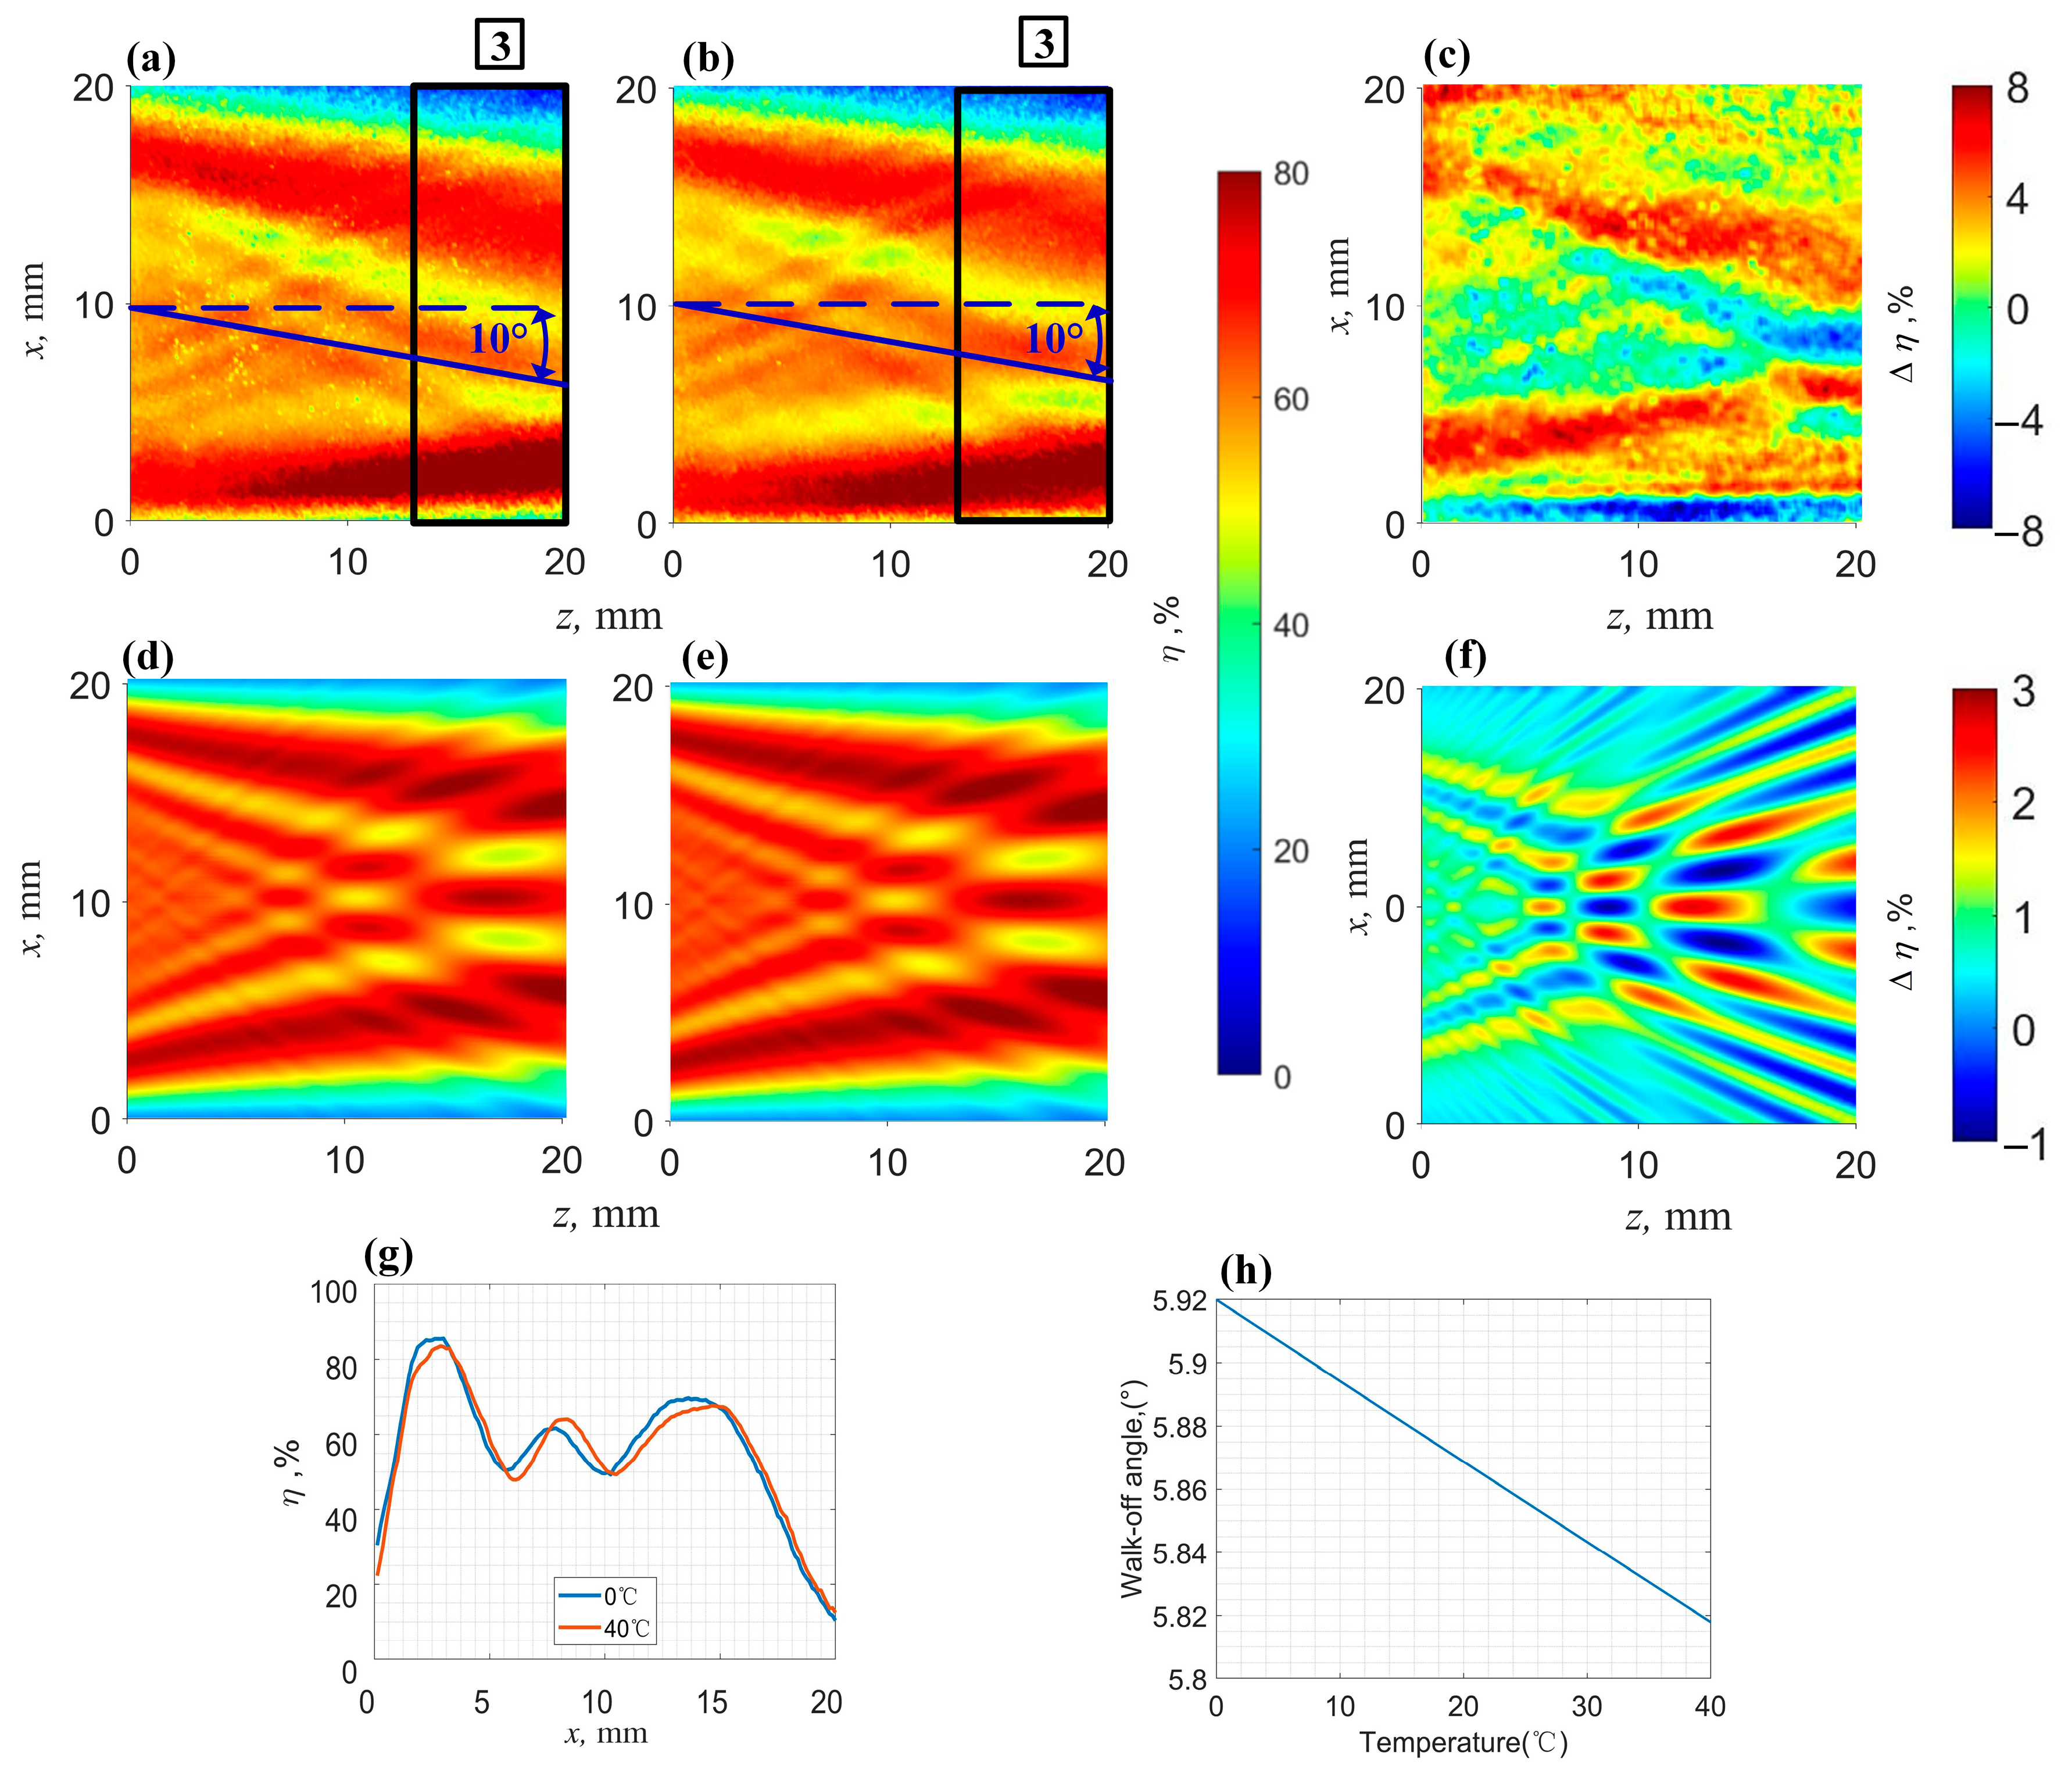
3.3. Temperature Influence on the Diffration Effiency

We first investigated the full-aperture spectral response of the AOTF under different temperatures. In order to measure the peak diffraction efficiency distribution across the full optical aperture, it is necessary to establish the relationship between center wavelength drift and temperature first.
Measurements were conducted over the temperature range of 0–40 °C, with a vacuum chamber providing the conditions for low-temperature testing. Based on Equation (5), diffraction efficiency variation is a nonlinear function, with lower changes observed when the diffraction efficiency is either very low or very high. To enhance diffraction efficiency variations, measurements were performed at P A O T F = 5.34 W, where the full-aperture efficiency was approximately 57.8% at 20 °C.
The absolute diffraction efficiency was measured by scanning the wavelength at a fixed drive frequency, ensuring constant RF power and frequency applied to the AOTF. The laser was tuned in 2 nm increments over the 3960–4010 nm range, and 20 independent measurements were taken at each temperature to obtain spectral responses. To minimize random error, the data were fitted using a sinc2 function, enabling the extraction of the central wavelength and diffraction efficiency. The spectral measurement results at different temperatures are shown in Figure 9a.
A central wavelength drift of 0.35 nm/°C (95% CI: 0.33 to 0.37 nm/°C) was observed. We compared several published data and calculated the corresponding wavelength drift, with the data from Zarubin [25] showing the closest agreement (see Figure 9b). The simulation wavelength drift is about 0.31 nm/°C. Based on the data provided, we simulated the sound velocity inside the crystal at different temperatures and calculated the variation in the anisotropic coefficient at two planes with temperature, as shown in Figure 10.
It can be observed in Figure 10b,d that as temperature increases, the ( 1 1 ¯ 0 ) plane anisotropic coefficient of the TeO2 crystal increases, while the anisotropic coefficient in the planes orthogonal to the ( 1 1 ¯ 0 ) plane decreases. This change slightly affects the acoustic field structure. Within the 0–40 °C range, the variation in the anisotropic coefficient is 3.4% and 1.4% for the two planes, respectively. Based on these parameters, we simulated the acoustic field structure at different temperatures and further calculated the diffraction efficiency distribution. The diffraction efficiency simulation calculation is based on the electro-acoustic power transmission ratio from Section 3.2, which is 0.87. The measured and simulated full-aperture diffraction efficiency variations are shown in Figure 9c. A slight decrease in diffraction efficiency was observed with increasing temperature (−0.026%/°C) (95% CI: −0.011 to −0.041%/°C), while the simulated variation in diffraction efficiency is approximately −0.018%/°C.
The variation in full-aperture diffraction efficiency with temperature is relatively small, as confirmed by both experimental and simulation results. The discrepancies observed in the experimental and simulated results may be attributed to the tilted acoustic field, which leads to differing acoustic field structures in the actual device.
By comparing the diffraction efficiency distributions at different temperatures, we found that the variations in diffraction efficiency within specific regions are significantly greater than the overall full-aperture results. As shown in Figure 11a–c, we plotted the experimental results of full-aperture diffraction efficiency at 0 °C and 40 °C, along with their differences. It is evident that the diffraction efficiency difference ranges from −8% to 8%, with the extreme values approximately 10 times larger than the average and a marked inconsistency across different regions. Similarly, the simulation results of full-aperture diffraction efficiency at 0 °C and 40 °C, along with their differences, are shown in Figure 11d–f. These results also exhibit strong inconsistencies, with diffraction efficiency differences ranging from −1% to 3%, and extreme values approximately 4 times larger than the average.
We found that the significant differences in the experimental results are due to the temperature-induced changes in the acoustic walk-off angle within the planes orthogonal to the ( 1 1 ¯ 0 ) plane. This led to a displacement of the acoustic field structure along the x-axis at different temperatures. The measurement diffraction efficiency of region 3 in Figure 11a,b is shown in Figure 11g. It is observed that at 40 °C, the acoustic field exhibits a noticeable shift compared to that at 0 °C.
Assuming the crystal used in the current device has a 0.1° cut angle along planes orthogonal to the ( 1 1 ¯ 0 ) plane, the walk-off angle at 20 °C is approximately 5.87°, which corresponds well with the observed acoustic field walk-off. The calculated walk-off angle variation over the 0–40 °C range is shown in Figure 11h, indicating a decrease of approximately 0.12° between 0 °C and 40 °C. This result effectively explains the experimentally observed phenomenon.
Clearly, this phenomenon validates our previous analysis, which suggests that as the temperature increases, the walk-off angle and acoustic anisotropy coefficient within the TeO2 crystal change, resulting in alterations in the acoustic field structure.

4. Discussion

This study comprehensively analyzes the impact of acoustic power redistribution and temperature on the full-aperture diffraction efficiency of AOTFs based on TeO2 crystals. Our findings confirm that the strong acoustic anisotropy of TeO2 significantly affects the device’s full-aperture diffraction efficiency due to acoustic field non-uniformity. In particular, we highlight the spatial inhomogeneity of the acoustic field perpendicular to the acousto-optic interaction plane, which leads to beam contraction and uneven acoustic power distribution within the aperture. These results complement previous theoretical studies [20,21], which were mainly based on a narrow light beam and focused on acoustic field effects within the interaction plane. Our findings demonstrate that the acoustic field distribution in this direction is equally critical for the full-aperture diffraction efficiency of AOTFs.
The accurate testing of the influence of crystal temperature on diffraction efficiency has been largely understudied, with most researchers [24,33,34] focusing more on the temperature dependence of RF drivers. In this study, we independently tested and analyzed the impact of varying crystal temperatures on the diffraction efficiency of the AOTF device.
We tested the temperature-induced drift in both the central wavelength and diffraction efficiency of the current AOTF device at first. The observed impact of temperature on central wavelength drift was in excellent agreement with the sound velocity data presented in Zarubin [25]. Based on the sound velocity data, we calculated the acoustic anisotropy coefficients at different temperatures and simulated the variations in full-aperture diffraction efficiency and diffraction efficiency distribution with temperature changes. Experimental validation was then conducted. The results show that the effect of temperature on full-aperture diffraction efficiency is not significant, but the diffraction efficiency variation in local regions is considerably more pronounced. Both the simulation and experimental results confirm this finding, highlighting that measurements based on single-beam analysis may contain significant errors. The results are more likely to reflect the influence of temperature on changes in the acoustic field structure.

5. Conclusions

This study focuses on the effects of acoustic field structure and temperature on the full-aperture diffraction efficiency of an AOTF based on the TeO2 crystal. First, the propagation characteristics of the acoustic field in an anisotropic material were analyzed to determine the acoustic field distribution within the device. Then, based on electrical measurements of the AOTF device’s power consumption, the relationship between diffraction efficiency in different aperture regions and power consumption was simulated and experimentally validated. Finally, the influence of temperature on the acoustic field structure and full-aperture diffraction efficiency was modeled and verified through experiments.
Both experimental and simulation results indicate that the TeO2 crystal exhibits strong acoustic anisotropy in the direction perpendicular to the acousto-optic interaction plane, leading to beam contraction and significant nonuniformity within this plane. For light beams with a width equal to the transducer height, the diffraction efficiency along the edges of the aperture significantly decreases due to the contraction of the sound beam. Furthermore, the spatial non-uniformity of the acoustic field energy hinders the concurrent attainment of optimal diffraction efficiency in disparate regions of the complete aperture. For the device used in this study, the simulated peak diffraction efficiency is approximately 92.4%, while the measured peak value is around 87.1%. This discrepancy is primarily attributed to slight acoustic field tilt, which may be caused by manufacturing deviations. In the relatively uniform central region, both experimental and simulation results reached peak diffraction efficiencies exceeding 98.0%, further confirming the significant impact of acoustic field nonuniformity on the overall diffraction efficiency.
Temperature variations alter the sound velocity slowness surface of the crystal, thereby affecting the acousto-optic phase-matching condition and causing changes in the acoustic field structure, which in turn impacts diffraction efficiency. This study modeled these effects and verified them through experiments. Both experimental and simulation results indicate that the overall variation in full-aperture diffraction efficiency with temperature is relatively small (simulation and measurement are approximately −0.018%/°C and −0.026%/°C). However, the variation in diffraction efficiency at different regions is significantly larger than the average change across the full aperture. For example, at 0 °C and 40 °C, the measured local diffraction efficiency difference ranges from −8% to 8%, while the simulation results range from −1% to 3%. The greater deviation in the measured results is primarily due to temperature-induced changes in the acoustic field tilt. This finding suggests that diffraction efficiency-temperature measurements based on a single beam may introduce significant errors and lead to conclusions that differ from full-aperture measurements.

Author Contributions

Conceptualization, H.Z. and Z.M.; methodology, Z.M. and Q.G.; software, C.Z.; validation, Z.M. and Q.G.; formal analysis, Z.M.; investigation, Z.Z.; resources, H.Z.; data curation, Z.M. and C.Z.; writing—original draft preparation, Z.M.; writing—review and editing, H.Z. and Q.G.; visualization, C.Z.; supervision, H.Z.; project administration, H.Z.; funding acquisition, H.Z. All authors have read and agreed to the published version of the manuscript.

Funding

This research received no external funding.

Institutional Review Board Statement

Not applicable.

Informed Consent Statement

Not applicable.

Data Availability Statement

Data are contained within the article.

Acknowledgments

We are very grateful to Zefu Xu for his dedication to the related discussions.

Conflicts of Interest

The authors declare no conflicts of interest.

References

  1. Bei, L.; Dennis, G.I.; Miller, H.M.; Spaine, T.W.; Carnahan, J.W. Acousto-optic tunable filters: Fundamentals and applications as applied to chemical analysis techniques. Prog. Quantum Electron. 2004, 28, 67–87. [Google Scholar]
  2. Balakshy, V.; Kupreychik, M.; Mantsevich, S.; Molchanov, V. Acousto-optic cells with phased-array transducers and their application in systems of optical information processing. Materials 2021, 14, 451. [Google Scholar] [CrossRef] [PubMed]
  3. Machikhin, A.; Batshev, V.; Pozhar, V.; Naumov, A. Single-volume dual-channel acousto-optical tunable filter. Opt. Express 2020, 28, 1150–1157. [Google Scholar]
  4. Balakshy, V.I. Acousto-optic visualization of optical wavefronts. Appl. Opt. 2018, 57, C56–C63. [Google Scholar]
  5. Ngoi, B.A.; Venkatakrishnan, K.; Tan, B.; Stanley, P.; Lim, L.E.N. Angular dispersion compensation for acousto-optic devices used for ultrashort-pulsed laser micromachining. Opt. Express 2001, 9, 200–206. [Google Scholar] [CrossRef]
  6. Mantsevich, S.N.; Voloshin, A.S.; Yushkov, K.B. Optical-frequency-comb generation with collinear acousto-optic diffraction: Theory and simulations. Phys. Rev. A 2019, 100, 013829. [Google Scholar]
  7. Chang, I.C. Noncollinear acousto-optic filter with large angular aperture. Appl. Phys. Lett. 1974, 25, 370–372. [Google Scholar] [CrossRef]
  8. Korablev, O.; Montmessin, F.; Trokhimovskiy, A.; Fedorova, A.A.; Shakun, A.V.; Grigoriev, A.V.; Moshkin, B.E.; Ignatiev, N.I.; Forget, F.; Lefèvre, F.; et al. The Atmospheric Chemistry Suite (ACS) of three spectrometers for the ExoMars 2016 trace gas orbiter. Space Sci. Rev. 2018, 214, 7. [Google Scholar]
  9. Pannell, C. Recent advances in acousto-optic tunable filters for hyper-spectral imaging with real-time spectral unmixing. In Proceedings of the Conference on Lasers and Electro-Optics (CLEO), San Jose, CA, USA, 9–14 June 2013; IEEE: Piscataway, NJ, USA, 2013; pp. 1–3. [Google Scholar]
  10. Li, J.; Gui, Y.; Xu, R.; Zhang, Z.; Liu, W.; Lv, G.; Wang, M.; Li, C.; He, Z. Applications of AOTF spectrometers in in situ lunar measurements. Materials 2021, 14, 3454. [Google Scholar] [CrossRef]
  11. Korablev, O.I.; Belyaev, D.A.; Dobrolenskiy, Y.S.; Trokhimovskiy, A.Y.; Kalinnikov, Y.K. Acousto-optic tunable filter spectrometers in space missions. Appl. Opt. 2018, 57, C103–C119. [Google Scholar]
  12. Zhe, H.; Li, C.; Xu, R.; Lv, G.; Yuan, L.; Wang, J. Spectrometers based on acousto-optic tunable filters for in-situ lunar surface measurement. J. Appl. Remote Sens. 2019, 13, 027502. [Google Scholar]
  13. Bellincontro, A.; Taticchi, A.; Servili, M.; Esposto, S.; Farinelli, D.; Mencarelli, F. Feasible application of a portable NIR AOTF tool for on-field prediction of phenolic compounds during the ripening of olives for oil production. J. Agric. Food Chem. 2012, 60, 2665–2673. [Google Scholar] [CrossRef] [PubMed]
  14. Leitner, R.; Biasio, M.D.; Arnold, T.; Dinh, C.V.; Loog, M.; Duin, R.P. Multi-spectral video endoscopy system for the detection of cancerous tissue. Pattern Recognit. Lett. 2012, 34, 85–93. [Google Scholar]
  15. Ohmachi, Y.; Uchida, N. Temperature dependence of elastic, dielectric, and piezoelectric constants in TeO2 single crystals. J. Appl. Phys. 1970, 41, 2307–2311. [Google Scholar]
  16. Uchida, N.; Ohmachi, Y. Elastic and photoelastic properties of TeO2 single crystal. J. Appl. Phys. 1969, 40, 4692–4695. [Google Scholar] [CrossRef]
  17. Voloshinov, V.B.; Khorkin, V.S.; A Kulakova, L.; Gupta, N. Optic, acoustic and acousto-optic properties of tellurium in close-to-axis regime of diffraction. J. Phys. Commun. 2017, 1, 025006. [Google Scholar] [CrossRef]
  18. Mantsevich, S.; Kostyleva, E. Shear acoustic wave attenuation influence on acousto-optic diffraction in tellurium dioxide crystal. Appl. Opt. 2020, 59, 6796–6802. [Google Scholar]
  19. Balakshy, V.I.; Mantsevich, S.N. Propagation of acoustic beams in a paratellurite crystal. Acoust. Phys. 2012, 58, 549–557. [Google Scholar]
  20. Mantsevich, S.N.; Balakshy, V.I. Acousto-optic interaction in an inhomogeneous acoustic field. Opt. Spectrosc. 2015, 118, 617–622. [Google Scholar]
  21. Mantsevich, S.N.; Balakshy, V.I.; Molchanov, V.Y.; Yushkov, K.B. Influence of acoustic anisotropy in paratellurite on quasicollinear acousto-optic interaction. Ultrasonics 2015, 63, 39–46. [Google Scholar] [CrossRef]
  22. Ermakov, A.A.; Balakshy, V.I.; Mantsevich, S.N. Ray spectra and structure of acoustic beams in crystals. Phys. Wave Phenom. 2013, 21, 314–319. [Google Scholar] [CrossRef]
  23. Mantsevich, S.N.; Kostyleva, E.I. Examination of the temperature influence on phase matching frequency in tunable acousto-optic filters. Ultrasonics 2018, 91, 45–51. [Google Scholar] [CrossRef] [PubMed]
  24. Mantsevich, S.N.; Korablev, O.; Kalinnikov, Y.; Ivanov, A.; Kiselev, A. Wide-aperture TeO₂ AOTF at low temperatures: Operation and survival. Ultrasonics 2015, 59, 50–58. [Google Scholar] [PubMed]
  25. Zarubin, V.P.; Yushkov, K.B.; Chizhikov, A.I.; Makarov, O.Y.; Molchanov, V.Y.; Tretiakov, S.A.; Kolesnikov, A.I.; Cherepetskaya, E.B.; Karabutov, A.A. Laser-ultrasonic temperature mapping of an acousto-optic dispersive delay line. NDT E Int. 2018, 98, 171–176. [Google Scholar]
  26. Schweppe, H. Elastic and piezoelectric properties of paratellurite. Ultrasonics 1970, 8, 84–87. [Google Scholar]
  27. Mantsevich, S.N.; Kostyleva, E.I. Determination of the paratellurite stiffness constants temperature coefficients by the acousto-optic method. Materialia 2022, 21, 101340. [Google Scholar]
  28. Balakshy, V.; Voloshinov, V.B.; Karasev, V.A.; Molchanov, V.Y.; Semenkov, V. Compensation of thermal effects in acousto-optic deflector. Proc. SPIE 1996, 2713, 164–171. [Google Scholar]
  29. Dekemper, E.; Vanhamel, J.; Van Opstal, B.; Fussen, D.; Voloshinov, V.B. Influence of driving power on the performance of UV KDP-based acousto-optical tunable filters. J. Opt. 2015, 17, 075404. [Google Scholar]
  30. Mi, Z.; Zhao, H.; Guo, Q.; Yu, Y.; Liang, Y. Evaluation of the Tellurium Dioxide Crystal Shear Acoustic Wave Attenuation at 40–140 MHz Frequency. Materials 2024, 17, 4082. [Google Scholar] [CrossRef]
  31. Fox, A.J. Thermal design for germanium acoustooptic modulators. Appl. Opt. 1987, 26, 872–884. [Google Scholar]
  32. Jiang, R.; Zhou, Z.; Lv, X.; Zeng, S.; Huang, Z.; Zhou, H. Spatial and temporal thermal analysis of acousto-optic deflectors using finite element analysis model. Ultrasonics 2012, 52, 643–649. [Google Scholar] [CrossRef] [PubMed]
  33. Lv, G.; Li, J.; Li, C.; Jin, J.; Lin, Y.; Xu, R.; He, Z. Temperature correction and result evaluation of lunar mineralogical spectrometer for Chang’E-5 mission. IEEE Trans. Geosci. Remote Sens. 2022, 60, 5001108. [Google Scholar] [CrossRef]
  34. Green, R.O.; Pieters, C.; Mouroulis, P.; Eastwood, M.; Boardman, J.; Glavich, T.; Isaacson, P.; Annadurai, M.; Besse, S.; Barr, D.; et al. The Moon Mineralogy Mapper (M3) imaging spectrometer for lunar science: Instrument description, calibration, on-orbit measurements, science data calibration and on-orbit validation. J. Geophys. Res. 2011, 116, E00G19. [Google Scholar] [CrossRef]
Figure 1. Wave vector diagram for the acousto-optic interaction in the studied TeO2 AOTF.
Photonics 12 00335 g001
Figure 2. Non-collinear AOTF configuration (work at e-light in o-light out mode).
Photonics 12 00335 g002
Figure 3. The TeO2 acoustic slowness surfaces cross-sections in (a) ( 1 1 ¯ 0 ) plane and (b) the planes orthogonal to the ( 1 1 ¯ 0 ) plane. (The red lines represent the slowness surface, the blue arrows indicate the phase velocity direction and the green arrows represent the energy velocity direction of the sound wave). (c) The dependences of acoustic anisotropy coefficient (1,2) on the two planes. (The black dashed lines represent the cut-off angle of current device).
Photonics 12 00335 g003
Figure 4. (a) Simulation acoustic field power structure at ( 1 1 ¯ 0 ) plane (without walk-off at X-Z plane). (b) The planes orthogonal to the ( 1 1 ¯ 0 ) plane. (c) The coordinate system for acoustic field simulation and acousto-optic interaction calculation.
Photonics 12 00335 g004
Figure 5. (a) Experimental setup. (b) Image of zero-order pattern (AOTF off). (c) Image of zero-order pattern (AOTF on).
Photonics 12 00335 g005
Figure 6. (a) Efficiency pattern of 22 × 22 mm full aperture. (b) Efficiency pattern of selected 20 × 20 mm aperture.
Photonics 12 00335 g006
Figure 7. Efficiency simulation and measurement comparison at three different RF power: (a,b) measurement and simulation for 5.34 W power level(Divided uniformly along the Z-axis and X-axis into regions 1, 2, 3 and 4, 5, 6); (c,d) measurement and simulation for 9.70 W power level; (e,f) measurement and simulation for 14.70 W power level; (g,h) diffraction efficiency distribution at area 1, 2, 3 in (a,b).
Photonics 12 00335 g007
Figure 8. Efficiency simulation and measurement comparison at different areas: (a) the dependence of measurement efficiency and power; (b) the dependence of simulation efficiency and power; (c) full-aperture average diffraction efficiency of 20 × 20 mm; (d) full-aperture average diffraction efficiency of 20 × 20 mm aperture and 18 × 20 mm aperture.
Photonics 12 00335 g008
Figure 9. Full-aperture average spectral response of the AOTF devices at different temperatures: (a) measured spectral response at different temperature (* represents the measured results and the line represents the sinc2 fitting result); (b) measured and simulated center wavelength at different temperature; (c) measured and simulated full-aperture average diffraction efficiency at different temperatures.
Photonics 12 00335 g009
Figure 10. Variation in sound velocity and acoustic anisotropy coefficients with temperature at two crystal planes (a,b) the ( 1 1 ¯ 0 ) plane; (c,d) the planes orthogonal to the ( 1 1 ¯ 0 ) plane.
Photonics 12 00335 g010
Figure 11. (a,b) Measured full-aperture diffraction efficiency patterns at 0 °C and 40 °C (with a 10° auxiliary line drawn to compare the tilt magnitude, the diffraction efficiency distribution of region 3, which has the farthest sound field propagation distance, is compared in subfigure (g)); (c) difference of measured full-aperture diffraction efficiency patterns in (a,b); (d,e) simulation full-aperture diffraction efficiency patterns at 0 °C and 40 °C; (f) difference of simulation full-aperture diffraction efficiency patterns in (d,e); (g) diffraction efficiency distribution at area 3 in (a,b); (h) variation in the walk-off angle with temperature.
Photonics 12 00335 g011
Disclaimer/Publisher’s Note: The statements, opinions and data contained in all publications are solely those of the individual author(s) and contributor(s) and not of MDPI and/or the editor(s). MDPI and/or the editor(s) disclaim responsibility for any injury to people or property resulting from any ideas, methods, instructions or products referred to in the content.

