Article

Wavefront Characterization of an Optical Parametric Oscillator as a Function of Wavelength

Laboratorio de Óptica, Instituto Universitario de Investigación en Óptica y Nanofísica, Universidad de Murcia, Campus de Espinardo (Ed. 34), 30100 Murcia, Spain
Photonics 2025, 12(4), 347; https://doi.org/10.3390/photonics12040347
Submission received: 7 March 2025 / Revised: 30 March 2025 / Accepted: 3 April 2025 / Published: 8 April 2025

Abstract

:
The wavefront aberrations (WAs) of a laser beam produced by an optical parametric oscillator (OPO) have been measured using a Hartmann–Shack sensor. The OPO tuning operation requires changes in the device that might affect the shape of the wavefront beam as the illumination wavelength is being modified. Different output wavelengths in the range 550–850 nm were systematically analyzed in terms of WAs. The WA laser beam was fairly stable with time (changes of about 1%), independently of the wavelength. Moreover, WAs were non-negligible and nearly constant between 600 and 800 nm, but they noticeably increased for 550 (~90%) and 850 nm (~50%), mainly due to a higher astigmatism influence. The contributions of other higher-order terms such as coma and spherical aberration also present particular spectral dependences. To our knowledge, this is the first report of a spectral OPO laser beam characterization in terms of optical aberrations. It addresses a gap in OPO laser characterization of WAs and offers actionable insights for multi-wavelength applications. These results might be useful in applications ranging from micromachining procedures to biomedical imaging, where an optimized focal spot is required to increase the efficiency of certain physical phenomena or to enhance the quality of the acquired images.

1. Introduction

Since the early 1990s, developments in ultrafast laser technology have been the key for the success of the different multiphoton (MP) microscopy modalities [1,2,3], including two-photon excitation fluorescence (TPEF), second harmonic generation (SHG), and third harmonic generation (THG). These imaging techniques have seen rapid growth in life science biomedical applications, ensuring extended penetration depth, three-dimensional resolution, and reduced photo-damage in the tissues [1,2,3,4].
To aid researchers, manufacturers are continuously trying to increase the power and wavelength range of light sources. Nowadays these devices provide access to a wider range of excitation wavelengths and higher power level necessary to perform in vivo deep imaging and photo-stimulation in neuroscience, optogenetics, immunology, and other related fields [5,6,7].
Since tissue structures are often complex, different wavelengths (visible and near-infrared [NIR]) are often required to visualize, localize, and activate the different components, and to improve the mapping and characterization of certain features within the samples. In that sense, multispectral imaging instruments serve as non-invasive and precise tools for diagnosis [8]. This is becoming indispensable in clinical environments since it can be used in different applications ranging from pathological research to wound healing or tumor analyses [9]. The technique involves several spectral bands and provides both spectral and spatial information. Images acquired combining different wavelengths offer additional information on biological features useful for an accurate characterization of tissues. In particular, the combination of MP modalities (such as TPEF, SHG, and THG) offers enhanced capabilities and potential applications in biomedicine [10,11].
Fluorescence lifetime imaging is being used for quantitative measurements of cell health [12]. Applications to the living eye using different wavelengths have reported information on the visual cycle and the cellular metabolism of several retinal cell classes [13]. This often requires adaptative optics assistance to obtain enough resolution for the lifetime signal from individual cells. On the other hand, micromachining procedures on biological materials, in particular intratissue laser surgery and intratissue refractive index shaping (IRIS) also require either NIR or visible femtosecond (fs) laser sources [14,15,16].
Many of these applications require tightly focused laser pulses inside the sample/tissue. However, the presence of wavefront aberrations (WAs) enlarges the focal spot size, which represents a main limiting factor, especially at deeper layers. The control and optimization of the WA would increase the performance of both microscopy and lifetime imaging techniques, as well as micromachining operations, among others.
A broadly used method of producing fs laser beams with different wavelengths is an optical parametric oscillator (OPO) [17]. This is an optical device that provides light of variable wavelengths (i.e., tunable) by means of an optical parametric amplification process. The tuning operation requires internal (and/or external) modifications that might modify, not only the wavelength (as expected), but also other physical properties of the laser beam, such as the WA. Non-controlled changes in the WA pattern could affect the efficiency of the applications using the wavelength versatility offered by OPOs.
An accurate knowledge of the laser beam WAs is the first step towards the generation of an appropriate laser spot. Here, we investigate the changes in the WA of the outgoing laser beam produced by an OPO for different wavelengths.

2. Methods

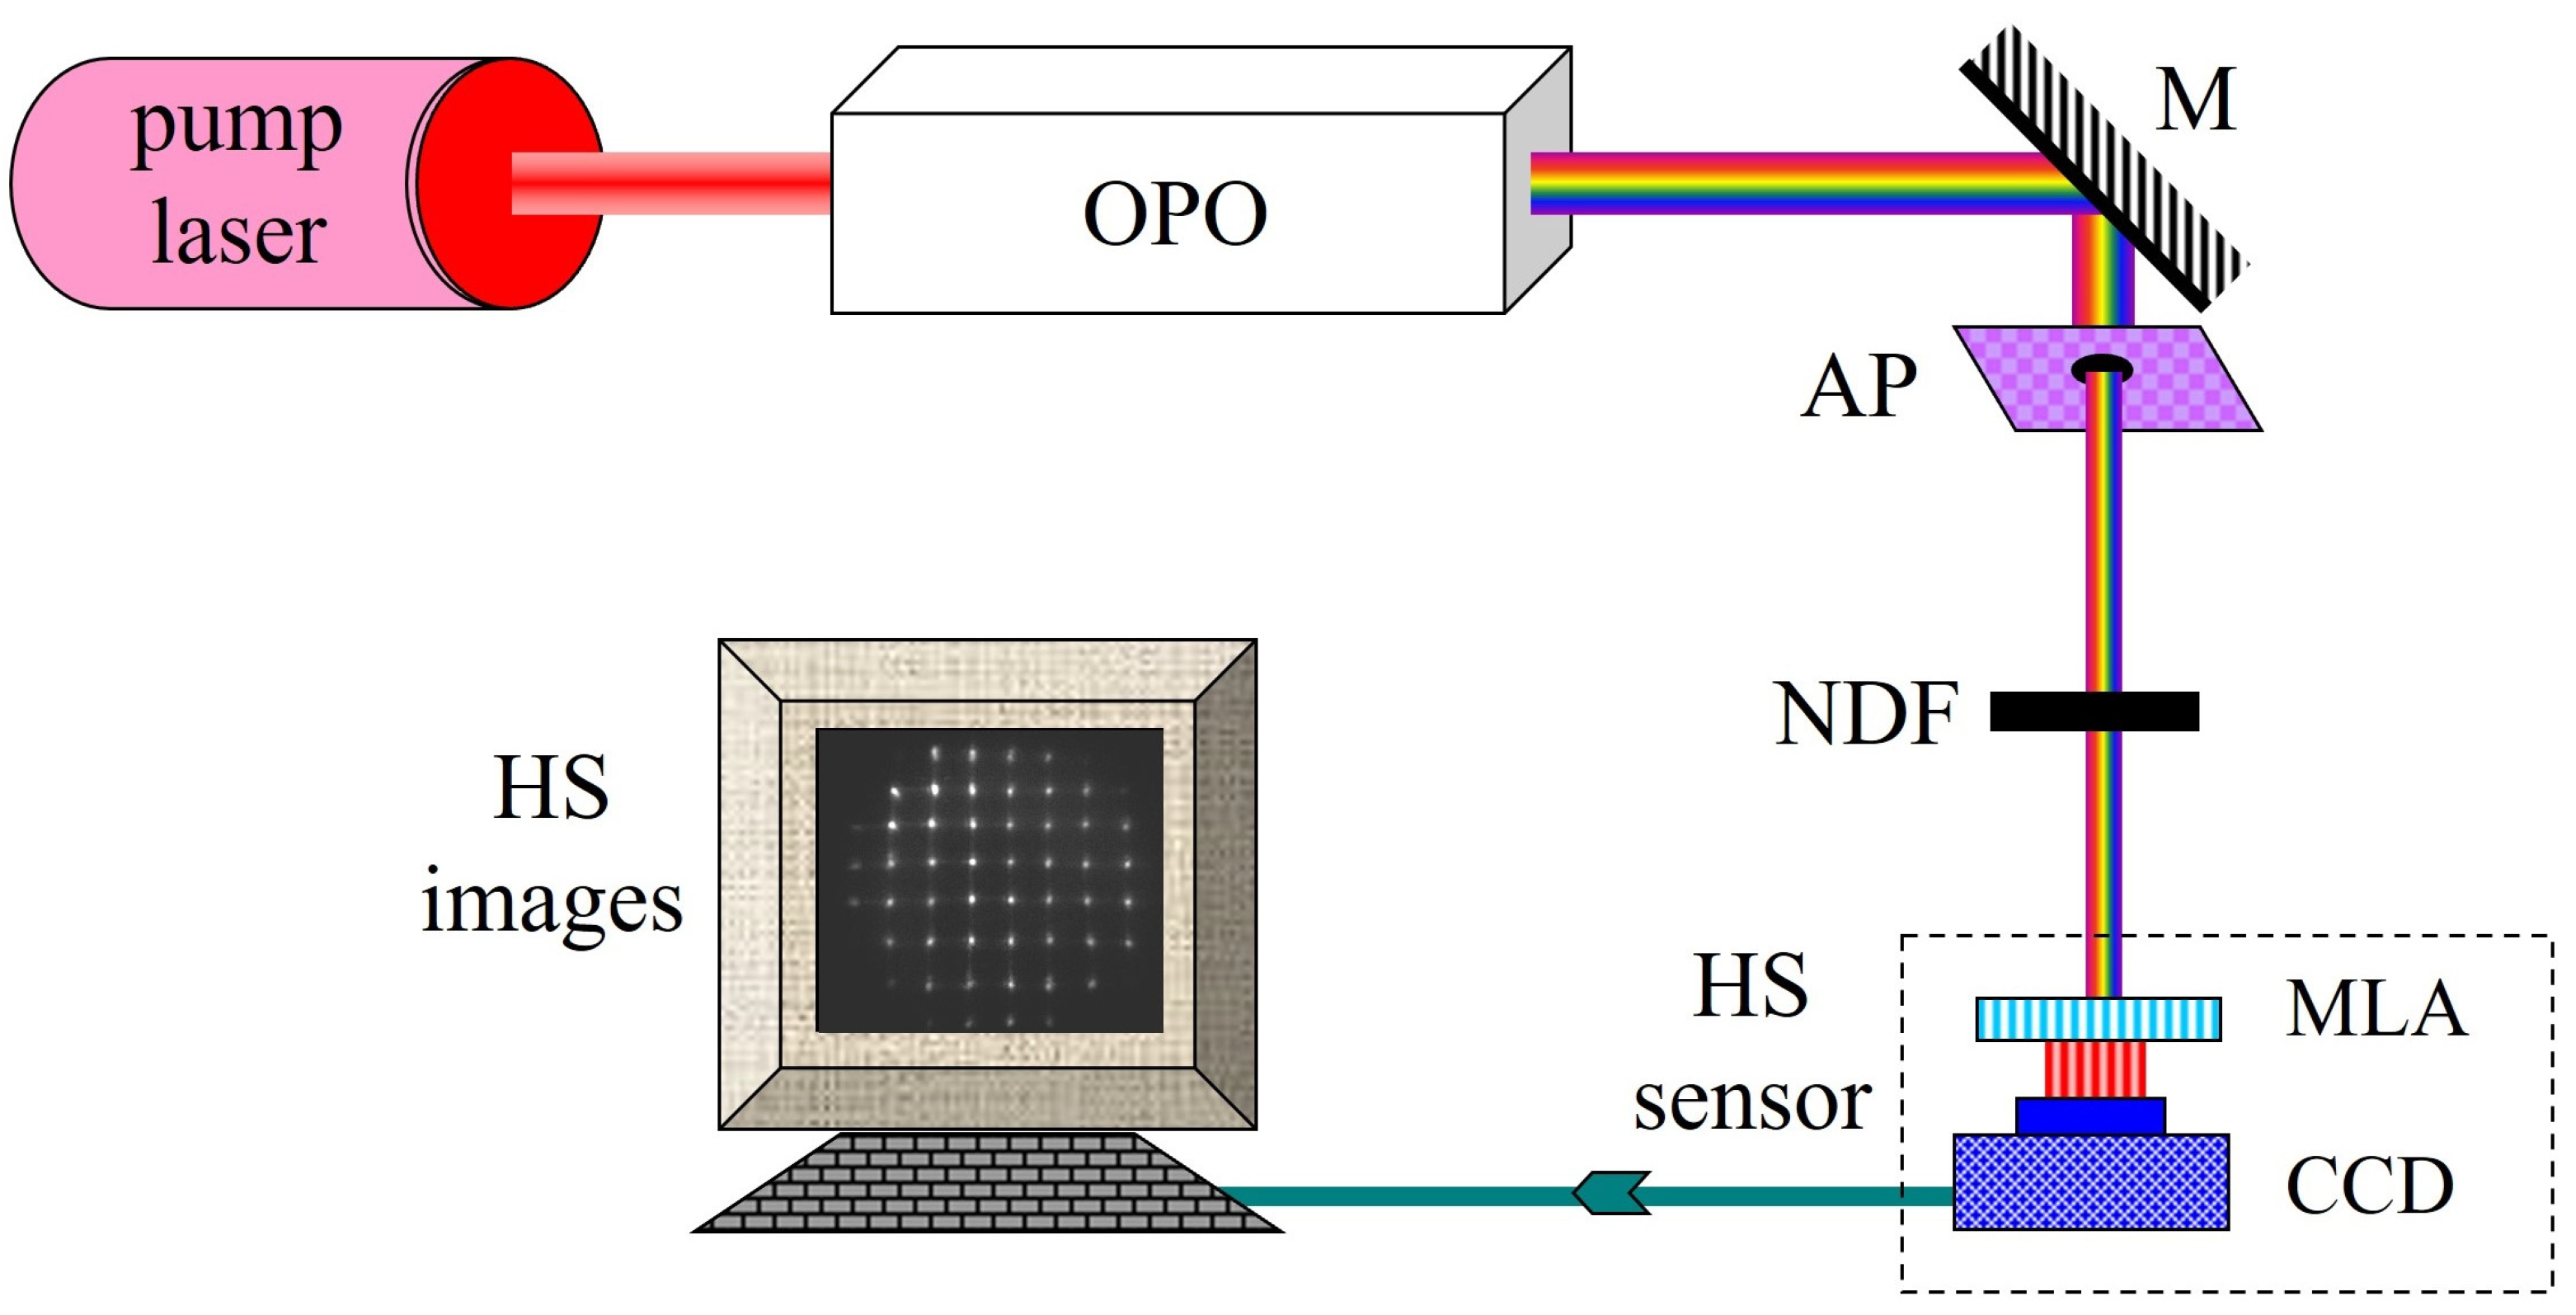
2.1. Experimental System

The fs laser beam with different wavelengths was produced by a commercially available OPA (TOPAS-C, Light Conversion, Vilna, Lituania). This was pumped by an 800 nm Ti:sapphire laser amplifier (Legend, Coherent, Saxonburg, PA, USA) and it has a computer controllable tunable output with a range between 240 to 2600 nm (using the optional frequency mixers). For the present experiment the chosen wavelengths were as follows: 550, 600, 640, 700, 750, 800, and 850 nm. The reason for exploring this spectral range is mainly practical, since our interest is mainly centered on TPEF and SHG imaging applications [10,11] and IRIS/intrastromal ablation procedures [14,15,16]. These techniques use wavelengths in the range involved in the present experiment.
A Hartman–Shack (HS) wavefront sensor (WFS150-5C, Thorlabs Inc., Newton, NJ, USA) was used to measure the WA for each wavelength of the laser beam emerging from the OPO. A schematic diagram of the experimental setup is depicted in Figure 1. The emergent laser beam was reflected by a mirror (M), passed a 4 mm fixed aperture (AP; P4000UK, Thorlabs Inc., Newton, NJ, USA), and reached the HS sensor. AP was used to set the size of the beam to the desired diameter and the round, step-variable, metallic neutral density filter (NDF; NDC-100S-4M, Thorlabs Inc., Newton, NJ, USA) avoided any damage of the CCD camera. The HS microlens array (MLA, 0.15 mm pitch and 3.7 mm focal length) sampled the wavefront. From the pattern of spots, the laser beam WA was estimated and expressed as a Zernike polynomial expansion up to the fourth order across a 4 mm pupil [18]. From each WA, the associated point spread function (PSF) was also calculated (see Section 2.2). The root-mean-square (RMS) was used as a WA quality parameter. Image acquisition and processing were performed using custom software developed in MatlabTM (version R2022a).

2.2. Wavefront Aberration and Zernike Polynomials

From a mathematical point of view, the WA can be defined as a linear combination of the Zernike polynomials, Z n m , orthogonal functions defined in a circular aperture. The most extended notation used to describe this polynomial expansion is the double-index convention of the Optical Society of America [19]: the sub-index to indicate the radial order (n) and a super-index for the frequency (m). Then, the general Zernike expansion can be represented in radial coordinates as follows:
W A ρ , θ = n = 0 m = n n c n m · Z n m ρ , θ
where c n m represents the coefficients of the series.
One of the advantages of using Zernike polynomials is that each individual term can be associated with a particular aberration. For example, astigmatism, defocus, coma, and spherical aberration correspond respectively to terms Z2±2, Z20, Z3±1, and Z40. Moreover, from each set of Zernike polynomials, the RMS can be computed as follows:
R M S = c n m 2
where the higher the RMS value, the lower the optical quality. The value will be zero for a perfect optical system or a planar wavefront.
On the other hand, the PSF is defined as the magnitude squared of the Fourier Transform of the pupil function [20]. In easy terms, the PSF of an optical system is the irradiance distribution that results from a single point source, that is, the response of an optical imaging system to a point source object.
In this work, some results are shown for all aberration terms but defocus. This means that the calculation of either the RMS or the PSF was conducted taking term Z20 as null.

3. Results

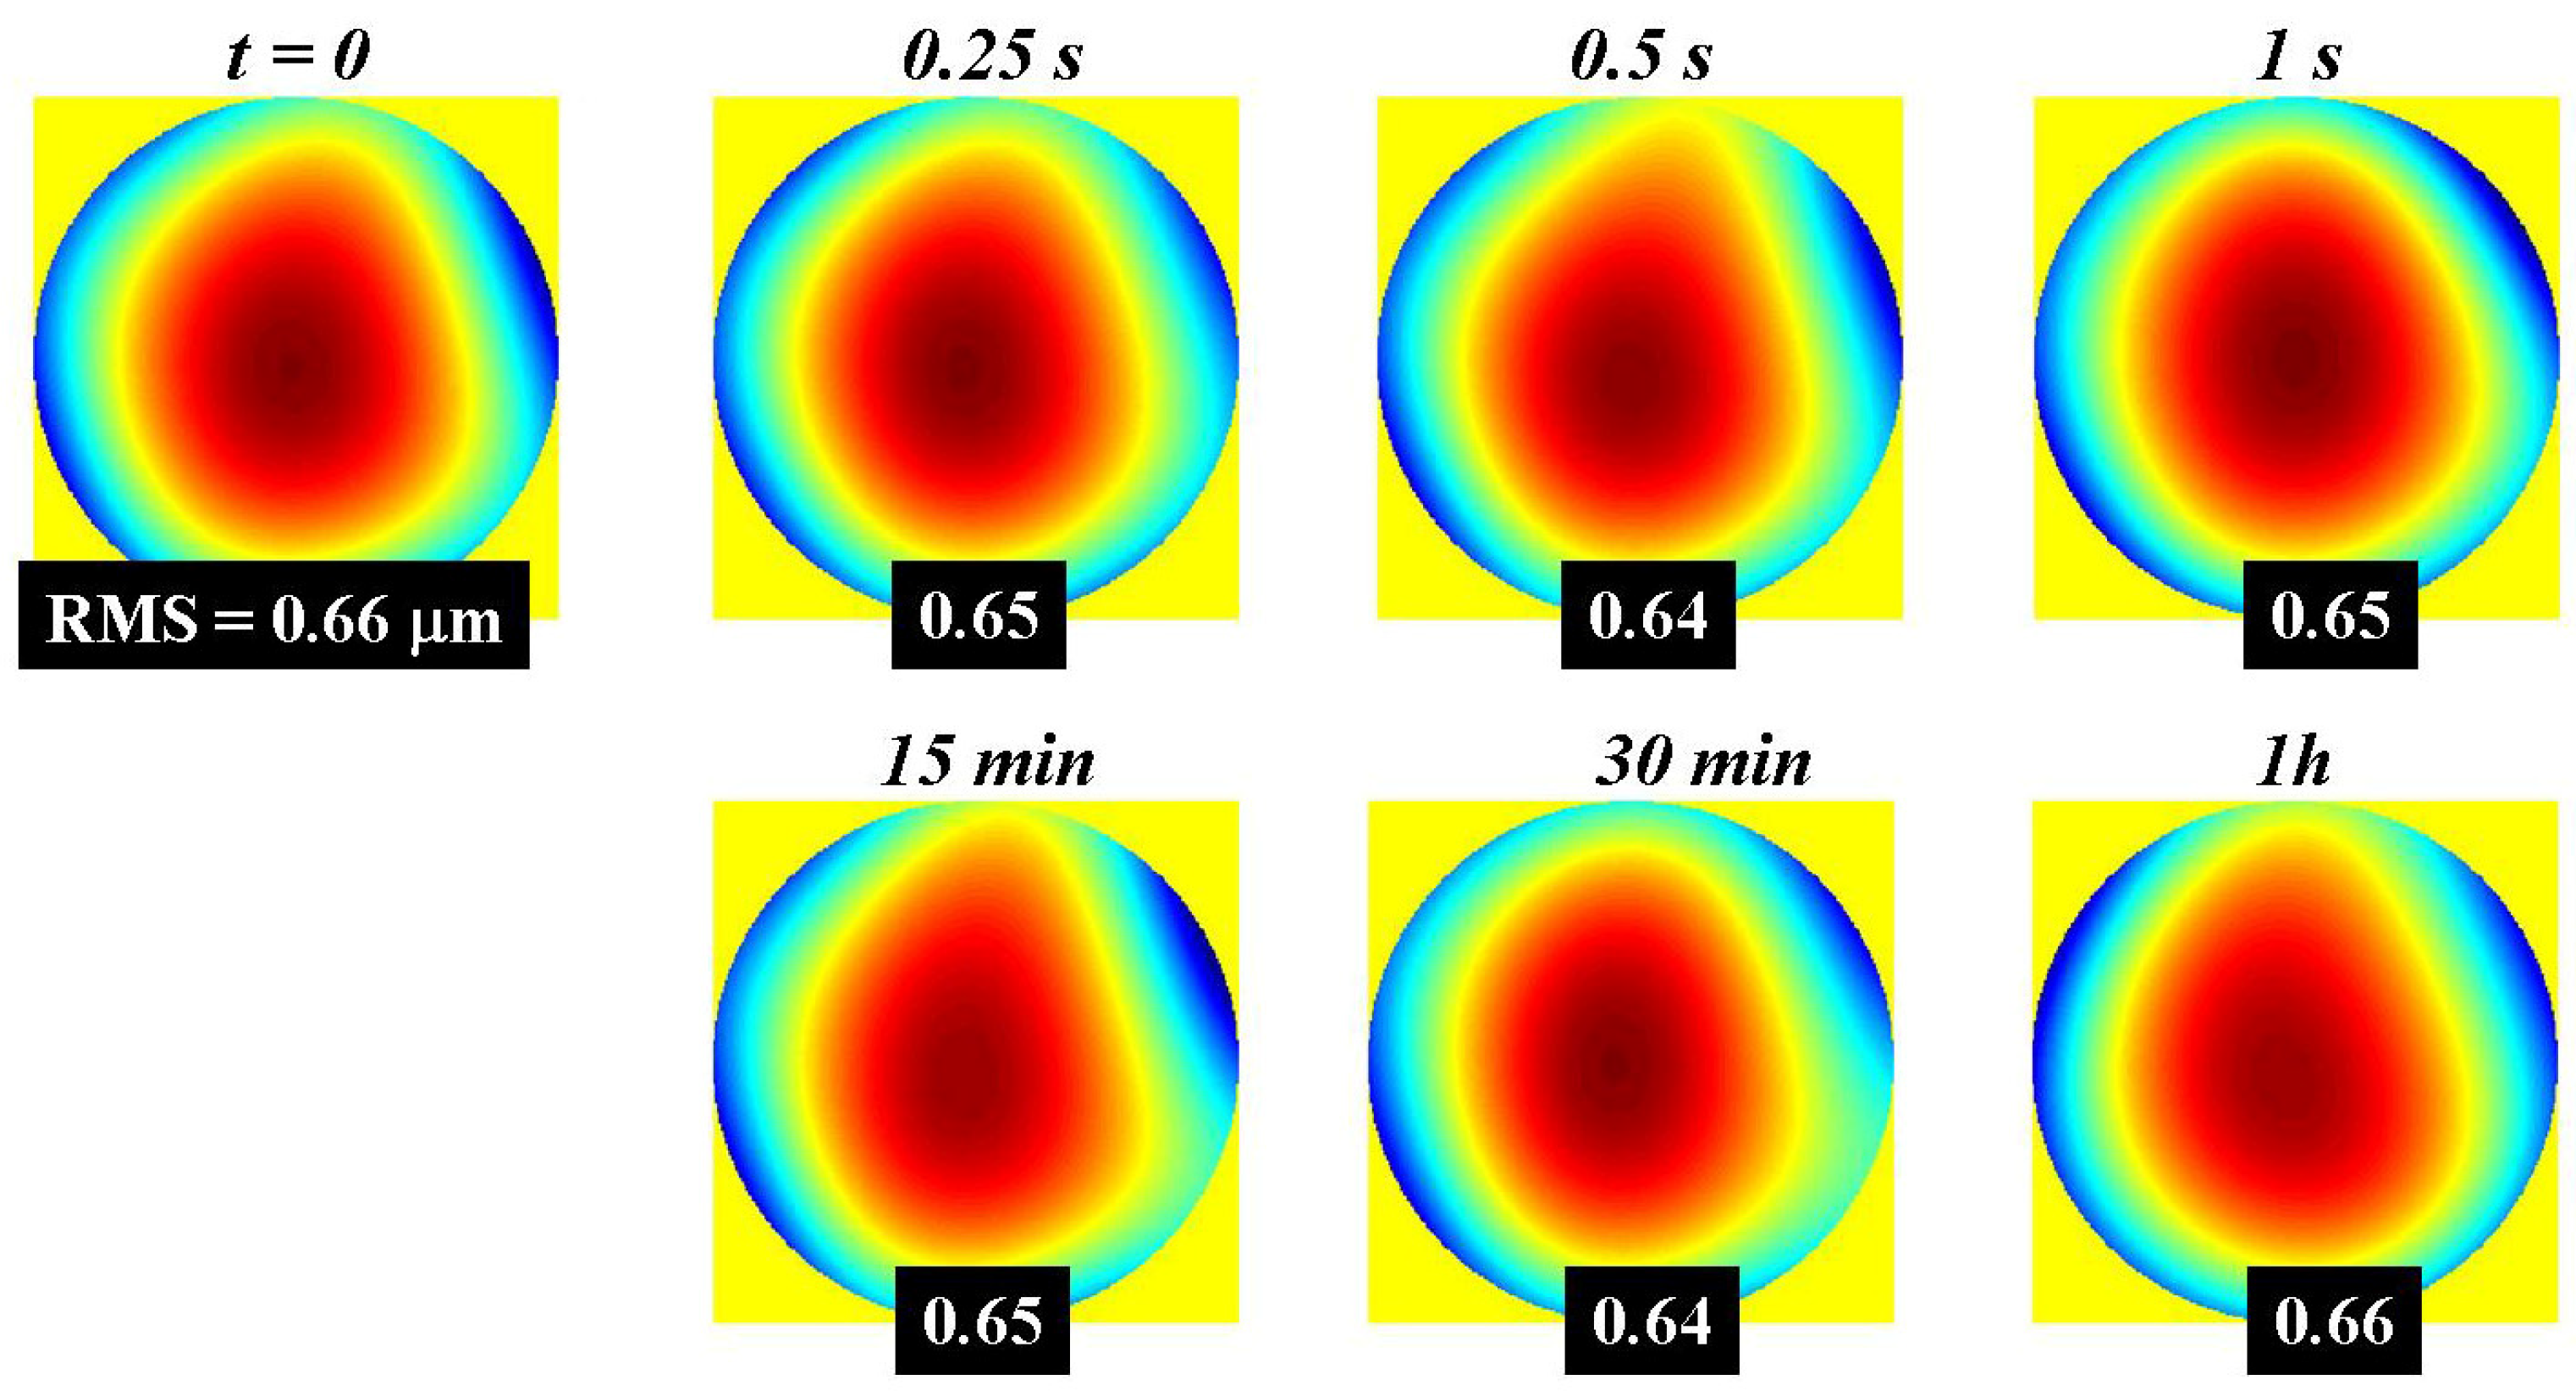
3.1. Wavefront Temporal Stability

The temporal stability of the laser beam WA was first tested. For this, the wavelength was set to 660 nm and HS images were recorded at two different temporal rates: 25 fps (frames per second) and one every 15 min. The measured WA maps (from second- to fourth-order terms) as a function of time are shown in Figure 2. The upper panels correspond to HS images acquired 0.25 s apart (for 1 s). The bottom panels were computed from HS images recorded every 15 min along 1 h. It can qualitatively be observed that the WA was quite stable over time. The corresponding RMS values ranged between 0.64 and 0.66 μm (see insets).
Figure 3 presents the individual Zernike terms averaged along 1 s (in red) and 1 h (in blue). The size of the error bars indicates that changes for both temporal scales are not noticeable. Defocus was the dominant aberration term, with a contribution to the total WA of ~70%. The maximum changes in total RMS along the two temporal intervals were, respectively, 0.019 and 0.027 μm.
The PSFs (excluding defocus) computed from the WAs averaged across 1 s and 1 h are depicted in Figure 4.

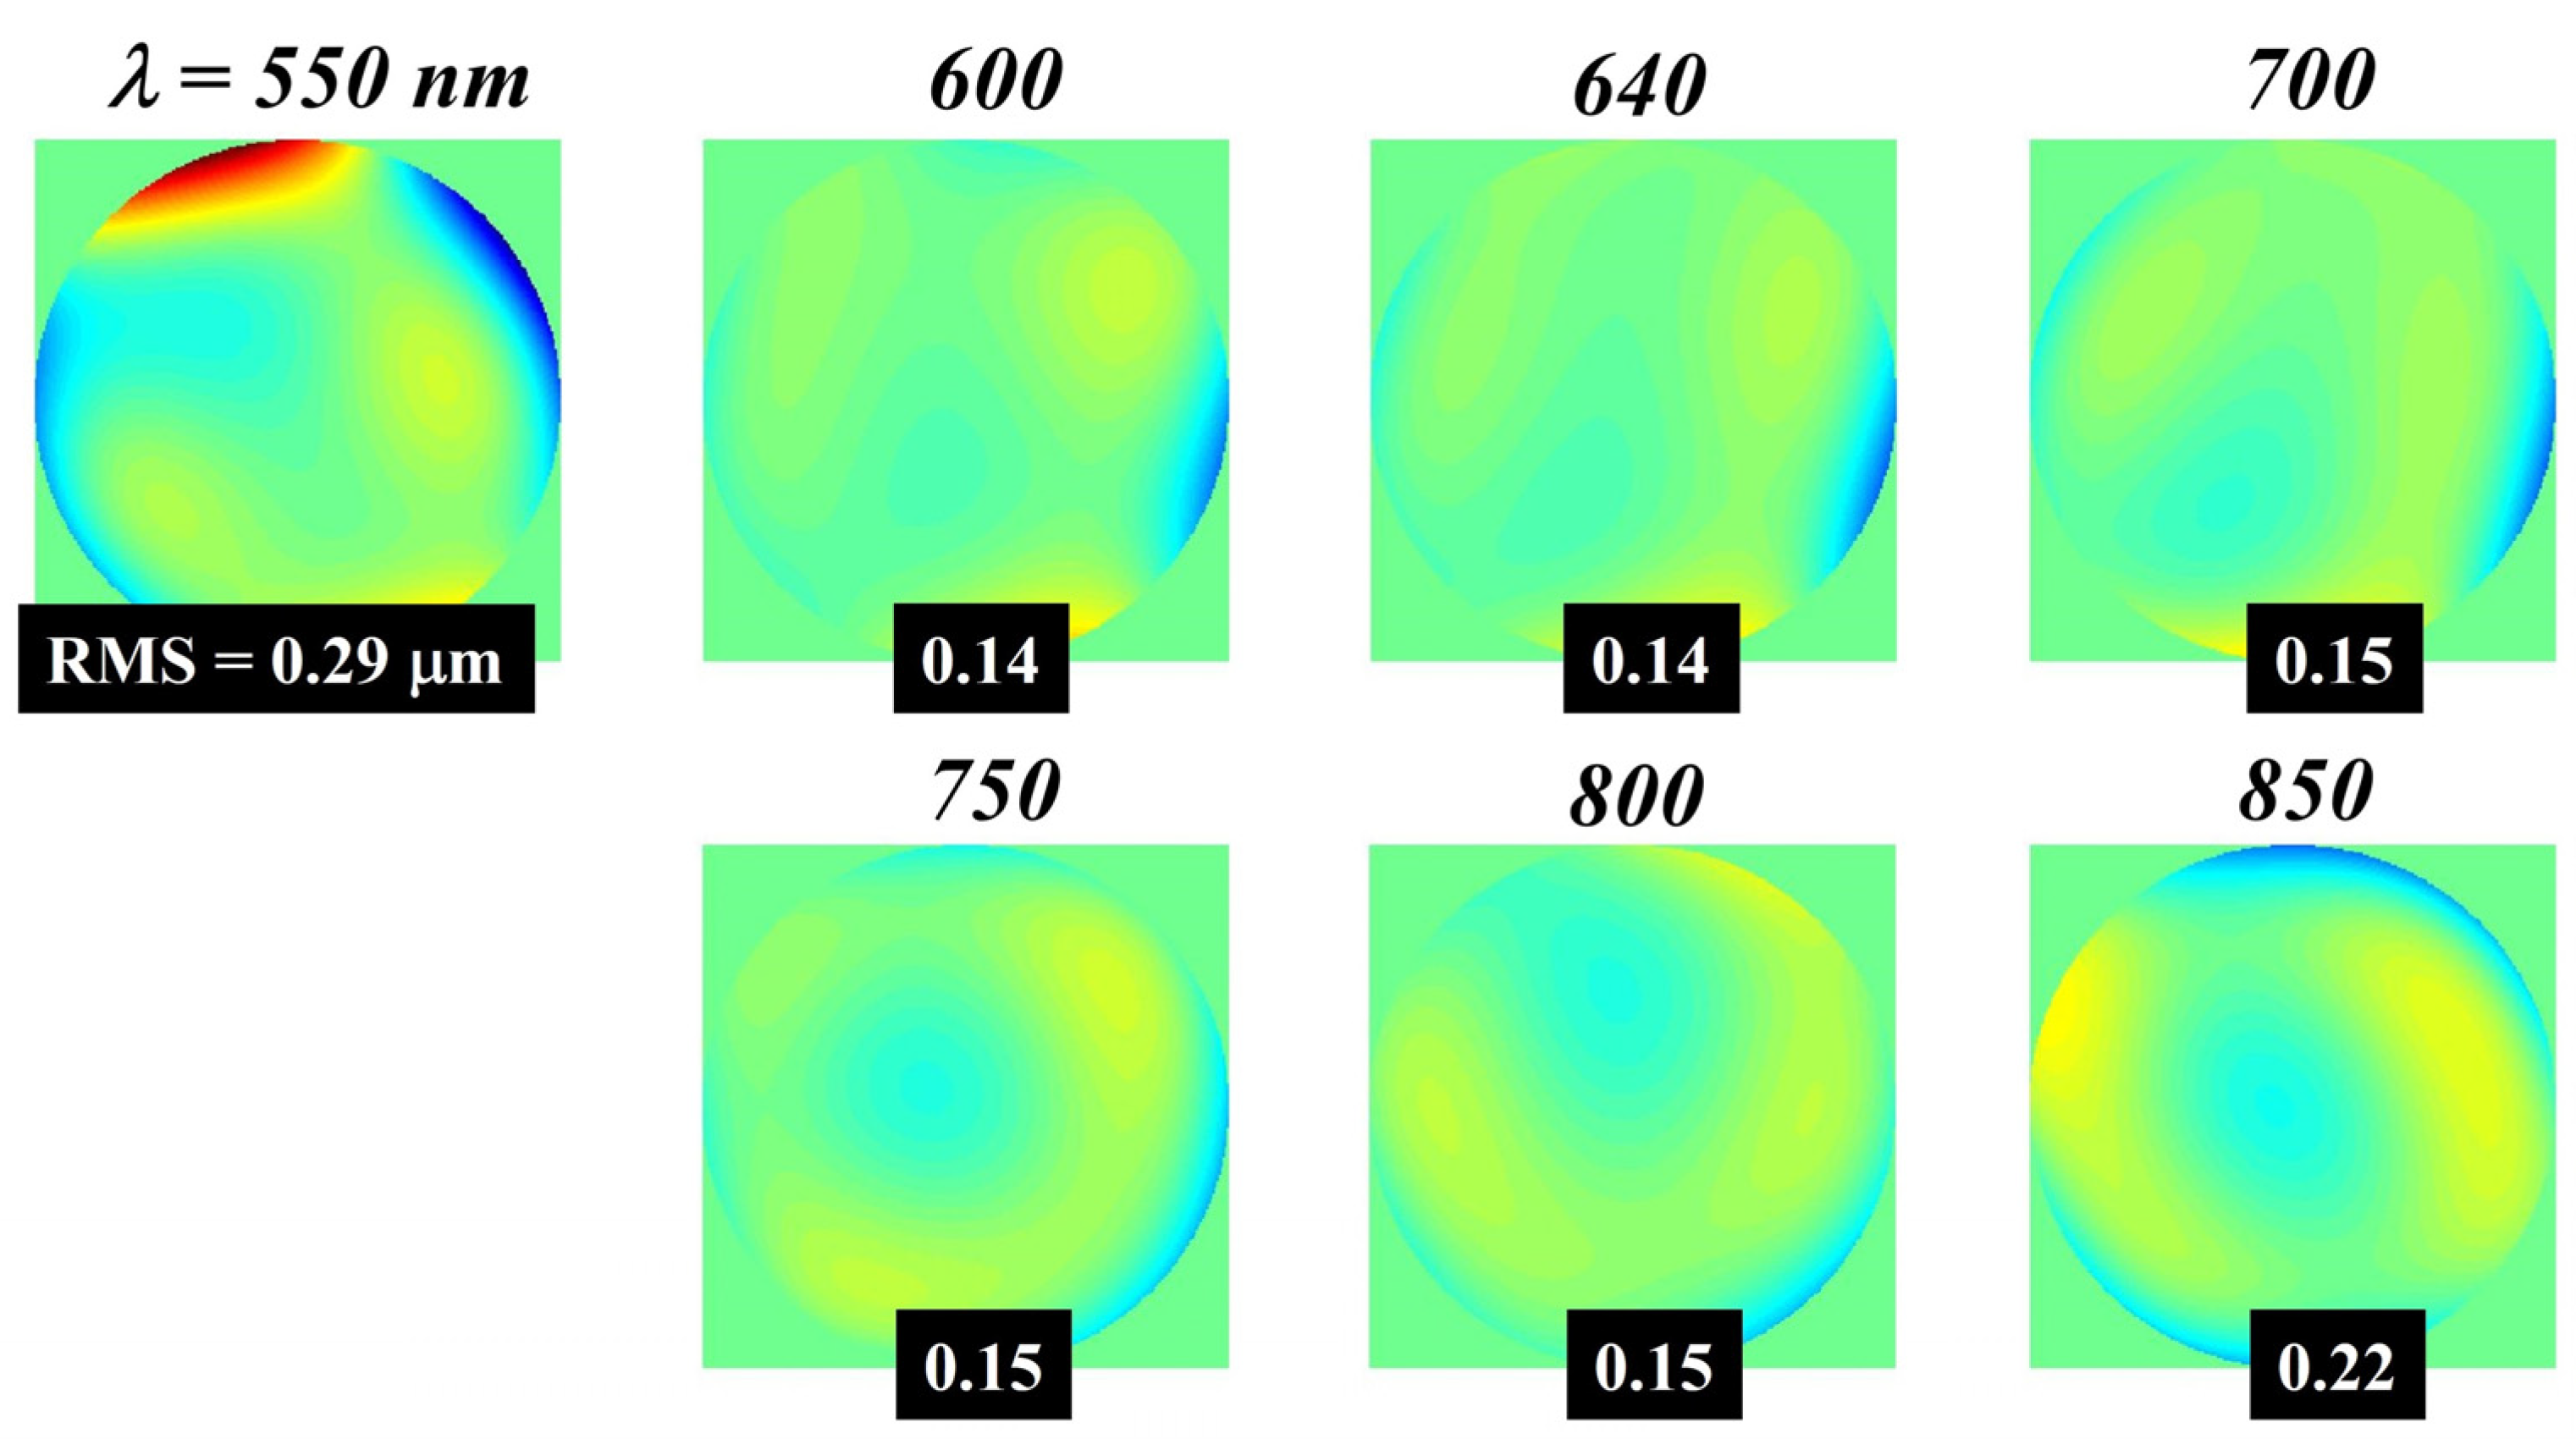
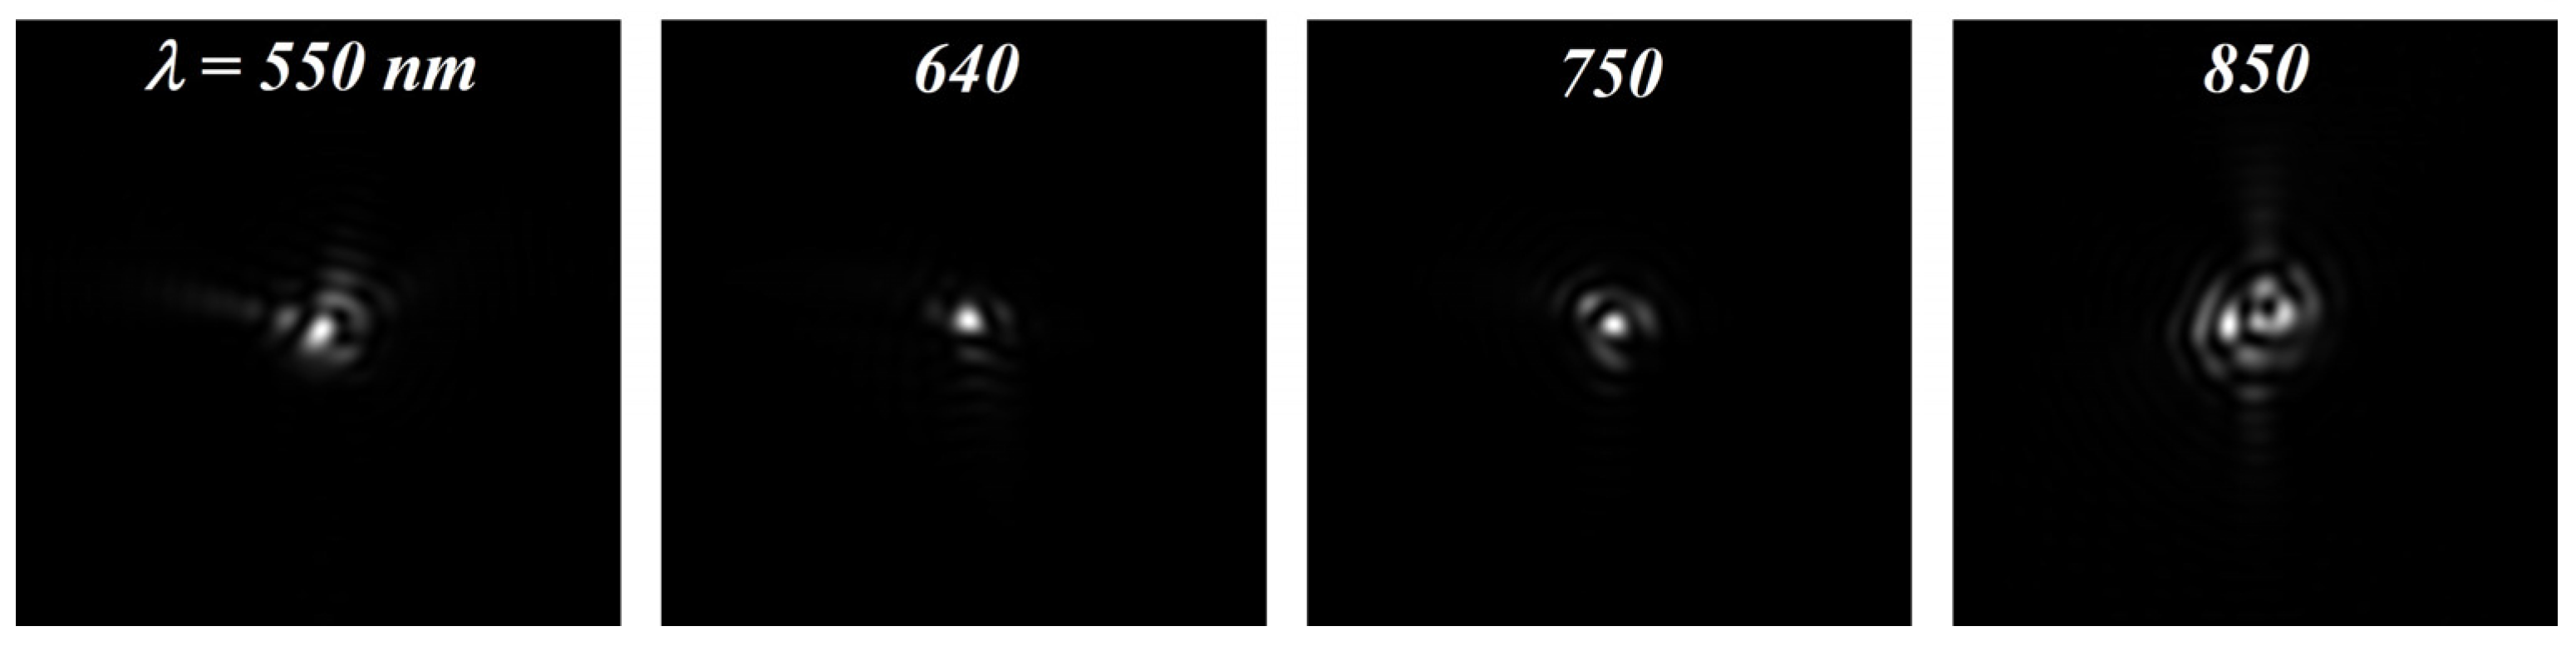
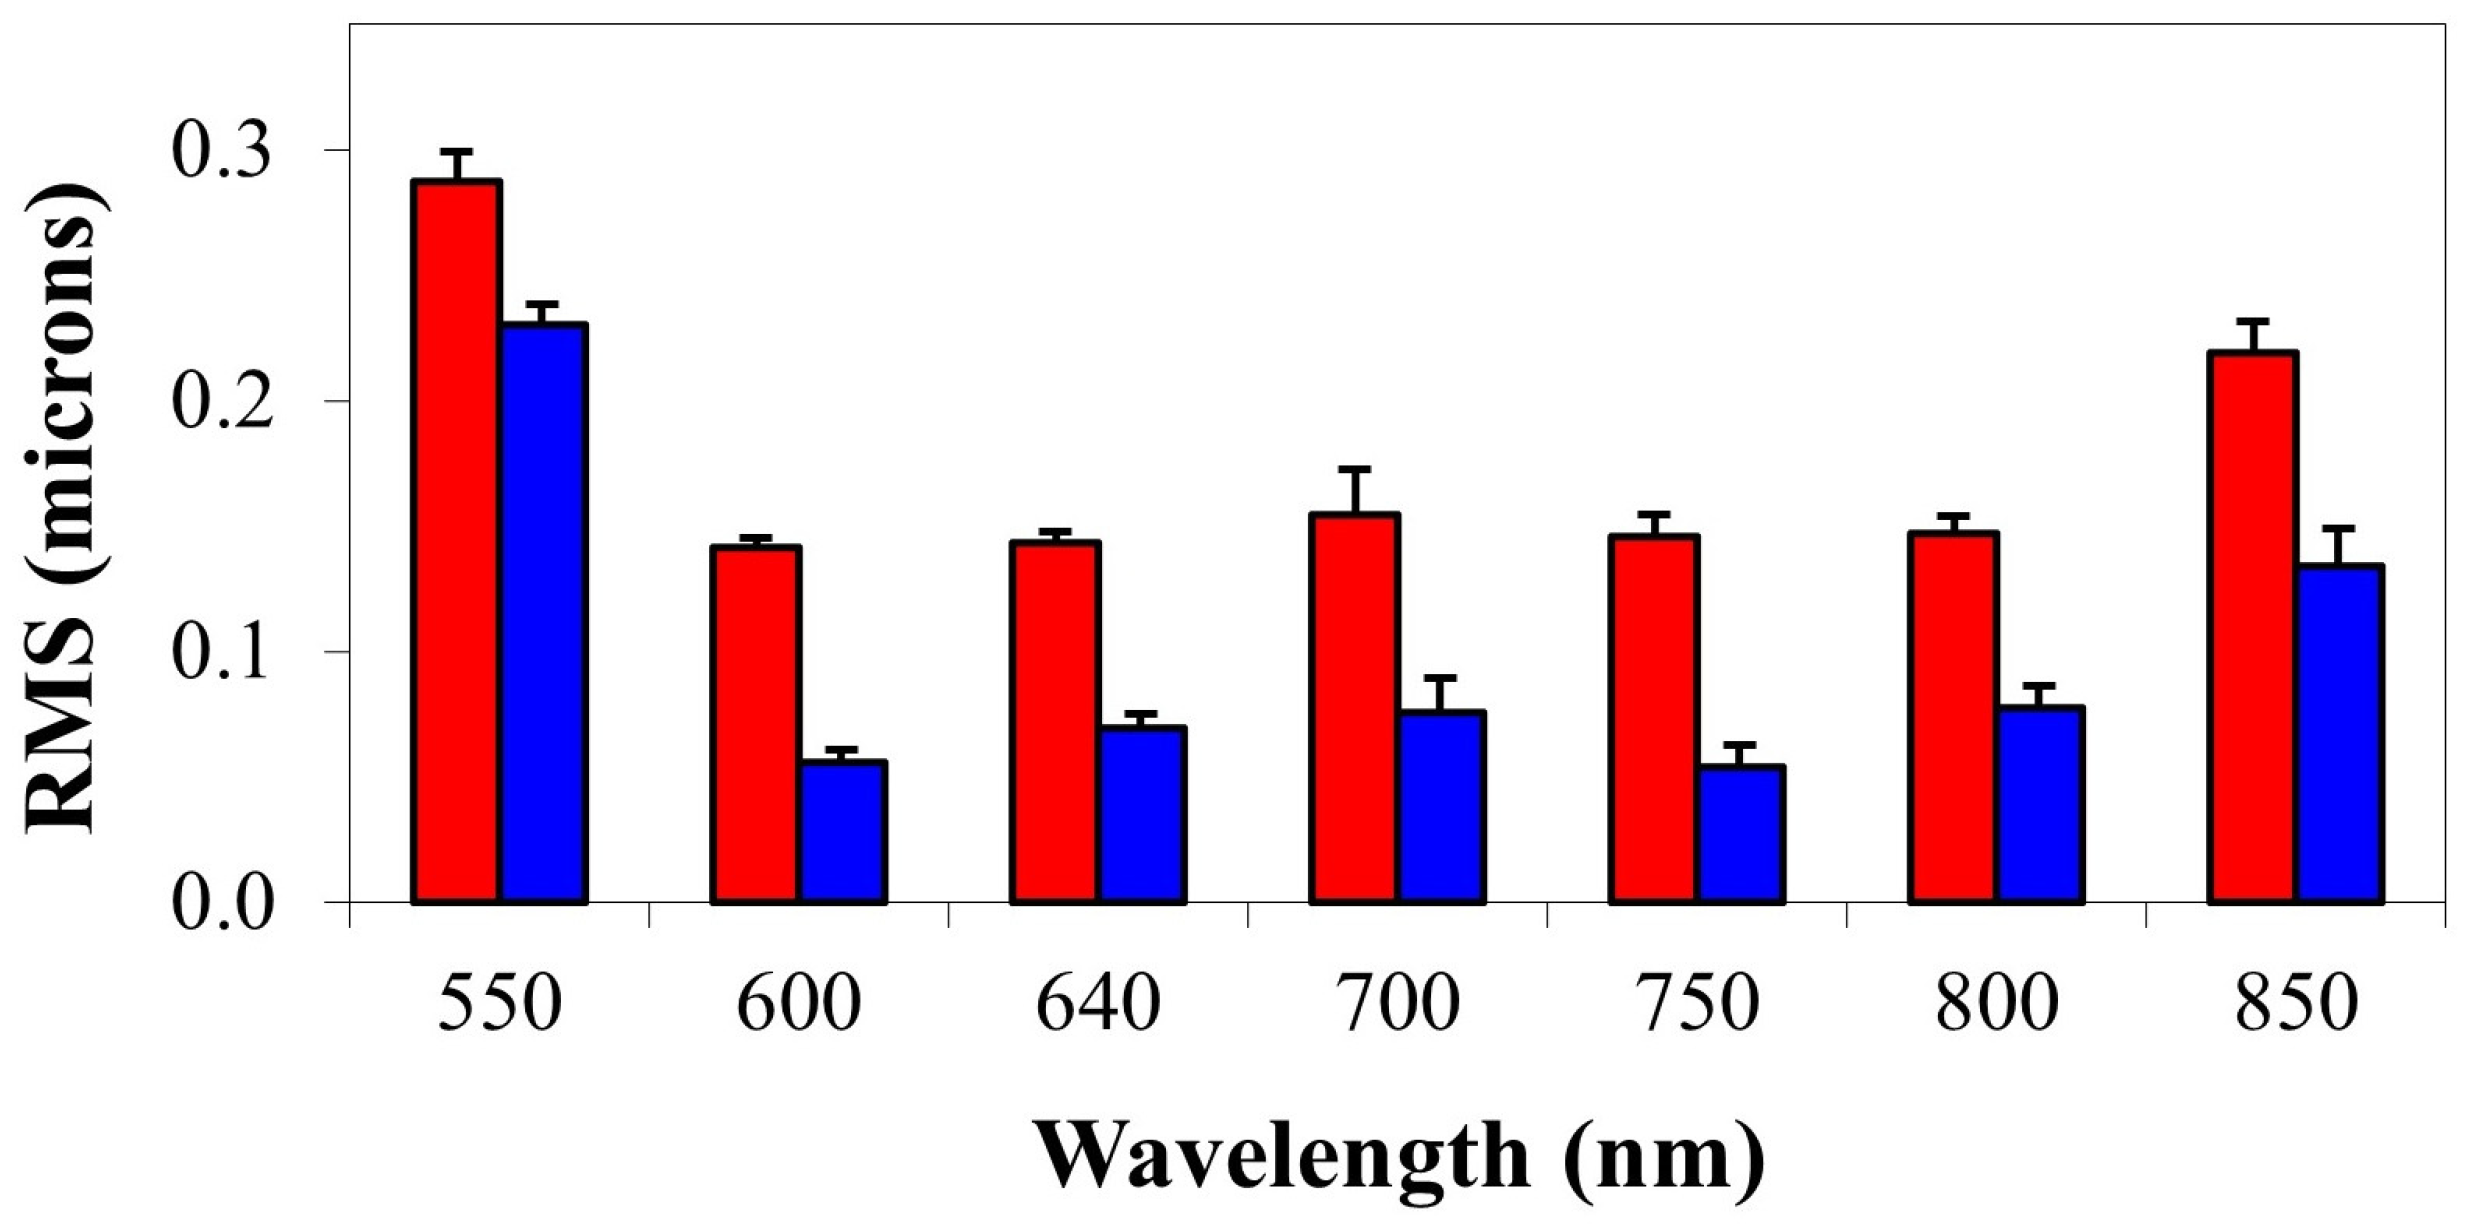
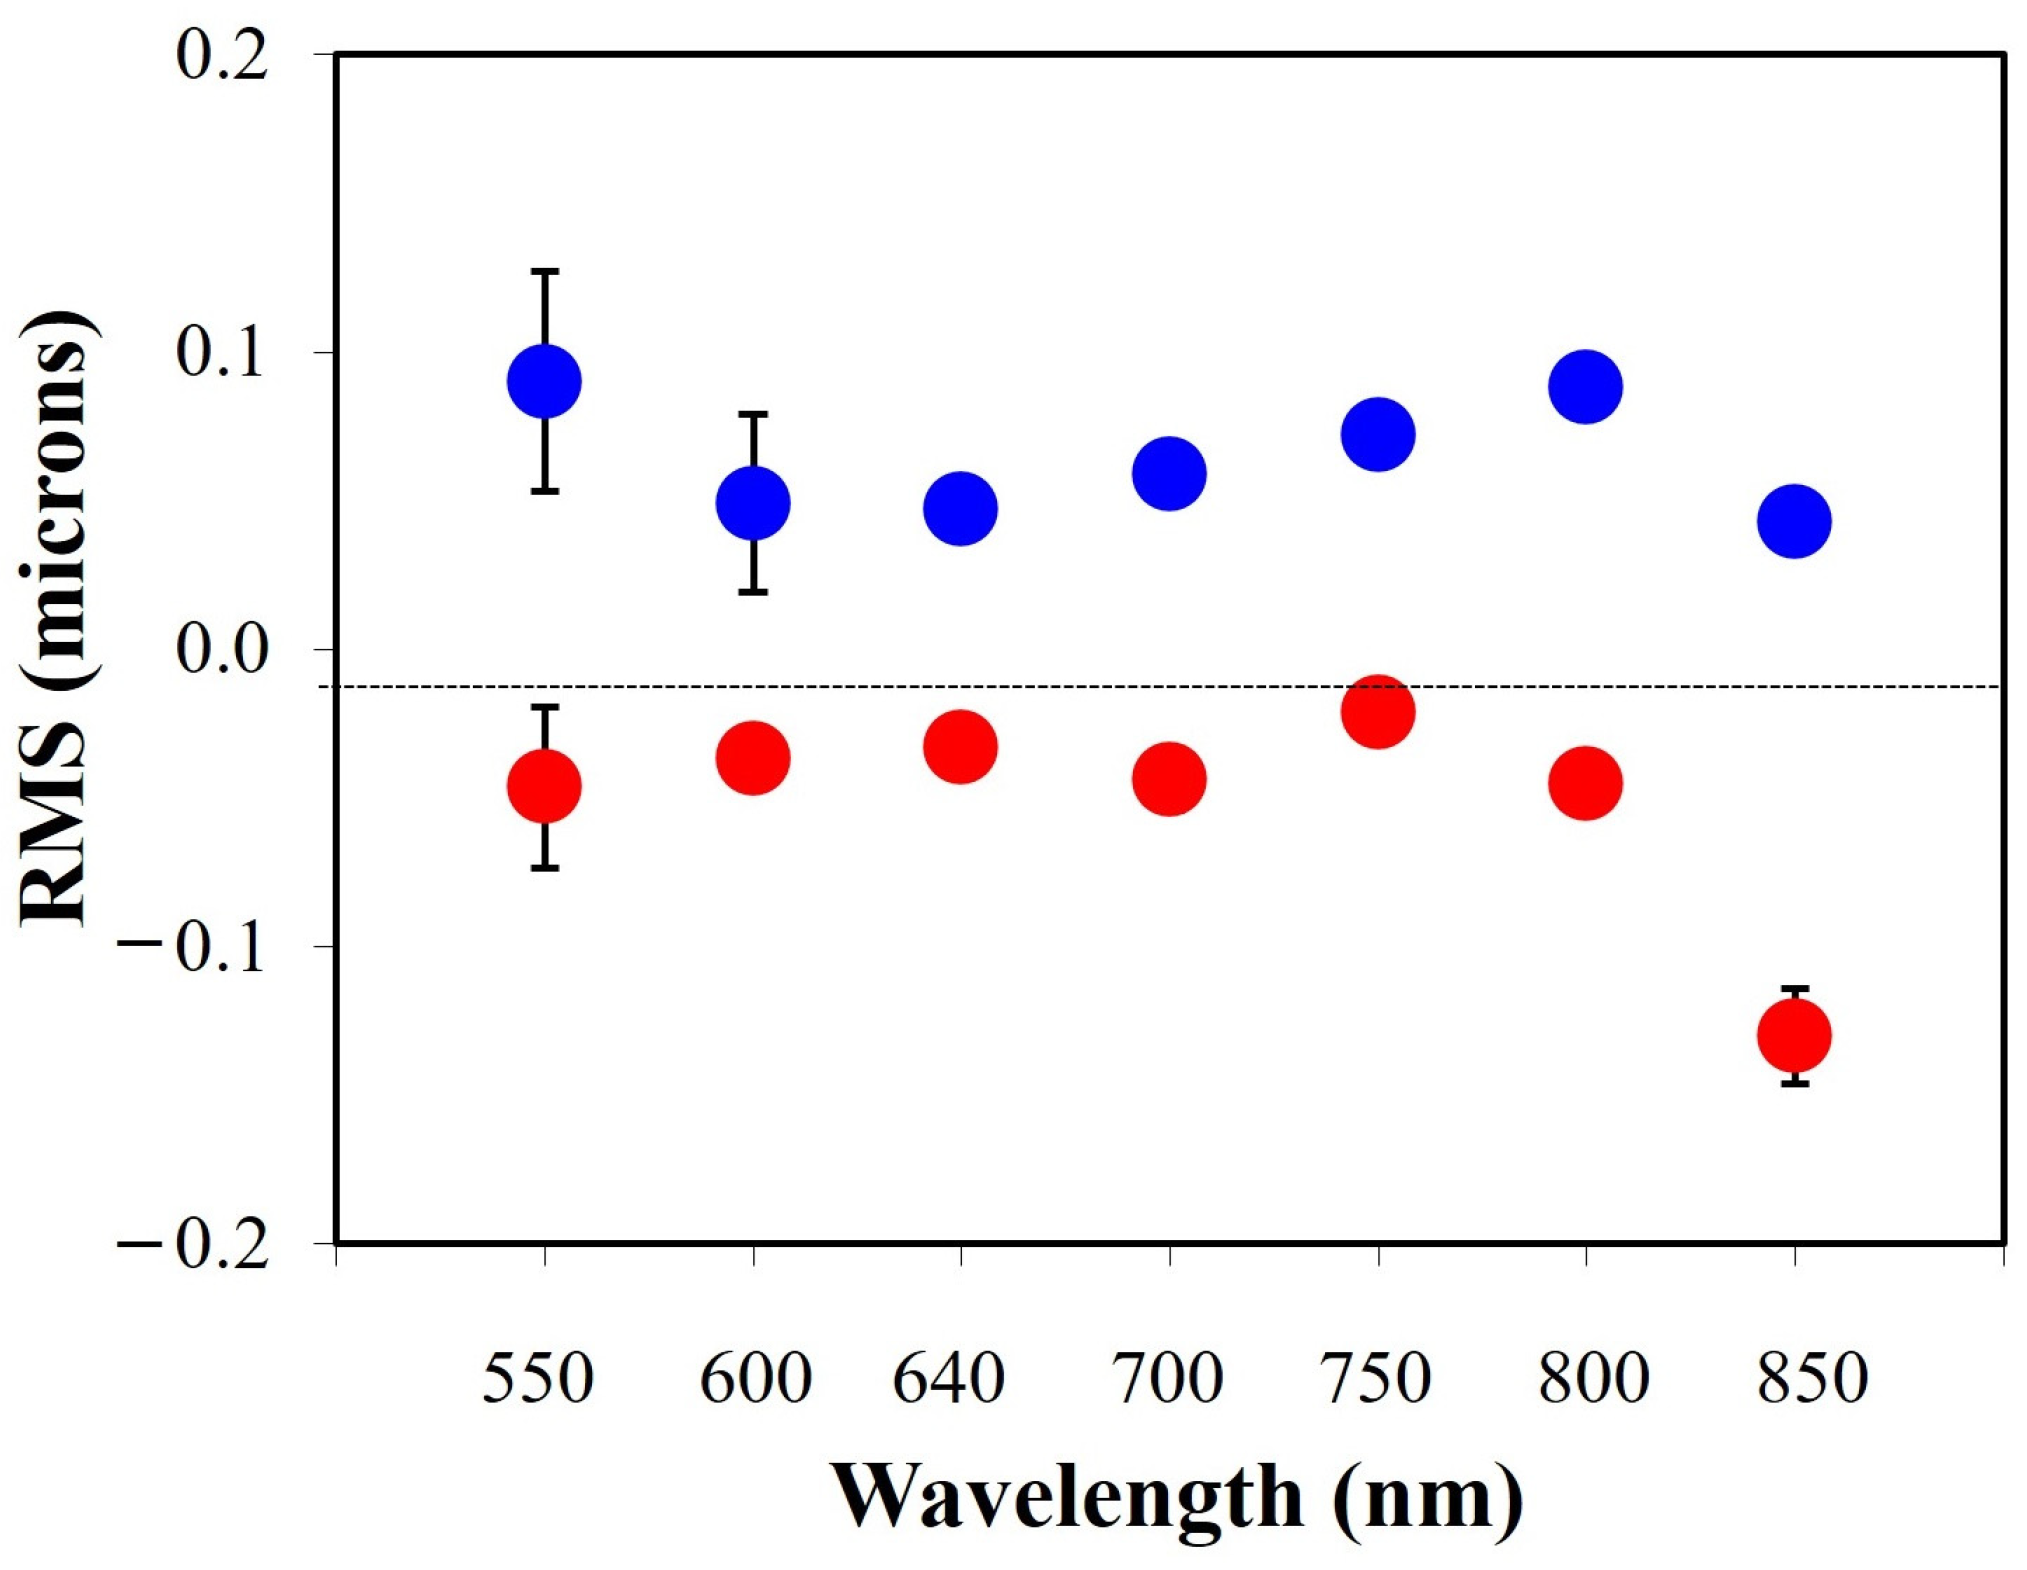
3.2. Wavefront vs. Wavelength

Once the WA temporal stability of the laser beam was confirmed, we proceeded to choose the wavelengths produced by the OPO. These were sequentially selected by changing the OPO settings as indicated by the fabricant. The HS sensor was set to operate at 25 fps. For each selected wavelength a set of individual HS images were recorded during 1 s and the WAs calculated. From these, the average WA for every wavelength was then computed.
To illustrate the spectral variations in the WA, Figure 5 presents the color-coded WA maps for each wavelength, excluding defocus. Using this representation, it is easy to observe that differences in WAs for wavelengths in the range of 600–800 nm are hardly noticeable. However, for 550 and 850 nm these present higher RMS values (see insets in Figure 5). For the sense of completeness, some associated PSFs are shown in Figure 6. A visual analysis confirms that PSFs for 550 and 850 nm are more extended than those corresponding to the rest of the wavelengths.
These differences found for 550 and 850 nm are mainly due to astigmatism contribution. To make this fact apparent, Figure 7 compares the values of astigmatism (i.e., RMS for Z2−2 and Z2+2; in blue) with the total RMS values (in red, see also Figure 5) for all wavelengths used herein. Whereas for intermediate wavelengths, the value of astigmatism is fairly constant (~0.06 μm on average), this increases up to 0.13 μm for 850 nm and 0.23 μm for 550 nm. These represent an increase of 2× and 3×, respectively. The actual numerical values of Figure 7 are shown in Table 1.
In order to show these results more qualitatively, the behavior of other individual Zernike terms was also analyzed. In particular, Figure 8 depicts the chromatic dependence of coma (i.e., RMS for Z3−1 and Z3+1) and the fourth-order spherical aberration (Z40).
Spherical aberration remains basically constant (~−0.04 μm on average) for all wavelengths except for 850 nm, where the value presents a 3× increase (up to −0.13 μm). Coma presents maximum and minimum values at 550 and 850 nm, respectively, with a moderate increase across intermediate wavelengths.

4. Discussion

One of the most extended procedures to generate a pulsed laser beam in the visible spectrum is the use of OPOs, seeded by NIR solid-state lasers with high spatial coherence [17]. OPO light emission is based on optical gain from parametric amplification in a nonlinear crystal, rather than from the stimulated emission of radiation within a cavity. Although the first experimental demonstration was reported in 1965 [21], its impact and applications started during the 1990s.
OPOs have the possibility of wide range tuning, which is based on efficient phase-matching conditions of the signal and idler wavelengths. However, depending on the part of the spectrum chosen, the device tuning operation could require internal and/or external modifications that might change the physical parameters of the emitted laser beam.
Since the characterization of this type of fs laser beams is an important component of ultrafast technology, our attention herein was centered on the changes suffered by the WA of the OPO laser beam when tuning the wavelength emission. The assessment of the WA laser beam provided by a commercially available OPO for seven different wavelengths in the visible–NIR range has been demonstrated. Measurements were performed using an HS sensor placed at the output of the device.
The results show that the WA laser beam was quite stable over time. Variations in total RMS did not differ significantly between the two temporal scales analyzed herein (~1%). This WA temporal stability is not surprising, since it was also reported on Ti:sapphire NIR lasers [18,22]. However, to the best of our knowledge a WA analysis for an OPO laser beam as a function of the wavelength, like the one presented in this work, is lacking in the literature.
When measuring the WA spectral dependence, for each wavelength the highest contribution to the total RMS wavefront error corresponds to the second-order astigmatism. Defocus was excluded from our study since for imaging techniques it can be corrected by adjusting the microscope objective. Astigmatism weight clearly depends on the wavelength, being 80 and 60% for 550 and 850 nm, respectively, but it is fairly constant for the wavelengths in between (about 45%). This different behavior for those two wavelengths occurs also for another asymmetric aberration such as third-order coma, where it takes a maximum value at 550 nm and a minimum at 850 nm. Unlike astigmatism, coma does not keep constant across intermediate wavelengths. On the other hand, no spectral variations on spherical aberration were found for the OPO laser beam in the wavelength range analyzed here, except for 850 nm (three-fold compared to the rest).
HS sensors have been used in the past to characterize WAs of both monochromatic [18,22,23] and broad-band high-power laser beams [24,25,26]. In the former, second-order aberrations (i.e., astigmatism and defocus) were shown to be the dominant terms. For the latter, not many data on individual Zernike terms have been found, although Schäfer et al. reported that the defocus term (via full spectrum measurement) was several orders of magnitude higher than coma and spherical aberration [25].
Nowadays OPOs are very helpful in many diverse areas. In quantum physics they are used to generate squeezed coherent states and entangled states of light [27,28]. A widely tunable frequency comb generator based on an OPO has been recently reported for applications in nanophotonics [29]. High-resolution laser spectroscopy often needs variable narrow-linewidth sources to measure hyperfine structures, and atomic isotope shifts in nuclear physics experiments [30], or to explore absorption properties of tissues as a function of wavelength [31,32].
OPOs probably represent one of the most useful illumination sources in biomedicine. Since tissue-induced aberrations limit the performance of (single- and multiphoton) imaging systems [33,34], imaging neurons from deeper layers is one of the actual challenges in neuroscience [34,35]. Aberrations can be corrected with adaptive optics in real-time experiments, then laser beam WA aberration assessment is the first step to be accomplished before correction. Different adaptive elements have been used to correct for individual Zernike terms, what leads to both image quality enhancement and penetration depth increase [33,34,35,36].
Fluorescence lifetime experiments are based on the determination of the local spatial distribution of fluorescence decay and utilize this property as imaging contrast to constitute a pixel-by-pixel image of the sample under analysis [12]. The assessment and control of the illumination laser beam WA helps to enhance the signal-to-noise ratio of the fluorescent emission, improves the precision of lifetime analysis, and reduces illumination light levels (very critical in living biological tissue measurements) [13,37].
Multispectral imaging and multicolor excitation autofluorescence capture image data at multiple specific wavelengths (typically ranging from ultraviolet to NIR) [8,38,39]. Nowadays it is being used for early screening cancer diagnosis (to differentiate tumor cellular details from surrounding areas based on spectral fluorescence) [9]. Other clinically oriented applications involving narrow spectral bands might also benefit from WA characterization and compensation [40].
On the other hand, the results presented in this work will be relevant for material micromachining and IRIS procedures. These processes have been reported to be feasible in both visible and NIR light [14,15,16,41,42,43,44]. Since the efficacy for pattern inscription is limited by the mechanical rupture of the surrounding material, WA measurement and potential correction are valuable tools, providing enhanced functionality and flexibility. It is possible to correct for the aberrations introduced when focusing the beam inside the workpiece or the biological tissue and tailor the focal spot for a particular fabrication task or writing pattern, and/or reduce processing times.
In ocular laser correction procedures, refractive changes have been correlated with spherical aberration [45]. The combination of a deformable mirror and an appropriate algorithm was used to optimize ablation feature dimensions in the surface of a chromium-on-glass sample [46] and deep inside a multilayer optical data storage medium [47]. Moreover, complex machining shapes were also obtained through both deformable mirrors and spatial light modulators and different laser pulse durations [48]. The latest developments on adaptive laser processing have been recently reviewed [49]. Also, in that sense, but centered on biological environments, accuracy in the stimulation processes involved in optogenetics experiments will improve light delivery into tissues and cell targeting [8,50,51,52,53].

5. Conclusions

At present, OPOs are well-established devices for achieving fs laser output in a wide spectral range. Our results show that the OPO laser beam is optically away from diffraction-limited conditions. Individual aberration terms depend on the pre-defined wavelength, astigmatism being the dominant contribution.
To the best of our knowledge, this is the first attempt to assess the WA of an OPO laser beam as a function of wavelength. A beam spatial characterization is the starting point towards producing shaper focal spots, which offers insights for multi-wavelength applications. Due to the ability of OPOs to cover very wide spectral regions, and to deliver outputs with narrow linewidth and high power, different life science fields will profit from the assessment, control, and potential correction of the specific WAs associated to each wavelength.
At this point, our interest is mainly oriented to the subsequent compensation of these laser beam aberrations via adaptive optics devices. These will enhance in vivo imaging microscopy techniques and will be critical for our future experimental implementations into neuroscience and optogenetics applications.
Moreover, intratissue fs laser ablation and micromachining procedures will also benefit from the correction of these WAs. The achievement of an optimized focal spot for a particular wavelength will improve the control of light–matter interaction and increase the accuracy in laser nano-structuring and the resolution of direct laser writing operations.

Funding

This research was partially funded by the Agencia Estatal de Investigación, Spain (grant PID2020-113919RB-I00/AEI/10.13039/501100011033).

Institutional Review Board Statement

Not applicable.

Informed Consent Statement

Not applicable.

Data Availability Statement

Requests for materials should be addressed to the author.

Acknowledgments

The author thanks P. Artal for suggestions and providing some optical elements used in the experiment. P. Prieto is also acknowledged for helpful ideas on the PSF calculation.

Conflicts of Interest

The author declares no conflicts of interest.

References

  1. Helmchen, F.; Denk, W. Deep tissue two-photon microscopy. Nat. Methods 2005, 2, 932–939. [Google Scholar] [CrossRef] [PubMed]
  2. Campagnola, P.J.; Loew, L.M. Second-harmonic imaging microscopy for visualizing biomolecular arrays in cells, tissues, and organisms. Nat. Biotechnol. 2003, 21, 1356–1360. [Google Scholar] [CrossRef]
  3. Squier, J.A.; Müller, M.; Brakenhoff, G.J.; Wilson, K.R. Third-harmonic generation microscopy. Opt. Express 1998, 3, 315–324. [Google Scholar] [CrossRef] [PubMed]
  4. Zipfel, W.R.; Williams, R.M.; Webb, W.W. Nonlinear magic: Multiphoton microscopy in the biosciences. Nat. Biotechnol. 2003, 21, 1369–1377. [Google Scholar] [CrossRef]
  5. Helmchen, F. Two-photon functional imaging of neuronal activity. In In Vivo Optical Imaging of Brain Function, 2nd ed.; Frostig, R.D., Ed.; CRC Press/Taylor & Francis: Boca Raton, FL, USA, 2009; Chapter 2. [Google Scholar]
  6. Mohanty, S.K.; Lakshminarayananan, V. Optical techniques in optogenetics. J. Mod. Opt. 2015, 62, 949–970. [Google Scholar] [CrossRef]
  7. Dzhagalov, I.L.; Melichar, H.J.; Ross, J.O.; Herzmark, P.; Robey, E.A. Two-photon imaging of the immune system. Curr. Protoc. Cytom. 2012, 60, 12–26. [Google Scholar] [CrossRef]
  8. Hao, Q.; Song, Y.; Cao, J.; Liu, H.; Liu, Q.; Li, J.; Luo, Q.; Cheng, Y.; Cui, H.; Liu, L. The development of snapshot multispectral imaging technology based on artificial compound eyes. Electronics 2023, 12, 812. [Google Scholar] [CrossRef]
  9. Hwang, S.; Shin, H.K.; Park, J.M.; Kwon, B.; Kang, M.-G. Classification of dog skin diseases using deep learning with images captured from multispectral imaging device. Mol. Cell Toxicol. 2022, 18, 299–309. [Google Scholar] [CrossRef]
  10. Lin, S.-J.; Wu, R.; Tan, H.-Y.; Lo, W.; Lin, W.-C.; Young, T.-H.; Hsu, C.-J.; Chen, J.-S.; Jee, S.-H.; Dong, C.-Y. Evaluating cutaneous photoaging by use of multiphoton fluorescence and second harmonic. Opt. Lett. 2005, 30, 2275–2277. [Google Scholar] [CrossRef]
  11. Bueno, J.M.; Martínez-Ojeda, R.M.; Pérez-Zabalza, M.; García-Mendívil, L.; Asensio, M.C.; Ordovás, L.; Pueyo, E. Analysis of age-related changes in the left ventricular myocardium with multiphoton microscopy. Biomed. Opt. Express 2024, 15, 3251–3264. [Google Scholar] [CrossRef]
  12. Berezin, M.Y.; Achilefu, S. Fluorescence lifetime measurements and biological imaging. Chem. Rev. 2010, 110, 2641–2684. [Google Scholar] [CrossRef] [PubMed]
  13. Walters, S.; Feeks, J.A.; Huynh, K.T.; Hunter, J.J. Adaptive optics two-photon excited fluorescence lifetime imaging ophthalmoscopy of photoreceptors and retinal pigment epithelium in the living non-human primate eye. Biomed. Opt. Express 2022, 13, 389–407. [Google Scholar] [CrossRef] [PubMed]
  14. Ding, L.; Knox, W.H.; Bühren, J.; Nagy, L.J.; Huxlin, K.R. Intratissue refractive index shaping (IRIS) of the cornea and lens using a low-pulse-energy femtosecond laser oscillator. Investig. Ophthalmol. Vis. Sci. 2008, 49, 5332–5339. [Google Scholar] [CrossRef]
  15. Xu, L.; Knox, W.H.; DeMagistris, M.; Wang, N.; Huxlin, K.R. Noninvasive intratissue refractive index shaping (IRIS) of the cornea with blue femtosecond laser light. Investig. Ophthalmol. Vis. Sci. 2011, 52, 8148–8155. [Google Scholar] [CrossRef]
  16. Gualda, E.J.; de Aldana, J.R.V.; Martínez-García, M.C.; Moreno, P.; Hernández-Toro, J.; Roso, L.; Artal, P.; Bueno, J.M. Femtosecond infrared intrastromal ablation and backscattering-mode adaptive-optics multiphoton microscopy in chicken corneas. Biomed. Opt. Express 2011, 2, 2950–2960. [Google Scholar] [CrossRef]
  17. Savage, N. Optical parametric oscillators. Nat. Photonics 2010, 4, 124–125. [Google Scholar] [CrossRef]
  18. Bueno, J.M.; Vohnsen, B.; Roso, L.; Artal, P. Temporal wavefront stability of an ultrafast high-power laser beam. Appl. Opt. 2009, 48, 770–777. [Google Scholar] [CrossRef]
  19. Thibos, L.N.; Applegate, R.A.; Schwiegerling, J.T.; Webb, R. VSIA Standards Taskforce Members. Vision science and its applications. Standards for reporting the optical aberrations of eyes. J. Refract. Surg. 2002, 18, S652–S660. [Google Scholar] [CrossRef]
  20. Goodman, J. Introduction to Fourier Optics, 3rd ed.; Roberts and Company Publishers: Greenwood Village, CO, USA, 2004. [Google Scholar]
  21. Giordmaine, J.A.; Miller, R.C. Tunable coherent parametric oscillation in LiNbO3 at optical frequencies. Phys. Rev. Lett. 1965, 14, 973. [Google Scholar] [CrossRef]
  22. Akaoka, K.; Harayama, S.; Tei, K.; Maruyama, Y.; Arisawa, T. Close loop wavefront correction of Ti: Sapphire chirped pulse amplification laser beam. In Proceedings of the Solid State Lasers VII, San Jose, CA, USA, 24–30 January 1998; SPIE: St Bellingham, WA, USA, 1998; Volume 3265. [Google Scholar] [CrossRef]
  23. Fourmaux, S.; Payeur, S.; Alexandrov, A.; Serbanescu, C.; Martin, F.; Ozaki, T.; Kudryashov, A.; Kieffer, J.C. Laser beam wavefront correction for ultra high intensities with the 200 TW laser system at the advanced laser light source. Opt. Express 2008, 16, 11987–11994. [Google Scholar] [CrossRef]
  24. Hauri, C.P.; Biegert, J.; Keller, U.; Schaefer, B.; Mann, K.; Marowski, G. Validity of wave-front reconstruction and propagation of ultrabroadband pulses measured with a Hartmann-Shack sensor. Opt. Lett. 2005, 30, 1563–1565. [Google Scholar] [CrossRef] [PubMed]
  25. Schäfer, B.; Mann, K.; Marowsky, G.; Hauri, C.P.; Biegert, J.; Keller, U. Characterization, wavefront reconstruction and propagation of ultra-broadband laser pulses from Hartmann-Shack measurements. In Proceedings of the SPIE 5918, Laser-Generated, Synchrotron, and Other Laboratory X-Ray and EUV Sources, Optics, and Applications II, San Diego, CA, USA, 2–4 August 2005; p. 59180. [Google Scholar] [CrossRef]
  26. Cousin, S.L.; Bueno, J.M.; Forget, N.; Austin, D.R.; Biegert, J. Three-dimensional spatiotemporal pulse characterization with an acousto-optic pulse shaper and a Hartmann–Shack wavefront sensor. Opt. Lett. 2012, 37, 3291–3293. [Google Scholar] [CrossRef] [PubMed]
  27. Wu, L.-A.; Xiao, M.; Kimble, H.J. Squeezed states of light from an optical parametric oscillator. J. Opt. Soc. Am. B 1987, 4, 1465–1475. [Google Scholar] [CrossRef]
  28. Horodecki, R.; Horodecki, P.; Horodecki, M.; Horodecki, K. Quantum entanglement. Rev. Mod. Phys. 2009, 81, 865–942. [Google Scholar] [CrossRef]
  29. Roy, A.; Ledezma, L.; Costa, L.; Gray, R.; Sekine, R.; Guo, Q.; Liu, M.; Briggs, R.M.; Marandi, A. Visible-to-mid-IR tunable frequency comb in nanophotonics. Nat. Commun. 2023, 14, 6549. [Google Scholar] [CrossRef]
  30. Campbell, P.; Moore, I.D.; Pearson, M.R. Laser spectroscopy for nuclear structure physics. Prog. Part. Nucl. Phys. 2016, 86, 127–180. [Google Scholar] [CrossRef]
  31. Holzwarth, R.; Udem, T.; Hänsch, T.W.; Knight, J.C.; Wadsworth, W.J.; Russell, P.S.J. Optical frequency synthesizer for precision spectroscopy. Phys. Rev. Lett. 2000, 85, 2264–2267. [Google Scholar] [CrossRef]
  32. Picqué, N.; Hänsch, T.W. Frequency comb spectroscopy. Nat. Photonics 2019, 13, 146–157. [Google Scholar] [CrossRef]
  33. Booth, M.J. Adaptive optical microscopy: The ongoing quest for a perfect image. Light Sci. Appl. 2014, 3, e165. [Google Scholar] [CrossRef]
  34. Ji, N. Adaptive optical fluorescence microscopy. Nat. Methods 2017, 14, 374–380. [Google Scholar] [CrossRef]
  35. Rodríguez, C.; Ji, N. Adaptive optical microscopy for neurobiology. Curr. Opin. Neurobiol. 2018, 50, 83–91. [Google Scholar] [CrossRef] [PubMed]
  36. Bueno, J.M.; Skorsetz, M.; Bonora, S.; Artal, P. Wavefront correction in two-photon microscopy with a multi-actuator adaptive lens. Opt. Express 2018, 26, 14278–14287. [Google Scholar] [CrossRef] [PubMed]
  37. Yan, W.; Huang, Y.; Wang, L.; Guo, Y.; Li, J.; Zhu, Y.; Yang, Z.; Qu, J. Aberration correction to optimize the performance of two-photon fluorescence microscopy using the genetic algorithm. Microsc. Microanal. 2022, 25, 383–389. [Google Scholar] [CrossRef]
  38. Kao, F.J. The use of optical parametric oscillator for harmonic generation and two-photon UV fluorescence microscopy. Microsc. Res. Tech. 2004, 63, 175–181. [Google Scholar] [CrossRef] [PubMed]
  39. Li, D.; Zheng, W.; Qu, J.Y. Two-photon autofluorescence microscopy of multicolor excitation. Opt. Lett. 2009, 34, 202–204. [Google Scholar] [CrossRef] [PubMed]
  40. Rousset, F.; Ducros, N.; Peyrin, F.; Valentini, G.; D’Andrea, C.; Farina, A. Time-resolved multispectral imaging based on an adaptive single-pixel camera. Opt. Express 2018, 26, 10550–10558. [Google Scholar] [CrossRef]
  41. Wang, J.; Schuele, G.; Palanker, D. Finesse of transparent tissue cutting by ultrafast lasers at various wavelengths. J. Biomed. Opt. 2015, 20, 125004. [Google Scholar] [CrossRef]
  42. Yang, Q.X.; Yu, M.H.; Chen, Z.X.; Ai, S.; Kentsch, U.; Zhou, S.; Jia, Y.; Chen, F.; Liu, H. A novel approach towards robust construction of physical colors on lithium niobate crystal. Opto-Electron. Adv. 2025, 8, 240193. [Google Scholar] [CrossRef]
  43. Niu, P.; Geng, J.; Jiang, Q.; Wang, Y.; Sang, J.; Wang, Z.; Shi, L. Femtosecond laser-induced recrystallized nanotexturing for identity document security with physical unclonable functions. Adv. Sci. 2025, 12, 2411449. [Google Scholar] [CrossRef]
  44. Varlamov, P.; Marx, J.; Elgueta, Y.U.; Ostendorf, A.; Kim, J.-W.; Vavassori, P.; Temnov, V. Femtosecond laser ablation and delamination of functional magnetic multilayers at the nanoscale. Nanomaterials 2024, 14, 1488. [Google Scholar] [CrossRef]
  45. Amigó, A.; Martínez-Sorribes, P.; Recuerda, M. Refractive changes induced by spherical aberration in laser correction procedures: An adaptive optics study. J. Refract. Surg. 2017, 33, 470–474. [Google Scholar] [CrossRef] [PubMed]
  46. Campbell, S.; Triphan, S.M.F.; El-Agmy, R.; Greenaway, A.H.; Reid, D.T. Direct optimization of femtosecond laser ablation using adaptive wavefront shaping. J. Opt. A Pure Appl. Opt. 2007, 9, 1100–1104. [Google Scholar] [CrossRef]
  47. Schwertner, M.; Booth, M.J.; Wilson, T. Adaptive optics for microscopy, optical data storage, and micromachining. In Proceedings of the SPIE 6306, Advanced Wavefront Control: Methods, Devices, and Applications IV, San Diego, CA, USA, 14–15 August 2006; p. 63060A. [Google Scholar] [CrossRef]
  48. Parry, J.; Beck, R.J.; Weston, N.; Shephard, J.; Hand, D. Application of adaptive optics to laser micromachining. In ICALEO 2010—Congress Proceedings 103, Proceedings of the 29th International Congress on Applications of Lasers and Electro-Optics, Anaheim, CA, USA, 26–30 September 2010; AIP Publishing: Melville, NY, USA, 2010; pp. 767–776. [Google Scholar] [CrossRef]
  49. Salter, P.S.; Booth, M.J. Adaptive optics in laser processing. Light Sci. Appl. 2019, 8, 110. [Google Scholar] [CrossRef] [PubMed]
  50. Shoham, S. Optogenetics meets optical wavefront sensing. Nat. Methods 2010, 7, 798–799. [Google Scholar] [CrossRef]
  51. Deisseroth, K. Optogenetics. Nat. Methods 2011, 8, 26–29. [Google Scholar] [CrossRef]
  52. Girkin, J.M.; Buckley, C.B.; Torres-Carvalho, M.; Young, L.; Rider, S.; Mullins, J.J. Adaptive optis for precise cell ablation in vivo. In Computational Optical Sensing and Imaging; Optica Publishing Group: Washington, DC, USA, 2018; p. JTu5B.3. [Google Scholar] [CrossRef]
  53. Wang, H.; He, H. Optical precise ablation of targeted individual neurons in vivo. ACS Chem. Neurosci. 2025, 16, 374–383. [Google Scholar] [CrossRef] [PubMed]
Figure 1. Layout of the experimental setup used to measure the wavefront aberration of a fs laser beam. M, mirror; OPO, optical parametric oscillator; NDF, neutral density filter; HS, Hartmann– Shack wavefront sensor; MLA, microlens array; AP, aperture.
Photonics 12 00347 g001
Figure 2. WA maps (color-coded, 4 mm pupil) including all Zernike terms from second to fourth order computed from HS images registered at the time points indicated. Insets represent the corresponding RMS values. For direct comparisons, all maps share the same color scale.
Photonics 12 00347 g002
Figure 3. Values of the individual Zernike terms (up to fourth order) averaged during 1 s (red bars) and 1 h (blue bars). Error bars indicate the standard deviation.
Photonics 12 00347 g003
Figure 4. PSFs corresponding to WA maps averaged across 1 s (left) and 1 h (right). These include all Zernike terms shown in Figure 3 but defocus. Images subtend 30 arcmin.
Photonics 12 00347 g004
Figure 5. WA maps (4 mm pupil) for each wavelength excluding defocus. The corresponding RMS values have been included for direct quantitative comparisons. Similar to Figure 2, all maps share the same color scale.
Photonics 12 00347 g005
Figure 6. Examples of PSFs associated to the WAs of the previous figure.
Photonics 12 00347 g006
Figure 7. Total RMS (without defocus; red symbols) and RMS for astigmatism terms (blue symbols) as a function of wavelength. Error bars show the standard deviation.
Photonics 12 00347 g007
Figure 8. Evolution of selected aberrations as a function of wavelength. Blue circles: coma; red circles: fourth-order spherical aberration. The error bars indicate the standard deviation (some of them are smaller than the size of the round dots).
Photonics 12 00347 g008
Table 1. RMS values associated with data from Figure 7.
RMS (μm)550600640700750800850
Total
(no defocus)
0.2870.1410.1430.1540.1460.1470.219
Astigmatism0.2300.0560.0690.0750.0540.0770.134
Disclaimer/Publisher’s Note: The statements, opinions and data contained in all publications are solely those of the individual author(s) and contributor(s) and not of MDPI and/or the editor(s). MDPI and/or the editor(s) disclaim responsibility for any injury to people or property resulting from any ideas, methods, instructions or products referred to in the content.

