Abstract
This study establishes a mathematical model for analyzing pulsed laser target echo signals in non-uniform smoke environments, thereby enabling evaluations of the target echo characteristics of laser detection systems under various smoke conditions. A semi-analytical Monte Carlo method for laser reception is developed by integrating the T-matrix scattering phase function rejection method with the characteristics of the non-uniform smoke environment. The effects of the pulse width, smoke concentration, target reflectance, and target distance on the laser echo signal waveform are studied in detail. The results indicate that when the pulse width is small (τ = 5 ns), the echo signal exhibits a dual-peak profile due to the signals from the backscattered smoke particles and the target echo. Moreover, the smoke concentration significantly affects the amplitude of the backscatter signal. When the pulse width is large (τ ≥ 40 ns), the echo signal peak is a combination of both signals, where the amplitude increases with increasing pulse width but decreases with the increasing smoke concentration. Additionally, the target echo signal amplitude is positively correlated with the target reflectance and negatively correlated with the target distance. The accuracy of the proposed model is verified by comparing the simulation results with the experimental data. Overall, this study provides a theoretical foundation for target identification and detection in smoky environments for laser fuze applications and the analysis of laser detection characteristics in smoky environments.
1. Introduction
Laser fuzes offer several advantages, including a wide detection range, high accuracy, and strong resistance to electromagnetic interference [1,2,3]. However, owing to the inherent limitations of laser detection systems, laser fuzes typically exhibit weak target detection capabilities in environments with rain, fog, or smoke [4,5,6,7]. Echo signals with high signal-to-noise ratios and the backscattering interference from the particulate medium in smoke environments can lead to misjudgments in the detection system, resulting in the false triggering of the fuze and failure to achieve the intended effect on the target [8,9]. Therefore, understanding the characteristics of target echoes in pulsed laser smoke environments has become a key research focus. This would allow weapons systems equipped with laser fuzes to be effective in all-weather, any-time attacks on ground targets, and enhance the detection and recognition abilities of laser fuzes in smoke environments.
Recent advancements have been made regarding the transmission characteristics of lasers in discrete medium environments [10,11]. For example, Wang et al. established a laser fuze detection model for cloud and fog environments and applied it to calculate and analyze the backscattered echo waveform characteristics of pulses under such conditions [5]. Chen et al. and others used the Mie scattering theory and the Monte Carlo method to analyze the impacts of cloud and fog visibility on the echo signals of frequency modulated continuous wave (FMCW) laser detection systems [12]. On the basis of the scattering theory in discrete random media, Guo et al. calculated the absorption and attenuation coefficients of laser pulses, and simulated and analyzed the propagation characteristics of laser pulses in rain environments using the Monte Carlo method. The simulation results were consistent with the experimental data, with a maximum deviation of 7.5% [6]. Song established a multiple scattering model for FMCW laser fuzes in smoke environments and used it to simulate the multipath propagation and scattering of photons [13]. Chen adopted the Mie scattering theory and the Monte Carlo method to develop a backscattering model for pulsed laser fuzes in smoky environments and analyzed the backscattering characteristics of pulsed laser fuzes as a function of the smoke concentration, chimney length, and distance [14]. Wang et al. calculated and analyzed the transmission rate and propagation distance of commonly used 1.06 μm and 10.6 μm lasers in four types of environments (aerosols-dust, water-soluble, marine, and coal smoke) and their relationships with visibility [15]. They also compared the results from the Monte Carlo method with those from single scattering calculations, revealing that the Monte Carlo method performed better for multiple scattering phenomena. Chen et al. modeled the interactions between lasers and aerosols, and analyzed the time-domain characteristics of lidar backscattering. They evaluated the peak intensity, signal delay, and waveform broadening of backscattered echoes based on the extinction coefficient (visibility), scattering coefficient, and absorption coefficient [16]. However, to our knowledge, previous studies on laser transmission characteristics in smoky environments have not considered that real smoky environments are multi-dispersive and non-homogeneous, i.e., smoke particles are not spherical. This has led to discrepancies between calculations and real-world observations. Bao and Xu proposed a combination of T-matrix scattering phase functions and a semi-analytical Monte Carlo approach to investigate the effects of the particle size, particle shape, pulse width, and transmitter–receiver distance of the laser detection system on the backscattering characteristics of smoke in non-homogeneous smoky environments [17,18]. The results confirmed the effectiveness and accuracy of the model.
Research on target echo characteristics in smoke environments also includes the reflection interactions with targets. Guo et al. considered particle dynamic collisions, ray tracing, and laser detection principles to establish a virtual simulation model for FMCW laser transmission. They analyzed the effects of performance differences in laser fuze detector components under smoke interference on the target echo characteristics [19]. Liu et al. and others developed a Monte Carlo simulation model for FMCW laser transmission in environments with smoke interference. The results indicated that smoke backscattering interference generated multiple amplitude peaks in the beat frequency signal spectrum. Furthermore, when the laser wavelength was within the range of 560–1660 nm, the target echo signal had a better signal-to-noise ratio [20]. Bahmeh et al. applied the multiple scattering Monte Carlo method to study a pulsed laser radar’s target and cluster pulsed echo signals into dense cloud clutter (DCC); specifically, they designed a high-pass trapezoidal filter to detect the target signals [21]. To our knowledge, previous studies have all assumed that the smoke particles were spherical, assumed that the smoke environment was homogeneous (i.e., with a fixed extinction coefficient), and simplified the target as a Lambertian object with a constant reflectivity. Therefore, published models require modifications to align with real-world conditions. It is particularly important to establish a pulsed laser target echo signal model suitable for multi-dispersive non-homogeneous smoke environments that can analyze the target echo characteristics under various target and smoke conditions.
The remainder of this report is organized as follows: Section 2 describes the pulsed laser target echo signal model for non-homogeneous smoke environments; Section 3 applies the developed mathematical model for computational simulations to obtain laser target echo waveforms under different conditions and analyzes their variation patterns; Section 4 validates the accuracy of the pulsed laser target echo signal model in non-homogeneous smoke environments based on experimental studies; finally, Section 5 summarizes the conclusions drawn from the results of this study.
2. Target Echo Signal Model of Pulsed Laser in Non-Uniform Smoke Environments
2.1. Mathematical Model of Pulsed Laser Emission
The Monte Carlo method transforms a study of laser transmission into an analysis of photon dynamics by establishing a photon distribution function over time [18]. This function simulates the temporal variation of the laser pulse waveform amplitude by tracking the number of photons over time. The number of photons N(t) emitted by a semiconductor laser at a given time t is expressed in Equation (1) [22],
where N0 is the number of photons corresponding to the peak of the laser pulse, τ is the pulse width, and t′ is the time coordinate at the peak power; the emitted pulse is symmetric about t′.
The initial emission direction of any photon can be expressed according to Equation (2) [18].
The initial emission angle is defined as , where is the divergence angle of the laser beam. The initial azimuthal angle . Here, and are random numbers uniformly distributed over the interval [0, 1].
2.2. Laser Transmission and Scattering Model in Non-Uniform Smoke Environments
2.2.1. Photon Random Walk Model
In reality, the spatial concentration distribution of smoke is non-uniform. Therefore, the smoke medium perpendicular to the laser detection system is divided into n layers. It is assumed that the concentration in the x-0-y cross-section of each layer is uniform, with the extinction coefficient of the ith layer denoted as . The photon’s random walk step length in this layer is . As , i.e., , the relationship between the photon’s random walk step length and the extinction coefficient after each scattering phenomenon can be expressed using Equation (3) [18],
where l is the random walk step length of the photon in the non-uniform medium, and is a random number uniformly distributed over the interval [0, 1]. By incorporating the extinction coefficient calculation formula for the multi-dispersive particle group (Equation (4)) [17],
the random walk step length l of the photon in the non-uniform medium can be calculated.
2.2.2. Photon Coordinate Transformation Model
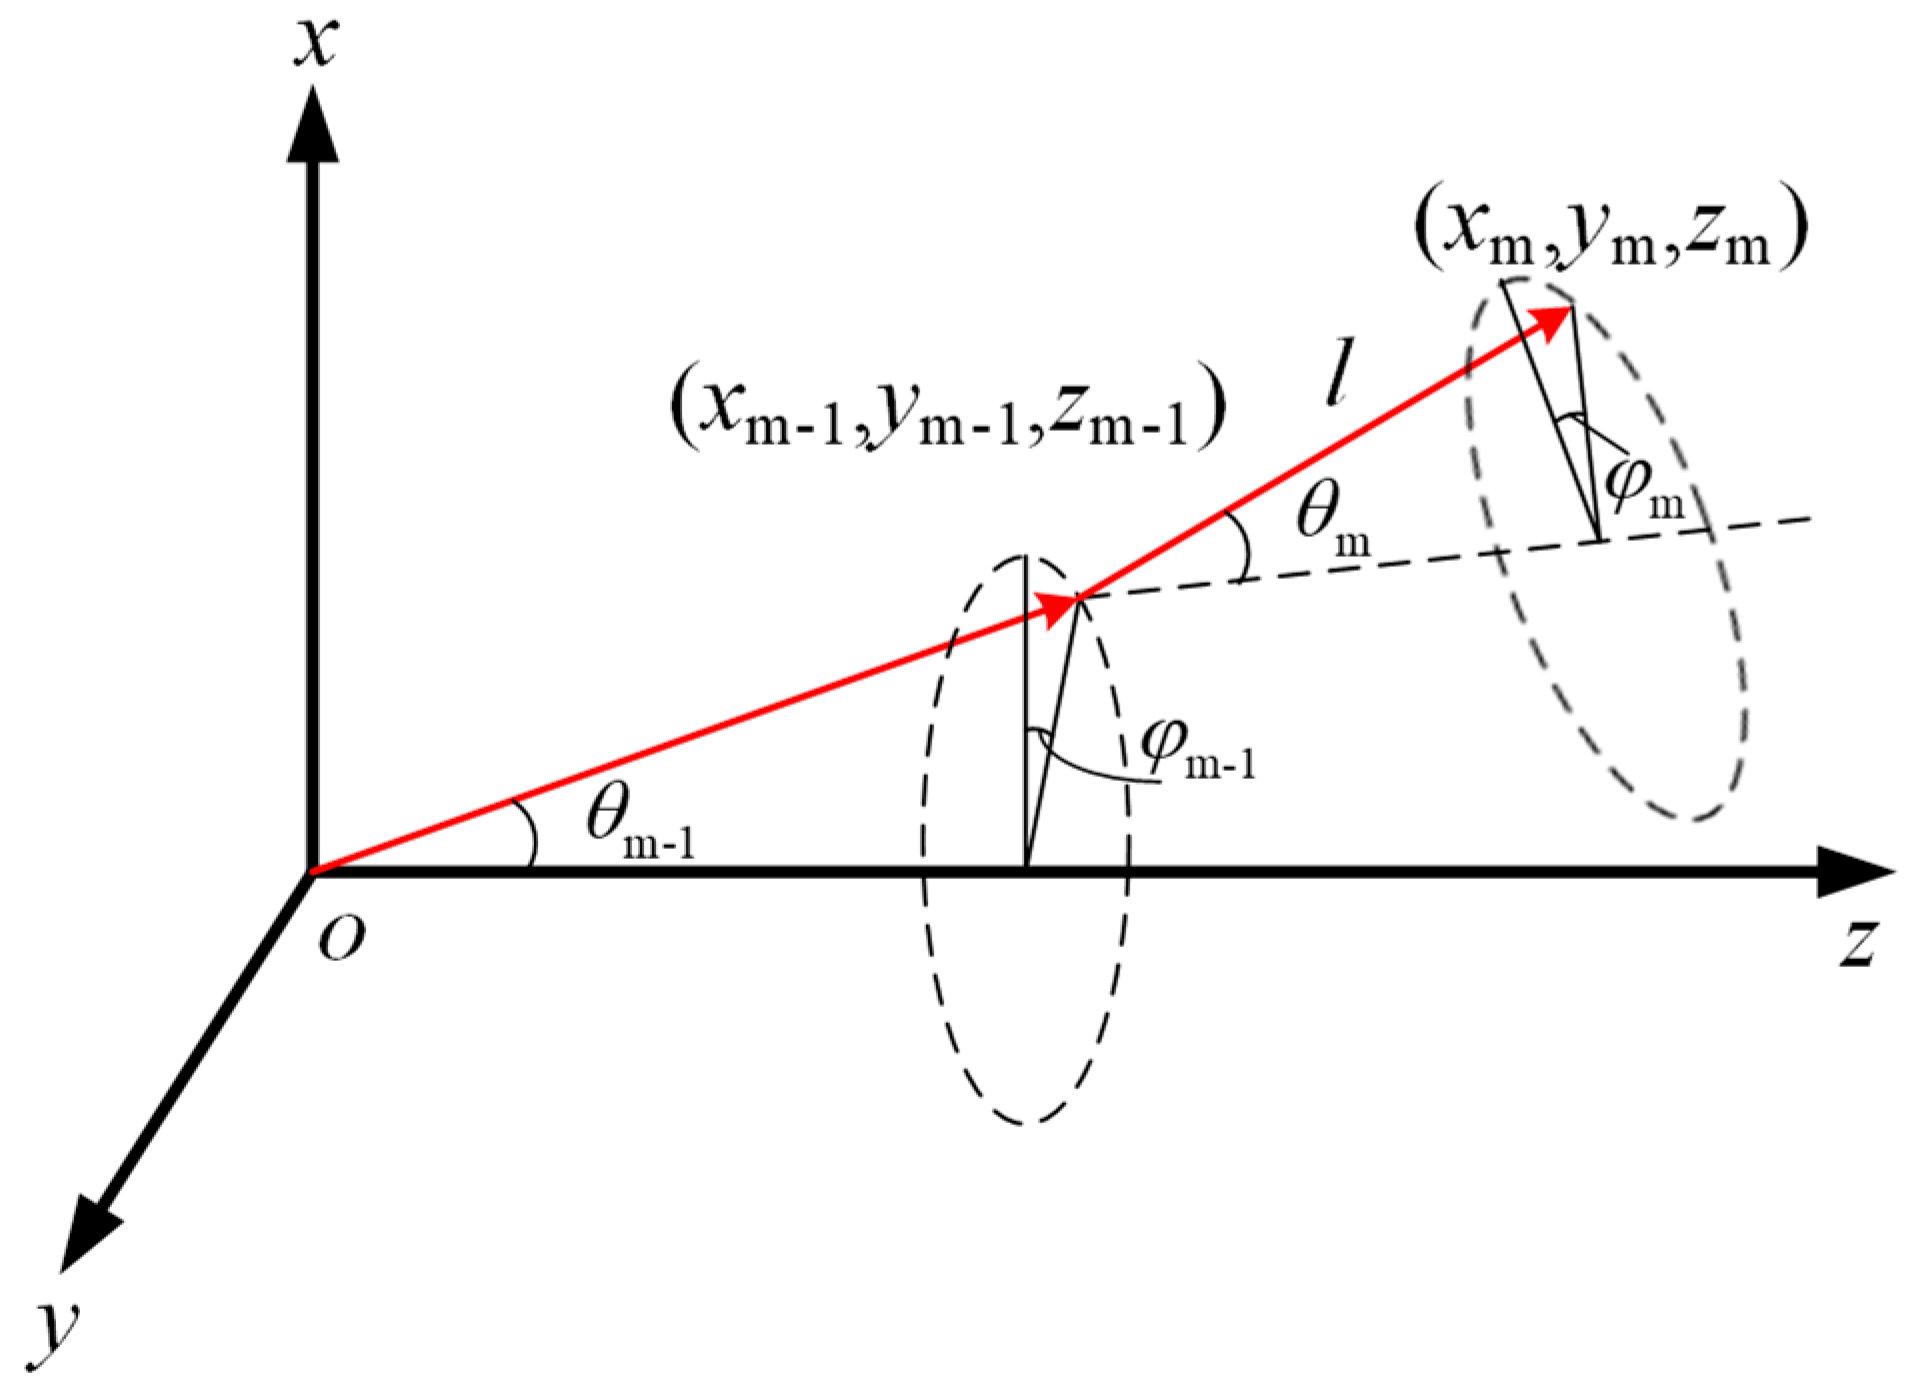
The collisions between photons and particles are illustrated in Figure 1. The mth collision scattering position of a particle is determined by its current scattering position , its current movement direction , and the photon’s random walk step length l. These relationships are expressed in Equation (5) [23],
where ,, and represent the directional cosines of the photon’s linear motion between two collision points. Based on the sampled values of the scattering angle and azimuthal angle after the photon’s mth scattering phenomenon, the new directional cosines of the photon after the collision can be expressed using the coordinate transformation in Equation (6). The scattering angle is obtained by applying the rejection sampling method to the discrete T-matrix scattering phase function [24].
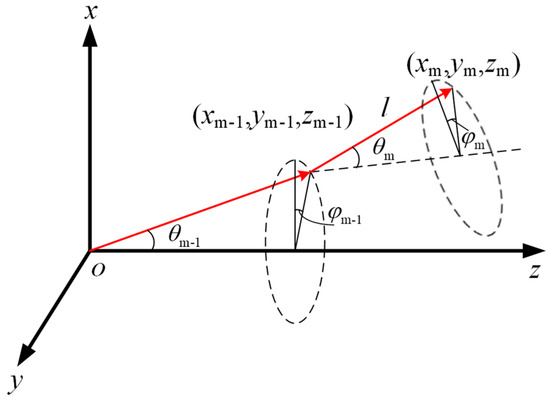
Figure 1.
Photon–particle collision scattering coordinate system.
2.3. Target Laser Reflection Mathematical Model
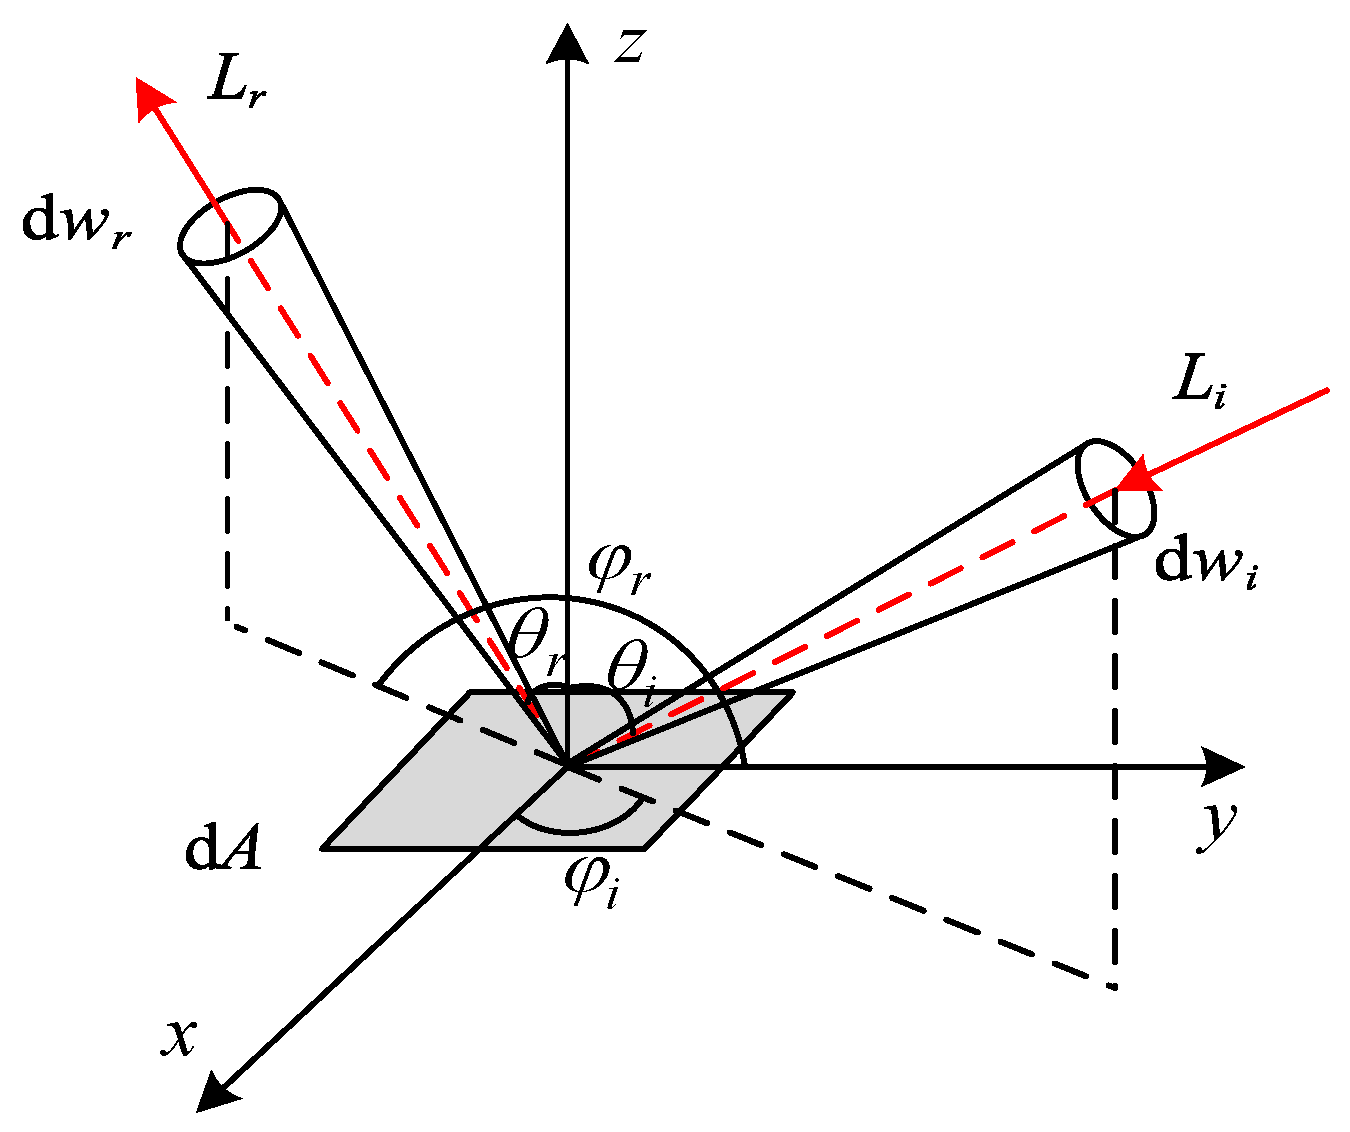
The reflection of pulsed laser light from a target’s surface in close-range detection includes both specular and diffuse reflection. The bidirectional reflectance distribution function (BRDF) describes the changes in radiance due to the reflective properties of the target surface material, and this theory is widely used to address scattering and radiation issues in microwave-, infrared-, and laser-based applications. Figure 2 shows the geometric relationship between the incident and reflection angles on a surface element dA, where and represent the zenith and azimuth angles of the incident light, and and represent the zenith and azimuth angles of the reflected light.
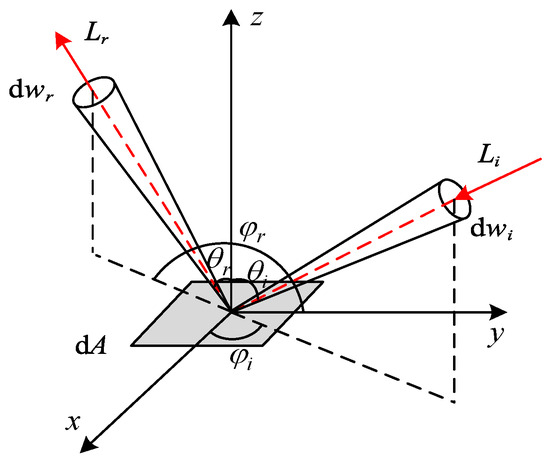
Figure 2.
Geometric relationships among the angles in the BRDF model.
Ground targets, such as armored tanks, land-based buildings, and camouflage nets are coated with low-reflectivity materials, resulting in weak scattering characteristics. Thus, the six-parameter BRDF model is used for more accurate calculations. The specific expression of this model is provided in Equation (7) [25],
where the first term on the right-hand side represents the specular reflection component; the second term represents the diffuse reflection component; and parameters , , b, α, , and c must be determined and are related to the reflective properties of the material surface. These parameters can be obtained through comparative experiments with standard reflective panels. Notably, the reflective characteristics of the isotropic surfaces are independent of the incident azimuth angle.
The collision and reflection processes involving the target during the photon’s random walk are illustrated in Figure 3. The vertical distance between the laser detection system and the target is denoted as . When the sampled coordinate , the photon reaches the target surface first and undergoes a collision. Therefore, the coordinates of the colliding photon must be corrected according to Equation (8) [22],
where are the directional cosines of the photon after the scattering by the particles, just before reaching the target. Equations (9) and (10) present the formulas for calculating the photon’s incident zenith angle and azimuth angle on the target surface, respectively.
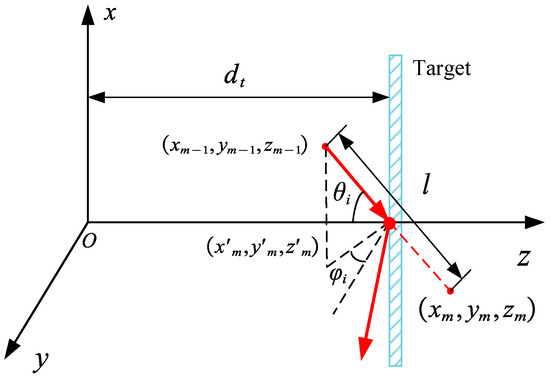
Figure 3.
Coordinate system for photon–target collision scattering.
When the incident light angles are known, the analytical expression of the BRDF model for the target surface can be obtained, and the hemispherical directional reflectance of the target surface can be calculated using Equation (11) [25].
When a photon undergoes diffuse reflection, the reflection azimuth angle is uniformly distributed within the range , thus satisfying , where is a random number uniformly distributed over the interval [0, 1]. Equation (12) presents the probability density function for the photon’s reflection in the zenith angle direction.
An analytical solution for the zenith angle of the reflected photon relative to the target cannot be directly obtained. Therefore, its probability density function is discretized. The reflection zenith angle is divided into n equal intervals within the range , denoted as . The normalized probability density function for the reflection direction corresponding to the ith zenith angle can be expressed using Equation (13) [18].
From the definition of the probability density function, it follows that for a uniformly distributed random number within the interval [0, 1], there exists only one positive integer k within [0, n] that satisfies Equation (14).
Thus, represents the sampled zenith angle of the photon after the reflection from the target. Accordingly, the new directional cosines of the photon after target reflection can be expressed using Equation (15) [5].
2.4. Semi-Analytical Mathematical Model for Laser Reception
To meet the requirements of laser transmission in non-uniform media and to improve the computational efficiency, this study applies an improved semi-analytical Monte Carlo reception method. Specifically, each time a photon collides with a particle, an analytical reception is performed for every photon within the receiver’s field of view to compute the probability of the photon returning directly to the receiver without undergoing any further interactions.
As shown in Figure 4, the photon’s reception pathway is divided into n layers, each with distinct optical properties. Here, q denotes the photon’s scattering position, represents the photon’s scattering direction, and is the angle between the photon’s scattering direction and the line connecting the photon to the center of the receiver’s detection surface. The distance between the centers of the laser emission and reception systems is defined as d0, the emission divergence angle is , and the reception field of view angle is . Additionally, represents the solid angle of reception, where A is the receiver’s detection area, and Rm is the straight-line distance between the photon’s current scattering position and the center of the receiver’s detection surface. Therefore, the overall pathway R of the photon directly reaching the receiver is expressed in Equation (16).
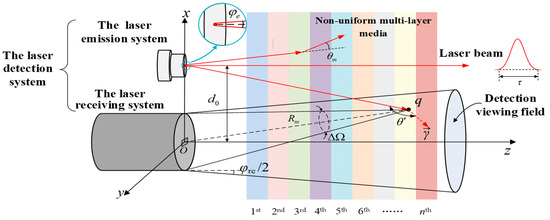
Figure 4.
Semi-analytical reception geometric model for a non-uniform multi-layer medium.
The probability that a photon travels a distance R through multiple layers of the medium without undergoing any collision or absorption is given by Equation (17).
The mathematical expectation of the photon being received is expressed in Equation (18),
where represents the scattering phase function of the multi-dispersed smoke particles and represents the weight of the particle after m collisions.
After one analytical reception, the photon weight is calculated using Equation (19). In the simulation of photon transport, the threshold weight needs to be adjusted to improve the accuracy and reliability of the simulation. While remains above , the photon continues to move in its original scattering direction.
A Cartesian coordinate system, as shown in Figure 4, is established to describe the laser transmission process in a non-uniform smoke environment. In this system, both the laser emission and reception systems are placed on the same side, with their axes parallel to one another. For computational convenience, the center of the laser receiver’s detection surface is set as the origin of the coordinate system, where the line connecting the laser receiver system and the emission system serves as the x-axis, and the direction of the laser beam emission is along the z-axis.
The backscattered echo waveform of the target received by the laser detection system can be obtained by statistically analyzing the total transmission distance of each photon received in the smoke environment.
3. Simulations of Laser Echo Signals from Targets in Smoke Environments
3.1. Simulation Conditions and Parameter Settings
Based on the commonly used hardware design parameters for laser detection systems, the following settings were used in this study: laser beam divergence angle = 73 mrad; laser wavelength = 905 nm; pulse width = 5, 10, 20, 50, 60, 80, or 100 ns; laser receiver system’s field of view angle = 19.6 mrad; receiver optical system radius = 12.5 mm; and axial distance (transmitter-receiver spacing) between the laser emission and reception systems = 40.0 mm. The thickness of the smoky area is 12 m, and the smoke concentration at the position of the laser detection system is w(0). The smoke concentration at each position along the laser path satisfies Equation (20) [17],
where z represents the distance between any point within the smoke environment and the testing plane (x-0-y) of the laser detection system (as shown in Figure 4).
The typical ellipsoidal shape of the smoke particles was selected, with an aspect ratio of . The complex refractive index of the particles is mr = 1.52 + 0.008 i, and the particle size range is 0.01–50 μm. The particle size distribution is assumed to follow a logarithmic normal distribution [18], and the maximum, minimum, and average particle sizes are 229.075 μm, 3.905 μm, and 57.460 μm, respectively. A standard reflection plate is used as the target plate (dimensions = 0.5 m × 0.5 m), and the distance from the laser detection system to the target is = 4, 6, 8, or 10 m. The standard reflectance is = 0.2, 0.4, 0.6, or 0.8. The parameters are summarized in Table 1.

Table 1.
Simulation parameter settings.
3.2. Simulations of Echo Signals Under Different Smoke Concentrations
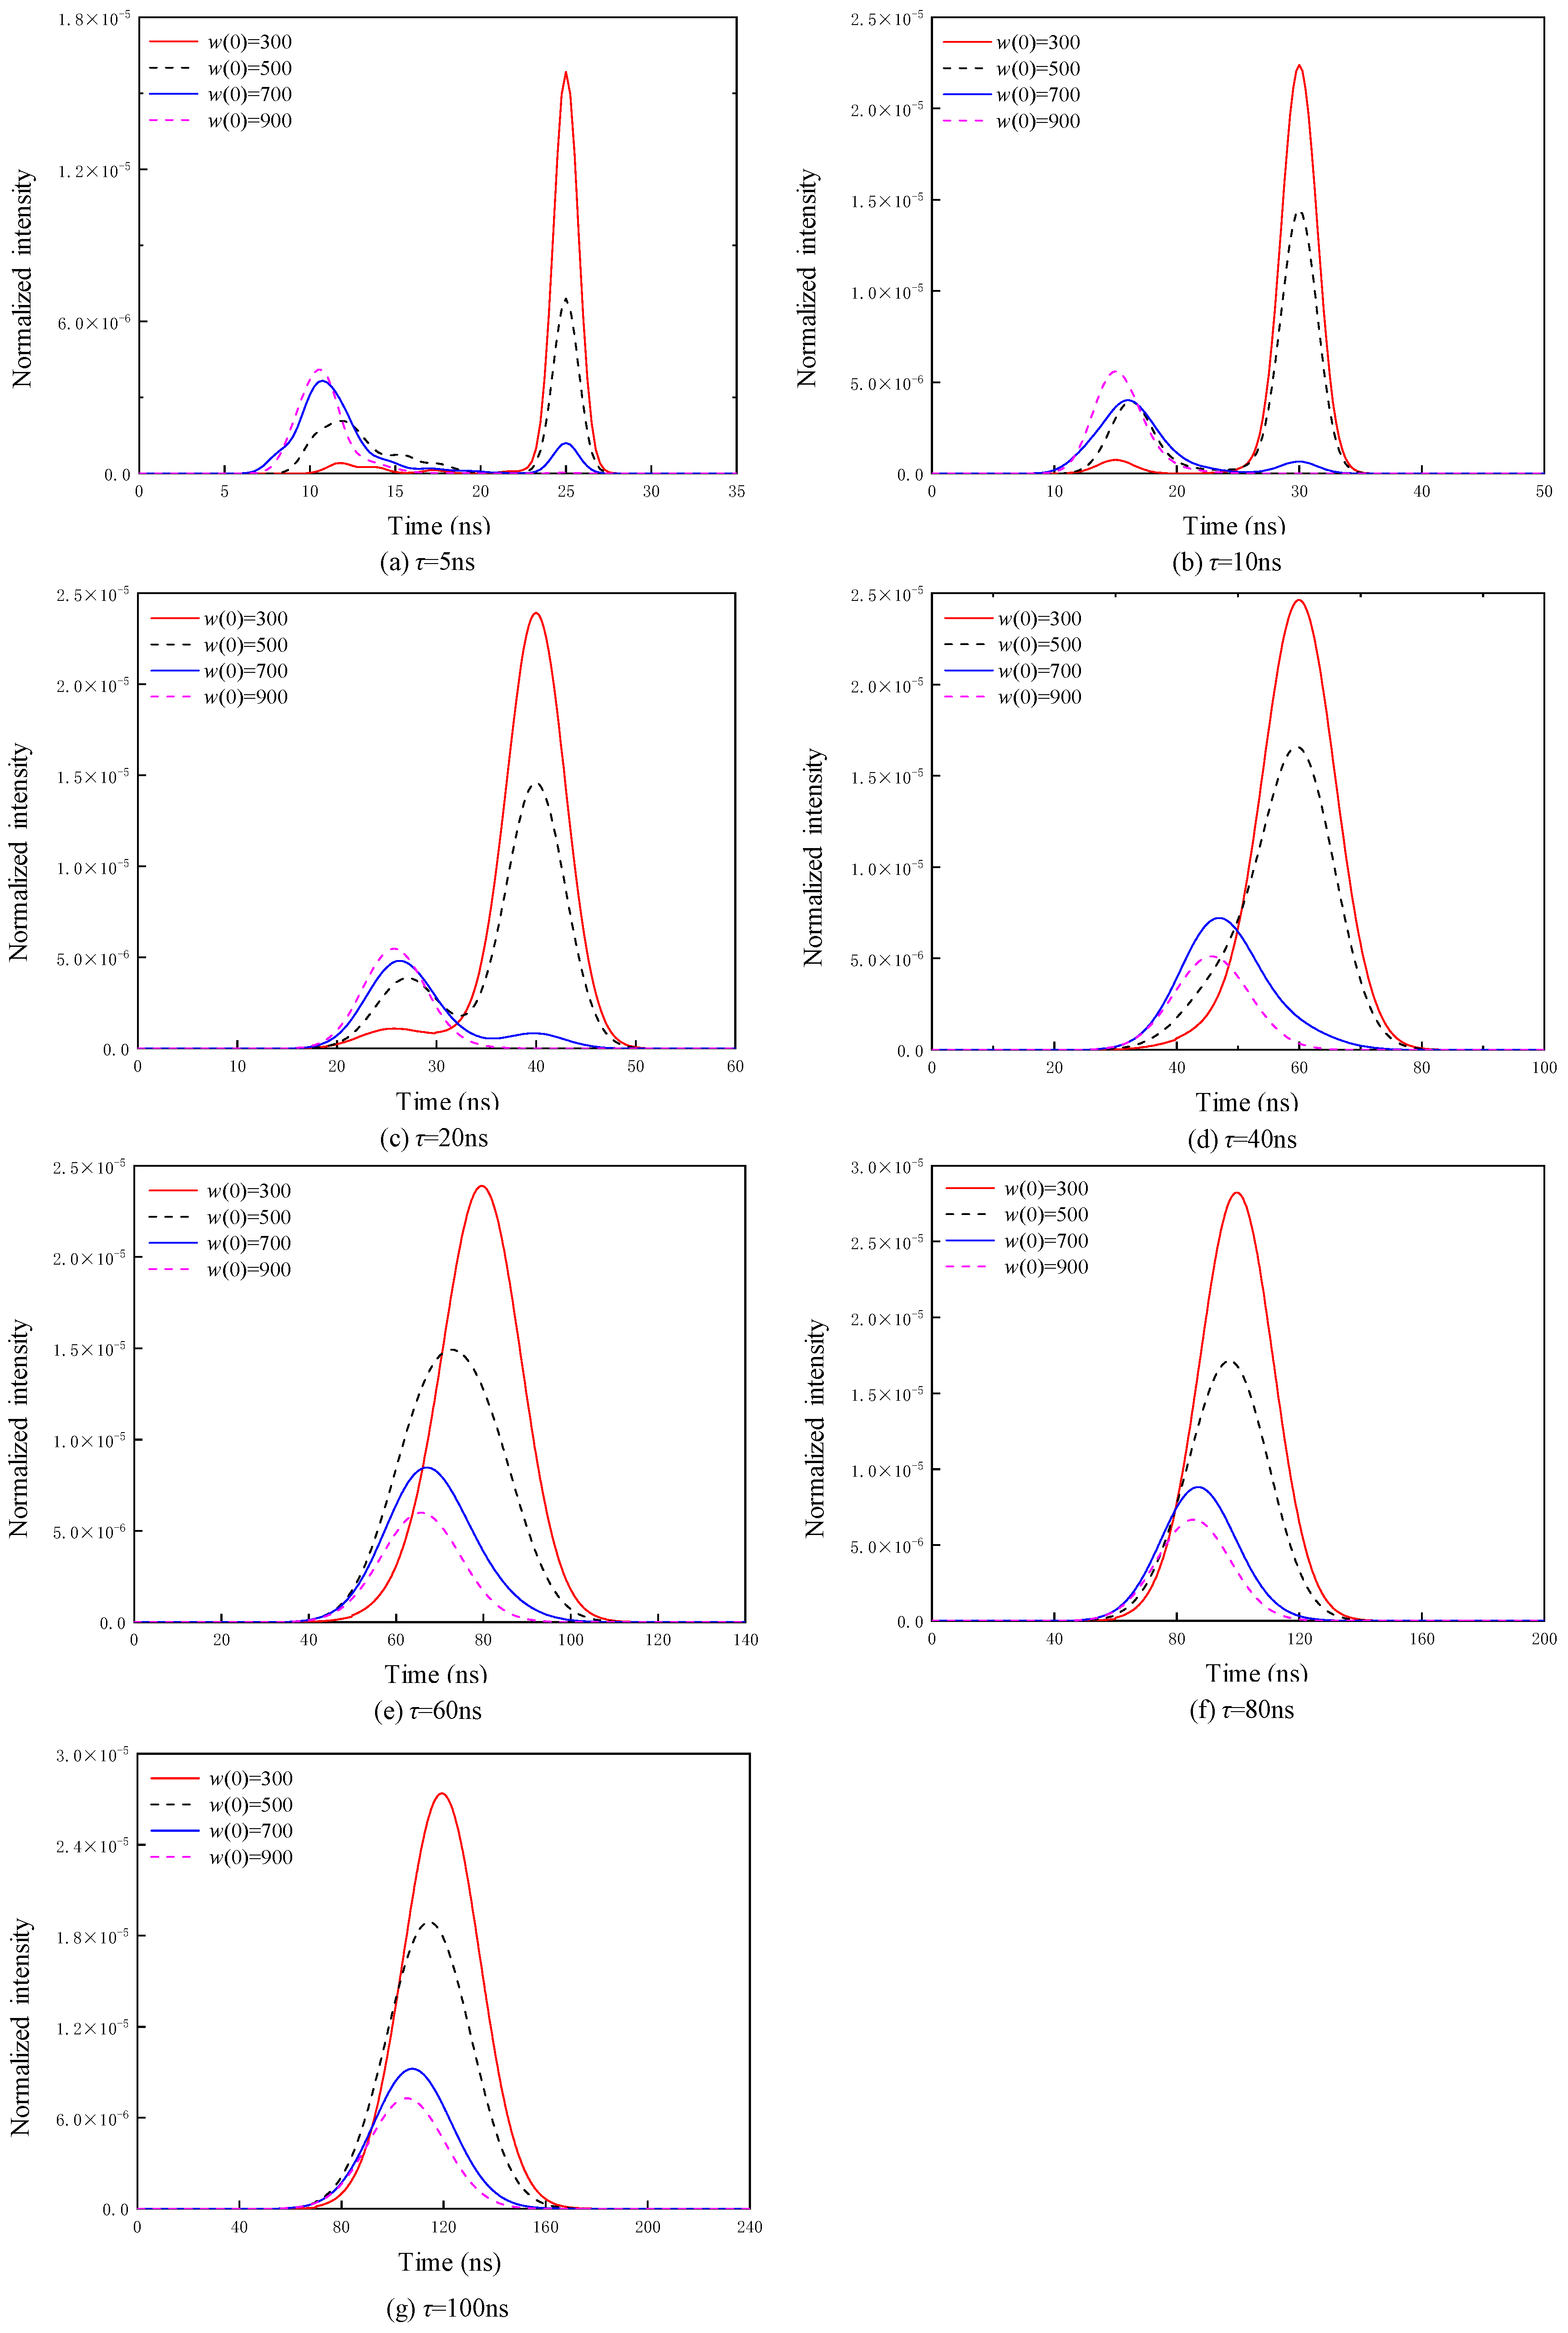
Figure 5 shows the backscattered smoke and target echo signals under various pulse widths when the target distance is = 6 m, reflectivity is = 0.6, and smoke concentration at the laser detection system position is w(0) = 300, 500, 700, and 900 mg/m3. The horizontal axis at t = 0 denotes the moment of the pulsed laser emission signal, and the vertical axis indicates the normalized echo signal intensity based on the peak power of the laser emission. This intensity is expressed as the ratio of the number of photons received at different moments to the maximum number of photons N0 emitted by the laser.
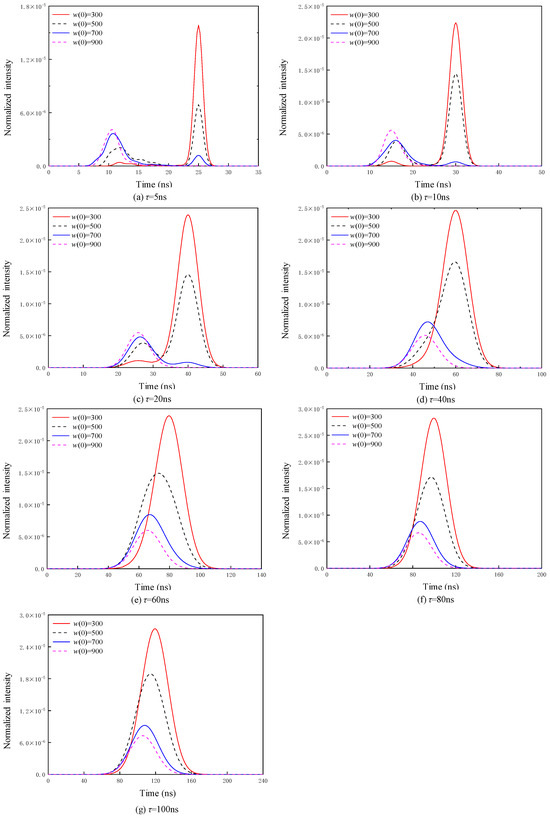
Figure 5.
Target and smoke backscattered echo signals under different smoke concentration conditions.
Figure 5a presents the backscattered smoke and target echo signals when the laser detection system emits a pulse width of = 5 ns under different smoke concentrations w(0) in the detection system (300, 500, 700, and 900 mg/m3); the peak echo intensities are 1.58464 × 10⁻⁵, 6.89165 × 10⁻⁶, 3.65712 × 10⁻⁶, and 4.10655 × 10⁻⁶, respectively.
In the time domain, the echo curves for w(0) = 300, 500, and 700 clearly exhibit two peaks of different amplitudes. These peaks at approximately t = 11 and 25 ns correspond to the backscattered smoke echo signal and the target echo signal, respectively. As the smoke concentration increases, the intensity of the backscattered signal increases, and the rise rate becomes steeper. In contrast, the intensity of the target echo signal decreases at higher smoke concentrations. Because the target distance remains constant, the time associated with the target echo peak does not change. For w(0) = 900 , only the first peak, which corresponds to the backscattered smoke echo, is observed. This is because the high smoke concentration significantly enhances the backscattering, thereby preventing photons from penetrating the smoke or reducing their weight below the detection limit of the photodetector. As a result, no target echo signal is detected under such high smoke concentrations.
Figure 5b,c shows the backscattered smoke and target echo signals for pulse widths of = 10 and 20 ns, respectively, under various smoke concentrations w(0) in the laser detection system. The overall trends and results are consistent with those for = 5 ns. Specifically, when w(0) 700 , the echo signals include both the backscattered smoke signal and the target signal, which are temporally independent. The intensity of the backscattered smoke signal is positively correlated with the smoke concentration, whereas the intensity of the target signal is negatively correlated with the smoke concentration. At w(0) = 900 , the echo profile contains only the backscattered smoke signal, which is more intense than at other smoke concentrations.
Figure 5d–g shows the backscattered smoke and target echo signals for pulse widths of = 40, 60, 80, and 100 ns, respectively, under different smoke concentrations w(0) in the laser detection system.
When the pulse width 40 ns, the echo signal contains a single peak. In these cases, the received echo is a superposition of the backscattered smoke signal and the target signal, owing to the broad pulse widths. This enhances the echo signal intensity, which increases with the increasing pulse width and decreases with the increasing smoke concentration.
3.3. Simulations of Echo SignaLs Under Different Target Distances
Figure 6 presents the backscattered smoke and target echo signals under various pulse widths, with a reflectivity of = 0.6, a smoke concentration at the laser detection system location of w(0) = 500 , and target distances of = 4, 6, 8, and 10 m.
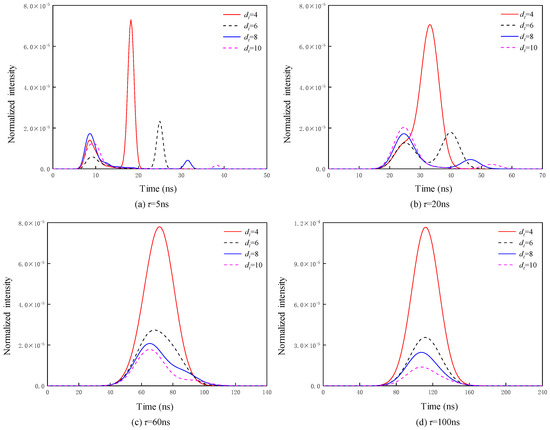
Figure 6.
Target and smoke backscattered echo signals under different target distance conditions.
Figure 6a shows the backscattered smoke and target echo signals for a laser pulse width of = 5 ns for various target distances. In the time domain, all four echo curves corresponding to different target distances contain two distinct peaks of varying amplitudes. The first peak represents the backscattered signal from smoke particles, exhibiting temporal consistency across all the target distances and a negligible effect of the target distance on the signal intensity. The second peak corresponds to the target echo signal, where the occurrence shifts later and the intensity decreases as the target distance increases.
Figure 6b shows the backscattered smoke and target echo signals for different target distances when the laser detection system emits a pulse with a duration of = 20 ns. The waveform trends corresponding to target distances of = 6, 8, and 10 m are consistent with those in Figure 6a. However, for the target distance of 4 m, there is an overlap between the backscattered smoke echo and the target echo in the time domain. This leads to an increase in the amplitude and an extended pulse width compared with the = 5 ns echo signal.
Figure 6c,d shows the target and smoke backscattered echo signals for different target distances when the laser detection system emits pulses with durations of = 60 and 100 ns, respectively. Consistent with the conclusion presented in Section 3.2, when the pulse width is 40 ns, the received echo signal contains a single peak. Under the conditions of = 60 and 100 ns, the received echo is a combination of the backscattered smoke echo and the target echo. The amplitude of the echo signal is inversely related to the target distance, i.e., the farther the target, the lower the echo signal intensity. Unlike with shorter pulse durations, the echo signal does not shift appreciably in terms of the timing with the increasing target distance. When all the other parameters remain constant, the echo signal amplitude increases as the pulse width increases.
3.4. Simulations of Echo Signals Under Different Target Reflectivities
Figure 7 shows the target and smoke backscattered echo signals under various pulse widths, with a target distance of = 6 m, a smoke concentration of w(0) = 500 , and standard reflectivities of = 0.2, 0.4, 0.6, and 0.8.
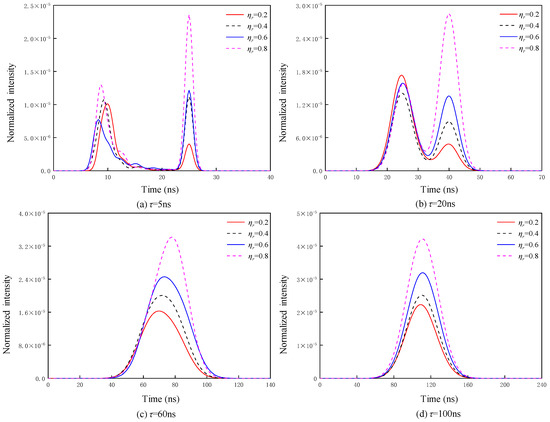
Figure 7.
Target and smoke backscattered echo signals under different target reflectance conditions.
Figure 7a shows the target and smoke backscattered echo signals under different target reflectivity conditions with a laser pulse width of = 5 ns. In the time domain, the four echo curves for target reflectivities of = 0.2, 0.4, 0.6, and 0.8 contain two peaks with different amplitudes. The first peak represents the smoke particle backscattered echo, which is consistent within the time domain, and there is no clear relationship between the amplitude of this waveform and the target reflectivity. The second peak represents the target echo signal, and the target echo intensity is positively correlated with the target reflectivity. In general, the smoke backscattered echo amplitude Ps and the target echo amplitude Pt for target reflectivities of = 0.2, 0.4, 0.6, and 0.8 conform to the relationships Ps > Pt, Ps ≈ Pt, Ps < Pt, and Ps ≪ Pt, respectively. Thus, the target reflectivity has a significant effect on the target echo signal strength.
Figure 7b shows the target and smoke backscattered echo signals under different target reflectivity conditions with a laser pulse width of = 20 ns. Similar to the waveforms in Figure 7a for a pulse width of = 5 ns, the echo waveform at the larger pulse width contains two peaks with different amplitudes. The intensity of the smoke backscattered echo shows no clear relationship with the target reflectivity, whereas the target echo signal amplitude increases with the increasing target reflectivity and approaches (or exceeds) that of the smoke backscattered echo signal.
Figure 7c,d presents the target and smoke backscattered echo signals under different target reflectivity conditions with laser pulse widths of = 60 and 100 ns, respectively. When the pulse width is larger, the smoke particle backscattered echo overlaps with that of the target, resulting in a waveform amplitude superposition and the appearance of one intense peak. The amplitude of the echo signal increases with the increasing target reflectivity, and under the combined effects of smoke particle scattering and target reflection, the peak echo timing shifts later as the target reflectivity increases.
4. Experimental Validation
4.1. Experimental Equipment and Environmental Laboratory Setup
To ensure a relatively stable smoke environment, a specialized laboratory was designed and constructed, featuring three functional areas: a control room, a test room, and a settling room (Figure 8). This setup was used to validate the simulation model proposed in this study.
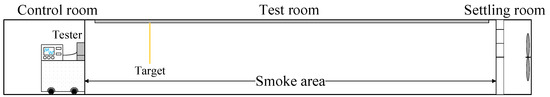
Figure 8.
Layout of the smoke environment laboratory.
The desired smoke environment (primarily comprising NH4Cl) was created by igniting a certain dose of the NH4Cl smoke agent (adjustable as needed) in the test room. Th equipment control, observation, and recording of experimental phenomena were conducted from the control room. The test room was a long rectangular cuboid: length = 12 m, width = 2 m, and height = 2.5 m (Figure 9).

Figure 9.
Schematic diagram of the smoke environment laboratory.
In this study, a self-developed laser detection device (refer to Figure 10) was used in the smoke environment laboratory. The device includes a laser-emitting module, a laser-receiving module, an optical platform, an optical guide, a manual rotation stage, and sleeves. Other related instruments and equipment include a movable operation table, a direct current (DC) power supply, and an oscilloscope.
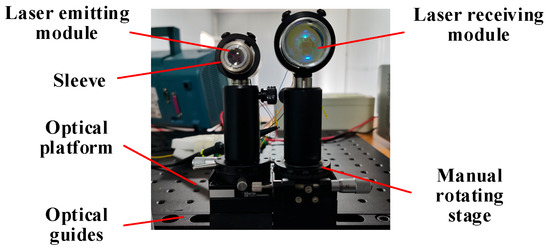
Figure 10.
Self-developed laser detection device.
4.2. Experimental Data and Analysis
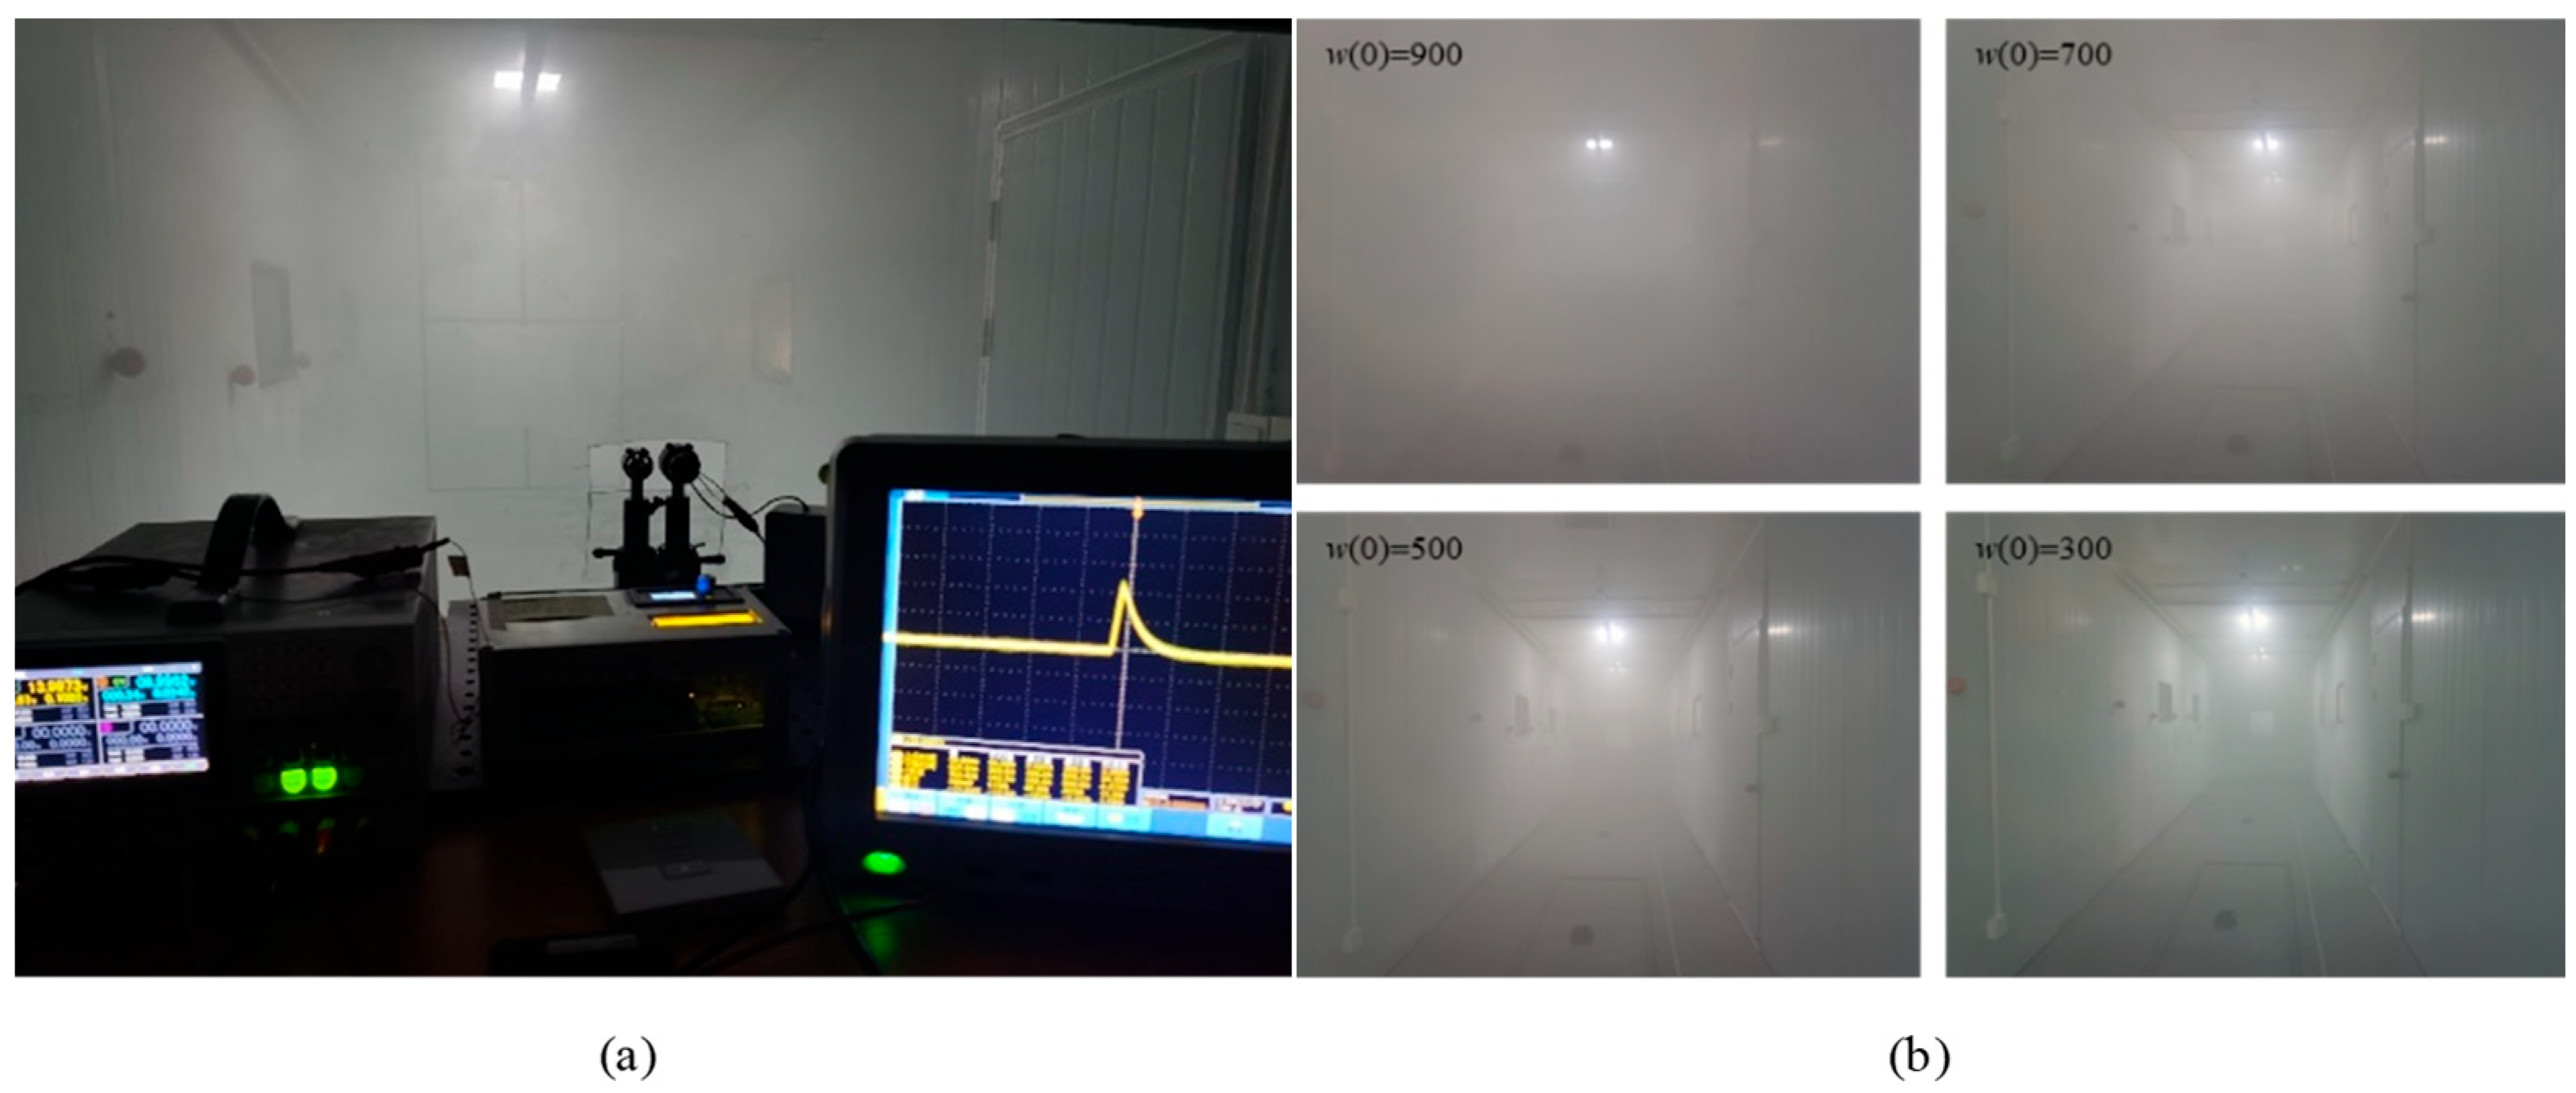
Figure 11 shows the experimental setup for evaluating the pulsed laser target echo characteristics in a smoky environment. Figure 11a presents the layout of the instruments and equipment in the control room, and Figure 11b presents the visual effects of the target under smoke concentrations of 900, 700, 500, and 300 mg/m3 in the laser detection system.
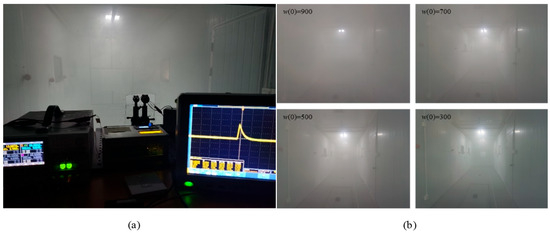
Figure 11.
Experimental scheme for characterizing pulsed laser target echoes. (a) Equipment layout; (b) visual effects of various smoke concentrations.
Figure 12 shows the changes in the target echo signal voltage amplitude as a function of the smoke concentration. The average power of the laser emission module was p = 3.58 mW, and the communication distance between the laser emission and reception modules was = 40 mm. Owing to the relatively wide laser pulse, the echo signal contains only one peak. When the target distance is long (i.e., > 4 m), the target echo is smaller than the backscattered echo caused by the smoke particles. Thus, as the smoke concentration increases, the backscattering effect of the smoke becomes more pronounced, and the echo signal intensity increases, roughly in direct proportion. When the target distance is short (i.e., ≤ 4 m), the echo caused by the target reflection dominates. As the smoke concentration increases, the attenuation of the target signal also increases, which reduces the echo signal amplitude. However, when the smoke concentration exceeds a certain threshold, the backscattering effect of the smoke becomes more pronounced, thereby increasing the echo signal intensity.
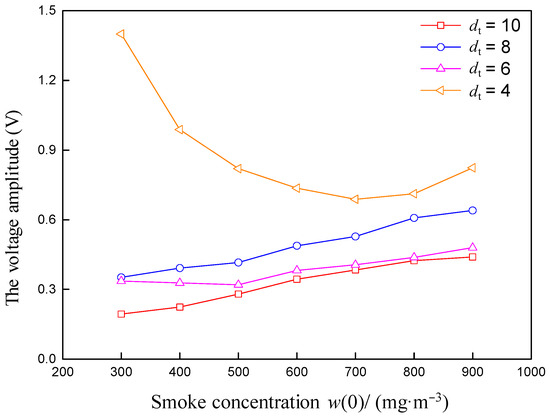
Figure 12.
Relationship between the target echo signal amplitude and the smoke concentration.
Figure 13 shows the changes in the target echo signal voltage amplitude as a function of the target reflector standard reflectivity . The target echo signal voltage amplitude changes almost in direct proportion to the smoke concentration. Under any given smoke concentration , the target echo signal voltage amplitude increases for a higher standard reflectivity of the target reflector. These experimental trends are consistent with the simulation-derived conclusions presented in Section 3.4.
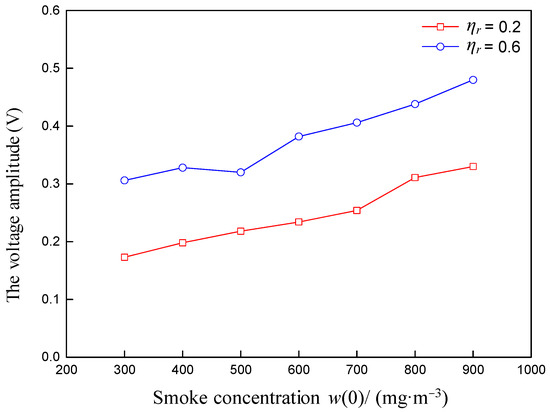
Figure 13.
Relationship between the target echo amplitude and the standard reflectance.
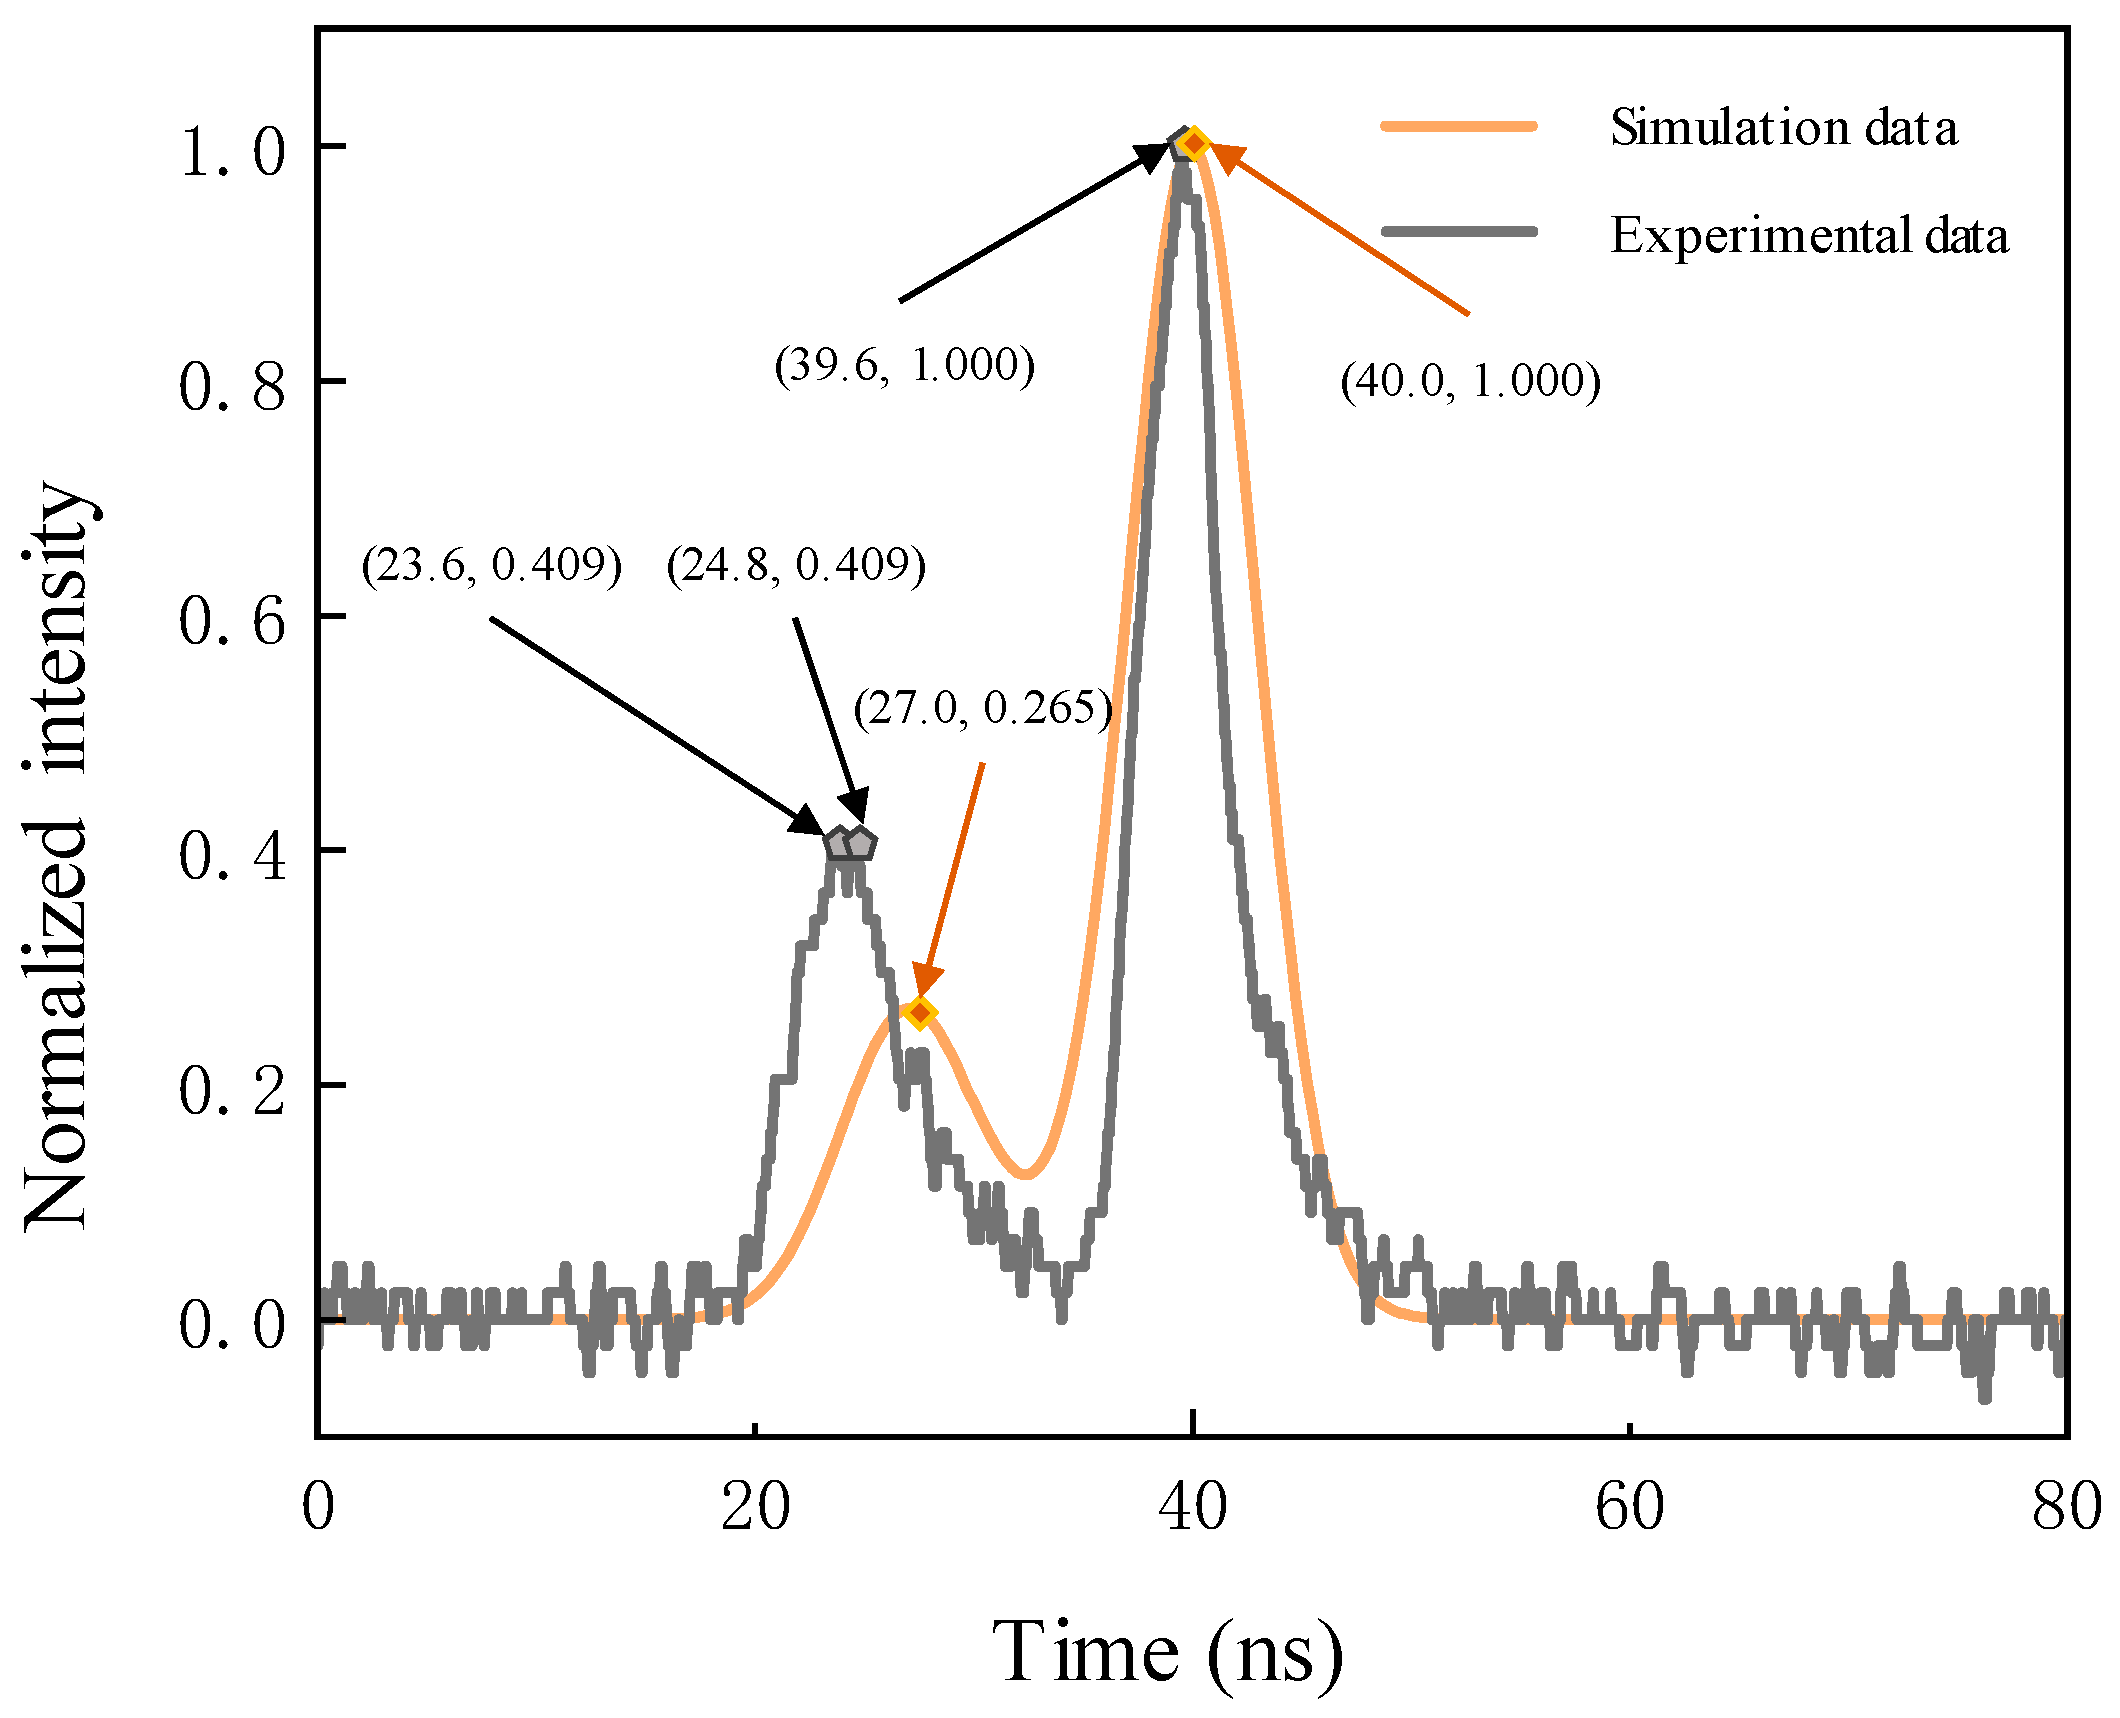
The experimental and simulation data for a target distance of = 6 m, a reflectivity of = 0.6, and a smoke concentration of w(0) = 500 were evaluated further. Due to the presence of amplification circuitry in the detection system, the actual waveform data were amplified in equal proportions. Therefore, these data were normalized based on their maximum amplitudes, thus ignoring their amplification [26]. The processed experimental and simulated waveforms are compared in Figure 14. The shapes of the two waveforms are almost identical: both signals contain two peaks corresponding to the smoke backscattered echo and the target echo. There are distinctions in both the time and energy domains in terms of the backscattered echo peak between the experimental and simulated waveforms, owing to the random variation of the smoke environment. However, the target echo peaks in the time domain were nearly identical, indicating that the developed simulation-based approach can be used to accurately determine the target distance under the range of tested conditions. Overall, these results further validate the effectiveness of the model proposed herein.
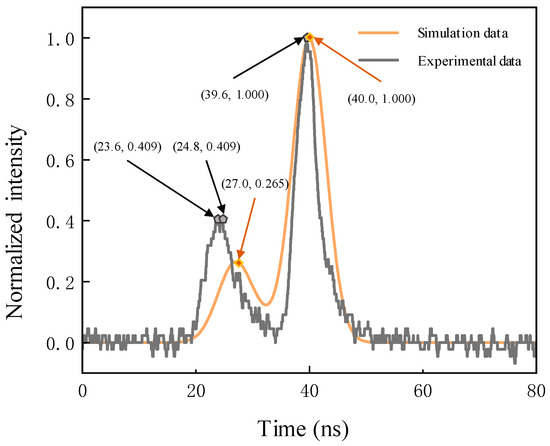
Figure 14.
Data comparison when w(0) is 500 mg/m3.
5. Conclusions
This article describes and validates a pulsed laser target echo signal model for non-uniform smoke environments. This study importantly included numerical simulation research on pulsed laser target echo signals under different environmental and target parameters. Specifically, a semi-analytical laser reception Monte Carlo method is proposed based on the T-matrix scattering phase function rejection method and the characteristics of the non-uniform smoke environment. The model describes in detail the echo waveform characteristics under different smoke concentrations, laser detection system pulse widths, target distances, and target reflectivity conditions. The main conclusions drawn from the results of this study are summarized as follows:
(1) A mathematical model for pulsed laser target echo signals in non-uniform smoke environments was established, considering the characteristics of real smoky environments. This study investigated the target echo characteristics of a pulsed laser detection system in non-uniform smoke environments. The accuracy and precision of the developed model were validated by comparing the simulated results with experimental data and analyzing the variations in the laser echo signal waveforms.
(2) For small laser pulse widths (e.g., 5 or 10 ns), the echo signal waveform contained two peaks: one corresponding to the smoke backscatter and one corresponding to the target. The smoke backscattered peak was positively correlated with the smoke concentration, whereas the target peak was negatively correlated with the smoke concentration. Because the target remained stationary, the target signal remained stable in the time domain. At high smoke concentrations (w(0) = 900 ), the echo signal contained only backscatter. As the pulse width increased ( ≥ 40 ns), the echo signal comprised both the backscattered smoke signal and the target signal. The echo signal amplitude increased with increasing pulse width and decreased with increasing smoke concentration.
(3) When the laser pulse width = 5 ns, the backscattered signal was highly consistent within the time domain, and the target signal peak appeared later and less intense with increasing target distance. As the pulse width increased, the backscattered and target signals overlapped, thus increasing the combined signal amplitude. For pulse widths of 60 and 100 ns, the echo signal included the combined backscattered and target echo signals, such that the amplitude was negatively correlated with the target distance and positively correlated with the pulse width.
(4) The intensities of the target signal at a small pulse width ( = 5 ns) and the combined signals at larger pulse widths (80 or 100 ns) were positively correlated with the target reflectance. Specifically, as the target reflectance increased, the amplitude of the echo signal shifted later, owing to the combined effects of smoke backscattering and target reflection.
The establishment of a mathematical model for studying pulsed laser target echo signals in non-uniform smoke environments and analyzing target echo characteristics holds significant military engineering importance, particularly in terms of laser fuze target recognition and detection applications in smoky environments. This report provides a theoretical foundation for subsequent analyses of laser fuze performance in smoky environments.
Author Contributions
Conceptualization, C.X.; Data curation, C.X. and W.C.; Funding acquisition, R.Z. and B.Z.; Methodology, C.X. and R.Z.; Resources, C.X. and R.Z.; Supervision, R.Z. and H.Z.; Validation, C.X. and Z.Z.; Writing—original draft, C.X.; Writing—review and editing, C.X., R.Z., W.C., Z.Z., H.Z. and B.Z. All authors have read and agreed to the published version of the manuscript.
Funding
The research in this article was funded by the National Natural Science Foundation of China (Grant No. 52201399) and the Public Welfare Technology Application Research Programme of Lishui City (Grant No. 2024GYX08).
Institutional Review Board Statement
Not applicable.
Informed Consent Statement
Not applicable.
Data Availability Statement
Data are contained within the article.
Conflicts of Interest
The authors declare that they have no known competing financial interests or personal relationships that could have appeared to influence the work reported in this paper.
References
- Zhang, W.; Li, Y.; Huang, Z. Research on the characteristics of fog backscattering signals for frequency modulated continuous wave laser fuze. Optik 2016, 127, 9046–9055. [Google Scholar] [CrossRef]
- Guo, J.; Liu, X.; Liu, W.; Luo, A.; Si, X. Multi-feature fusion target recognition method based on forward-looking dual linear array scanning laser fuze. Opt. Laser Technol. 2024, 181, 111860. [Google Scholar] [CrossRef]
- Li, H. Spatial-temporal scanning detection model and calculation method of laser fuze. Microw. Opt. Technol. Lett. 2023, 65, 356–364. [Google Scholar] [CrossRef]
- Pan, Z.; Song, C.; Liu, B.; Wang, X.; Deng, M.; Su, H. Accurate ranging of dual wavelength FMCW laser fuze under different types of aerosol interference. IEEE Sens. J. 2022, 22, 18953–18960. [Google Scholar]
- Wang, F.; Chen, H.; Yang, S.; Xu, L. Comparison of detection performance of near-, mid-, and far-infrared laser fuzes in clouds. Appl. Opt. 2018, 57, 8078–8086. [Google Scholar] [CrossRef]
- Guo, J.; Zhang, H.; Zhang, X. Propagating Characteristics of Pulsed Laser in Rain. Int. J. Antennas Propag. 2015, 2015, 292905. [Google Scholar] [CrossRef]
- Grabner, M.; Kvicera, V. Multiple scattering in rain and fog on free-space optical links. J. Light. Technol. 2014, 32, 513–520. [Google Scholar] [CrossRef]
- Guo, Z.; Yang, B.; Wu, K.; Liang, Y.; Hao, S.; Huang, Z. FMCW Laser Fuze Structure with Multi-Channel Beam Based on 3D Particle Collision Scattering Model under Smoke Interference. Sensors 2024, 24, 5395. [Google Scholar] [CrossRef]
- Pang, Z.; Song, C.; Liu, B. A Study on Accurate Ranging Method of a Dual-Wavelength Orthogonal FMCW Laser Fuze in a Complex Aerosol Environment. IEEE Sens. J. 2024, 24, 11306–11315. [Google Scholar]
- Arfan, M.; Asif, M.; Althobaiti, S.; Althobaiti, A. Scattering analysis of structured light beam for rainy atmosphere. Opt. Quantum Electron. 2024, 56, 1610. [Google Scholar] [CrossRef]
- Ceolato, R.; Berg, M. Aerosol light extinction and backscattering: A review with a lidar perspective. J. Quant. Spectrosc. Radiat. Transf. 2021, 262, 107492. [Google Scholar] [CrossRef]
- Chen, H.; Liu, Y.; Zhu, X.; Wang, F.J. Simulation of the characteristics of backscattering signals for frequency modulated continuous wave laser fuze. Acta Armamentarii 2015, 36, 2247–2253. [Google Scholar]
- Song, C.; Cui, Y.; Liu, B. FMCW Laser fuze multiple scattering model and accurate fixed-distance algorithm in a smoke environment. Sensors 2020, 20, 2604. [Google Scholar] [CrossRef] [PubMed]
- Chen, H.; Ma, C.; Qi, B.; Guo, P.; Yang, S.; Gao, L.; Huo, J. Study on backscattering characteristics of pulsed laser fuze in smoke. Infrared Laser Eng. 2020, 49, 38–44. [Google Scholar]
- Wang, H.; Zu, Y.; Tian, T.; Li, A. Characteristics of laser transmission in different types of aerosols. Acta Phys. Sin. 2013, 62, 324–333. [Google Scholar]
- Chen, P.; Zhao, J.; Du, X.; Zhu, C. Study on the influence of aerosol macroscopic characteristics on backscattering signals. In Proceedings of the 3rd International Conference on Photonics and Optical Engineering, Xi’an, China, 5–8 December 2018; Volume 10305, p. 110521B. [Google Scholar]
- Bao, J.; Zha, B.; Xu, C.; Zhang, H. Study of a laser echo in an inhomogeneous dust environment with a continuous field Monte Carlo radiative transfer model. Opt. Express 2021, 29, 17976–17996. [Google Scholar] [CrossRef]
- Xu, C.; Zha, B.; Zhang, R.; Xia, J.; Zheng, Z.; Li, S. Echo characteristics of pulsed lasers in non-uniform smoke environments. Opt. Express 2024, 32, 24222–24241. [Google Scholar] [CrossRef]
- Guo, Z.; Yang, B.; Liang, Y.; Huang, Z. Virtual simulation of the effect of FMCW laser fuse detector’s component performance variability on target echo characteristics under smoke interference. Materials 2022, 15, 4268. [Google Scholar] [CrossRef]
- Liu, B.; Song, C.; Duan, Y. The characteristics simulation of FMCW laser backscattering signals. Opt. Rev. 2018, 25, 197–204. [Google Scholar] [CrossRef]
- Bahmeh, Z.; Zangeneh, H. Detection of a target hidden in dense cloud clutter using an echo pattern of pulsed laser radar systems. Laser Phys. 2023, 33, 086203. [Google Scholar] [CrossRef]
- Wang, F.; Chen, H.; Ma, C.; Xu, L. Construction of backscattering echo caused by cloud in laser fuze. Optik 2018, 171, 153–160. [Google Scholar] [CrossRef]
- Prahl, S.; Keijzer, M.; Jacques, S.; Weich, A. A Monte Carlo model of light propagation in tissue. In Dosimetry of Laser Radiation in Medicine and Biology; SPIE: St Bellingham, WA, USA, 2017; Volume 10305, pp. 1030509–1030510. [Google Scholar]
- Poole, L.; Venable, D.; Campbell, J. Semianalytic Monte Carlo radiative transfer model for oceanographic lidar systems. Appl. Opt. 1981, 20, 3653. [Google Scholar] [CrossRef] [PubMed]
- Yang, Y.; Wu, Z.; Cao, Y. Practical Six-parameter bidirectional reflectance distribution function model for rough surface. Acta Opt. Sin. 2012, 32, 313–318. [Google Scholar]
- Kong, W.; Wan, F.; Yu, L.; Wang, C.; Sun, H.; Wang, R.; Chen, W. Dynamic Detection of Decomposition Gases in Eco-Friendly C5F10O Gas-Insulated Power Equipment by Fiber-Enhanced Raman Spectroscopy. Anal. Chem. 2024, 96, 15313–15321. [Google Scholar] [CrossRef] [PubMed]


Disclaimer/Publisher’s Note: The statements, opinions and data contained in all publications are solely those of the individual author(s) and contributor(s) and not of MDPI and/or the editor(s). MDPI and/or the editor(s) disclaim responsibility for any injury to people or property resulting from any ideas, methods, instructions or products referred to in the content. |
© 2025 by the authors. Licensee MDPI, Basel, Switzerland. This article is an open access article distributed under the terms and conditions of the Creative Commons Attribution (CC BY) license (https://creativecommons.org/licenses/by/4.0/).