Abstract
Phase demodulation is the core of fringe projection profilometry systems. However, current U-Net-based phase demodulation approaches demonstrate deficiencies in global context propagation, adversely affecting wrapped phase extraction precision. To this end, this paper proposes a deep-learning-based model for single-shot wrapped phase extraction, named the full-scale connection and attention enhancement network (SEC-UNet3+). The network mitigates the limitations of the traditional U-Net architecture by introducing cross-layer full-scale connection and a feature integration module in the decoder, enabling efficient interaction between shallow detail features and deep semantic features. Unlike the skip connection strategy within the same-layer in U-Net, cross-layer full-scale connection can enhance the feature utilization. Additionally, a skip connection is embedded between the feature mapping layer and the output transformation layer in the squeeze and excitation module, preventing information loss during the feature calibration process. Compared to the U-Net model, the proposed method achieves an approximately 5% to 15% reduction in both the mean squared error and mean absolute error for phase extraction. The experimental results confirm that SEC-UNet3+ outperforms traditional Fourier transform and mainstream U-Net-based approaches in phase demodulation accuracy, proving particularly effective for single-shot wrapped phase retrieval in dynamic scenarios.
1. Introduction
Fringe projection profilometry (FPP) [1,2,3] is a non-contact three-dimensional (3D) surface profilometry technique that offers advantages such as high speed and high resolution. It has been widely applied in industrial inspection, reverse engineering, and intelligent manufacturing [4,5,6,7,8]. During the FPP measurement process, a structured light pattern with specific rules and configurations is projected onto the measured object, and an imaging device captures the modulated pattern to compute the 3D surface profile of the object. In the procedure of decoding the modulated pattern to obtain the 3D surface profile of an object, wrapped phase extraction and unwrapping techniques are critical steps for reconstructing the 3D surface information from the modulated pattern. Wrapped phase extraction and unwrapping involve extracting the wrapped phase from the modulated pattern and converting it into a continuous phase. The accuracy of wrapped phase extraction affects the precision of 3D measurements directly.
Existing wrapped phase extraction methods can be mainly categorized into temporal and spatial domain approaches. Temporal domain methods, such as phase-shifting profilometry (PSP) [9,10,11,12], achieve wrapped phase extraction by capturing multiple modulated patterns with known phase shifts, making them highly suitable for high-precision measurements in static environments. Nevertheless, PSP requires sequential projection of multiple fringe patterns, resulting in reduced measurement efficiency. In addition, owing to its reliance on phase differences between multiple phase-shifted images, PSP is highly susceptible to phase demodulation errors in high-noise environments, limiting its applicability in dynamic scenarios. Unlike PSP, which relies on multiple images, Fourier transform profilometry (FTP) [13] can extract 3D surface information directly from a single fringe image, offering higher measurement efficiency, particularly for dynamic scenarios and rapid acquisition requirements. Nonetheless, FTP is highly prone to spectrum aliasing, which adversely affects phase demodulation and measurement accuracy. In summary, both PSP and FTP face challenges in balancing efficiency and accuracy in 3D profilometry. Therefore, there is an urgent need for a method that can simultaneously achieve high precision and high efficiency in 3D surface profile measurement.
Deep learning architectures based on convolutional neural networks (CNNs) [14], such as fully convolutional network (FCN) [15], U-Net [16], and generative adversarial network (GAN) [17], along with emerging Transformer-based and Diffusion models, have been widely applied in FPP. With their powerful feature extraction capabilities and end-to-end characteristics, these methods effectively address key challenges in FPP, including image denoising and enhancement, phase demodulation and unwrapping, and phase correction and optimization [18,19,20,21]. Such applications have significantly improved the accuracy of 3D measurements. Although end-to-end deep learning architectures enable direct mapping from fringe patterns to unwrapped phase or depth maps without the need for intermediate variables, this cross-stage approach to obtaining target physical quantities still presents substantial limitations. Li et al. [22] utilized a neural network to recover the unwrapped phase from a single dual-frequency composite fringe pattern, effectively mitigating the spectral aliasing issue inherent in conventional spatial multiplexing methods. However, variations in the surface reflectivity of objects cause intensity information to be inaccurately mapped to absolute phase distributions, making it difficult to achieve high-quality absolute phase estimation using current end-to-end deep learning networks. Van et al. [23] trained a fully convolutional neural network to extract height information from a single unknown fringe pattern, achieving high-precision full-field height estimation even from unknown fringe patterns. However, since the model training heavily relies on large amounts of simulated data, its generalization capability is limited when applied to real-world scenarios or varying environmental conditions. While simulated datasets can serve for preliminary algorithm validation, they cannot adequately replace complex real-world scenarios, and end-to-end learning methods still struggle to achieve high-precision phase unwrapping results. Specifically, when extracting the unwrapped phase from a single-shot fringe pattern, the network must simultaneously process both the wrapped phase and the fringe order. The intrinsic differences in their variation patterns within the same fringe period pose great difficulties to feature learning. Additionally, directly extracting depth information from fringe patterns may prevent the network from fully leveraging important intermediate variables, leading to cumulative prediction errors across different stages. Unlike end-to-end cross-stage deep learning approaches, some studies [24,25] have theoretically and experimentally demonstrated that employing deep learning to obtain intermediate variables such as the wrapped phase and fringe orders in a stage-wise manner offers greater advantages in terms of phase unwrapping reliability and error control. At the same time, many studies are committed to using deep learning technology to replace traditional processing methods in each single stage of fringe projection measurement, which substantially improves the extraction accuracy and efficiency of intermediate variables and boosts the overall accuracy of 3D measurement [26,27,28,29,30,31].
Driven by stage-wise optimization strategies, the phase demodulation technique of a single-shot fringe pattern has gradually broken through the traditional efficiency bottleneck and has become the focus of highly dynamic 3D measurement. Yan et al. [32] employed a three-layer backpropagation neural network to estimate the continuous approximation function of discrete fringe patterns and demodulate the depth-related phase information modulated in the fringe patterns of the measured object. Feng et al. [33] designed a two-stage CNN network to predict the background image and arctangent function parameters from a single-shot fringe pattern, which markedly outperformed the Fourier transform (FT) and windowed Fourier transform (WFT) methods in terms of accuracy and edge preservation. Subsequently, the same team proposed micro deep learning profilometry, which extracts wrapped phase information from fringe patterns of three different frequencies, achieving high-speed 3D reconstruction at 20,000 frames per second [34]. To achieve single-shot phase computation, Zuo et al. [35] designed a dual-frequency composite fringe pattern to eliminate phase ambiguity and used a U-Net network to predict the unwrapped phase from a single fringe image, achieving a measurement accuracy superior to traditional Fourier transform profilometry (FTP). Yang et al. [36] were the first to apply GAN to phase extraction from single-shot fringe images, substantially boosting phase extraction accuracy and overcoming the major limitations of FTP. Nguyen et al. [37] used three end-to-end methods based on CNN to directly generate the corresponding depth map from a single fringe image, among which the U-Net network had the highest reconstruction accuracy. Thereafter, they [25] proposed the fringe-to-phase network, which extracts three wrapped phase maps directly from a color image containing three specified frequency fringe patterns, demonstrating superior speed and accuracy compared to end-to-end methods that obtain depth maps directly from fringe images. To overcome the shortcomings of traditional network information transmission, Xue et al. [38] proposed a fringe projection phase demodulation method based on SE-FSCNet, whose phase demodulation accuracy is higher than the traditional FT method and U-Net.
The phase demodulation task is essentially a regression problem, aiming to predict continuous phase values from input data rather than classifying them. The U-Net model has been widely used in phase demodulation tasks due to its excellent regression ability. Its encoder–decoder structure and skip connection effectively retain spatial information and perform well in image segmentation and recovery. However, U-Net still has some limitations in integrating high-layer and low-layer features, particularly as skip connection within the same hierarchical layer may lead to insufficient information fusion, thereby affecting the restoration of image details. In addition, with the increase in the depth of the network, the resolution of the feature map gradually decreases, and it is difficult to transmit some high-frequency information effectively.
Considering the aforementioned issues, this paper proposes a phase demodulation network based on full-scale connection—SEC-UNet3+. By incorporating the full-scale connection mechanism of UNet3+ [39], this network can more effectively integrate high-layer and low-layer features, demonstrating strong learning capabilities in both image context understanding and detail restoration. Meanwhile, the squeeze–excitation–connection (SEC) module introduces an additional skip connection between the feature mapping layer and the output layer. Compared to the conventional squeeze-and-excitation (SE) module [40], the SEC module not only retains the attention mechanism of the SE module but also allows the current layer to pass its feature maps to subsequent layers, thereby enhancing the overall representational capacity of the network. Experiments show that SEC-UNet3+ improves the accuracy of single-shot wrapped phase extraction while effectively enhancing feature transmission in the phase demodulation task.
The remainder of this paper is structured as follows: Section 2 first explains the principle of multi-step phase-shifting methods for calculating the wrapped phase, then introduces the dataset used in this study, and finally provides a detailed description of the proposed SEC-UNet3+ network architecture, with a focus on the design of the encoding and decoding layers as well as the functionality of key modules; Section 3 evaluates the performance contributions of the full-scale connection mechanism and the SEC module in the wrapped phase extraction task through ablation studies; and Section 4 summarizes the main research findings of this paper and outlines future research directions.
2. Theories and Methods
2.1. Principle of Multi-Step Phase-Shifting Method
In general, in a phase-shifting fringe projection 3D imaging system, the intensity distribution function of the fringe image sequence captured by the camera can be expressed as:
where represents the pixel coordinates in the camera coordinate system, and denote the fringe background intensity and modulation respectively, is the phase-shifting index with , where is the number of phase-shifting steps, and contains the depth information of the measured object.
When is given, the wrapped phase can be solved using the least squares method, i.e.,:
where and represent the numerator and denominator terms of the arctangent function, respectively. Through Equation (2), the ground truth of the wrapped phase can be obtained.
2.2. Construction of Dataset
The synthesized fringe projection dataset may struggle to fully account for interference factors such as defocusing effects, random noise, and nonlinear intensity response when simulating real-world scenarios, potentially leading to an insufficient generalization ability of the network in practical applications. A high-quality FPP dataset captured in real-world conditions is crucial for neural network training. Therefore, this paper adopts the three-step phase-shifting fringe projection profilometry dataset proposed by Zuo et al. [41]. This dataset was acquired using a projector (LightCrafter 4500 Pro, with a resolution of 912 × 1140, purchased from Wintech, Beijing, China) and a CMOS camera (acA640–750 μm, with a resolution of 640 × 480, purchased from BASLER, Ahrensburg, Germany) equipped with a 12 mm lens. It includes real-world acquisitions of 120 different types of objects (such as plaster, metal, and plastic), ensuring diversity in sample composition and structural variations within the dataset.
During the model training stage, the network takes a single-shot fringe modulation image as input and simultaneously learns the numerator and denominator terms of the arctangent function for the wrapped phase, along with their physical correlations. After training, the model can directly compute the M and D components from an unknown single-shot fringe image and reconstruct the wrapped phase distribution using the arctangent function. To ensure comprehensive training and performance evaluation, the dataset is divided into training, validation, and test sets in a 3:1:1 ratio. The validation set is used for hyperparameter tuning, while the test set is employed to evaluate the model’s generalization performance.
2.3. Network Architecture Design for SEC-UNet3+
In the traditional U-Net encoder–decoder architecture, its unidirectional layer-by-layer skip connection mechanism not only constrains the network’s ability to model global contextual semantic information but also limits cross-scale interactions between feature maps of different resolutions. This makes it challenging to effectively establish long-range dependencies and achieve multi-scale feature fusion. To address these limitations, this paper proposes the SEC-UNet3+ architecture, which introduces a full-scale connection mechanism and a feature integration (FI) module. This allows the decoder layers to integrate multi-scale feature information from the encoding path, thereby enhancing the network’s ability to represent multi-layer features. At the same time, by incorporating the SEC module, the network adaptively learns inter-channel dependencies and dynamically adjusts the weight distribution of each channel. This enhances the network’s representational capability and enables precise extraction of critical feature information. The reason for choosing UNet3+ over UNet2+ is that UNet2+’s nested dense connection only provides top-down guidance, while UNet3+’s full-scale connection enables direct interaction across all layers.
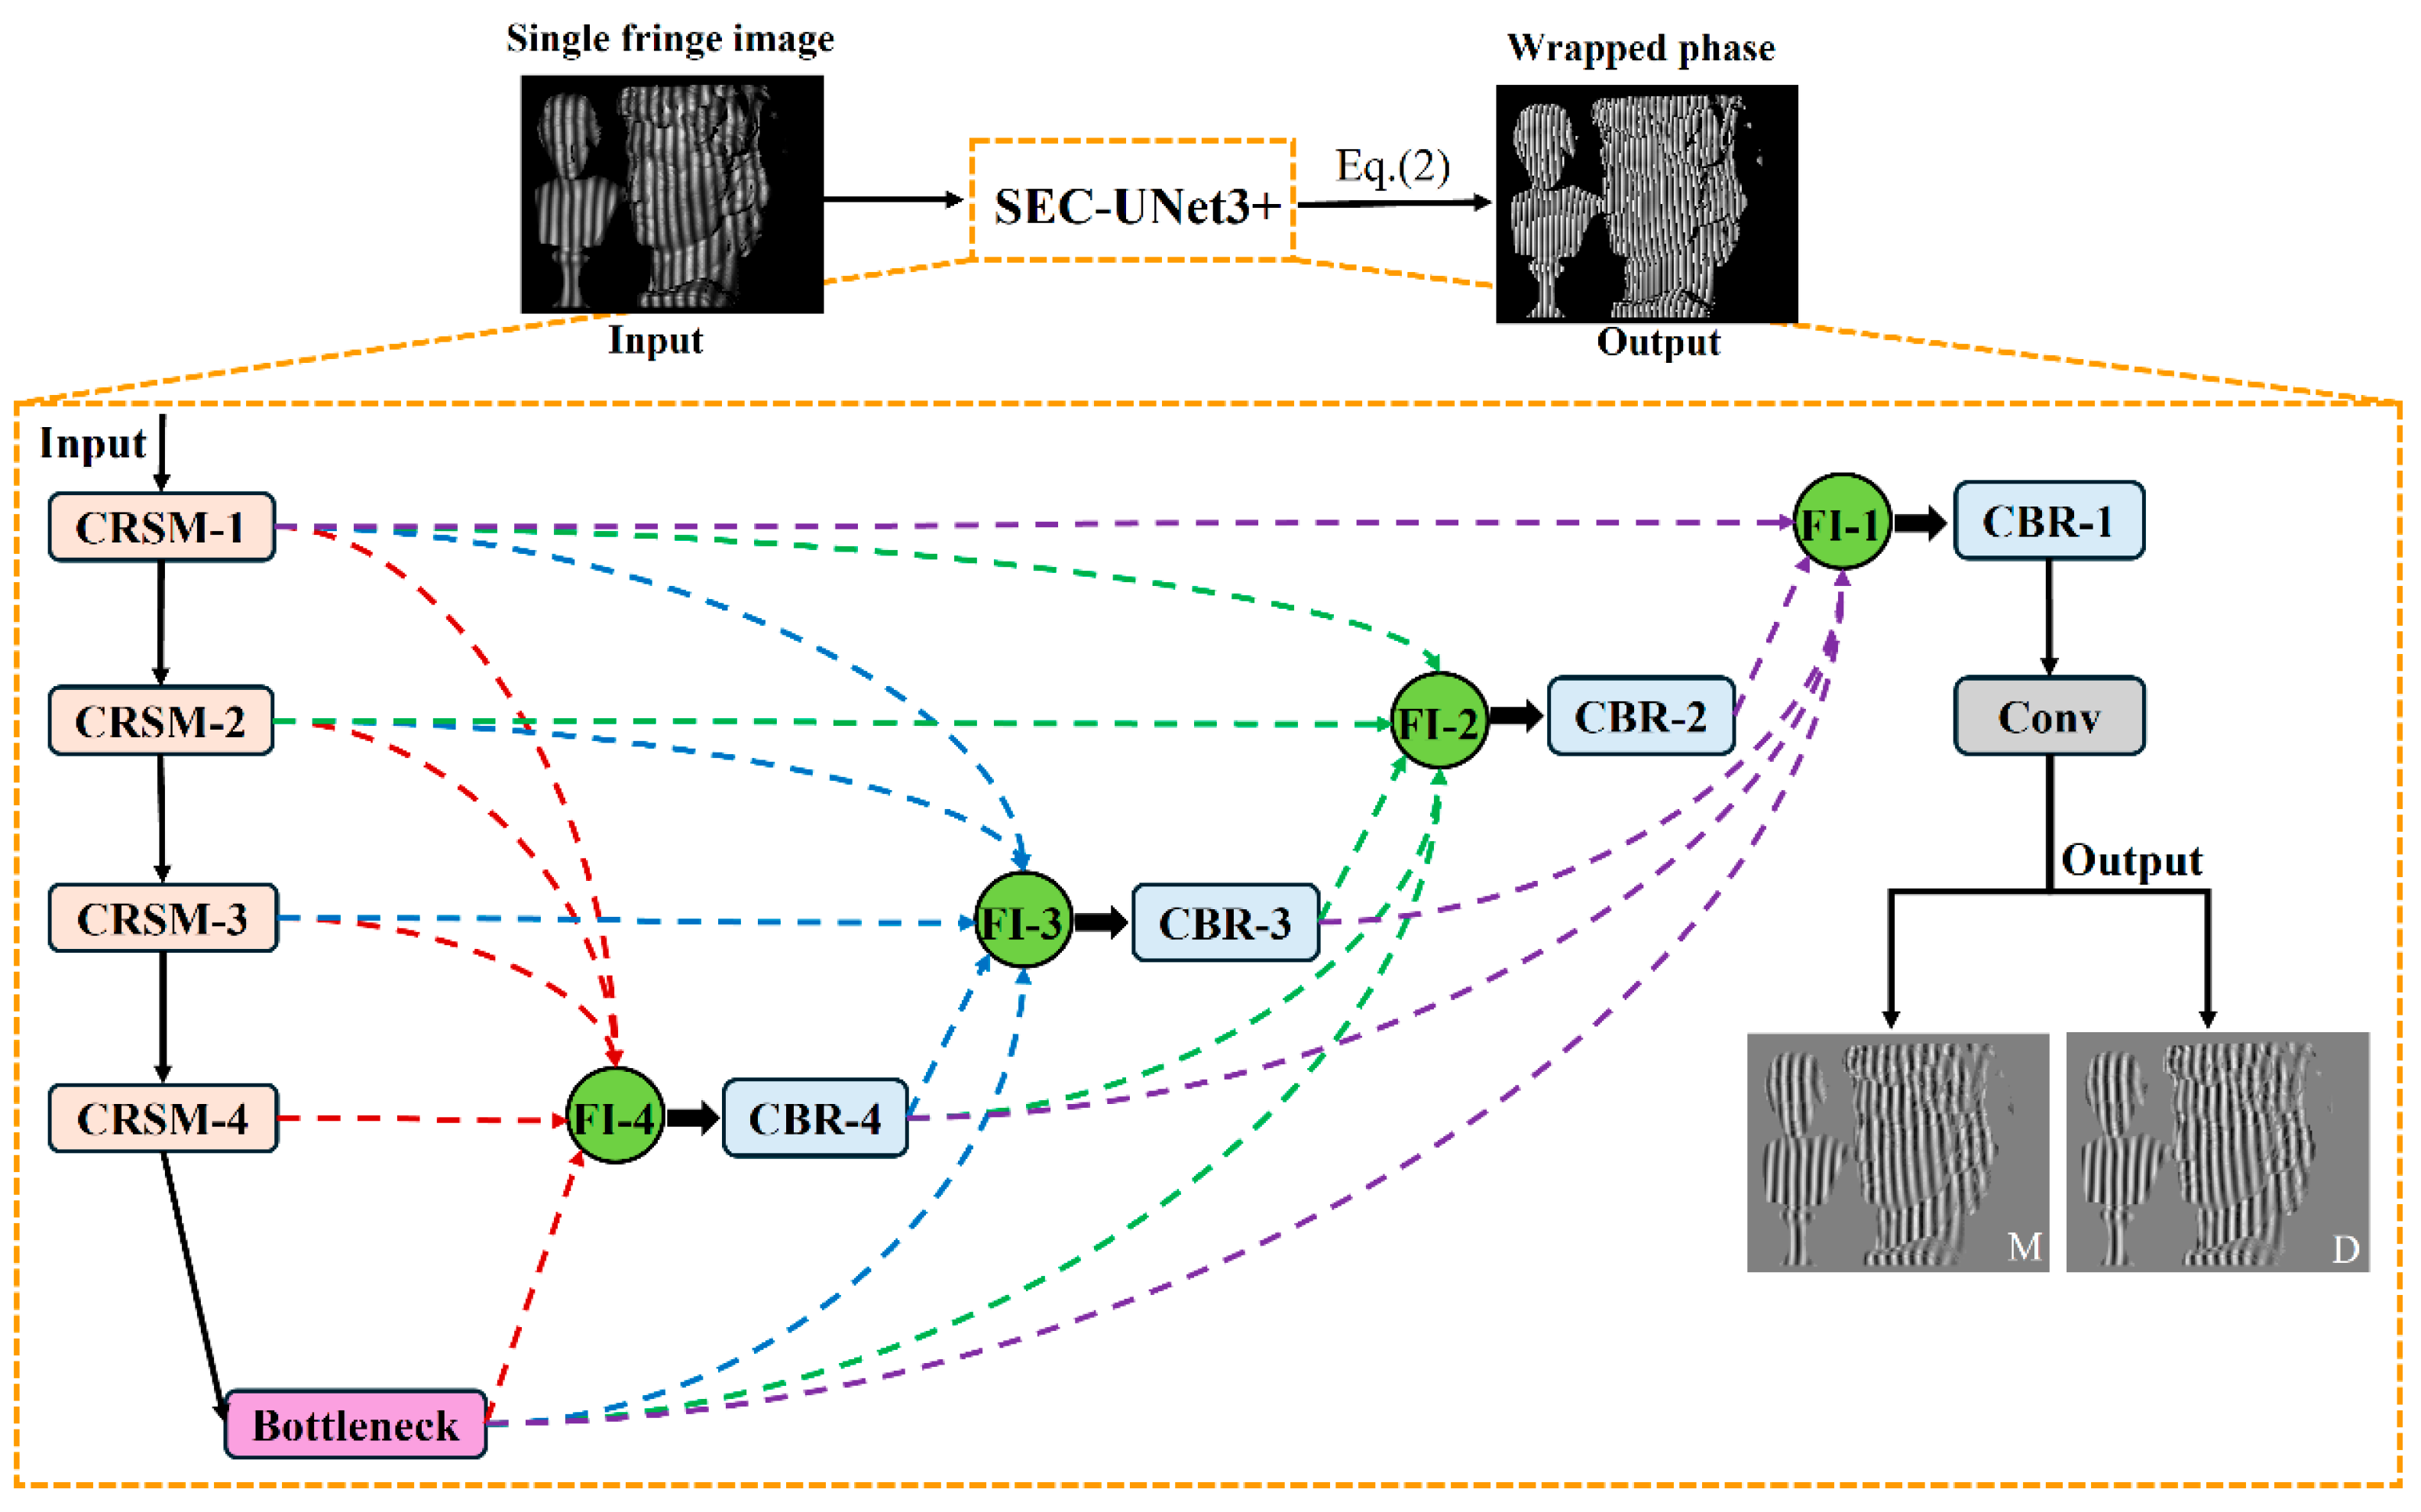
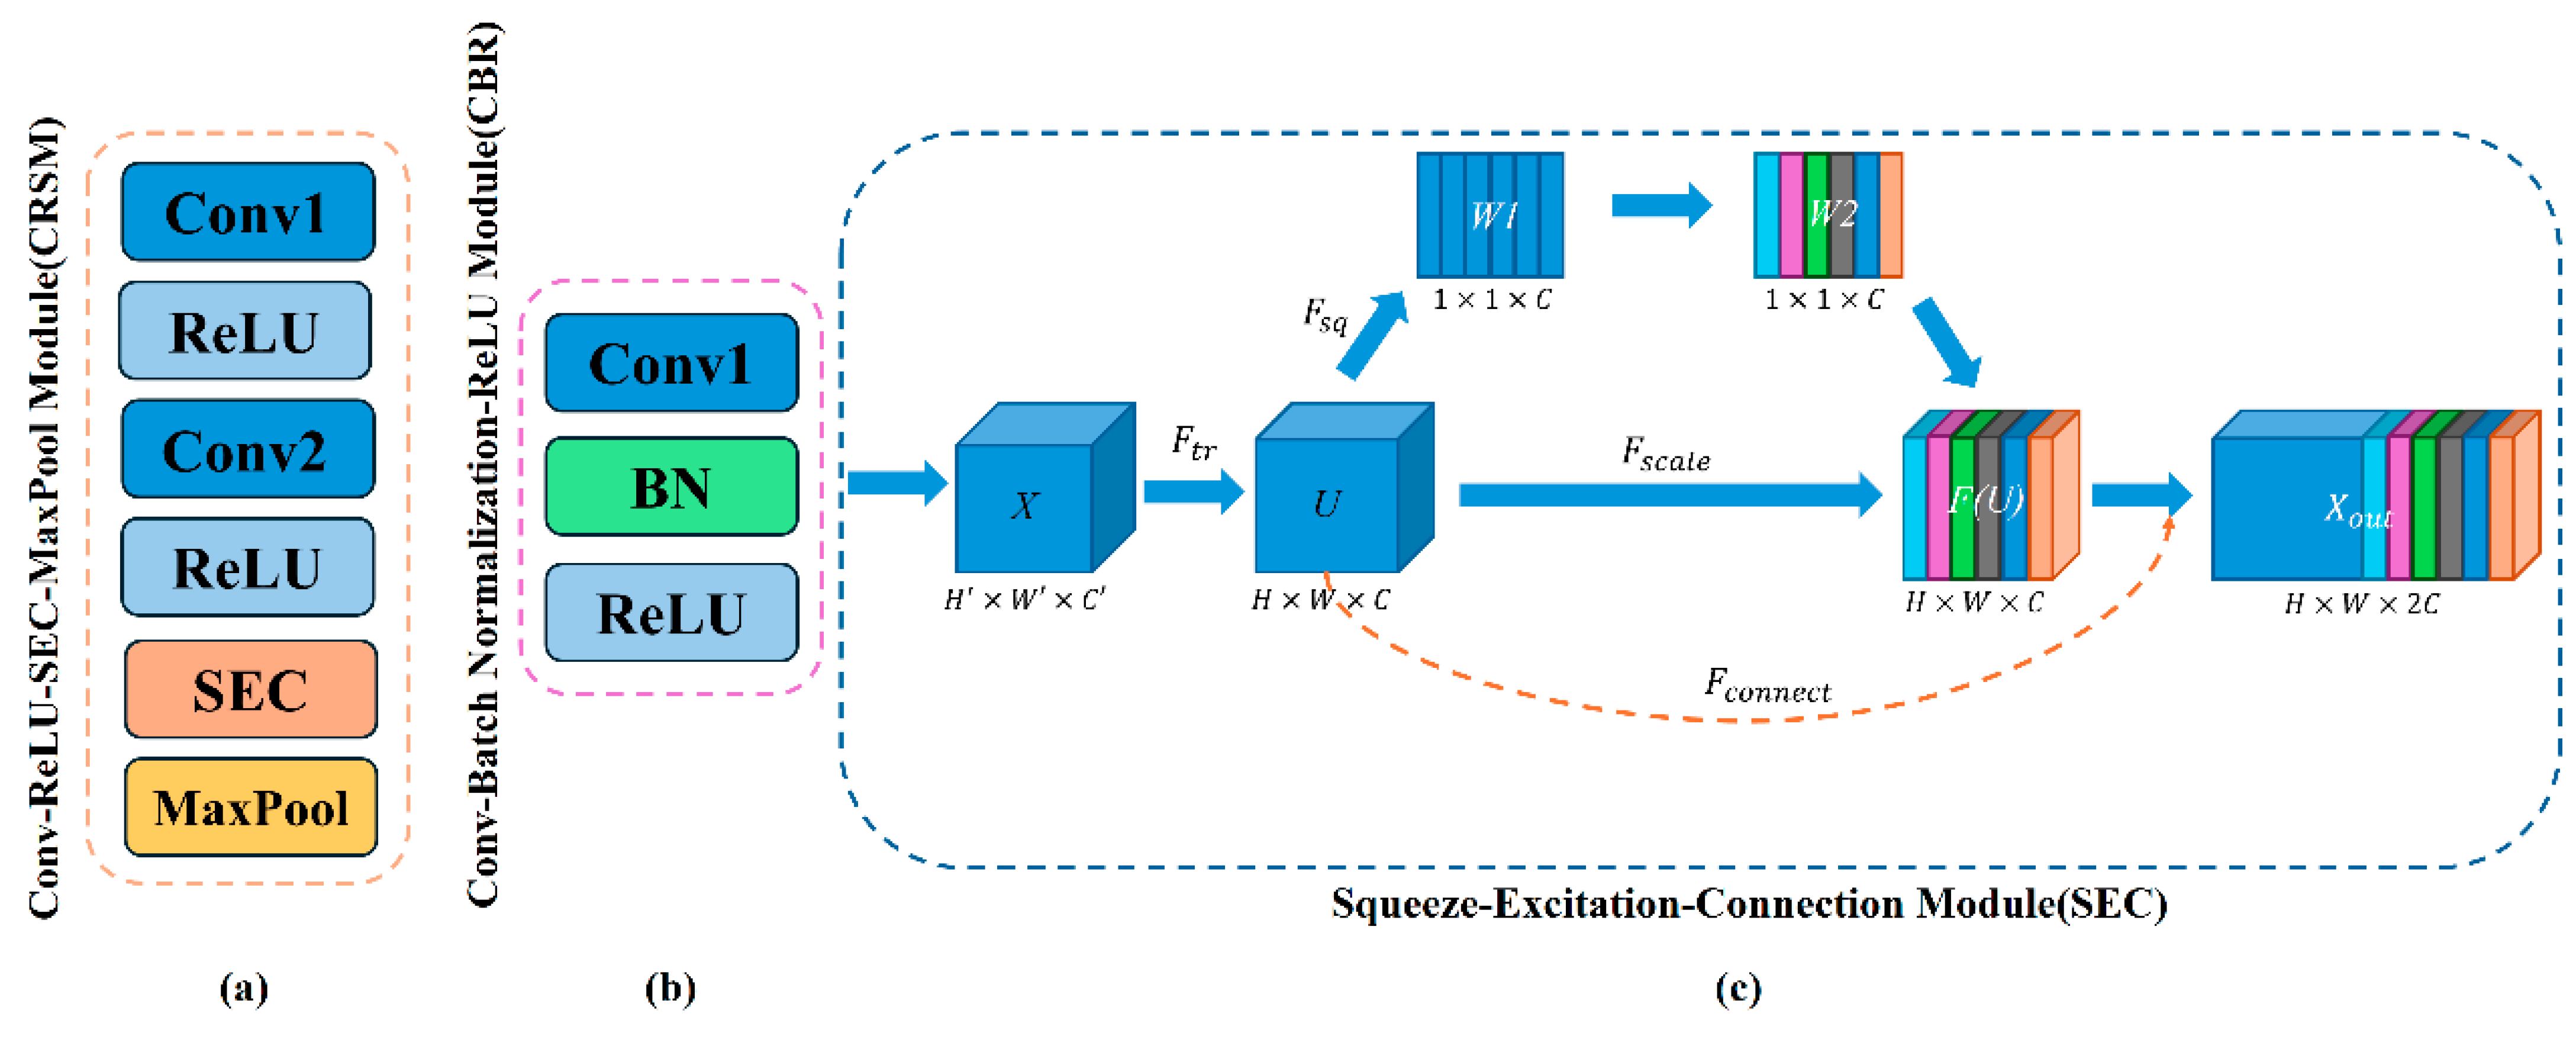
The overall architecture of the SEC-UNet3+ network is shown in Figure 1, which adopts an encoder–decoder symmetric structure. The network takes a single-shot fringe image as the input and directly outputs the numerator parameter M and denominator parameter D required for wrapped phase calculation through end-to-end training. The encoder gradually captures key information in the image through a hierarchical structure, which is composed of four consecutive Conv-ReLU-SEC-Max pool (CRSM) modules stacked together, as shown in Figure 2a. Each CRSM module extracts features from the input image through two convolutional layers (with a 3 × 3 kernel size and a stride of 1) and uses the ReLU activation function for nonlinear mapping. To enhance the network’s ability to focus on key features, each CRSM module introduces an SEC module, which dynamically adjusts feature weights through a channel attention mechanism, thereby improving feature expression capability. Adjacent CRSM modules use 2 × 2 max-pooling operations to reduce the spatial resolution of the feature map while doubling the number of channels, achieving the extraction of higher-dimensional features. The decoder restores the spatial resolution of the feature map through upsampling and convolution. It fuses with the corresponding encoder feature maps via skip connections. This ensures effective feature transmission and accurate detail reconstruction. It is composed of four consecutive convolution–batch normalization–ReLU (CBR) modules. Before the information enters the CBR module, it goes through the FI module for multi-scale feature fusion to fully integrate features from different layers of the encoder part. The internal structure of the CBR module is shown in Figure 2b, which sequentially performs convolution operations, batch normalization (BN), and ReLU activation functions, with the convolution kernel size consistent with the encoder part. The final output of the network proposed in this paper is M and D in Equation (2), and the wrapped phase map can be obtained by solving the arctangent function.
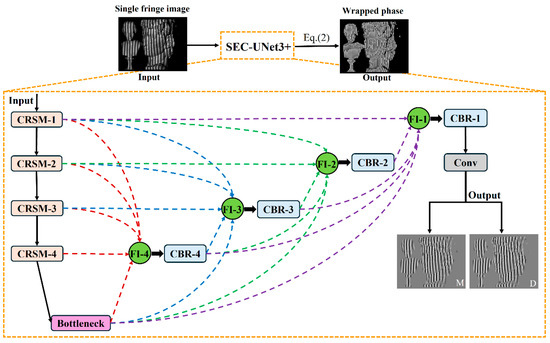
Figure 1.
Network architecture of SEC-UNet3+.

Figure 2.
Structure of CRSM, CBR, and SEC modules. (a) Internal operation sequence of the CRSM module; (b) Internal operation sequence of the CBR module; (c) Internal structure of SEC module.
The internal structure of the SEC module is shown in Figure 2c. The input feature map is transformed into feature map through . Before feature map is passed to the next layer, it undergoes three steps of squeeze, excitation, and scaling to achieve feature recalibration. Specifically, the SEC module first performs global average pooling on feature map , compresses the global information of the image along the spatial dimension through to generate a channel descriptor, and then learns the interdependence between each channel through a channel-dependent gating mechanism. The calculation process can be expressed as:
where represents the sigmoid function, represents the ReLU function, and denote the weight matrices of two fully connected layers, and is the reduction ratio in the dimensionality reduction layer (set to 16 in this paper). Finally, operation is performed, where the learned channel weights are multiplied with the original feature map channel-wise to generate the recalibrated feature map. Unlike the SE module, the SEC module introduces a skip connection between the feature mapping layer and the transformation output layer, where it helps to better preserve spatial and contextual information during the feature compression and recovery process.
In this way, the SEC module effectively solves the problem of detail information loss (such as blurred edges of phase jumps) caused by excessive compression in the SE module during the phase extraction task, showing more superior performance in detail preservation and global feature modeling.
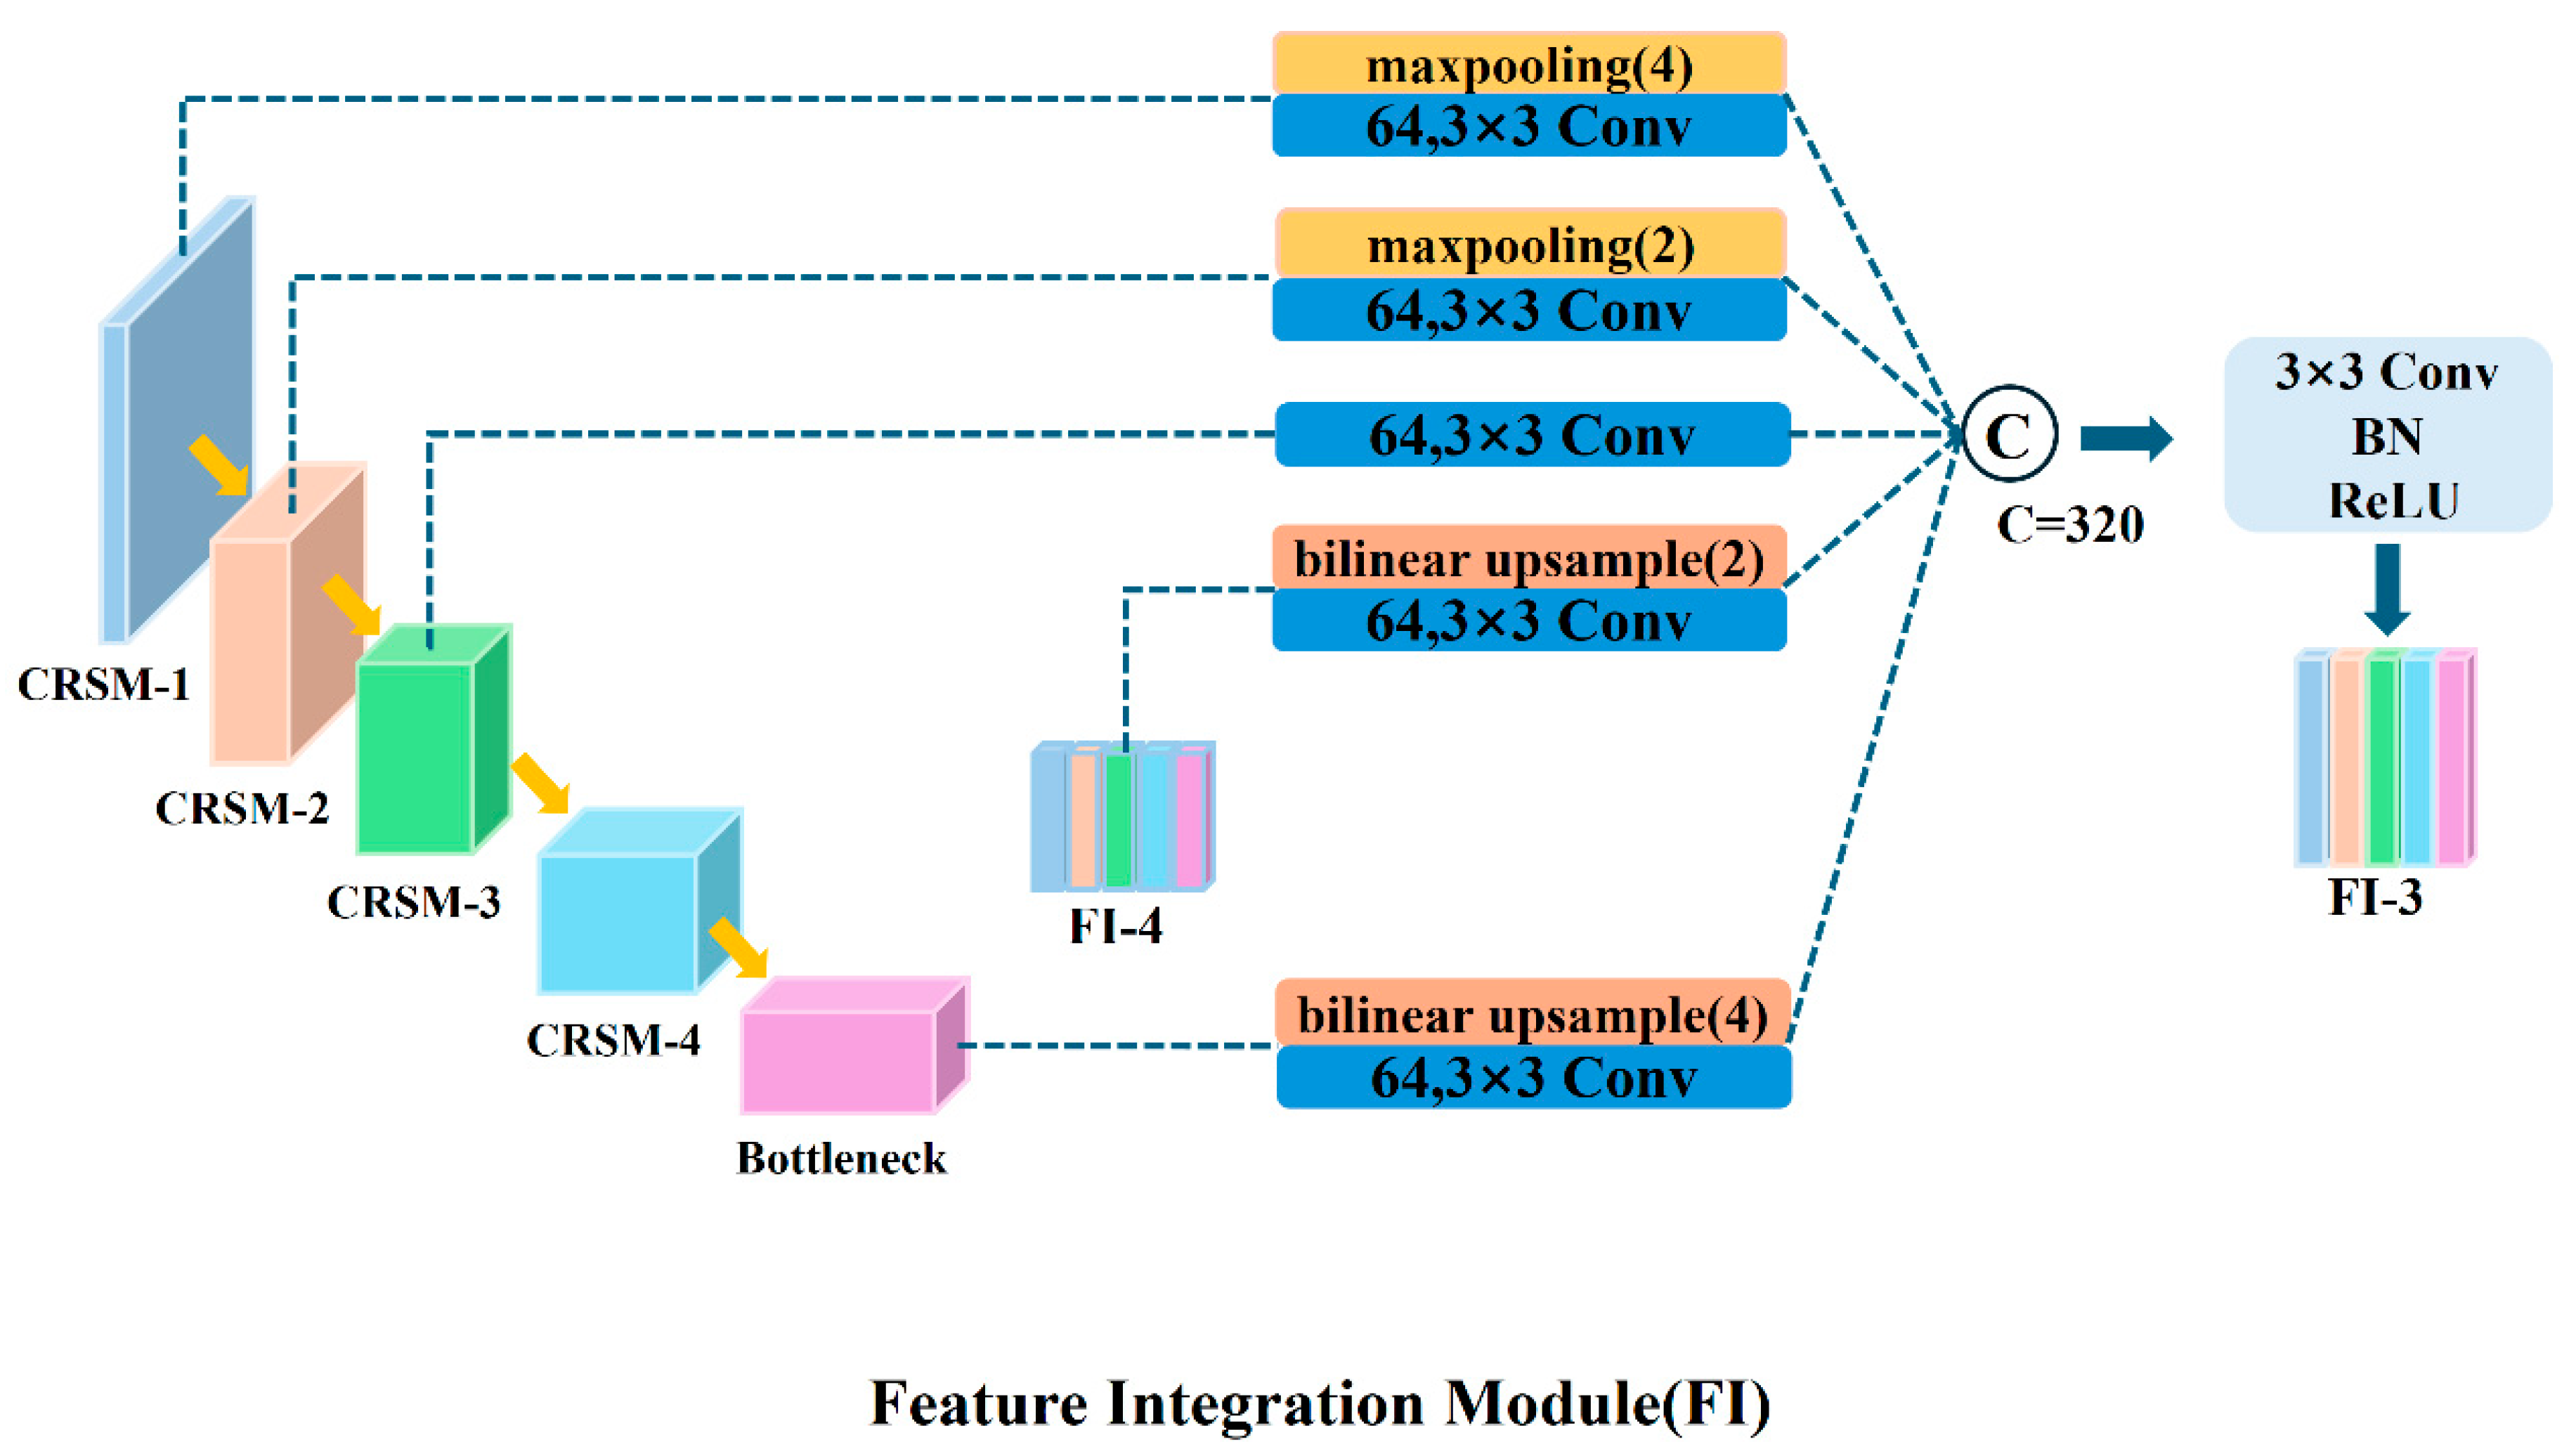
In the decoding part of the network, the FI module is used to extract multi-scale feature information, including small-scale features from the encoder, same-scale features, and large-scale features from the decoder. For larger-scale feature maps, the FI module uses max-pooling for downsampling; for smaller-scale feature maps, it uses bilinear interpolation for upsampling, thereby unifying all feature maps to the same scale. Subsequently, the FI module processes this multi-scale feature information through five convolutional layers with a kernel size of 3 × 3 and 64 channels. All features are concatenated and fused in the channel dimension, and the number of channels is uniformly adjusted to 320. Taking the decoding layer CBR-3 as an example, Figure 3 shows the specific process of how the FI-3 module integrates full-scale feature information. The decoding part of the network contains four decoding layers, each equipped with an FI module to ensure that it can fully fuse feature information from different scales. After the decoding process is completed, the fused feature information is sent to the CBR module, where it sequentially undergoes convolution, batch normalization, and ReLU activation operations, further enhancing the expression capability of the features.
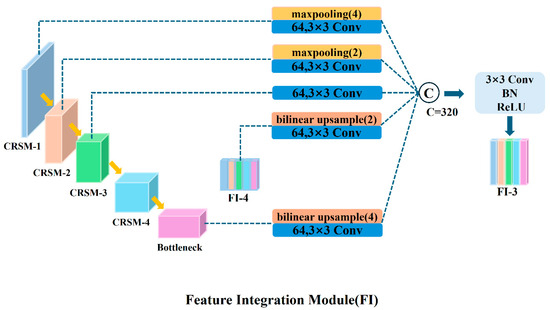
Figure 3.
Schematic diagram of full-scale feature integration of FI module.
For clarity in description, the five encoder layers in the network’s encoding path are sequentially designated as CRSM-1, CRSM-2, CRSM-3, CRSM-4, and Bottleneck, while the four decoder layers in the decoding path are correspondingly named CBR-1, CBR-2, CBR-3, and CBR-4. Each decoding layer’s feature scale is consistent with its corresponding encoding layer (CRSM-1 to CRSM-4). Table 1 provides a detailed list of the network’s structural order and the parameter configuration of each layer. The output of each layer is a three-dimensional tensor, with its dimensions represented in the table as , where and represent the height and width of the feature map, respectively, and represents the number of convolution kernels in that layer. During the encoding stage, where progressive extraction and compression of fringe detail features are critical, we strategically position the SEC module after the convolutional operations. Its channel attention mechanism effectively enhances the retention of key frequency-band information.

Table 1.
Structure and parameters of SEC-UNet3+.
3. Experiments
3.1. Experimental Environment and Network Parameter Settings
SEC-UNet3+ used Windows 10 as the system environment and completed its learning and training on the hardware environment of an NVIDIA GeForce RTX 3090 (24 GB), a Xeon Silver 4210R CPU (2.2 GHz), and 128 GB RAM, purchased in JINPIN, Tianjin, China. It employed TensorFlow 2.6.0 and Keras 2.6.0 as the deep learning frameworks and was configured with CUDA 11.2 and cuDNN 8.1 to support parallel computing.
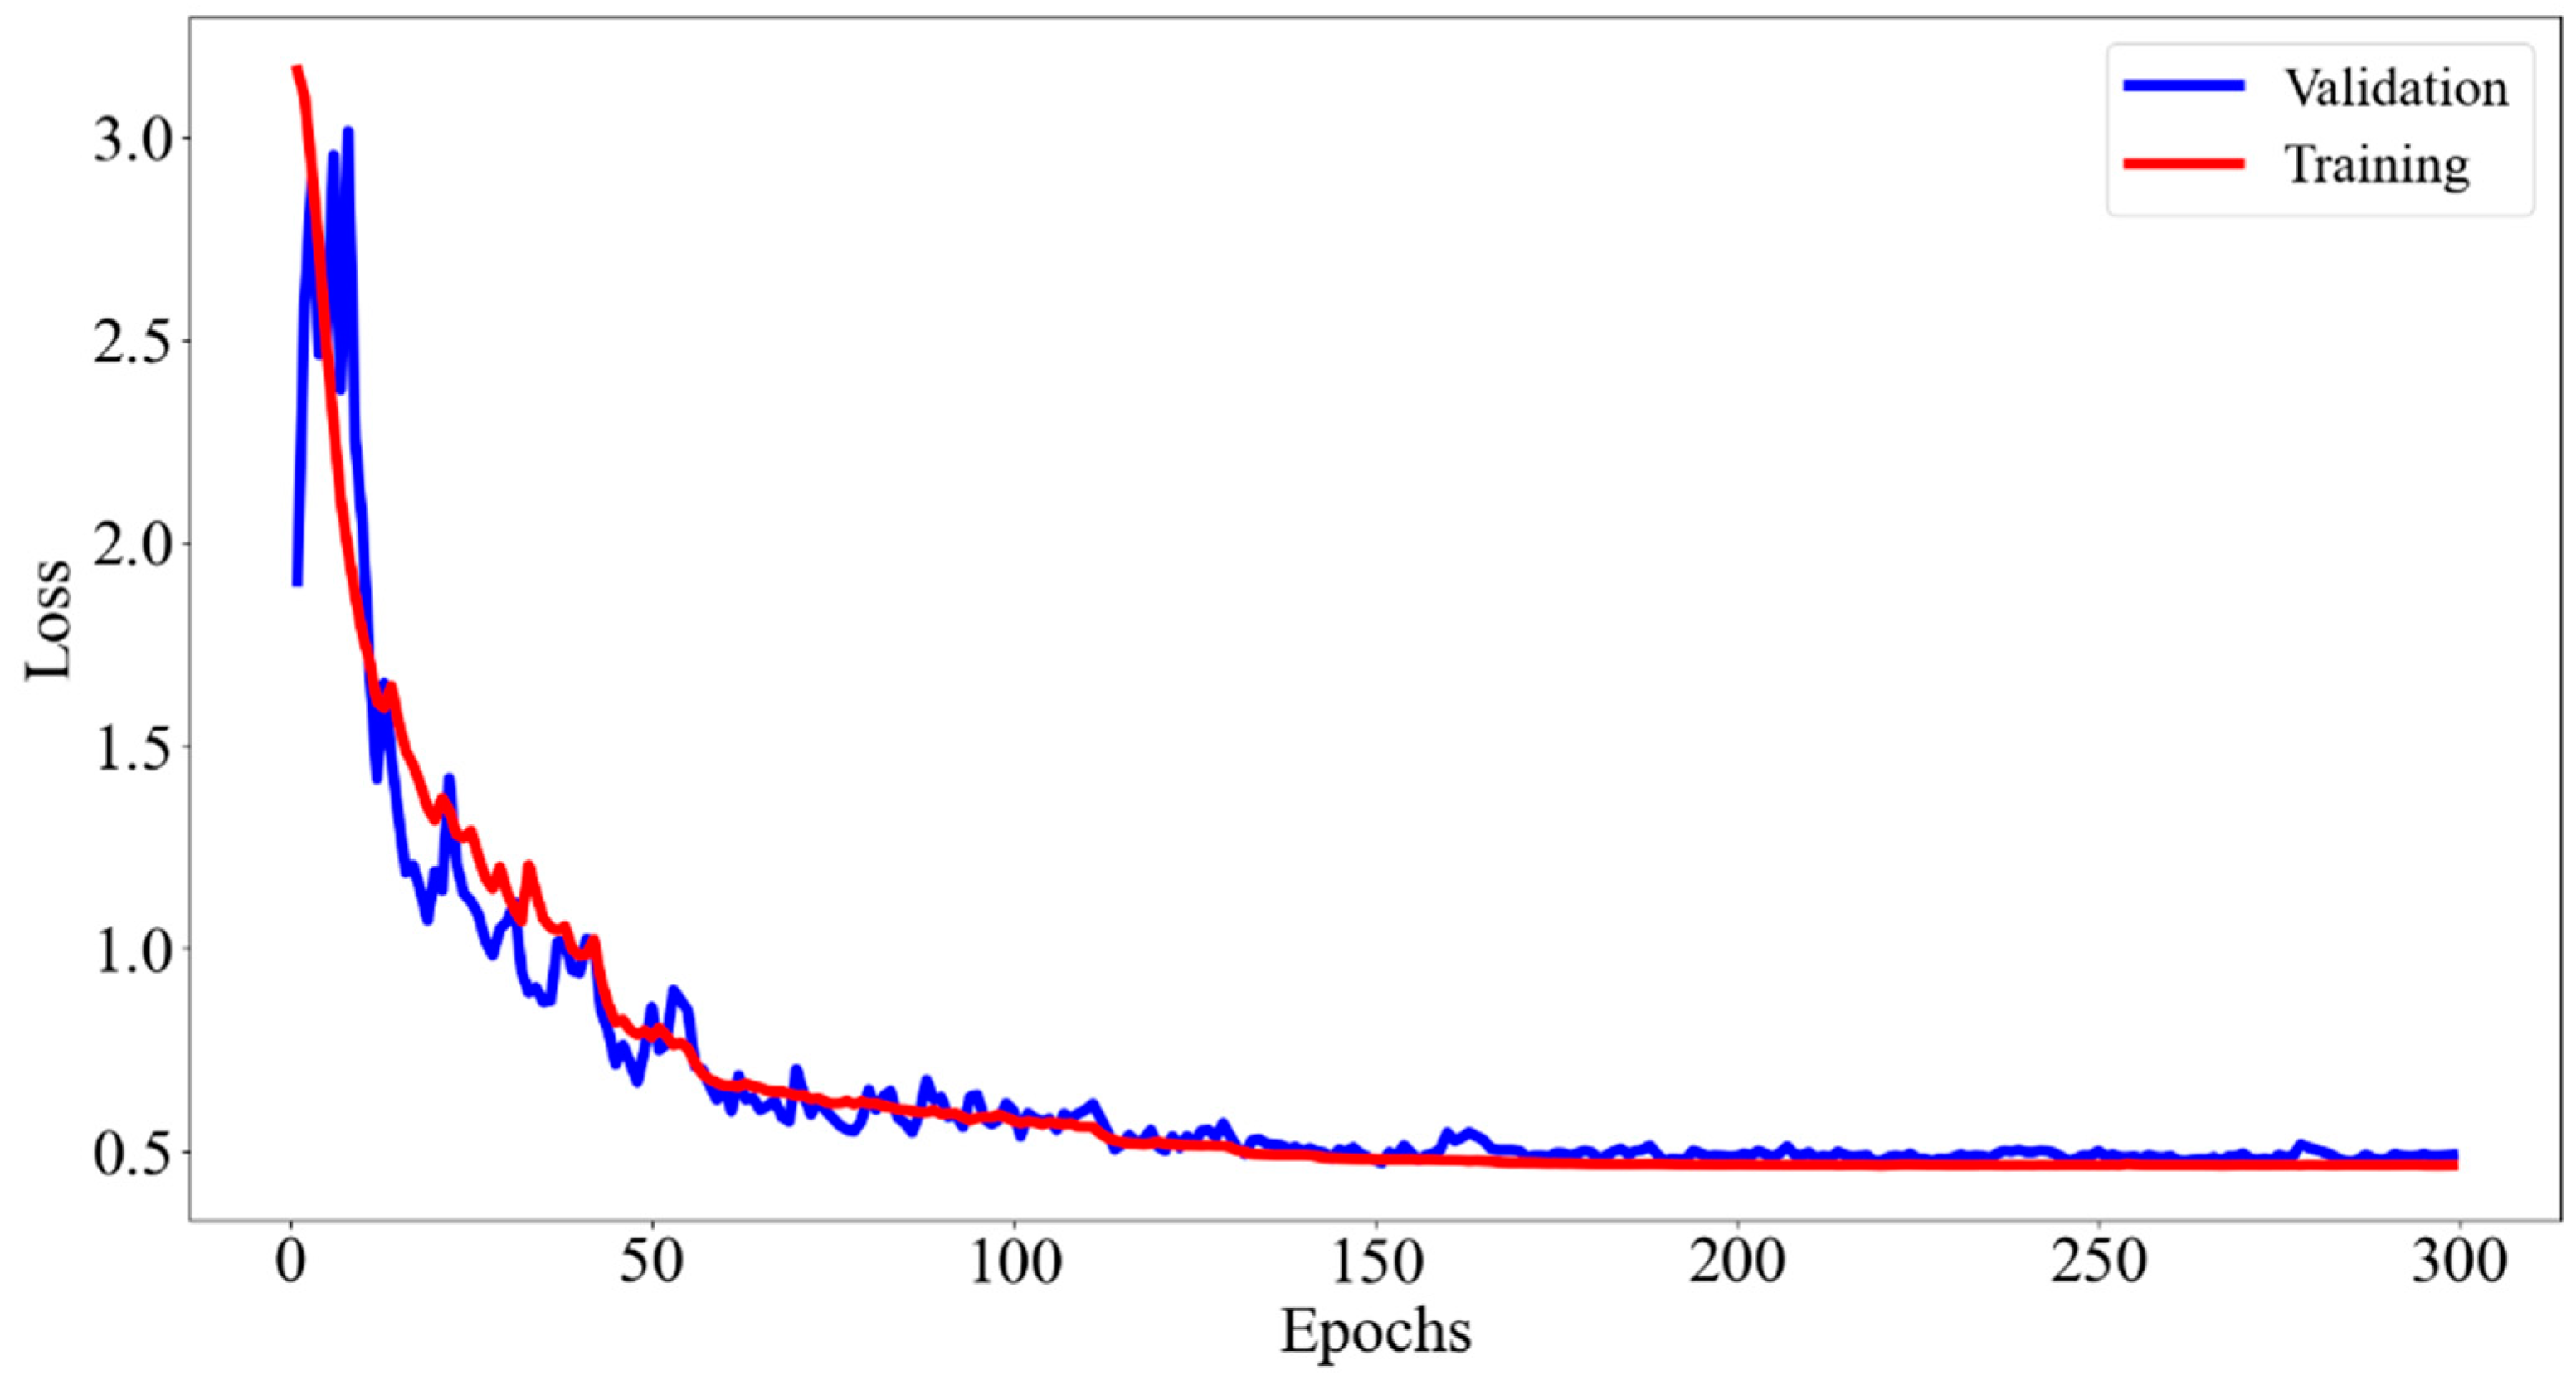
During the data preprocessing stage, the input single-shot fringe images were normalized, mapping the pixel values to the interval [0, 1] to accelerate the network’s training and convergence. The network training used the Adam optimizer, with an initial learning rate set to 1 × 10⁻³, a batch size of 2, and a training period of 300 epochs. The formula for calculating the loss function is as follows:
where represents the model’s parameter set, including weights, biases, convolution kernels, etc., and and represent the height and width of the pattern matrix, respectively. and represent the ground truth of the numerator and denominator terms of the wrapped phase arctangent function, respectively, while and are the numerator and denominator terms predicted by the neural network. Figure 4 shows the change in the training loss function curve. After 300 training epochs, the loss function curve gradually converged to a stable value, indicating that the model parameters were optimized to the best state and that the network training was completed.

Figure 4.
Training and validation loss curves of the network.
3.2. Evaluation Index
The mean square error (MSE), mean absolute error (MAE), and structural similarity index measure (SSIM) were used to measure the network performance. These indicators provide a comprehensive evaluation standard for the network from multiple dimensions, which could effectively measure the prediction accuracy and image quality of the model, as shown in Equations (6)–(8). MSE reflects the difference between the quantitative model prediction results and the ground truth by calculating the squared difference between the predicted value and the ground truth; MAE provides a visual assessment of prediction accuracy by calculating absolute errors; SSIM comprehensively evaluates the similarity between images from three dimensions of brightness, contrast, and structure, reflecting the perceptual effect of image quality.
where represents the ground truth of the wrapped phase of the -th fringe image, represents the predicted value of the wrapped phase of the -th fringe image, and is the total number of fringe image samples. and represent the average brightness of the ground truth and the predicted value , respectively, and are their variances, respectively, and represents their covariance. Constants and are introduced as very small constants to avoid division by zero.
3.3. Ablation Study
In FPP, the 3D profile information of the object can be extracted from the phase information, so the phase accuracy is the key index to measure the network performance. In order to comprehensively evaluate the performance of the algorithm, the wrapped phase diagram calculated by the multi-step phase shift method was used as the reference standard in the ablation experiment. Then, the neural network was used to predict the wrapped phase map, and the predicted result was compared with the ground truth to evaluate the prediction accuracy of the algorithm.
To systematically evaluate the synergistic gain effect of the full-scale connection method and the SEC module on model performance, this paper first compared the wrapped phase prediction accuracy of U-Net and UNet3+ to verify the effectiveness of the full-scale connection mechanism. In the U-Net architecture, UNet3+ introduces a full-scale connection mechanism, enabling each layer of the decoder to fuse features across all layers of the encoder, thereby constructing a multi-layer feature interaction network. To control experimental variables, both groups of models used exactly the same hyperparameter configuration and dataset partitioning strategy and continued training until the loss function converged. After the model training was completed, three scenes were randomly selected from the test set as test samples, which were input into the trained model to generate the corresponding wrapped phases. These test samples were strictly isolated during the training process and did not participate in any parameter updating to ensure the objectivity of the evaluation results. Figure 5a,b show the prediction results of U-Net and UNet3+, and Figure 6a,b visualize the error distribution of the prediction results. As can be seen from the figure, U-Net had a pronounced phase error aggregation in the plaster edge area (marked by red boxes in the figure), while UNet3+ showed better error control ability in the same area, showing higher geometric consistency in complex structures such as hair texture and facial contours.
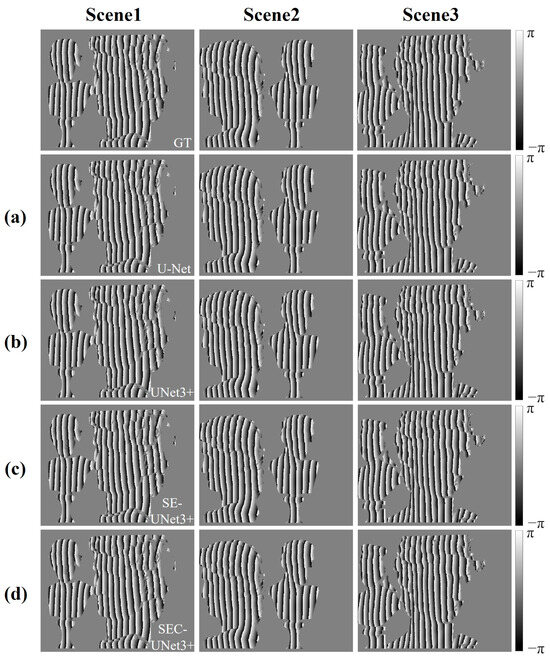
Figure 5.
The ground truth and prediction results of different models for the wrapped phase. For the three test scenarios, the first row presents the ground truth of wrapped phase distributions, and (a–d) are the prediction results of wrapped phase by U-Net, UNet3+, SE-UNet3+, and the proposed SEC-UNet3+ model, respectively.
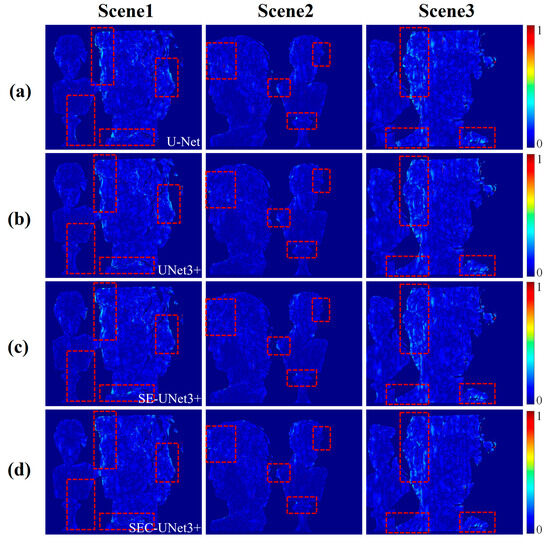
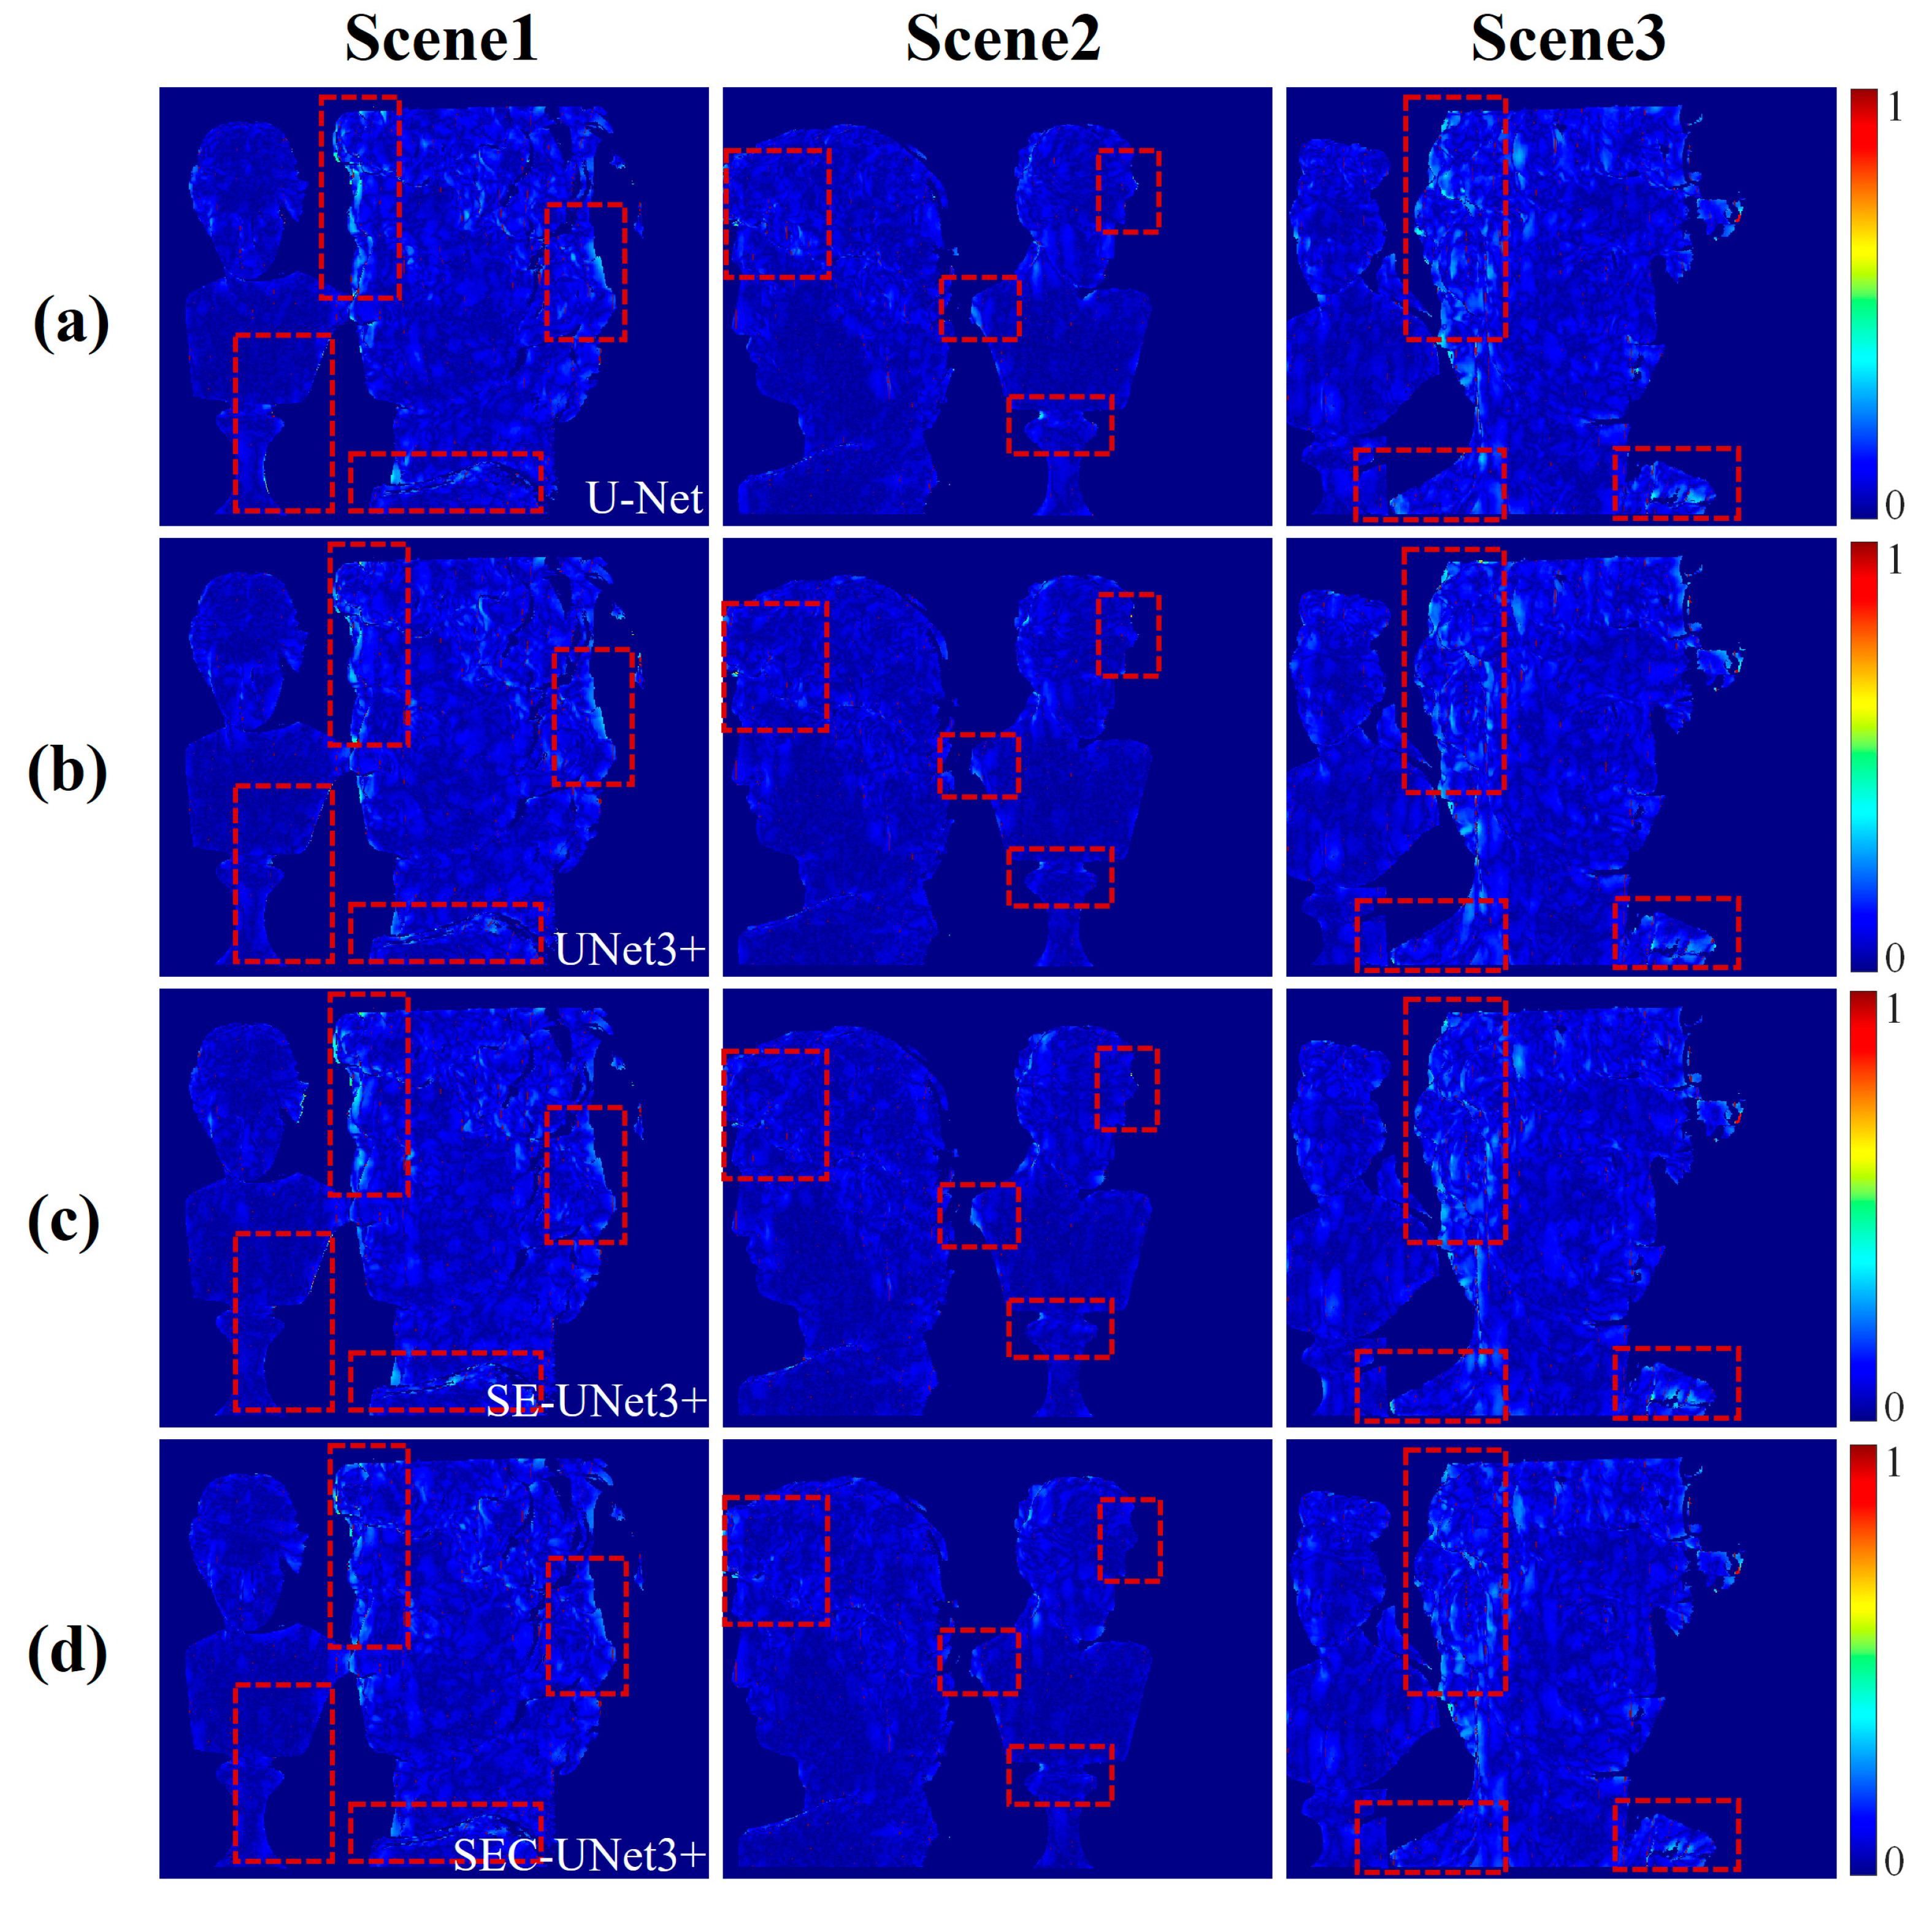
Figure 6.
Error distribution of prediction results from different models. In (a–d), the error distributions between the prediction results of U-Net, UNet3+, SE-UNet3+, and our proposed SEC-UNet3+ model and the ground truth are shown.
To facilitate comparison between the different models and eliminate scale differences, we normalized the errors, bringing their range into [0, 1]. The red dashed box in Figure 6 highlights the areas where the error changes were more significant. Table 2 compares the differences between the model prediction results and the ground truth through three indicators: MSE, MAE, and SSIM. The experimental results show that the MSE values of U-Net in the three scenarios were 0.1319, 0.0829, and 0.1555, respectively, while the MSE values of UNet3+ were 0.1197, 0.0689, and 0.1537, with an average error reduction of 9%. At the same time, the SSIM indicator of UNet3+ was also superior to that of U-Net, verifying the advantage of the full-scale connection mechanism in improving phase reconstruction accuracy.
Table 2.
Comparison of phase prediction errors of different models.
After validating the validity of the full-scale connection mechanism, this study further evaluated the independent contribution of the SEC module through ablation experiments. In this experiment, the SEC module was removed from SEC-UNET3+, and a baseline model UNet3+ was constructed that retained only the full-scale connection. The experiment adopted the previous test scenarios and evaluation indicators to ensure cross-experiment comparability. Figure 5b,d show the wrapped phase prediction results of UNet3+ and SEC-UNet3+, respectively, Figure 6b,d show the corresponding error distribution, and Table 2 summarizes the relevant evaluation indicators. The experimental data show that the MSE values of UNet3+ in the three test scenarios were 0.1197, 0.0689, and 0.1537, respectively, while the MSE values of SEC-UNet3+ were 0.1115, 0.0652, and 0.1464, with an average error reduction of about 5% compared to UNet3+. Comparing the error distributions, it can be seen that SEC-UNet3+ performed smoother in processing the edges of plaster, with further reduced errors. This performance improvement was mainly attributed to the role of the SEC module, which can adaptively learn the weight of each feature map channel, thereby enhancing useful features and suppressing useless features. Experiments have proven that the SEC module can continue to reduce phase prediction errors on the basis of full-scale connections.
To deeply analyze the design advantages of the SEC module, this paper also explored the optimization effect of introducing skip connection on the basis of the SE module by comparing the performance of the SE-UNet3+ and SEC-UNet3+ models. The prediction results are shown in Figure 5c,d. Combined with the error distributions in Figure 6c,d and the evaluation indicators in Table 2, it can be seen that the prediction accuracy of SE-UNet3+ did not improve due to the introduction of the SE module; instead, there was a decline in performance. This phenomenon may have come from the SE module’s feature compression mechanism. The SE module uses global average pooling to compress channel spatial information into a single scalar. This process can easily lose fine-grained image features. As a result, important detailed information may be lost. When the network re-weights feature maps with missing details, it might overcompensate for blurred or incomplete details. This overcompensation can weaken the network’s learning ability. Especially when dealing with fringe images with complex structures, the global average pooling of the SE module may over-focus on global features and ignore the expression of local details, while these local details are crucial for accurate phase extraction. In contrast, the SEC module effectively preserves local detail information by fusing the original feature map with the weighted feature map before feature compression, avoiding information loss during the feature compression process and achieving optimized integration of global and local features at different scales. This optimization dramatically strengthens the network’s performance in refined phase extraction. By optimizing the transmission of information flow, the SEC module enhances the processing capability of the network for complex images, thus improving the prediction accuracy of the wrapped phase, showing demonstrated superiority over the traditional SE module.
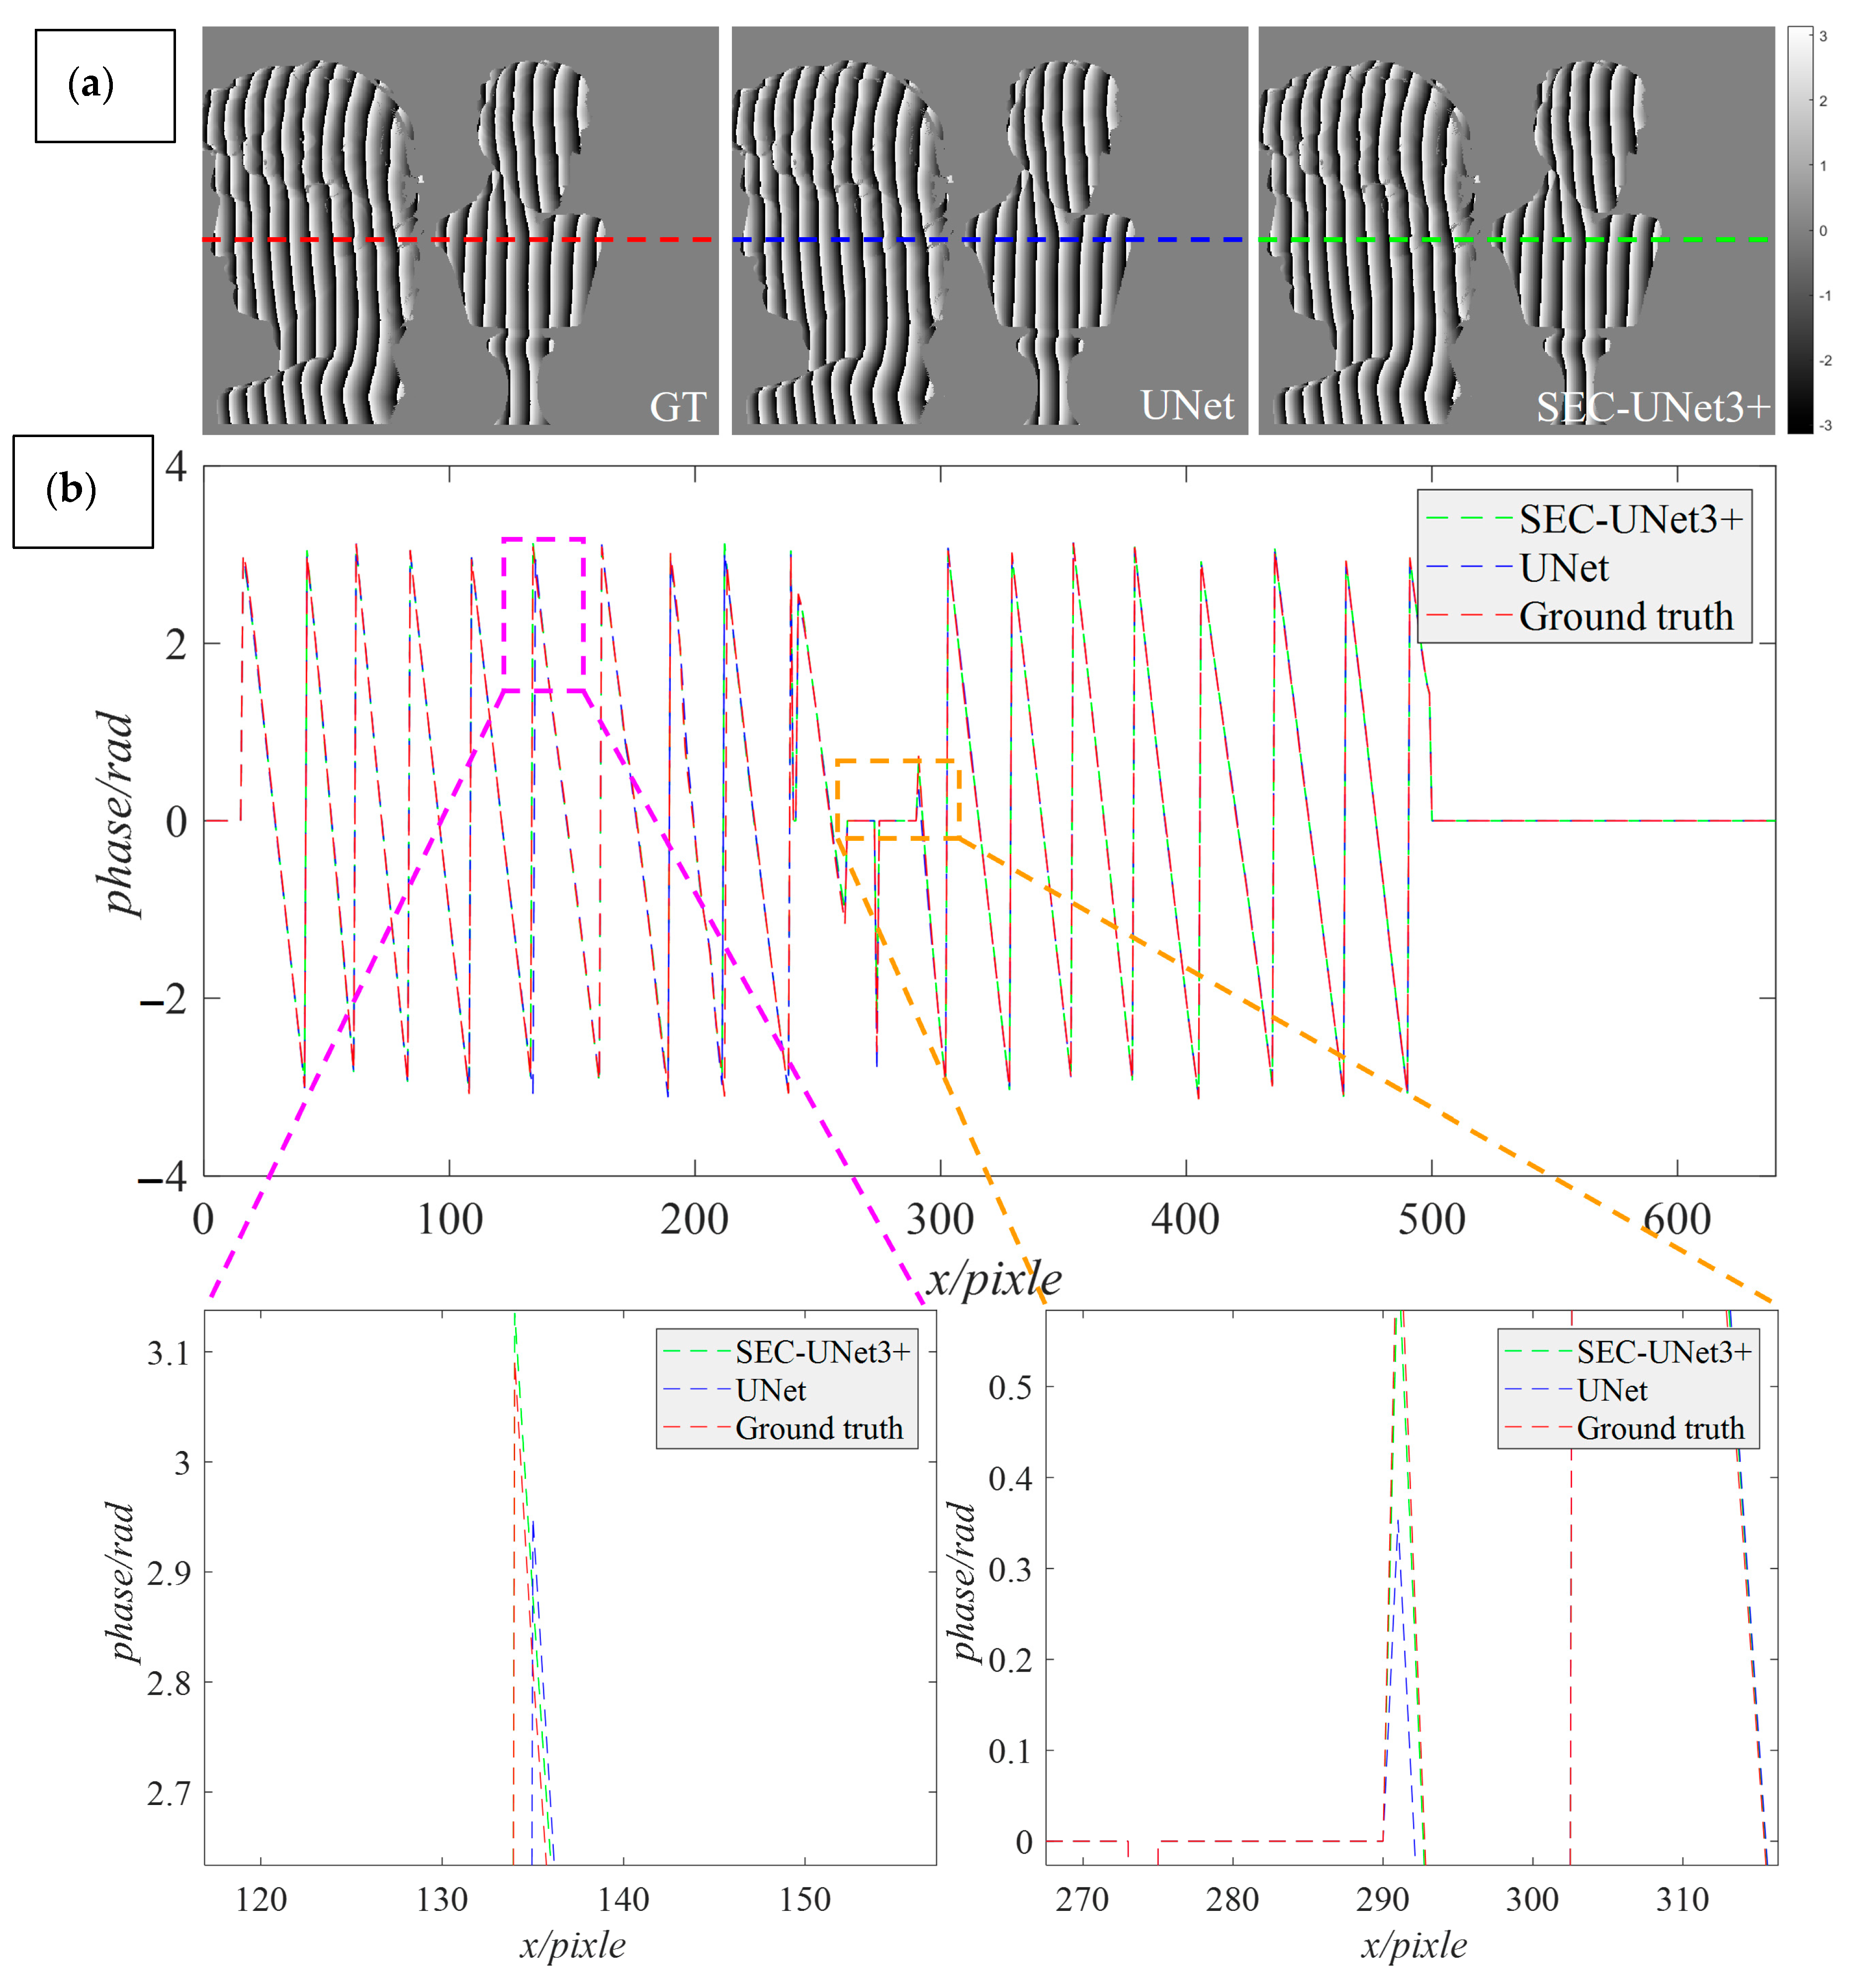
During the model architecture design stage, this study improved upon the widely applied U-Net architecture in the field of phase demodulation. To visually demonstrate the improvement effect, we visualized the difference in the wrapped phase distribution predicted by SEC-Unet3+ and U-Net. A scene was randomly selected from the test set as the test object, and the prediction results and data analysis are shown in Figure 7. Figure 7a shows the ground truth generated by the phase-shifting method and the wrapped phase maps predicted by the two models. We compared the data distribution of the middle row of the phase map, where the red, green, and blue dashed lines represent the prediction results of the different models, respectively, at the 240th row of data. To more clearly observe the local detail features, Figure 7b further enlarges the local details at that location.
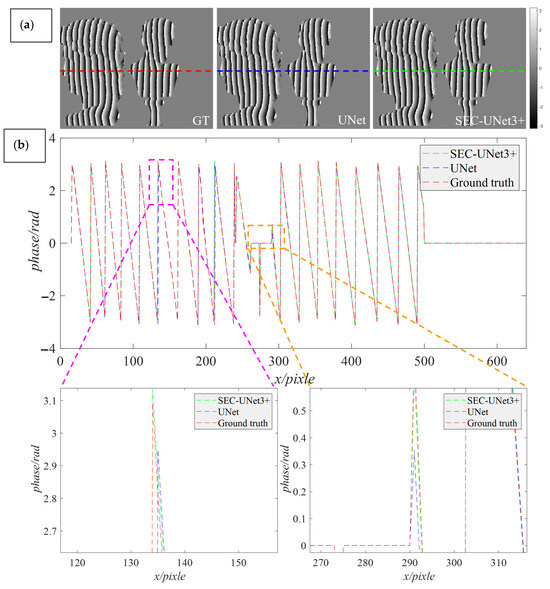
Figure 7.
Data analysis of prediction results by U-Net and SEC-UNet3+. (a) The ground truth of the wrapping phase and the predicted results of the two models; (b) The data analysis results of the wrapped phase predicted by the two models.
Through comparison, it was found that the green dashed line and the red dashed line showed a highly consistent trend, while the blue dashed line showed obvious deviations at some phase jump points. That is to say that SEC-UNet3+ exhibited significant superiority in terms of phase prediction accuracy, while U-Net had problems with phase distortion in complex areas. The analysis results show that when there were phase jumps and geometric discontinuities on the surface of the object, the prediction results of SEC-UNet3+ were closer to the ground truth, indicating that it has higher accuracy in handling complex areas. Figure 8a,b show the error distributions of the prediction results of U-Net and SEC-UNet3+, respectively, and some key detail areas have been enlarged. As can be seen from the figures, in the head of the plaster model and some areas with complex surfaces, the prediction results of U-Net showed obvious errors, while SEC-UNet3+ maintained a high prediction accuracy.
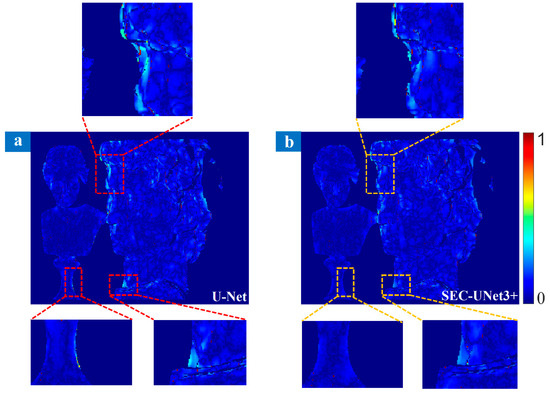
Figure 8.
Comparison of prediction errors between U-Net (a) and SEC-UNet3+ (b).
The quantitative analysis results are shown in Table 3. SEC-UNet3+ was superior to U-Net in all evaluation indicators, among which MSE and MAE were reduced by 15% and 10%, respectively. These experimental data fully prove that when facing objects with highly variable surfaces or complex shapes, SEC-UNet3+ has more excellent phase demodulation capability.
Table 3.
Comparison of phase prediction errors between U-Net and SEC-UNet3+.
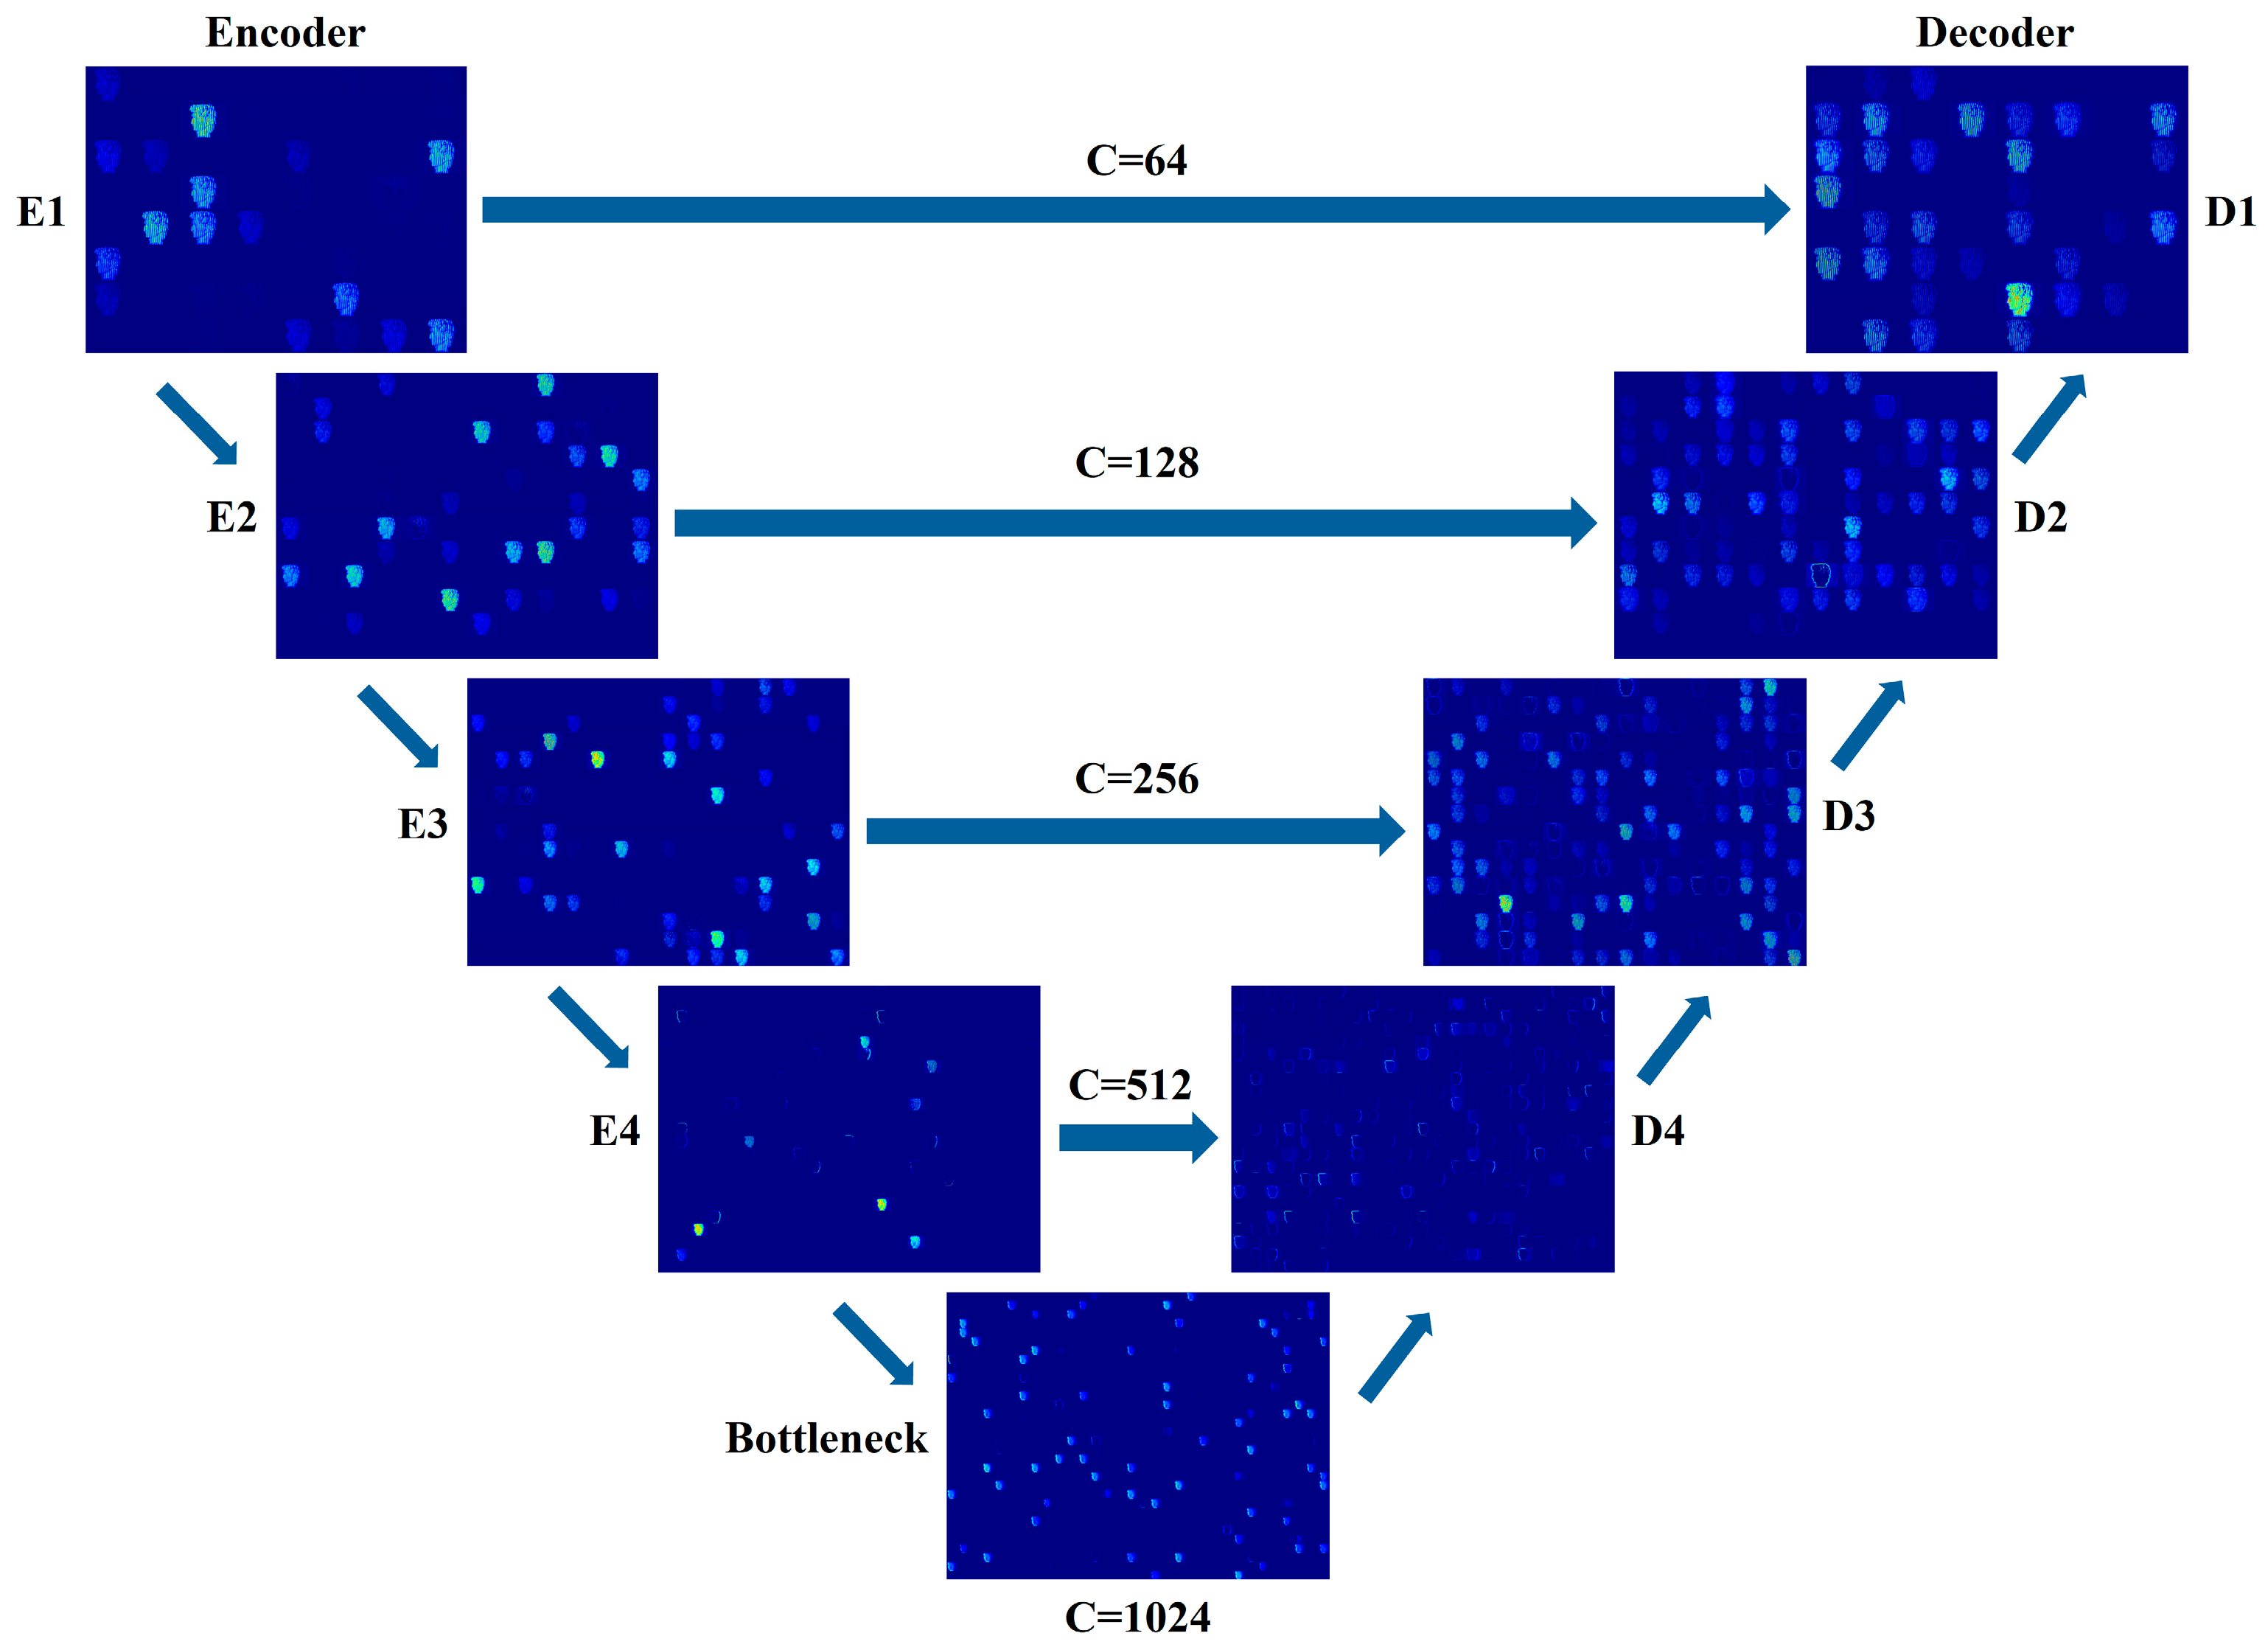
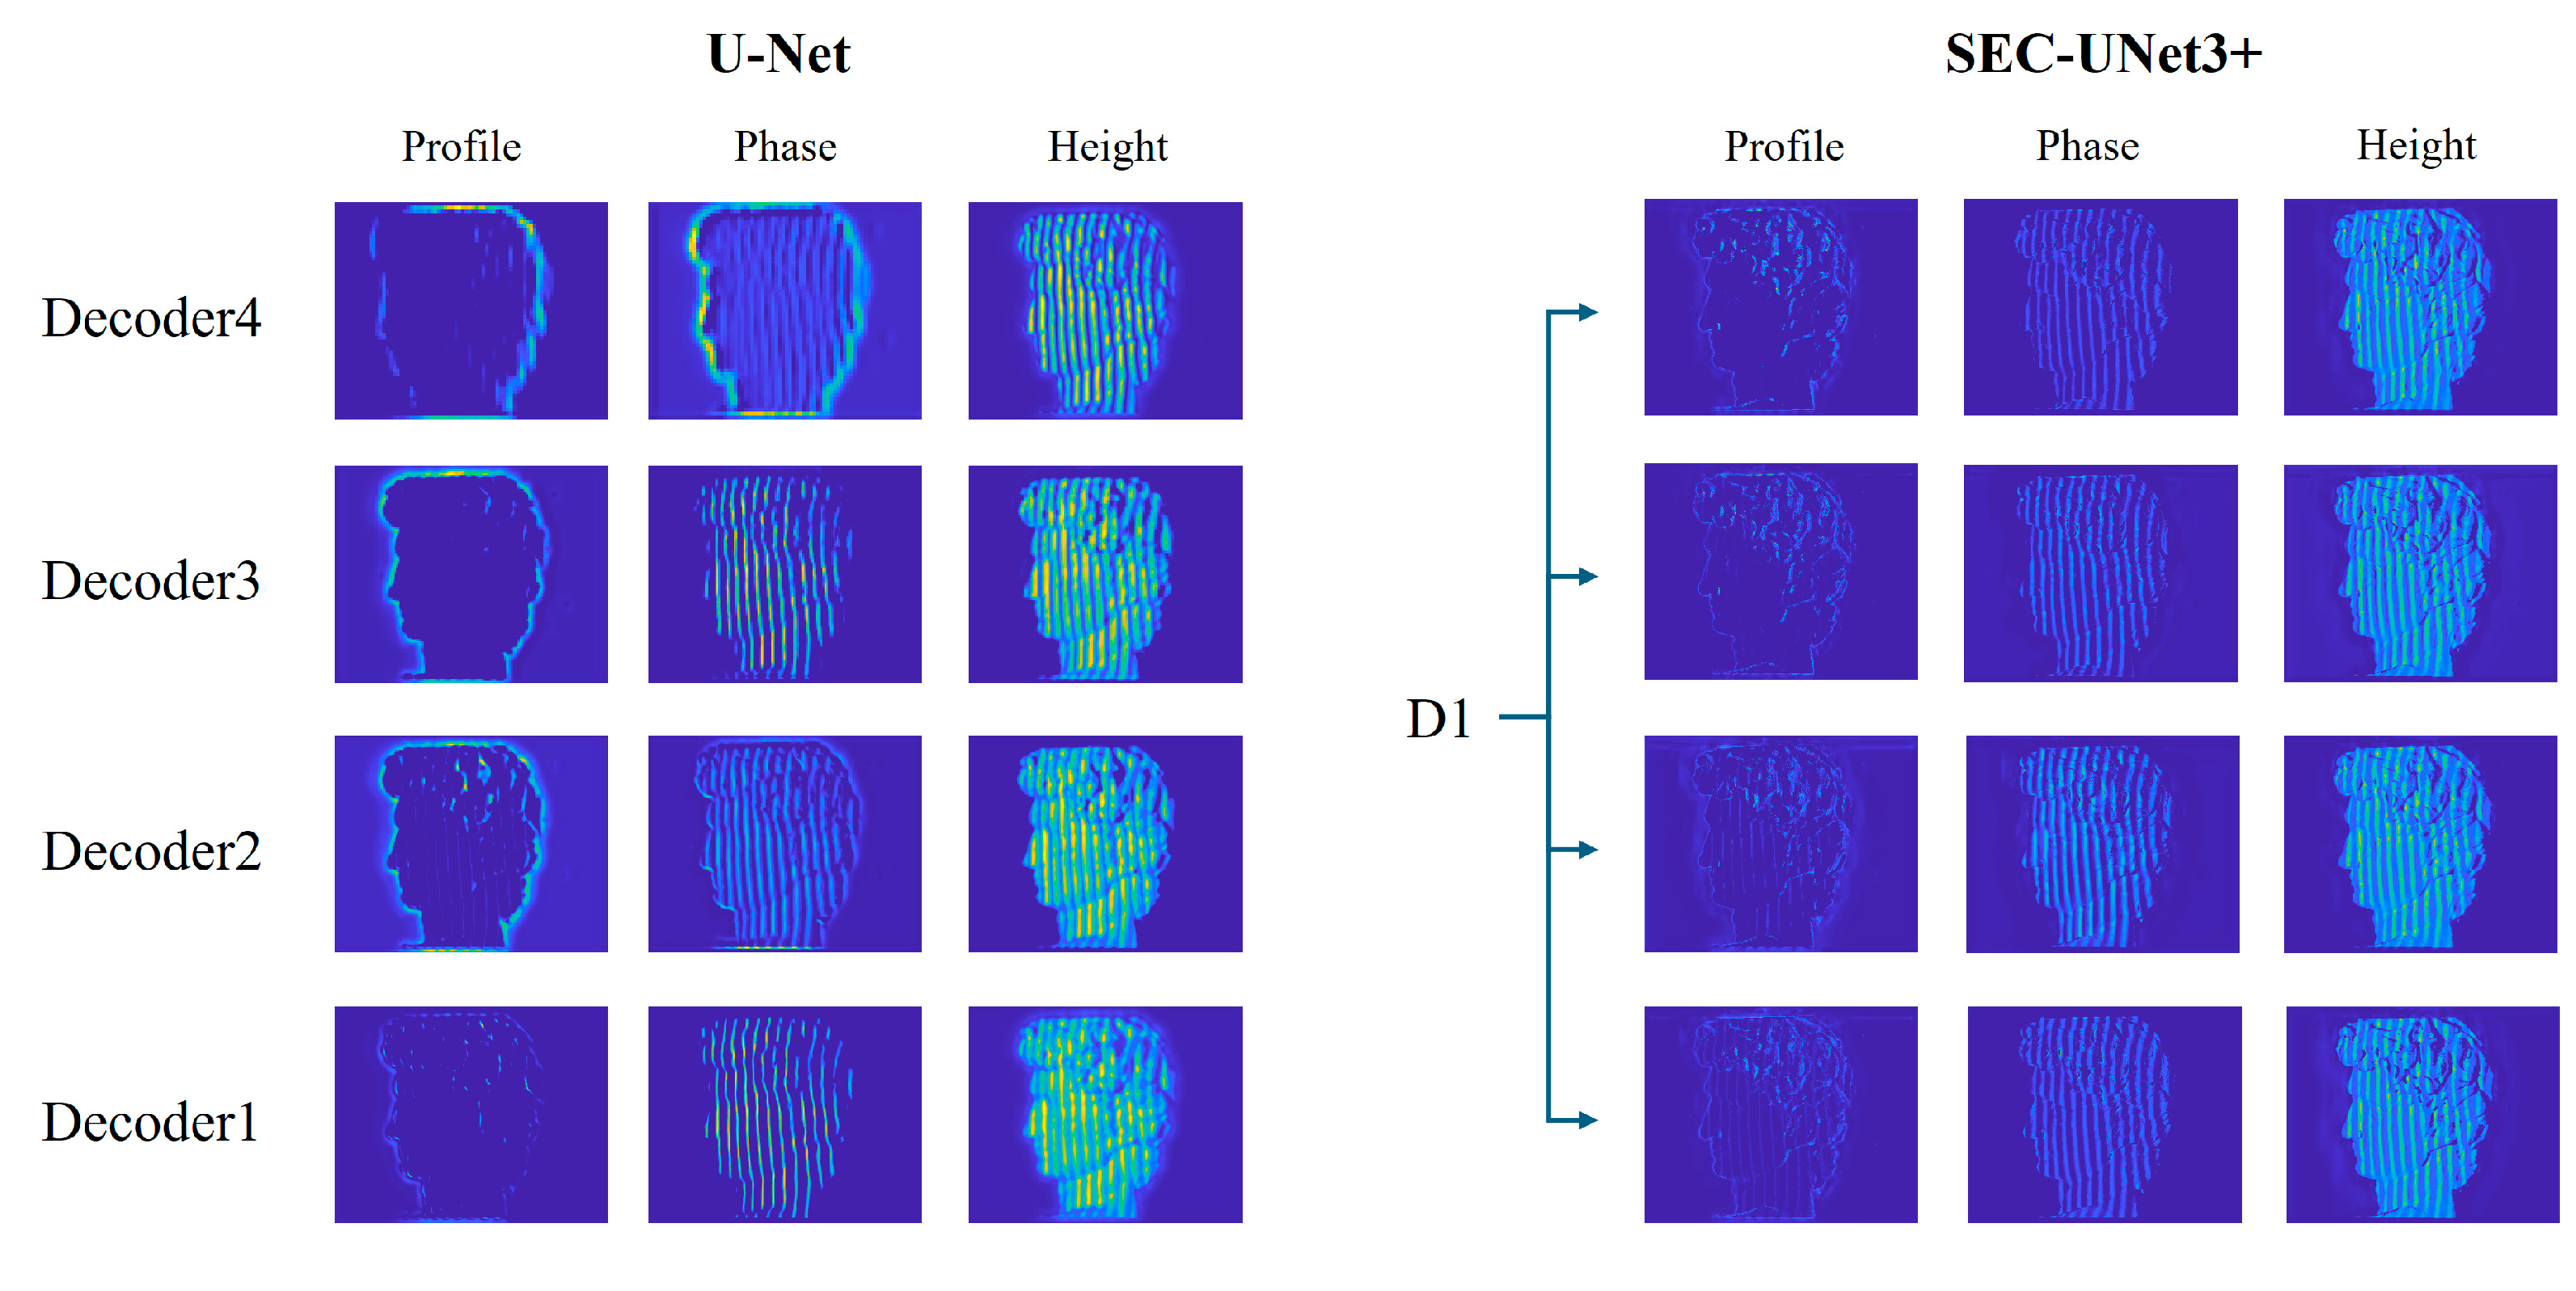
This study analyzed the feature expression capability of the model through cross-layer feature visualization to reveal the internal mechanism of the performance improvement of SEC-UNet3+. The results are shown in Figure 9. Some channel features were very clear, while others were almost invisible. This was because not all channels can extract effective features for each encoding layer. If the current input image lacks the features that the filter focuses on, then the output activation value will be close to zero, resulting in the channel appearing blank during visualization. The SEC module can perform more refined selection and amplification of effective information at the feature level, thereby optimizing the overall performance of the model. To facilitate the observation of the output features of different layer channels, some features of U-Net and SEC-UNet3+ were enlarged, and the last decoding layer of SEC-UNet3+ was compared with the decoding layer feature output of U-Net, as shown in Figure 10. All the features can be roughly divided into three categories: profile features, phase features, and surface height features. This study found that in the profile features, the U-Net model was limited to a single scale and only captured the outermost profile information of the image, lacking fine-grained features, while the profile features of SEC-UNet3+ not only contained rich fine-grained information but also integrated some phase information, indicating that at least two features were fused. In the phase features, the phase information extracted by SEC-UNet3+ was clearer and more visible than that of U-Net. This advantage was due to the multi-layer feature fusion capability of the full-scale connection mechanism, which enables the model to capture local phase gradients and global phase distribution rules at the same time, thereby achieving more accurate modeling of complex surface morphologies.

Figure 9.
Cross-layer feature visualization.
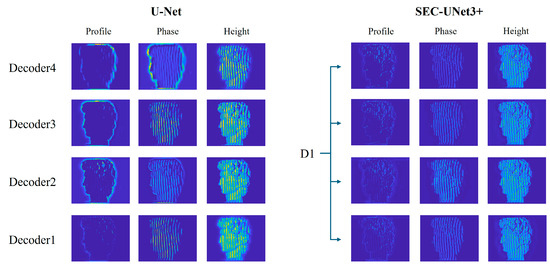
Figure 10.
Feature visualization comparison between U-Net and UNet3+.
To verify the feasibility of the method proposed in this paper, this study compared SEC-UNet3+ with traditional FT and multi-step phase-shifting methods. Traditional phase demodulation methods often fail to guarantee accuracy when dealing with objects with complex surface textures or highly abrupt changes. For this reason, we chose a plaster bust model with a complex surface structure as the experimental object and analyzed it using Scene1 as an example. In the experiment, we compared the wrapped phases obtained by SEC-UNet3+ and the FT method with the ground truth. As shown in Table 4, the ground truth of wrapped phase was obtained through the three-step phase-shifting method. The experimental data show that the prediction error of SEC-UNet3+ was about one-fifth of that of the FT method, which was significantly better than traditional methods.
Table 4.
Comparison of phase prediction errors between FT and SEC-UNet3+.
Finally, a comparative analysis was conducted with the existing model SE-FSCNet [38] to comprehensively evaluate the advanced nature of the SEC-UNet3+ model, as shown in Figure 11. Similarly, some regional details have been enlarged, and it can be seen that our model exhibited smaller prediction errors in the edge area of the plaster model. Based on the same evaluation index system, Table 5 compares the prediction accuracy of the method in this paper with SE-FSCNet in detail.
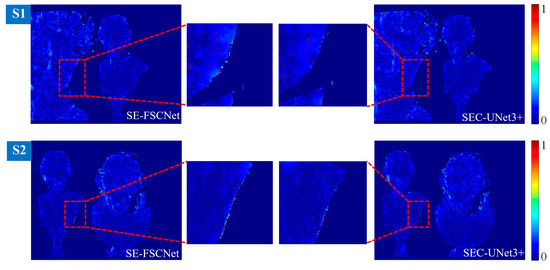
Figure 11.
Prediction error comparison between SE-FSCNet and SEC-UNet3+.
Table 5.
Comparison of phase prediction errors between SE-FSCNet and SEC-UNet3+.
The MSE, MAE, and SSIM indicators of the two scenes predicted by SE-FSCNet were 0.1003, 0.0373, and 0.9601 and 0.0719, 0.0255, and 0.9718, respectively, and the prediction results of our model were 0.0983, 0.0366, and 0.9620 and 0.0695, 0.0249, and 0.9734, respectively. The experimental results show that compared with SE-FSCNet, our prediction errors were slightly reduced, which verifies the superiority of our model.
4. Conclusions and Discussion
This paper proposes a single-shot fringe image wrapped phase extraction scheme based on the SEC-UNet3+ architecture, which innovatively integrates the advantages of the full-scale connection mechanism and the SEC module. By combining the optimized SEC module with the full-scale connection network, the model’s wrapped phase extraction accuracy in complex scenarios is improved. The ablation study demonstrated that the full-scale connection mechanism reduced the MSE of the wrapped phase prediction by approximately 10% through cross-layer feature fusion. Furthermore, the incorporation of the SEC module achieved an additional 5% error reduction via channel-attention-guided feature recalibration, validating the effectiveness of modular co-optimization. Compared with traditional methods, the proposed model only needs a single-shot fringe modulated image as input, achieving a balance between computational efficiency and extraction accuracy. The experimental results on real datasets show that SEC-UNet3+ exhibited excellent wrapped phase extraction capabilities when dealing with objects with complex surface features. Its comprehensive performance was superior to traditional FT methods and existing mainstream models based on U-Net, and the phase extraction accuracy was close to that of the multi-step phase-shifting method. Currently, only a handful of studies have implemented full-scale connected networks in FPP research. While innovation in FPP measurement methodologies remains crucial, breakthroughs in network architecture are equally indispensable.
Wrapped phase extraction from single-shot fringe images will remain a crucial research direction, as existing methods still require improvements in both measurement accuracy and computational efficiency. Meanwhile, deep-learning-based FPP approaches often face challenges regarding model interpretability, which has motivated researchers to integrate physical prior knowledge into neural network architectures and guide model training through physical constraints. This physics-informed paradigm shift effectively addresses the reliability concerns of traditional black-box models in critical applications, such as industrial inspection. In the future, we will focus on developing physics-informed, lightweight network architectures, high-precision wrapped phase extraction algorithms, and real-time processing acceleration schemes to advance FPP.
Author Contributions
Conceptualization, R.C. and L.D.; methodology, R.C. and Y.X.; software, W.L. and W.G.; validation, Z.X. and X.H.; formal analysis, R.C.; investigation, Y.H.; writing—original draft preparation, R.C.; writing—review and editing, Z.X.; funding acquisition, L.D. All authors have read and agreed to the published version of the manuscript.
Funding
This research was funded by National Natural Science Foundation of China (12264018, 12264017), Natural Science Foundation of Jiangxi Province (20224BAB201029), Top-Notch Young Talents Program of Jiangxi Science and Technology Normal University (2023QNBJRC003), and Research Program of Jiangxi Science and Technology Normal University (2019XJZD003).
Data Availability Statement
Data underlying the results presented in this paper are not publicly available at this time but may be obtained from the authors upon reasonable request.
Conflicts of Interest
The authors declare no conflicts of interest.
References
- Zhang, S. Recent progresses on real-time 3D shape measurement using digital fringe projection techniques. Opt. Lasers Eng. 2010, 48, 149–158. [Google Scholar] [CrossRef]
- Feng, S.; Zhang, L.; Zuo, C.; Tao, T.; Chen, Q.; Gu, G. High dynamic range 3d measurements with fringe projection profilometry: A review. Meas. Sci. Technol. 2018, 29, 122001. [Google Scholar] [CrossRef]
- Wan, Y.; Cao, Y.; Liu, X.; Tao, T.; Kofman, J. High-frequency color-encoded fringe-projection profilometry based on geometry constraint for large depth range. Opt. Express. 2020, 28, 13043–13058. [Google Scholar] [CrossRef] [PubMed]
- Qi, Z.; Wang, Z.; Huang, J.; Xue, Q.; Gao, J. Improving the quality of stripes in structured-light three-dimensional profile measurement. Opt. Eng. 2017, 56, 031208. [Google Scholar] [CrossRef]
- Xue, J.; Zhang, Q.; Li, C.; Lang, W.; Wang, M.; Hu, Y. 3D face profilometry based on galvanometer scanner with infrared fringe projection in high speed. Appl. Sci. 2019, 9, 1458. [Google Scholar] [CrossRef]
- Wang, M.; Zhang, Q.; Li, Q.; Wu, Z.; Chen, C.; Xu, J.; Xue, J. Research on morphology detection of metal additive manufacturing process based on fringe projection and binocular vision. Appl. Sci. 2022, 12, 9232. [Google Scholar] [CrossRef]
- Meza, J.; Simarra, P.; Contreras-Ojeda, S.; Romere, L.A.; Contreras-Ortiz, S.H.; Cosío, F.A.; Marrugo, A.G. A low-cost multi-modal medical imaging system with fringe projection profilometry and 3D freehand ultrasound. In Proceedings of the 15th International Symposium on Medical Information Processing and Analysis, Medelin, Colombia, 6–8 November 2019; pp. 14–26. [Google Scholar] [CrossRef]
- Tan, J.; Niu, H.; Su, W.; He, Z. Structured light 3D shape measurement for translucent media base on deep Bayesian inference. Opt. Laser Technol. 2025, 181, 111758. [Google Scholar] [CrossRef]
- Zuo, C.; Feng, S.; Huang, L.; Tao, T.; Yin, W.; Chen, Q. Phase shifting algorithms for fringe projection profilometry: A review. Opt. Lasers Eng. 2018, 109, 23–59. [Google Scholar] [CrossRef]
- Wang, J.; Yang, Y. Triple N-step phase shift algorithm for phase error compensation in fringe projection profilometry. IEEE Trans. Instrum. Meas. 2021, 70, 7006509. [Google Scholar] [CrossRef]
- Wu, H.; Cao, Y.; An, H.; Li, H.; Xu, C.; Yang, N. A novel phase-shifting profilometry to realize temporal phase unwrapping simultaneously with the least fringe patterns. Opt. Lasers Eng. 2022, 153, 107004. [Google Scholar] [CrossRef]
- Wan, Y.; Cao, Y.; Kofman, J. High-accuracy 3D surface measurement using hybrid multi-frequency composite-pattern temporal phase unwrapping. Opt. Express. 2020, 28, 39165–39180. [Google Scholar] [CrossRef] [PubMed]
- Takeda, M.; Mutoh, K. Fourier transform profilometry for the automatic measurement of 3-D object shapes. Appl. Opt. 1983, 22, 3977–3982. [Google Scholar] [CrossRef]
- Li, Z.; Liu, F.; Yang, W.; Peng, S.; Zhou, J. A survey of convolutional neural networks: Analysis, applications, and prospects. IEEE Trans. Neural Netw. Learn. Syst. 2021, 33, 6999–7019. [Google Scholar] [CrossRef]
- Shelhamer, E.; Long, J.; Darrell, T. Fully convolutional networks for semantic segmentation. IEEE Trans. Pattern Anal. Mach. Intell. 2016, 39, 640–651. [Google Scholar] [CrossRef] [PubMed]
- Ronneberger, O.; Fischer, P.; Brox, T. U-net: Convolutional networks for biomedical image segmentation. In Medical Image Computing and Computer-Assisted Intervention, Proceedings of the MICCAI 2015: 18th International Conference, Munich, Germany, 5–9 October 2015; Springer: Berlin/Heidelberg, Germany, 2015; pp. 234–241. [Google Scholar] [CrossRef]
- Goodfellow, I.; Pouget-Abadie, J.; Mirza, M.; Xu, B.; Warde-Farley, D.; Ozair, S.; Courville, A.; Bengio, Y. Generative adversarial networks. Commun. ACM 2020, 63, 139–144. [Google Scholar] [CrossRef]
- Li, B.; Chen, Z.; Lu, L.; Zhang, L.; Ma, Q.; Hu, H.; Zhai, J.; Li, X. Cascaded frameworks in underwater optical image restoration. Inf. Fusion 2025, 117, 102809. [Google Scholar] [CrossRef]
- Wu, G.; Yang, T.; Liu, F.; Qian, K. Suppressing motion-induced phase error by using equal-step phase-shifting algorithms in fringe projection profilometry. Opt. Express. 2022, 30, 17980–17998. [Google Scholar] [CrossRef]
- Qiu, J.; Liu, G.; Xi, D.; Wu, G. LUT-based phase error compensation method for large-step phase-shifting algorithm in DLP4500-based FPP system. Opt. Express. 2024, 32, 39600–39622. [Google Scholar] [CrossRef]
- Tan, J.; Liu, J.; Wang, X.; He, Z.; Su, W.; Huang, T.; Xie, S. Large depth range binary-focusing projection 3D shape reconstruction via unpaired data learning. Opt. Lasers Eng. 2024, 181, 108442. [Google Scholar] [CrossRef]
- Li, Y.; Qian, J.; Feng, S.; Chen, Q.; Zuo, C. Deep-learning-enabled dual-frequency composite fringe projection profilometry for single-shot absolute 3D shape measurement. Opto-Electron. Adv. 2022, 5, 210021. [Google Scholar] [CrossRef]
- van der Jeught, S.; Dirckx, J.J.J. Deep neural networks for single shot structured light profilometry. Opt. Express. 2019, 27, 17091–17101. [Google Scholar] [CrossRef] [PubMed]
- Li, W.; Yu, J.; Gai, S.; Da, F. Absolute phase retrieval for a single-shot fringe projection profilometry based on deep learning. Opt. Eng. 2021, 60, 064104. [Google Scholar] [CrossRef]
- Nguyen, H.; Novak, E.; Wang, Z. Accurate 3D reconstruction via fringe-to-phase network. Measurement 2022, 190, 110663. [Google Scholar] [CrossRef]
- Spoorthi, G.E.; Gorthi, S.; Gorthi, R.K.S.S. PhaseNet: A deep convolutional neural network for two-dimensional phase unwrapping. IEEE Signal Process Lett. 2018, 26, 54–58. [Google Scholar] [CrossRef]
- Yin, W.; Chen, Q.; Feng, S.; Tao, T.; Huang, L.; Trusiak, M.; Asundi, A.; Zuo, C. Temporal phase unwrapping using deep learning. Sci. Rep. 2019, 9, 20175. [Google Scholar] [CrossRef] [PubMed]
- Wang, K.; Li, Y.; Kemao, Q.; Di, J.; Zhao, J. One-step robust deep learning phase unwrapping. Opt. Express. 2019, 27, 15100–15115. [Google Scholar] [CrossRef] [PubMed]
- Yao, P.; Gai, S.; Chen, Y.; Chen, W.; Da, F. A multi-code 3D measurement technique based on deep learning. Opt. Lasers Eng. 2021, 143, 106623. [Google Scholar] [CrossRef]
- Zhao, J.; Liu, L.; Wang, T.; Wang, X.; Du, X.; Hao, R.; Liu, J.; Liu, Y.; Zhang, J. VDE-Net: A two-stage deep learning method for phase unwrapping. Opt. Express. 2022, 30, 39794–39815. [Google Scholar] [CrossRef]
- Zhang, J.; Li, Q. EESANet: Edge-enhanced self-attention network for two-dimensional phase unwrapping. Opt. Express. 2022, 30, 10470–10490. [Google Scholar] [CrossRef]
- Tangy, Y.; Chen, W.; Su, X.; Xiang, L. Neural network applied to reconstruction of complex objects based on fringe projection. Opt. Commun. 2007, 278, 274–278. [Google Scholar] [CrossRef]
- Feng, S.; Chen, Q.; Gu, G.; Tao, T.; Zhang, L.; Hu, Y.; Yin, W.; Zuo, C. Fringe pattern analysis using deep learning. Adv. Photonics 2019, 1, 025001. [Google Scholar] [CrossRef]
- Feng, S.; Zuo, C.; Chen, Q. High-speed 3D measurements at 20,000 Hz with deep convolutional neural networks. In Optical Metrology and Inspection for Industrial Applications VI; SPIE: Hangzhou, China, 2019; pp. 176–183. [Google Scholar] [CrossRef]
- Yang, C.; Yin, W.; Xu, H.; Li, J.; Feng, S.; Tao, T.; Chen, Q.; Zuo, C. Single-shot 3D shape measurement with spatial frequency multiplexing using deep learning. In Optical Metrology and Inspection for Industrial Applications VI; SPIE: Hangzhou, China, 2019; pp. 334–339. [Google Scholar] [CrossRef]
- Yang, T.; Zhang, Z.; Li, H.; Li, X.; Zhou, X. Single-shot phase extraction for fringe projection profilometry using deep convolutional generative adversarial network. Meas. Sci. Technol. 2020, 32, 015007. [Google Scholar] [CrossRef]
- Nguyen, H.; Wang, Y.; Wang, Z. Single-shot 3D shape reconstruction using structured light and deep convolutional neural networks. Sensors 2020, 20, 3718. [Google Scholar] [CrossRef] [PubMed]
- Song, Z.; Xue, J.; Lu, W.; Jia, R.; Xu, Z.; Yu, C. SE-FSCNet: Full-scale connection network for single-shot phase demodulation. Opt. Express. 2024, 32, 15295–15314. [Google Scholar] [CrossRef]
- Huang, H.; Lin, L.; Tong, R.; Hu, H.; Zhang, Q.; Iwamoto, Y.; Han, X.; Chen, Y.W.; Wu, J. Unet 3+: A full-scale connected unet for medical image segmentation. In Proceedings of the ICASSP 2020—2020 IEEE International Conference on Acoustics, Speech and Signal Processing, Barcelona, Spain, 4–8 May 2020; IEEE: New York, NY, USA, 2020; pp. 1055–1059. [Google Scholar] [CrossRef]
- Hu, J.; Shen, L.; Sun, G. Squeeze-and-excitation networks. In Proceedings of the IEEE Conference on Computer Vision and Pattern Recognition, Salt Lake City, UT, USA, 18–23 June 2018; pp. 7132–7141. [Google Scholar] [CrossRef]
- Zuo, C.; Qian, J.; Feng, S.; Yin, W.; Li, Y.; Fan, P.; Han, J.; Qian, K.; Chen, Q. Deep learning in optical metrology: A review. Light Sci. Appl. 2022, 11, 39. [Google Scholar] [CrossRef]


Disclaimer/Publisher’s Note: The statements, opinions and data contained in all publications are solely those of the individual author(s) and contributor(s) and not of MDPI and/or the editor(s). MDPI and/or the editor(s) disclaim responsibility for any injury to people or property resulting from any ideas, methods, instructions or products referred to in the content. |
© 2025 by the authors. Licensee MDPI, Basel, Switzerland. This article is an open access article distributed under the terms and conditions of the Creative Commons Attribution (CC BY) license (https://creativecommons.org/licenses/by/4.0/).