Abstract
Collagen is the primary load-bearing component in connective tissues, and its organization dictates the biomechanical properties and functions of the tissue. Polarized light imaging has been an effective tool for characterizing collagen organization. Recently, with the integration of structured light illumination (SLI), structured polarized light imaging (SPLI) has enabled quantification of collagen fiber orientation in the superficial layers of thick tissues with higher specificity and accuracy. However, SPLI typically requires 12 images to perform depth discrimination and collagen quantification, limiting its application in imaging tissue dynamics. To overcome this limitation, we developed a high-speed SPLI system that can perform continuous tracking and quantification of tissue deformation at 75 frames per second (FPS). High-speed SPLI was achieved by pairing a polarization camera with a rolling image processing technique. We evaluated the performance of high-speed SPLI on a bovine heart valve leaflet under uniaxial deformation. We were able to continuously track and quantify collagen fiber orientation at 75 FPS, with improved accuracy due to effective depth discrimination using SLI. Additionally, we demonstrated that reflectance with SLI is more sensitive to local collagen deformation compared to imaging without SLI, offering a complementary perspective for studying the dynamics of collagenous tissues.
1. Introduction
Collagen is the primary building block of load-bearing connective tissues, such as tendons, ligaments, ocular tissues, and heart valves [1,2,3]. The organization of collagen fibers is central to the tissue’s mechanical properties and physiological functions [4,5,6]. Understanding the organization of collagen fibers in connective tissues, especially their response to external load, offers valuable insights for developing diagnostic tools and treatment strategies [7,8,9]. It also enhances our ability to predict tissue behavior under mechanical stress [10,11].
Collagen fibers are composed of highly ordered fibrils and exhibit birefringence, an optical property that can be probed with polarized light to reveal collagen fiber orientation and concentration of collagen content [12,13]. Polarized light imaging (PLI) has been widely used to characterize collagen fiber architecture with high accuracy [14,15], particularly in thin samples and thick tissues with simple collagen organization, such as tendons. PLI provides quantitative insight into collagen organization and helps predict their behavior under load. Certain collagenous tissues, such as heart valve leaflets, exhibit layer-dependent collagen organization required for their dynamic functions [16,17]. Imaging such tissues with conventional PLI yields only depth-averaged collagen fiber orientation [18]. While useful for some studies, the lack of depth discrimination reduces its effectiveness for mapping the fiber orientation within superficial tissues. Polarization-sensitive (PS) optical coherence tomography (OCT) and PS second harmonic generation (SHG) microscopy have 3D imaging capabilities and can be used to differentiate tissue layers [19,20]. Both imaging techniques have been used to study the structure of collagenous tissues. However, PS-OCT and PS-SHG often suffer from slow imaging speed, which makes them most suitable for studying static tissues or tissues with slow dynamics [21,22]. Furthermore, high-resolution imaging capability may also limit their applicability to a smaller field-of-view.
Recently, researchers introduced structured light illumination (SLI) into various polarized light imaging techniques, resulting in a new method termed structured polarized light imaging (SPLI) [18,23]. By modulating the spatial frequency of structured light illumination, SPLI effectively controls imaging depth by suppressing diffuse photons from deeper tissues, thereby enabling surface-specific imaging [24]. SPLI has been applied to characterize various collagenous tissues, including heart valves and ocular tissues, with improved quantification accuracy. However, despite its effectiveness, SPLI is typically slow due to the requirement of capturing four polarization images under each of three structured illuminations, a total of 12 images. This limits its application to imaging static samples or quasi-static tissue testing [24].
To overcome the imaging limitations of SPLI and expand its applicability to dynamic tissue testing, we developed a high-speed SPLI system utilizing a polarization camera. The polarization camera features embedded micro-polarizers in front of each pixel [25], eliminating the need for an external rotating linear polarizer and enabling rapid image acquisition, which makes them ideal for time-sensitive applications in both microscopy and wide-field imaging [26,27,28,29]. In the remainder of this manuscript, we describe in detail the high-speed SPLI setup and data processing pipeline, and demonstrate its performance on a bovine heart valve leaflet under mechanical load.
2. Materials and Methods
2.1. High-Speed SPLI Tissue Testing Platform
The high-speed SPLI system consists of a polarization camera and a digital light processing (DLP) projector (DLP2010EVM-LC, Texas Instruments, Dallas, TX, USA) (Figure 1A,B). The DLP projector was used for generating structured illumination and was pre-loaded with three 8-bit phase-shifted (0°, 120°, and 240°) 2D sinusoidal patterns [30]. The projected sinusoidal patterns are characterized by their spatial frequency, and a spatial frequency of 1 mm−1 was used throughout this study due to its effectiveness in rejecting diffuse photons [18]. The patterns were projected continuously and cyclically onto the sample surface at 75 Hz, which matched the maximum frame rate of the polarization camera. A circular polarizer (CP42HE, Edmund Optics, Barrington, NJ, USA) was placed in front of the projection lens to introduce circularly polarized illumination. The green illumination channel of the projector was used and further filtered with a bandpass filter centered at 550 nm with a full width half maximum of 25 nm (#86-643, Edmund Optics, NJ, USA) to match the optimal working wavelength of the circular polarizer. The projector was slightly angled (~15°) to reduce specular reflection and height-adjusted to cover the entire sample surface.
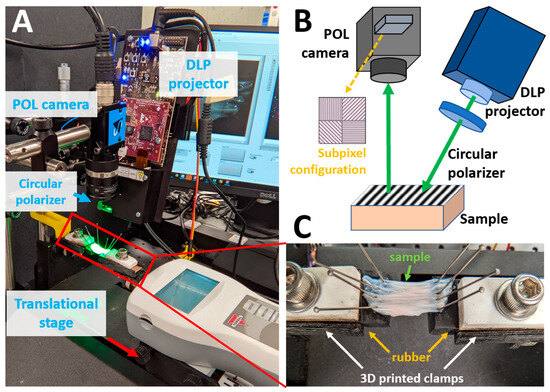
Figure 1.
(A) High-speed tissue testing platform integrating SPLI with a translational stage. (B) Schematic of the SPLI system. The inset highlights the subpixel configuration using wire-grid polarizers. (C) Close-up view of the 3D printed tissue mounting adapter with a rubber base.
Diffuse reflectance images, along with the structured illumination patterns, were captured using a polarization camera (DZK 33UX250, Imaging Source, Charlotte, NC, USA). This camera features sensor-level wire-grid linear polarizers placed in front of individual pixels. The micro-polarizers are arranged in a 2 × 2 configuration, capturing four linear polarization states (0°, 45°, 90°, and 135°), with each group forming a polarization macro pixel (Figure 1B) [25]. This configuration of micro-polarizers reduced the native resolution of 2448 × 2048 pixels down to 1224 × 1024 pixels in the processed images. The integration of sensor-level micro-polarizers eliminates the need for a rotating linear polarizer, thereby enabling high-speed SPLI for capturing tissue dynamics.
The SPLI setup was positioned above a linear translational stage (FTH100-SOLO, Scientific Industries Inc., Bohemia, NY, USA), which was used to apply uniaxial deformation to the tissue samples (Figure 1A). Custom tissue mounting adapters were designed and 3D-printed for securely and conveniently attaching the sample to the translational stage. Each adapter consists of a clamp and a rubber base. The rubber base, together with pins, simplifies the tissue mounting process (Figure 1C).
A LabVIEW program (National Instruments, Austin, TX, USA) was developed to preview and control image acquisition. As collagen fibers realign under external load, their reflectance intensity increases due to enhanced alignment. To account for extension-dependent changes in reflectance intensity, a trial run was conducted prior to testing to determine the optimal exposure time that provided sufficient signal without image saturation.
2.2. Sample Preparation and Imaging
Bovine hearts were purchased from a local grocery store and carefully dissected to obtain heart valve leaflets. The leaflets were temporarily stored in phosphate-buffered saline solution, tested, and imaged within one hour of dissection. To facilitate imaging and mechanical testing, a leaflet was carefully transferred and pinned onto the rubber base of the tissue mounting adapter on the translational stage. A piece of thin cover glass was placed on top of the leaflet to eliminate specular reflection from the uneven tissue surface and to keep the tissue hydrated. The leaflet was stretched by 3 mm at a linear speed of 0.5 mm/s. The entire tissue deformation process was captured by the high-speed SPLI system at 75 FPS.
2.3. Quantification of Continuous Tissue Deformation
2.3.1. Rolling Image Processing
Images acquired under structured light illumination exhibit sinusoidal patterns (Figure 2, left panel). A three-phase demodulation technique was used to remove these patterns and derive images necessary for quantification (Equations (1) and (2)) [31]. I1, I2 and I3 are the raw reflectance images captured under SLI with 0°, 120°, and 240° phase shift, respectively, using a polarization camera. Thus, these images carry the information on how the tissue alters the polarization state of the illumination, which can be used to derive the fiber orientation. This demodulation process generates two new images: AC (IAC) and DC (IDC) images (Figure 2, center panel). The DC images are equivalent to conventional reflectance images under uniform illumination, while the AC images emphasize reflectance from the superficial layer of the tissue [30]. The imaging depth can be tuned by adjusting the spatial frequency of the projected pattern; higher spatial frequencies result in shallower effective imaging depths. The exact imaging depth is challenging to determine without knowing tissue’s optical properties. An estimate of the imaging depth, however, can be made at a higher spatial frequency as reported in [18]. For our imaging setup, the imaging depth was estimated to be around 320 µm.
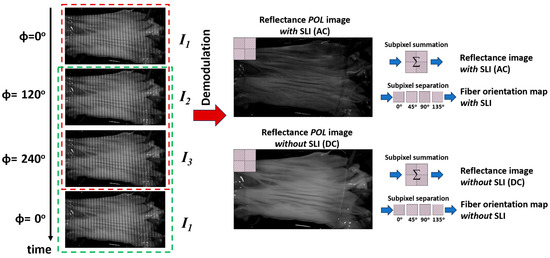
Figure 2.
Left panel: Raw SPLI images showing 2D sinusoidal patterns. The red and green dashed boxes indicate two groups of images processed sequentially using the rolling image processing technique. Center panel: Demodulated reflectance images with (AC) and without (DC) SLI. Both demodulated AC and DC images retain polarization information as shown by the subpixel pattern in the inset. Right panel: Subpixel processing workflow for generating regular reflectance images (via subpixel summation) and individual polarization images (via subpixel splitting) used for fiber orientation quantification.
During tissue testing, images were continuously acquired at 75 Hz under structured illumination. To process all images while maintaining high temporal resolution, we adopted a rolling image processing technique that leverages the cyclic nature of the illumination patterns (Figure 2). Specifically, a moving window of three images was rolled over the entire image sequence with a one-frame increment (red dashed box in Figure 2, left panel). The three images within each window were used to compute the corresponding DC and AC reflectance images as described earlier (Figure 2, center panel). After processing the current window, the first image was removed, and the next image in the sequence was added to form a new window for processing (green dashed box in Figure 2, left panel). This rolling image processing approach enables continuous analysis and visualization at the same frame rate as acquisition.
2.3.2. Reflectance and Fiber Orientation Quantification and Visualization
Each group of macro-pixels of the polarization camera simultaneously captures information from four linear polarization states (0°, 45°, 90°, and 135°). After demodulation, each AC and DC reflectance image was separated into four individual polarization images, I0, I45, I90, and I135, for quantification (Figure 2, right panel). Tissue reflectance images and fiber orientation maps were subsequently calculated using Equations (3) and (4) [26,32], respectively. It is worth noting that the reflectance image (I) and orientation image (Φ) were computed using both AC (referred to as ‘with SLI’) and DC (referred to as ‘without SLI’) images. The quantification using DC images can be referred to as conventional PLI, which uses uniform and planar illumination. The entire sequence of images acquired during the linear deformation was processed to visualize the continuous changes in tissue reflectance and fiber orientation. The quantification method of fiber orientation has been used by us and others and has been validated to have a high accuracy [23,26,33].
Collagen fiber realignment under load changes the local scattering properties, which affects the tissue’s diffuse reflectance. We visualized and tracked the tissue diffuse reflectance obtained both with SLI (superficial tissue) and without SLI (full tissue thickness) images. To facilitate the analysis, we identified three regions within the leaflet sample and manually tracked the diffuse reflectance intensity, with and without SLI, over the entire deformation every 20 frames (equivalent to Δd = 0.265 mm or Δt = 0.53 s). Furthermore, we generated orientation lines over a small region of the leaflet sample to visualize and compare the accuracy of the quantified local fiber orientation with and without SLI.
3. Results
3.1. SLI Reflectance Sensitive to Tissue Stretch State and Local Tissue Features
Under extensional deformation, collagen fibers are recruited to bear the load, resulting in straightening and realignment of collagen fibers [5]. This process also increases the anisotropy of the collagen fiber. These local structural changes directly affect the tissue’s scattering properties and, consequently, its reflectance. Reflectance images, both with and without SLI, of the leaflet captured at five deformation stages (Δd = 0, 0.53, 1.07, 1.60, and 2.13 mm) are shown in Figure 3A. Without SLI, the reflectance images appear bright, and exhibit only a slight intensity increase over a total of 2.13 mm uniaxial extension. In contrast, the overall intensity of the reflectance images with SLI is lower. However, the reflectance intensity displays a more significant and rapid increase as the tissue becomes more stretched, which was due to the higher sensitivity of SLI to tissue scattering properties. The overall lower diffuse reflectance with SLI was due to only capturing light from the superficial tissue, which is less than the light from the full-thickness tissue.
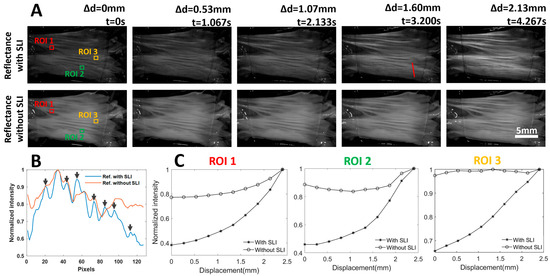
Figure 3.
(A) Reflectance images of a heart valve leaflet under continuous extension, with and without SLI. Representative images from the 5 extension states are shown. Reflectance with SLI is more sensitive to local fiber reorganization under load. The red line indicates a line ROI for intensity comparison. (B) Intensity profiles with and without SLI along a line ROI (red line in (A) at t = 3.2 s). The reflectance profile with SLI exhibits a higher dynamic range and reveals more features (peaks). (C) Reflectance intensity tracking over 3 ROIs revealed that reflectance with SLI correlates more closely with tissue extension, and it also shows a clear nonlinear trend with faster intensity increase observed under larger stretches.
In addition to the improved sensitivity to the tissue realignment with SLI, the reflectance images with SLI showed an enhanced contrast of the superficial layer of the tissue, which is likely due to the effective suppression of diffuse photons. Figure 3B shows the normalized intensity plots along a line ROI (red line). It is evident that the intensity profile with SLI exhibits a much wider range of intensity than that without SLI. Additionally, more intensity peaks are visible with SLI, as highlighted with black arrows. The improved contrast could facilitate the identification of certain tissue features and/or enable marker-free tracking of tissue deformation.
We manually tracked the diffuse intensity in three ROIs, each measuring approximately 1 mm × 1 mm, every 20 frames (Δd = 0.265 mm), and the normalized intensity profiles are shown in Figure 3C. The normalization was performed by dividing the measured reflectance intensities by the maximum intensity. A total extension of approximately 2.4 mm was performed as it introduced quantifiable changes to the tissue while not damaging the tissue under testing. For all three ROIs, the normalized reflectance with SLI correlates well with the tissue extension. However, the normalized reflectance without SLI demonstrated more complex trends. In ROI1, the normalized reflectance without SLI increased over the entire extension range, similar to that with SLI. However, a larger change in the normalized intensity with SLI (approximately 0.6) was observed before and after extension, as opposed to that without SLI (approximately 0.2). Such observation is consistent with the visual appearance of the reflectance images across the entire stretching range shown in Figure 3A. The normalized intensity without SLI in ROI2 underwent a decrease during initial tissue extension, and the normalized intensity without SLI in ROI3 remained approximately the same over the entire tissue extension. The behavior of the reflectance intensity without SLI observed in ROI2 and ROI3 could be attributed to the strong diffuse photons from deeper tissue, which masked the relatively weak reflectance changes due to collagen fiber reorganization in the superficial layer. It is worth noting that the normalized reflectance without SLI in all three ROIs exhibits less than a 25% difference before and after tissue extension, which is much lower than that with SLI.
3.2. Continuous Quantification of Fiber Orientation with Improved Accuracy
Orientation lines of a small region of the leaflet tissue in its initial state were visualized in Figure 4B (with SLI) and Figure 4C (without SLI). Upon close inspection, it is evident that with SLI, the fiber orientation lines follow the apparent local tissue texture much better than without SLI. In Figure 3B, the red arrow indicates that the quantified local fiber orientation was around 135 degrees, which is consistent with the visual tissue appearance. However, the orientation lines failed to follow such tissue features without SLI in the same region. Similarly, as indicated with yellow arrows, orientation lines with SLI faithfully reflect the apparent orientation of the fiber bundle. The SLI limits the imaging depth and improves the quantification accuracy of fiber orientation within the superficial layer of the sample.
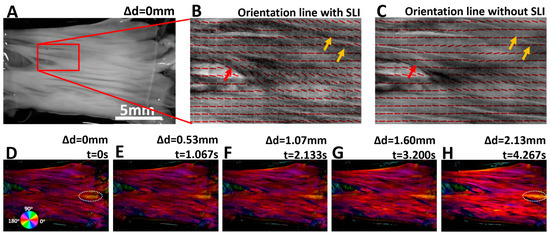
Figure 4.
(A) Image of the heart valve leaflet at the initial stretching state, with red box indicating the region used for orientation overlay. (B,C) show fiber orientation lines (with and without SLI) overlaid on grayscale tissue images. Orientation lines obtained with SLI show improved accuracy and better alignment with the apparent surface features of the tissue, as indicated with red and yellow arrows. (D–H) show the color-coded fiber orientation maps weighted by the corresponding tissue reflectance images. Orientation color changes are highlighted within the dashed-white oval ROI at the beginning and end of stretch.
During the tissue extension test, the leaflet tissue was continuously tracked and quantified with an effective temporal resolution of 13.3 ms. Figure 4D–H shows five fiber orientation maps of the leaflet with SLI. The orientation maps were weighted by reflectance images, allowing simultaneous visualization of collagen fiber orientation and tissue texture at different stretching states. The orientation of the fiber bundle indicated with the dashed-white oval changed the orientation from approximately 18.2 deg. in Figure 4D to 12.5 deg. in Figure 4H, which is visualized with a color change from greenish-yellow hue to orange hue.
4. Discussion
SPLI has proven to be an effective technique for accurately quantifying collagen architecture in the superficial layer of tissue by rejecting scattered photons from deeper regions. However, SPLI has been limited to imaging static tissues or those under quasi-static deformation due to its long acquisition time. Continuous imaging of collagenous tissue deformation is essential for understanding and predicting tissue behavior under load. In this study, we demonstrated the feasibility of high-speed SPLI on bovine heart valve leaflet tissues. This approach enables continuous tracking of surface reflectance and collagen fiber orientation with high temporal resolution, providing complementary insights into tissue behavior under mechanical load.
Integrating SLI with polarized light imaging for high-speed applications has traditionally been challenging, as each quantification requires a total of 12 individual images captured under 4 polarization states (via rotating a linear polarizer) and 3 illumination patterns. In contrast, polarization-sensitive cameras integrate micro linear polarizers directly in front of each pixel, forming super-pixels sensitive to four polarization states. By capturing information from four polarization states simultaneously in a single image, we were able to reduce the number of required images from 12 to just 3 (each acquired under a different illumination pattern). Our high-speed SPLI system achieves an image acquisition rate of 75 FPS, limited only by the data transfer rate. Each set of 3 images corresponds to a 40 ms time window. By processing the image stream in sets of 3, we could achieve an effective frame rate of 25 FPS, which is sufficient for quantifying tissue deformation in many applications. To further enhance the effective frame rate for visualization, we leveraged the cyclic nature of the illumination patterns and implemented a rolling image processing scheme. A 3-image buffer was used to temporarily store the most recent images. Once the current buffer was processed, the oldest image was replaced by the next image in sequence, resulting in an effective visualization frame rate of 75 FPS for smooth playback. It is worth noting that if significant motion occurs within the 40 ms (3-image buffer), each image may exhibit noticeable shifts, potentially introducing artifacts in the demodulated images and compromising quantification accuracy. The allowable deformation rate is determined by multiple factors, including the focal length of the imaging lens and working distance. Therefore, it is important to verify whether the targeted tissue deformation rate is compatible with the specific imaging setup. Simulation of the imaging system may provide valuable insight into the limiting motion speed without causing noticeable motion artifact. In our study, we used the full resolution of the camera (2448 × 2048 pixels). If a higher imaging speed is required for certain studies, one could consider reducing the active imaging area in exchange for a high frame rate to mitigate motion artifacts. High-speed SPLI enables continuous tracking and quantification of tissue surface reflectance and fiber orientation during mechanical testing, providing complementary information for assessing tissue dynamics and function. In this study, we demonstrated that leaflet deformation correlated well with superficial reflectance measured using SPLI. Under extensional deformation, collagen fibers reorganize, uncrimp, and align to bear the load, resulting in straighter fibers with increased anisotropy. Local fiber organizations play a key role in determining scattering properties. Our results indicate that more organized fibers exhibit stronger scattering, as reflected in increased surface reflectance with stretch. This trend was observed both with and without SLI, but was more consistent and pronounced when using SLI. Reflectance measured with SLI retains photons from the superficial tissue layer, which have undergone fewer scattering events. In contrast, reflectance without SLI includes a higher proportion of diffuse photons from deeper tissue layers, diminishing the correlation between reflectance and fiber alignment due to multiple scattering. Continuous SLI-based reflectance imaging provides a novel approach to study collagenous tissue behavior under load. To fully extract insight from this data, model-based analysis methods may be required. Additionally, continuous fiber orientation mapping with SLI offers accurate and quantitative visualization of collagen network reorganization in the superficial tissue during deformation. Unlike static or quasi-static methods, high-speed SPLI captures collagen orientation throughout the entire deformation process with high temporal resolution, making it a powerful tool for investigating tissue dynamics. By effectively isolating information from the superficial tissue layer through suppression of diffuse photons, SPLI yields surface-specific quantification. This is particularly valuable for studying collagenous tissues with depth-dependent or layered collagen architecture. In certain tissues, collagen fibers can exhibit complex 3D fiber organization characterized by both in-plane and out-of-plane (inclined) fiber orientations. In this study, only the in-plane fiber orientation was quantified. Previous studies have shown that the out-of-plane fiber orientation could be estimated [34]. We will investigate the ability to dynamically track 3D fiber orientation with high-speed SPLI in future studies. High-speed SPLI was evaluated with a bovine heart valve leaflet, which showed robust performance. Fully evaluating its capability would require more tissue types with expanded sample sizes, which will be conducted in future study.
Structured illumination, as an illumination strategy, serves distinct purposes in structured illumination microscopy (SIM) [35,36,37] and in our wide-field high-speed SPLI. The spatial frequency of the structured illumination used in SIM is much higher than that in SPLI, as it is required to encode high-frequency spatial information. In SIM, structured illumination provides optical sectioning capabilities, enabling 3D imaging within tissue sections. In contrast, SPLI uses structured illumination to suppress diffuse photons originating from deeper tissue layers. While SPLI can differentiate the superficial tissue layer from deeper regions, it does not offer 3D imaging capabilities.
5. Conclusions
In this study, we enhanced the performance of conventional SPLI with high-speed imaging capability by using a polarization camera. The polarization camera reduced the number of required images from 12 to 3. Combined with a rolling image processing technique, high-speed SPLI enables simultaneous tracking of both surface reflectance and collagen fiber reorganization under external load, providing complementary information for studying the biomechanics and functional behavior of collagenous tissues. High-speed SPLI could also be used for quality control in prosthetic heart valve manufacturing and for surgical guidance, where the surface-level information is needed.
Funding
This research received no external funding.
Institutional Review Board Statement
Not applicable.
Informed Consent Statement
Not applicable.
Data Availability Statement
The data that support the findings of this study are available from the corresponding author upon reasonable request.
Conflicts of Interest
The author declares no conflicts of interest.
Abbreviations
The following abbreviations are used in this manuscript:
| SLI | Structured light illumination |
| SPLI | Structured polarized light imaging |
| PLI | Polarized light imaging |
| FPS | Frame per second |
References
- Fratzl, P. Collagen: Structure and mechanics, an introduction. In Collagen: Structure and Mechanics; Springer: Berlin/Heidelberg, Germany, 2008; pp. 1–13. [Google Scholar]
- Ihanamäki, T.; Pelliniemi, L.J.; Vuorio, E. Collagens and collagen-related matrix components in the human and mouse eye. Prog. Retin. Eye Res. 2004, 23, 403–434. [Google Scholar] [CrossRef]
- Liu, S.H.; Yang, R.-S.; Al-Shaikh, R.; Lane, J.M. Collagen in Tendon, Ligament, and Bone Healing: A Current Review. Clin. Orthop. Relat. Res. (1976–2007) 1995, 318, 265–278. [Google Scholar]
- Merryman, W.D.; Youn, I.; Lukoff, H.D.; Krueger, P.M.; Guilak, F.; Hopkins, R.A.; Sacks, M.S. Correlation between heart valve interstitial cell stiffness and transvalvular pressure: Implications for collagen biosynthesis. Am. J. Physiol.-Heart Circ. Physiol. 2006, 290, H224–H231. [Google Scholar] [CrossRef] [PubMed]
- Jan, N.-J.; Sigal, I.A. Collagen fiber recruitment: A microstructural basis for the nonlinear response of the posterior pole of the eye to increases in intraocular pressure. Acta Biomater. 2018, 72, 295–305. [Google Scholar] [CrossRef]
- Franchi, M.; Trirè, A.; Quaranta, M.; Orsini, E.; Ottani, V. Collagen structure of tendon relates to function. Sci. World J. 2007, 7, 404–420. [Google Scholar] [CrossRef]
- Mathew-Steiner, S.S.; Roy, S.; Sen, C.K. Collagen in wound healing. Bioengineering 2021, 8, 63. [Google Scholar] [CrossRef]
- Schoen, F.J.; Levy, R.J. Tissue heart valves: Current challenges and future research perspectives. J. Biomed. Mater. Res. 1999, 47, 439–465. [Google Scholar] [CrossRef]
- Zilla, P.; Brink, J.; Human, P.; Bezuidenhout, D. Prosthetic heart valves: Catering for the few. Biomaterials 2008, 29, 385–406. [Google Scholar] [CrossRef]
- Jansen, K.A.; Licup, A.J.; Sharma, A.; Rens, R.; MacKintosh, F.C.; Koenderink, G.H. The role of network architecture in collagen mechanics. Biophys. J. 2018, 114, 2665–2678. [Google Scholar] [CrossRef] [PubMed]
- Lee, B.; Zhou, X.; Riching, K.; Eliceiri, K.W.; Keely, P.J.; Guelcher, S.A.; Weaver, A.M.; Jiang, Y. A three-dimensional computational model of collagen network mechanics. PLoS ONE 2014, 9, e111896. [Google Scholar] [CrossRef]
- Wang, L.V.; Wu, H.-I. Biomedical Optics: Principles and Imaging; John Wiley & Sons: Hoboken, NJ, USA, 2007. [Google Scholar]
- Maitland, D.J.; Walsh, J.T., Jr. Quantitative measurements of linear birefringence during heating of native collagen. Lasers Surg. Med. 1997, 20, 310–318. [Google Scholar] [CrossRef]
- Jacques, S.L. Polarized light imaging of biological tissues. In Handbook of Biomedical Optics; CRC Press: Boca Raton, FL, USA, 2016; pp. 669–692. [Google Scholar]
- Alali, S.; Vitkin, A. Polarized light imaging in biomedicine: Emerging Mueller matrix methodologies for bulk tissue assessment. J. Biomed. Opt. 2015, 20, 061104. [Google Scholar] [CrossRef]
- Sacks, M.S.; Merryman, W.D.; Schmidt, D.E. On the biomechanics of heart valve function. J. Biomech. 2009, 42, 1804–1824. [Google Scholar] [CrossRef]
- Sacks, M.S.; Yoganathan, A.P. Heart valve function: A biomechanical perspective. Philos. Trans. R. Soc. B Biol. Sci. 2007, 362, 1369–1391. [Google Scholar] [CrossRef]
- Yang, B.; Lesicko, J.; Sharma, M.; Hill, M.; Sacks, M.S.; Tunnell, J.W. Polarized light spatial frequency domain imaging for non-destructive quantification of soft tissue fibrous structures. Biomed. Opt. Express 2015, 6, 1520–1533. [Google Scholar] [CrossRef]
- Bromage, T.G.; Goldman, H.M.; McFarlin, S.C.; Warshaw, J.; Boyde, A.; Riggs, C.M. Circularly polarized light standards for investigations of collagen fiber orientation in bone. Anat. Rec. Part B New Anat. Off. Publ. Am. Assoc. Anat. 2003, 274, 157–168. [Google Scholar] [CrossRef]
- Chen, X.; Nadiarynkh, O.; Plotnikov, S.; Campagnola, P.J. Second harmonic generation microscopy for quantitative analysis of collagen fibrillar structure. Nat. Protoc. 2012, 7, 654–669. [Google Scholar] [CrossRef]
- Pierce, M.C.; Sheridan, R.L.; Park, B.H.; Cense, B.; De Boer, J.F. Collagen denaturation can be quantified in burned human skin using polarization-sensitive optical coherence tomography. Burns 2004, 30, 511–517. [Google Scholar] [CrossRef] [PubMed]
- Mansfield, J.C.; Winlove, C.P.; Moger, J.; Matcher, S.J. Collagen fiber arrangement in normal and diseased cartilage studied by polarization sensitive nonlinear microscopy. J. Biomed. Opt. 2008, 13, 044020. [Google Scholar] [CrossRef] [PubMed]
- Ingram, G.; Lee, P.-Y.; Bernarding, B.; Sigal, I.A.; Yang, B. Real-time structured polarized light imaging of dynamics of thick collagenous tissues. In Proceedings of the Emerging Digital Micromirror Device Based Systems and Applications XIII, San Francisco, CA, USA, 6–11 March 2021; pp. 16–22. [Google Scholar]
- Yang, B.; Brazile, B.; Jan, N.-J.; Hua, Y.; Wei, J.; Sigal, I.A. Structured polarized light microscopy for collagen fiber structure and orientation quantification in thick ocular tissues. J. Biomed. Opt. 2018, 23, 106001. [Google Scholar] [CrossRef] [PubMed]
- Rebhan, D.; Rosenberger, M.; Notni, G. Principle investigations on polarization image sensors. In Proceedings of the Photonics and Education in Measurement Science 2019, Jena, Germany, 17–19 September 2019; pp. 50–54. [Google Scholar]
- Bai, B.; Wang, H.; Liu, T.; Rivenson, Y.; FitzGerald, J.; Ozcan, A. Pathological crystal imaging with single-shot computational polarized light microscopy. J. Biophotonics 2020, 13, e201960036. [Google Scholar] [CrossRef]
- Maeda, Y.; Shibata, S.; Hagen, N.; Otani, Y. Birefringence compensation for single-shot 3D profilometry using a full-Stokes imaging polarimeter. Opt. Rev. 2021, 28, 425–433. [Google Scholar] [CrossRef]
- Lane, C.; Rode, D.; Rösgen, T. Two-dimensional birefringence measurement technique using a polarization camera. Appl. Opt. 2021, 60, 8435–8444. [Google Scholar] [CrossRef]
- Shibata, S.; Onuma, T.; Otani, Y. Realtime birefringence mapping by polarization camera. In Proceedings of the 2012 International Symposium on Optomechatronic Technologies (ISOT 2012), Paris, France, 29–31 October 2012; pp. 1–2. [Google Scholar]
- Cuccia, D.J.; Bevilacqua, F.; Durkin, A.J.; Tromberg, B.J. Modulated imaging: Quantitative analysis and tomography of turbid media in the spatial-frequency domain. Opt. Lett. 2005, 30, 1354–1356. [Google Scholar] [CrossRef] [PubMed]
- Gioux, S.; Mazhar, A.; Cuccia, D.J. Spatial frequency domain imaging in 2019: Principles, applications, and perspectives. J. Biomed. Opt. 2019, 24, 071613. [Google Scholar] [CrossRef]
- Collett, E. Field Guide to Polarization; SPIE Press: Bellingham, WA, USA, 2005. [Google Scholar]
- Yang, B.; Nayyar, N.; Sanchez, B. High-Speed Full-Color Polarized Light Imaging of Collagen Using a Polarization Camera. Bioengineering 2025, 12, 720. [Google Scholar] [CrossRef]
- Axer, M.; Grässel, D.; Kleiner, M.; Dammers, J.; Dickscheid, T.; Reckfort, J.; Hütz, T.; Eiben, B.; Pietrzyk, U.; Zilles, K. High-resolution fiber tract reconstruction in the human brain by means of three-dimensional polarized light imaging. Front. Neuroinform. 2011, 5, 34. [Google Scholar] [CrossRef]
- Schlichenmeyer, T.C.; Wang, M.; Elfer, K.N.; Brown, J.Q. Video-rate structured illumination microscopy for high-throughput imaging of large tissue areas. Biomed. Opt. Express 2014, 5, 366–377. [Google Scholar] [CrossRef] [PubMed]
- Song, L.; Lu-Walther, H.-W.; Förster, R.; Jost, A.; Kielhorn, M.; Zhou, J.; Heintzmann, R. Fast structured illumination microscopy using rolling shutter cameras. Meas. Sci. Technol. 2016, 27, 055401. [Google Scholar] [CrossRef]
- Appelt, D.; Ehler, E.; Shukla Mukherjee, S.; Heintzmann, R.; Wicker, K. Polarized illumination coded structured illumination microscopy (picoSIM): Experimental results. Philos. Trans. R. Soc. A 2022, 380, 20210193. [Google Scholar] [CrossRef]


Disclaimer/Publisher’s Note: The statements, opinions and data contained in all publications are solely those of the individual author(s) and contributor(s) and not of MDPI and/or the editor(s). MDPI and/or the editor(s) disclaim responsibility for any injury to people or property resulting from any ideas, methods, instructions or products referred to in the content. |
© 2025 by the author. Licensee MDPI, Basel, Switzerland. This article is an open access article distributed under the terms and conditions of the Creative Commons Attribution (CC BY) license (https://creativecommons.org/licenses/by/4.0/).