Article

Design and Verification of Optical System for Intelligent Remote Sensing Camera

1
School of Advanced International Studies, John Hopkins University, Washington, DC 20001, USA
2
Stellar Photonix Technology Co., Ltd. (Beijing), Beijing 100080, China
3
The First Institute of Aero-Photogrammetry & Remote Sensing, Xi’an 710516, China
4
China Academy of Space Technology, Xi’an 710100, China
*
Author to whom correspondence should be addressed.
Xiangqi He and Lei Qiao are co-first authors of the article.
Photonics 2026, 13(6), 528; https://doi.org/10.3390/photonics13060528
Submission received: 20 January 2026 / Revised: 5 May 2026 / Accepted: 12 May 2026 / Published: 28 May 2026
(This article belongs to the Special Issue Photodetectors for Next-Generation Imaging and Sensing Systems)

Abstract

To address the issues of traditional high-resolution spatial remote sensing cameras—complex optical systems, heavy weight, long development cycles, and high costs—this study combines the optical design parameters and product characteristics of lightweight remote sensing payloads. Based on the “physical simplification–algorithm enhancement” computational imaging paradigm, an algorithm-side enhancement technical system tailored to these lightweight payloads is constructed. This paper establishes a point-spread function (PSF) model for simplified optical systems and a dedicated imaging degradation model, verifying the compensation mechanism of computational methods against optical degradation effects. It achieves high-performance imaging through “low-precision simplified optics + high-precision algorithms,” providing theoretical support and practical implementation pathways for lightweight, low-cost, and rapid-response spaceborne remote sensing payloads. Experimental results confirm the excellent imaging performance of the camera, validating the effectiveness of the proposed optical design. Compared with the baseline Mask R-CNN (region-convolution neural networks), the AP50 and overall AP (average precision) of the AS Mask R-CNN are improved by 4.0% and 1.0%, respectively. This research offers a robust technical solution for intelligent remote sensing camera modes and serves as valuable reference and technical support for the opto-mechanical co-design of high-resolution remote sensing payloads.

1. Introduction

In the 21st century, remote sensing technology has undergone rapid development, and remote sensing products have become a focal point across numerous industrial domains, particularly in applications such as resource exploration, disaster early warning, and navigation.
Traditional high-resolution space remote sensing cameras commonly use high-precision optical components (better than λ/50), complex multi-lens structures, precise assembly and adjustment, and ultra-long manufacturing cycles in pursuit of near-diffraction-limit imaging quality, resulting in heavy system weight, high cost, high development risk, and slow response speed. With the rapid growth of demand for small satellites, fast remote sensing, emergency observation, and other technologies, the traditional design concept of “extreme optics” is no longer suitable for the new generation of lightweight, low-cost, and fast-response payload development trends [1].
In recent years, the paradigm of computational imaging, which tightly couples hardware design with software algorithms, has offered novel perspectives and effective routes for addressing the aforementioned challenges [2].
The lightweight remote sensing payload studied in this article operates in a 500 km sun synchronous orbit and adopts a coaxial three-mirror optical system. In order to meet the development needs of lightweight and fast-response small satellite payloads, the physical end actively simplifies the optical structure and relaxes the processing accuracy (the main mirror surface accuracy is designed according to λ/10, λ = 0.6328 μm). The rapid manufacturing process is adopted to shorten the development cycle, but it also introduces optical degradation problems such as surface shape error, assembly deviation, and stray light interference, resulting in non-uniform blurring, distortion, and decreased signal-to-noise ratio in the original imaging, which is difficult to directly meet the needs of remote sensing applications.
As a specific branch of computational imaging, imaging with simple optical systems has gradually emerged as a research hotspot in recent years. Heide et al. [3] developed a cross-channel gradient-prior deconvolution reconstruction algorithm within a non-concave optimization framework, exploiting spatially variant PSF estimations across different channels to achieve high-quality image reconstruction. Peng et al. [4] integrated deep neural networks into a single-lens design and proposed a free-form surface lens based on the Fresnel diffraction principle, effectively combining the advantages of refractive and diffractive optics. Wu et al. [5] introduced a novel Generative Adversarial Network (GAN) architecture, RRGGAN, specifically tailored to restore images degraded by single-lens blur.
More recently, in 2023, Niu et al. [6] proposed a YOLO-based network (L-SNR-YOLO) employing a hybrid backbone of Swin-Transformer and CNN for aircraft detection in low-signal-to-noise-ratio remote sensing images (RSIs). This architecture is capable of extracting multi-scale global and local features from RSIs and markedly enhances the robustness of the detection algorithm. In 2024, Liu et al. [7] introduced a new framework that incorporates three lightweight, plug-and-play modules (DenseFPN, SCP, and HRoIE) to aggregate global visual context in the feature, spatial, and instance domains, respectively, thereby improving both object detection and instance segmentation performance across diverse target categories. In line with these advances, our work concentrates on extracting richer feature representations through an enlarged receptive field at the back end of the model, with the aim of improving algorithmic detection performance for small and densely distributed targets.
In recent years, the new generation of optoelectronic imaging technology with computational imaging as its core has broken the inherent paradigm of “the more precise the optics, the better”, and achieved a balance between performance and engineering through the joint design of optics and algorithms. The “physical simplification + algorithm side enhancement” computational imaging paradigm for space remote sensing applications proposes: actively simplifying optical structures, relaxing processing accuracy, and adopting rapid manufacturing technology on the physical side; on the algorithm side, all hardware defects are compensated through intelligent computing, ultimately achieving high-performance imaging with the “low-precision hardware + high-precision algorithm”.
In this paradigm, algorithmic enhancement is the core supporting technology, which directly determines whether low-precision optics can recover to usable remote sensing indicators. At present, traditional image enhancement and deblurring methods are difficult to cope with the joint degradation of λ/10 surface errors, processing scattering, and minimal optical aberrations. It is urgent to establish an algorithm system that is suitable for lightweight load characteristics, can be deployed in orbit, and has high robustness [8].
Based on the above background, this article combines the optical design parameters and product characteristics of lightweight remote sensing payloads to systematically explain the principle, architecture, key technologies, and implementation process of algorithm-side enhancement under the “physical simplification–algorithm enhancement” paradigm. It constructs an adaptive PSF model and a dedicated imaging degradation model, verifies the compensation mechanism of the calculation method for optical degradation, and adopts a generalized imaging degradation model, refined PSF modeling, and multi-scale wavefront characterization system.
In this study, Mask R-CNN is adopted as the baseline framework, with ResNet-50 serving as the backbone network. The residual architecture enables the network to approximate the global minimum of the loss function as depth increases, while effectively mitigating gradient vanishing and gradient degradation issues. To address the unsatisfactory detection performance caused by the small physical size and dense spatial arrangement of aircraft targets in remote sensing images, we propose a module—termed the AS Module—that extracts richer feature information from feature maps by integrating Improved SC-conv with AC. The Mask R-CNN model equipped with this AS Module is referred to as AS Mask R-CNN. Furthermore, in view of the absence of publicly available remote sensing aircraft mask datasets, we construct a dedicated dataset, WF-2040, based on DOTA to support training and evaluation.

2. Method

2.1. Simple Optical System Imaging Model

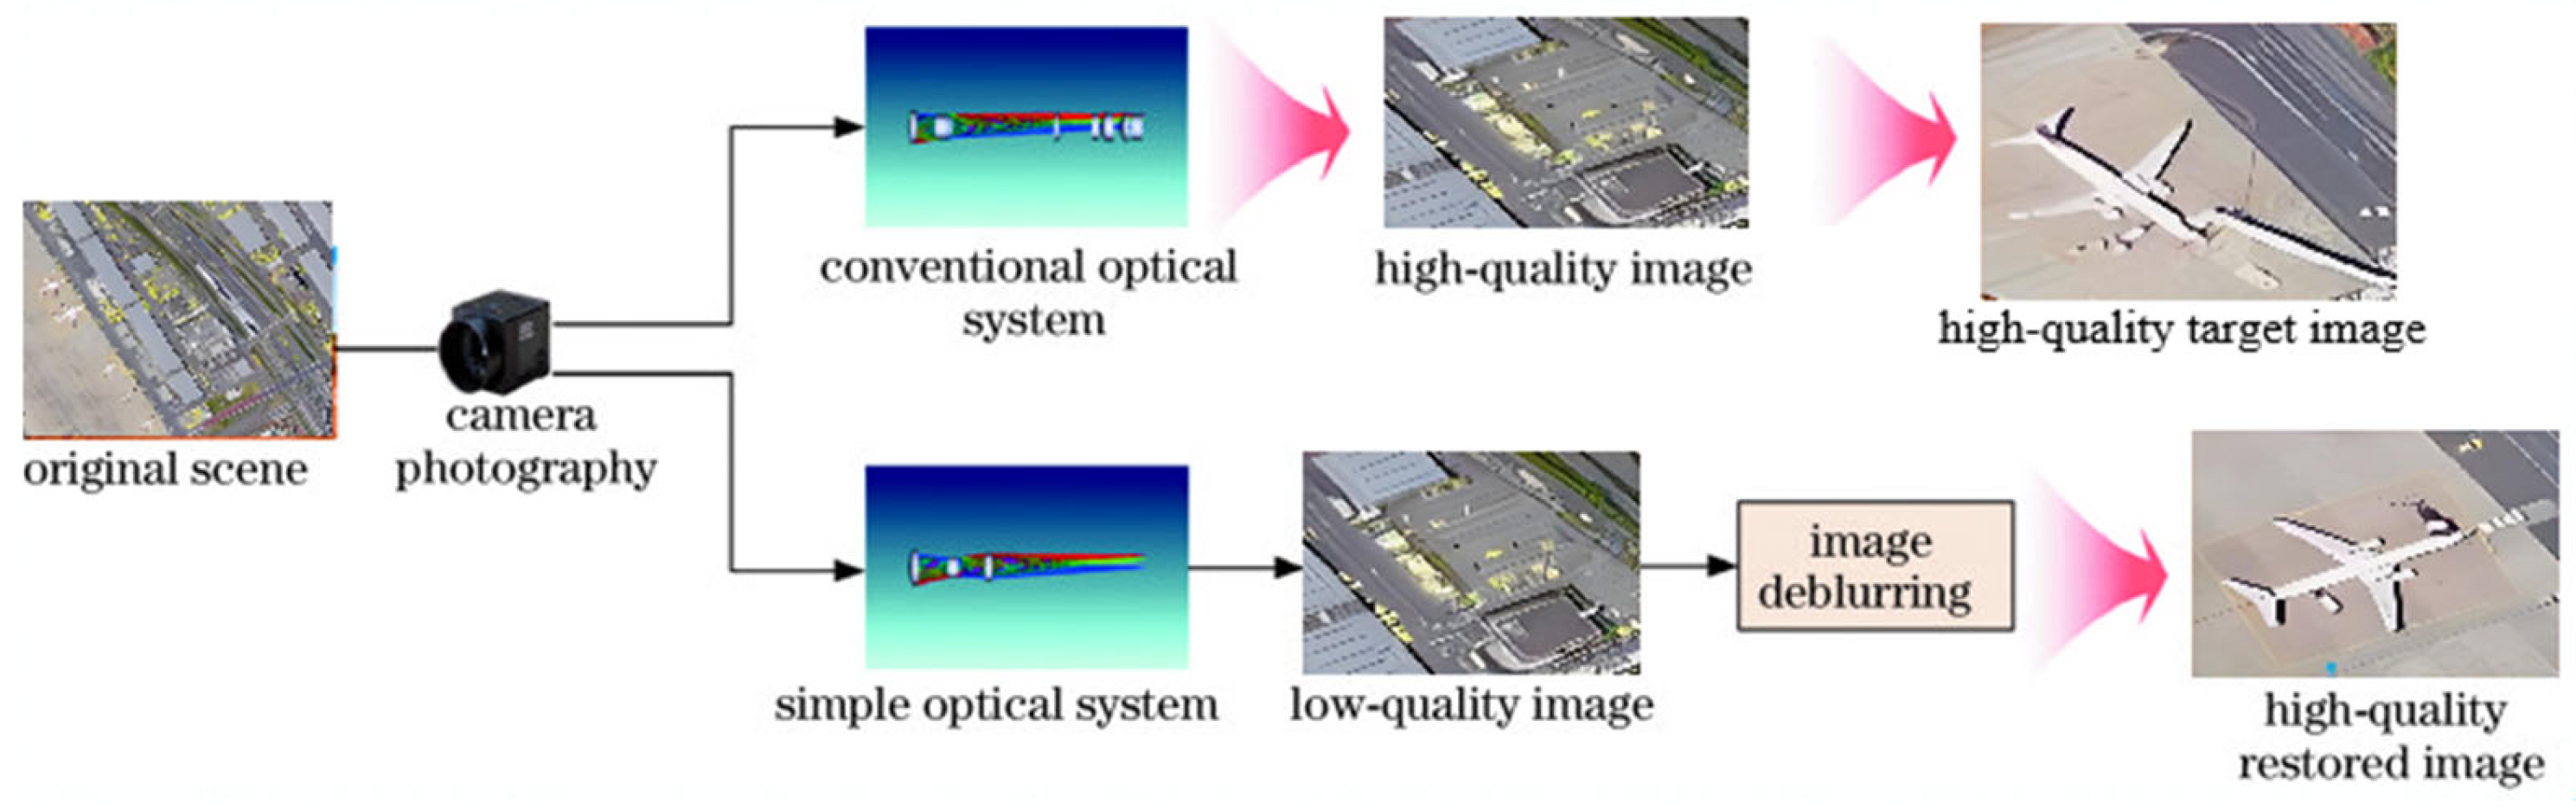
The computational imaging technique for simple optical systems primarily depends on back-end restoration algorithms to reconstruct high-quality optical images, as illustrated in Figure 1. In this framework, a blurred intermediate image is first acquired via a simplified optical system; subsequently, algorithmic deblurring is applied to this intermediate observation to generate a high-quality image whose visual quality is comparable to that obtained with a more complex optical system, thereby achieving the overarching objective of simplifying the optical design. Traditional cameras are imaging tools that rely on hardware to determine the upper limit, relying on precision optics and mechanics to achieve high imaging quality. An intelligent remote sensing camera is a “hardware + algorithm collaborative” intelligent perception system that combines low-cost hardware with AI computing to achieve higher resolution and real-time intelligent analysis of target recognition. It is a revolutionary upgrade of remote sensing imaging technology.
Computational imaging is an imaging mode based on the entire link. In the process of collecting light information for imaging in the optical system, there are a large number of uncorrected aberrations in the simplified system, which cause changes in the light path passing through the imaging system, resulting in severe degradation of the final image information.
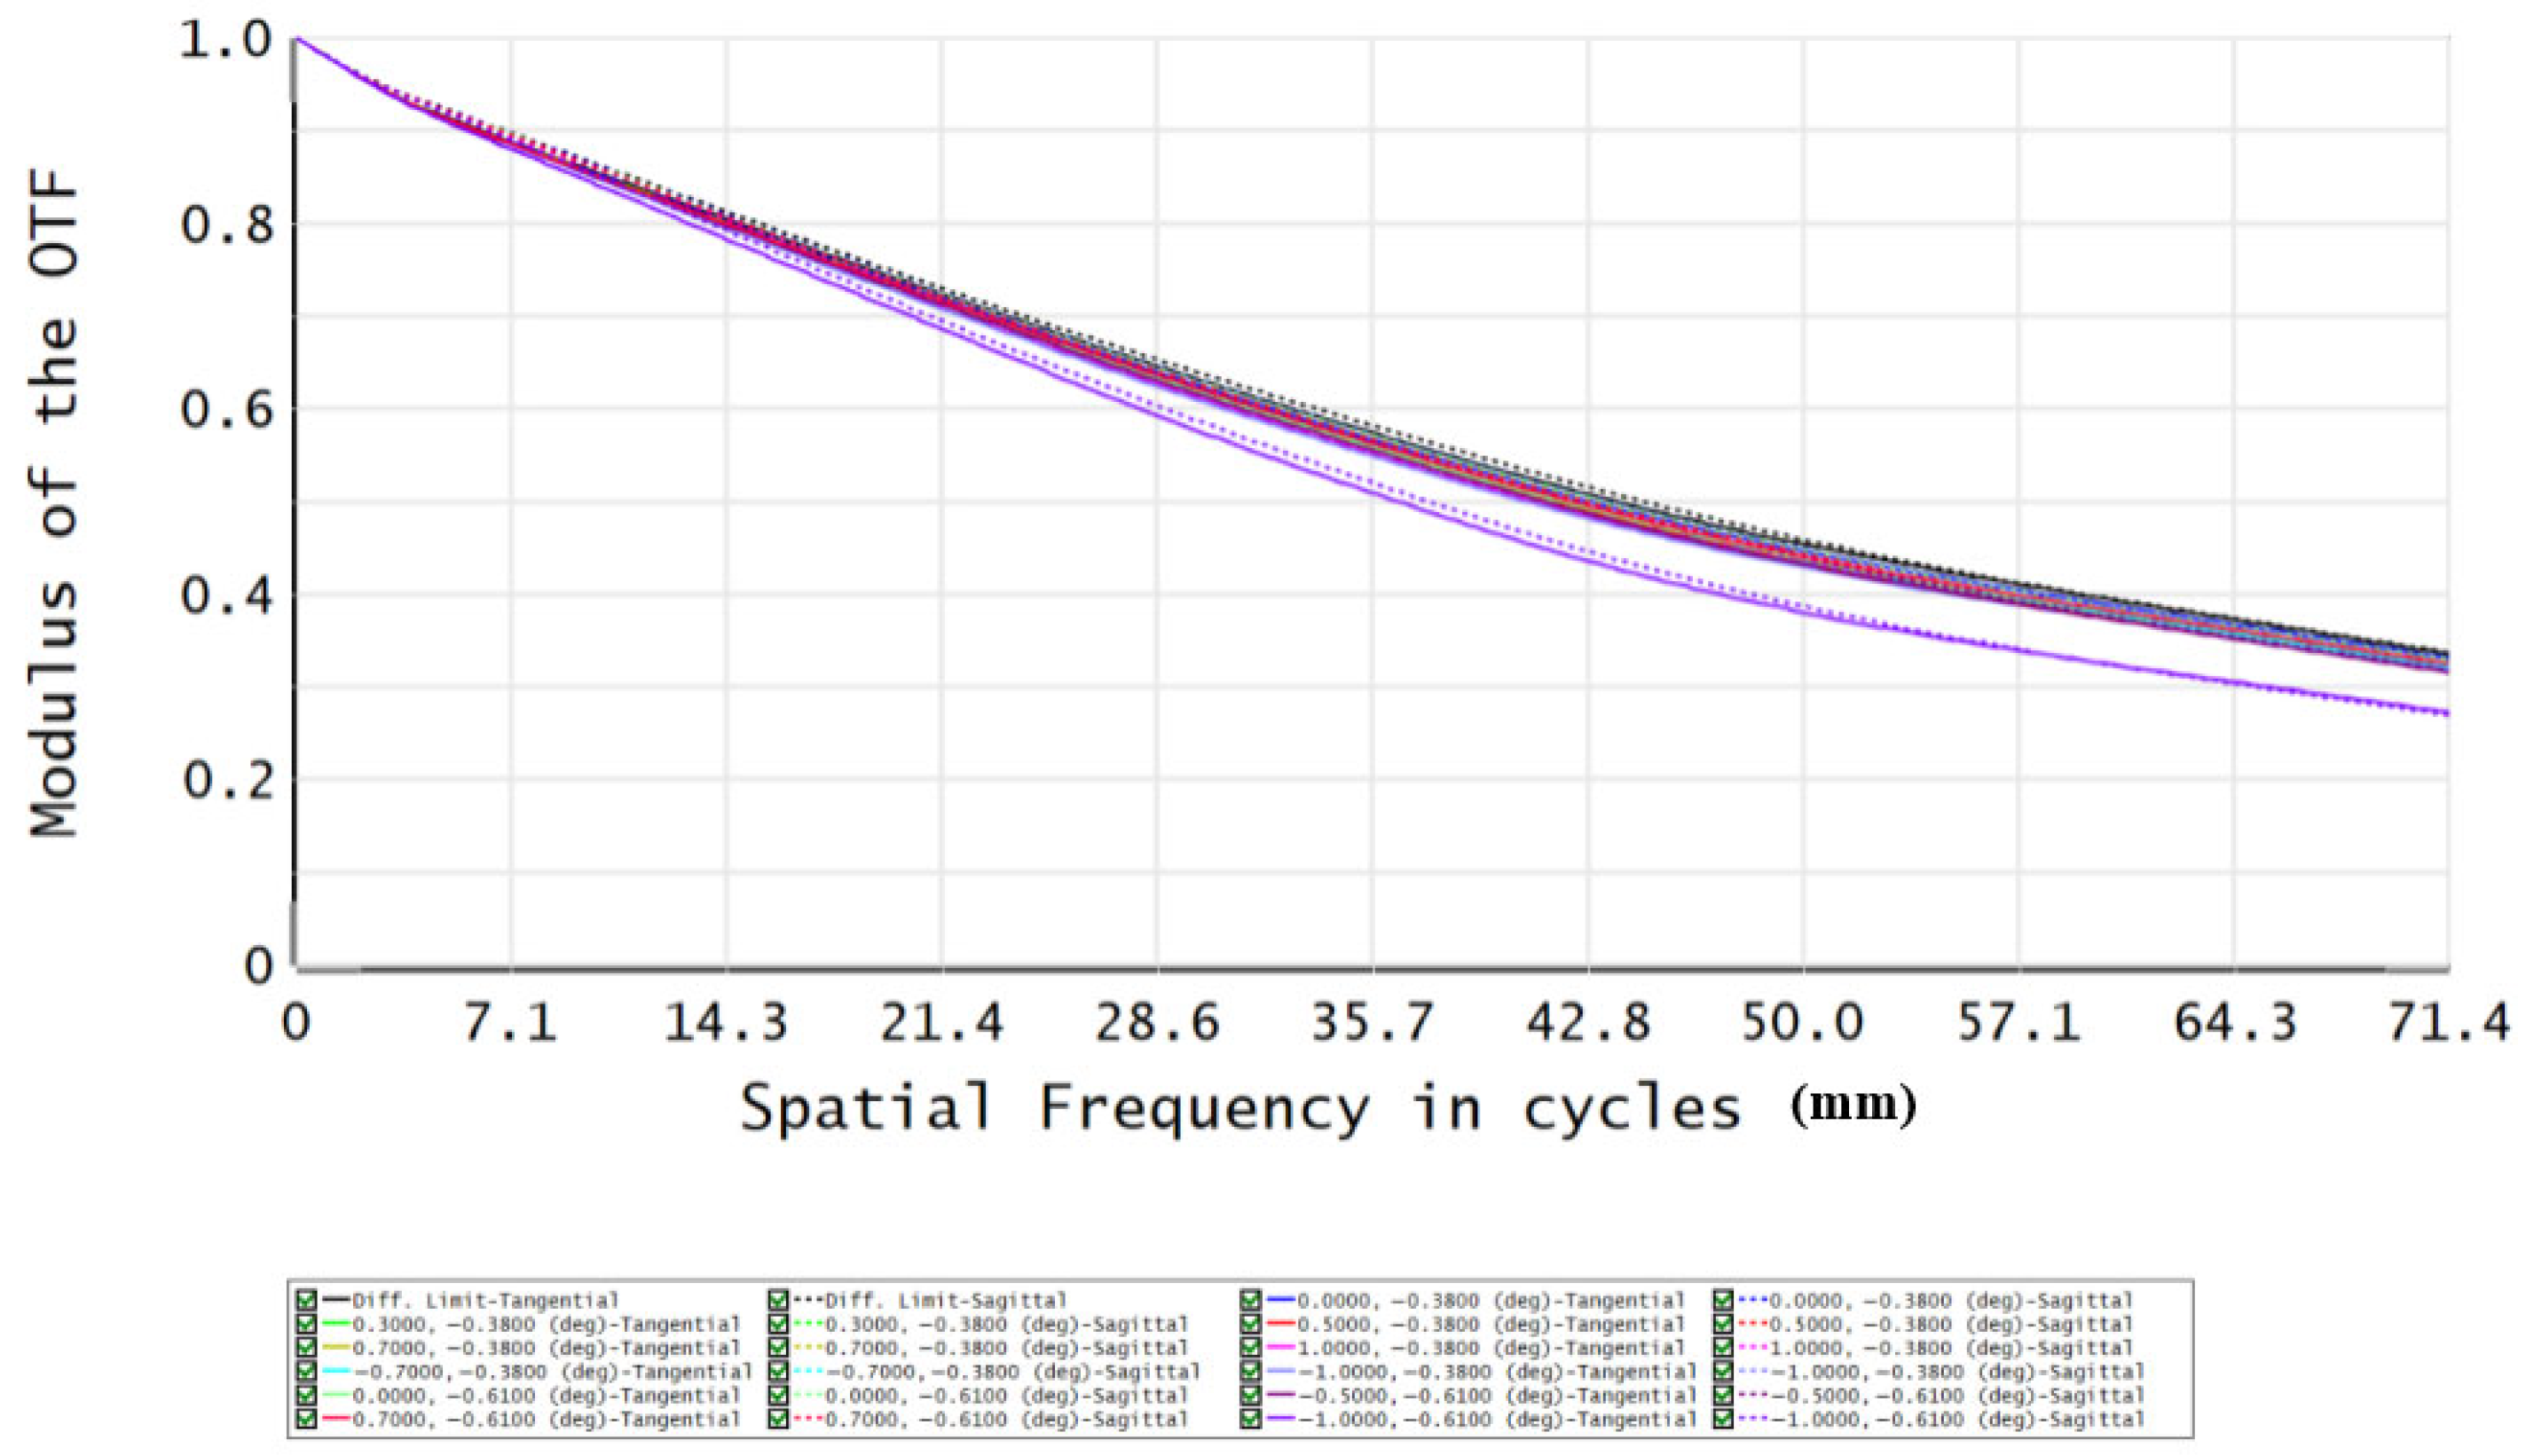
The lightweight remote sensing payload studied in this article has core optical design parameters that meet the practical needs of engineering, as follows: Optical system: Coaxial three-mirror optical system, consisting of a primary mirror, a secondary mirror, and three mirrors, with a field-of-view angle of 1.9 ° (meeting the design requirement of ≥1.85°). Image quality: The detector pixel size is 7 mm/28 mm (panchromatic/multispectral), the MTF of the panchromatic spectral range (450–800 nm) is ≥0.30 (71.4l lp/mm), and the MTF of the multispectral spectral range is ≥0.60 (17.85 lp/mm). Physical simplification design: The precision of the main mirror surface is λ/10 (λ = 0.6328 mm), and a fast manufacturing process is adopted to simplify the mirror assembly and adjustment process. The deviation of the distance between the main and secondary mirrors is allowed to be ≤0.01 mm, and the deviation of the distance between the secondary and tertiary mirrors is ≤0.1 mm. Other characteristics: Stray light coefficient ≤ 3%, uneven illumination on the image plane < 4%, relative optical distortion ≤ 0.96%, system transmittance (excluding filters) ≥ 0.88, slight wavefront drift due to dynamic disturbances and temperature changes during in-orbit operation.
Combining AI algorithms with optical design to simplify lens structure and reduce precision requirements. The main mirror is made of low-cost all-SiC material, reducing the overall weight from 10 kg to less than 5 kg. By reconstructing information to compensate for the shortcomings of physical structure, high-resolution imaging can be achieved.
The camera subsystem consists of three parts: the camera body, the integrated electronic module, and the secondary power supply. When the satellite is in orbit, it operates in a complex and ever-changing environment, and adopts a high stability design with an integrated structure to ensure the relative stability of the camera.
Based on the physical simplification design mentioned above, the degradation effect of the payload optical system mainly originates from four types of coupling factors, which are also the core objects that need to be compensated for in algorithm enhancement. The specific analysis is as follows:
Surface error degradation: The main mirror surface accuracy is λ/10, introducing multi-scale wavefront errors, of which low-order aberrations (spherical aberration, coma, and astigmatism) account for 75%, mid-frequency ripple errors (10–100 cycles/mm) account for 20%, and high-frequency scattering errors account for 5%. After calculation, the degree of PSF blur caused by surface shape error is 1.8–2.2 pixels, which affects imaging clarity.
Deviation degradation in installation and adjustment: The allowable deviation between the primary and secondary mirrors is ≤0.01 mm, which can cause a focal length change of Δf = 10.59 mm/0.01 mm, leading to uneven spatial distribution of PSF and a 60% increase in blur in the edge area of the field of view compared to the center area.
Interference and noise degradation: The interference coefficient is ≤3%. After calculation, interference causes an increase in image background brightness of 12%~15% and a decrease in signal-to-noise ratio of 8%~10%. The detector has photon noise and dark current noise (≤10 nA/cm2), which are combined with cosmic ray interference in the orbit environment, further reducing image quality.
Dynamic disturbance degradation: The satellite attitude stability is ≤0.001°/s. After calculation, the image shift caused by attitude disturbance is 0.3~0.5 pixels, which exacerbates image blur, especially in the edge area of the field of view.
The above-mentioned degradation effects are coupled with each other, resulting in non-uniform blurring, edge dispersion, artifacts, radiation deviation and other problems in the original output image of the load. Accurate PSF modeling and degradation model construction, combined with algorithms, are required to achieve comprehensive compensation.
The diffraction effect of light follows the Fourier transform law. PSF, as an ideal point light source, produces imaging results through an optical system. Its intensity distribution is the square of the Fourier transformed mode of the pupil function. Considering the spatial shift characteristics (field-of-view position influence), the final PSF expression is
h ( x , y ; u 0 , v 0 ) = | F { P ( u , v ) e x p [ j k W ( u u 0 , v v 0 ) ] } | 2
In the formula: ( u 0 , v 0 ) is the coordinate of the field-of-view position, reflecting the spatial displacement characteristics of PSF; k = 2 π / λ is the number of light waves (λ is taken as the center wavelength of the panchromatic spectrum at 625 nm, k ≈ 1.005 × 10⁷ rad/m); F{·} is a two-dimensional Fourier transform; and (x, y) are the image plane coordinates in pixels. After calculation, the calculation error of this formula is ≤2%, which meets the engineering accuracy requirements.
Considering the spatial shift characteristics of load imaging, spectral coupling effects (panchromatic + multispectral), and multi-source noise effects, a generalized degradation model in the continuous domain is derived based on radiative transfer theory. The expression is as follows:
g ( x , y ) = λ ( R 2   f λ ( ξ , η ) h λ ( x , y ; ξ , η ) d ξ d η ) d λ + n t o t a l ( x , y )
The parameters in the formula are strictly defined in combination with the load characteristics, as follows:
g (x, y): the observation image (DN value) output by the load detector.
λ: spectral wavelength, covering 450–800 nm (panchromatic), with multispectral spectral bands divided into four channels (center wavelengths of 480 nm, 550 nm, 650 nm, 750 nm).
f λ ( ξ , η ) : the radiation distribution of an ideal object at wavelength λ, with a range of 0.5–2.5 W/(m2·sr·nm).
h λ ( x , y ; ξ , η ) : the PSF corresponding to the wavelength λ and spatial position (ξ, η), obtained by the modeling method, varies with the position of the field of view.
n t o t a l ( x , y ) : system comprehensive noise, using a multi-source physical noise mode.
To meet the deployment requirements of in-orbit algorithms, combined with the division of the field-of-view area, the continuous domain model is discretized using block local spatial shift-invariant approximation to obtain a discrete-domain engineering degradation model, expressed as
g k ( m , n ) = f k ( m , n ) h k ( m , n ) + n k ( m , n ) , ( m , n ) Ω k
The parameters in the equation are explained as follows:
k = 1, 2,…, 9: field-of-view area number, consistent with the area division calculated by PSF.
g k ( m , n ) , f k ( m , n ) , n k ( m , n ) : represent the discrete observation image, ideal image, and noise matrix of the kth region, with a size of 256 × 256 pixels and a sampling rate consistent with the load detector (7 μm/pixel).
h k ( m , n ) : the discrete PSF of the kth region, obtained by sampling continuous PSFs at 7 μm/pixel, with a size of 33 × 33 pixels (covering the effective range of PSF).
After calculation, the processing time for a single region is ≤0.1 s, which meets the real-time processing requirements in orbit (imaging time per circle of the payload is ≥5 min).
The accuracy of the degradation model is verified by combining laboratory testing with in-orbit measurement data of the payload. The specific steps and calculation results are as follows:
Laboratory validation: Build a load simulation testing platform; input standard target radiation distribution; introduce measured wavefront error, stray light, and noise parameters; and generate simulated degraded images. Using the degradation model constructed in this article, input the same parameters to generate a predicted degraded image. Comparing the peak signal-to-noise ratio (PSNR) and structural similarity (SSIM) of the two, the calculation results show that PSNR ≥ 29 dB, SSIM ≥ 0.96, and noise statistical deviation ≤ 3% are consistent with the actual imaging degradation law of the payload.
In-orbit testing verification: Select the original degraded images of three typical scenarios (urban, agricultural, and mountainous) obtained by the payload in orbit, extract their fuzzy characteristics and noise distribution, and compare them with the model prediction results. After calculation, the deviation between the predicted blur level and noise intensity of the model and the measured data is ≤5%, which can accurately capture the imaging degradation law of the load.
The verification results indicate that the imaging degradation model constructed in this paper can accurately characterize the optical degradation process of lightweight loads, providing reliable theoretical and data support for subsequent algorithm compensation.

2.2. Camera Design

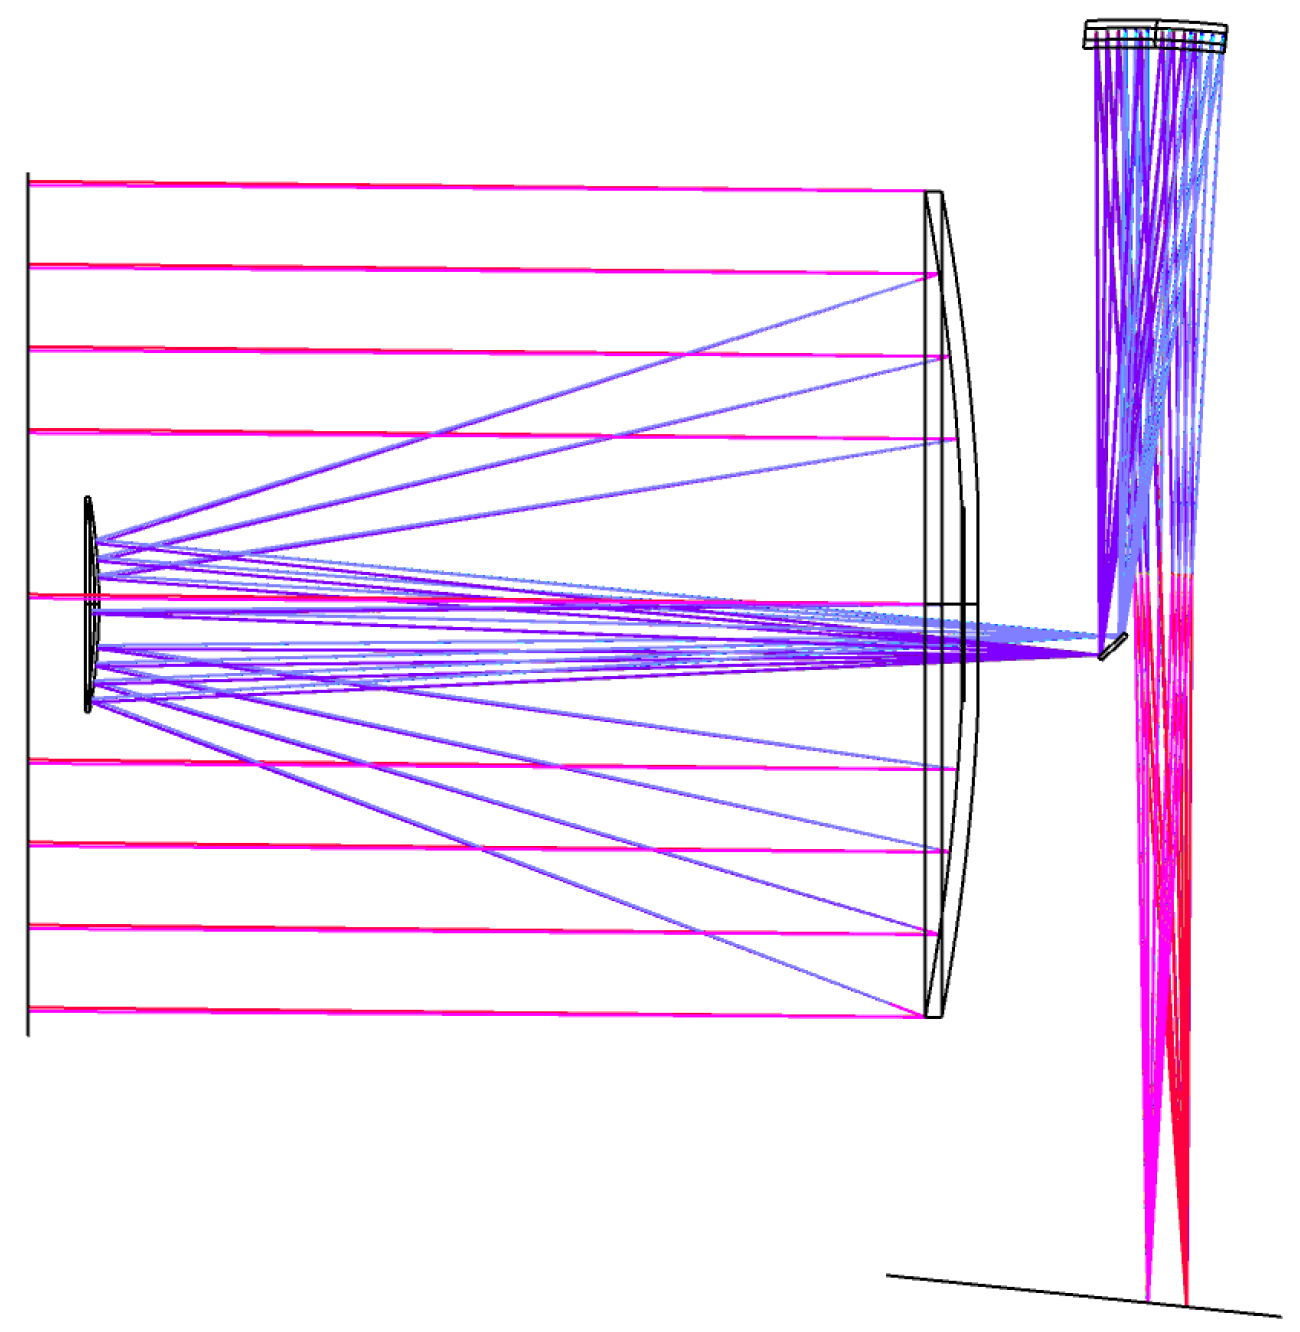
According to the requirements of the indicators, the optical system adopts a coaxial three-mirror optical system, as shown in Figure 2. The system mainly consists of a primary mirror, a secondary mirror, and three mirrors. The entrance pupil diameter of the system is 600 mm, the total length of the system is 800 mm, and the designed field-of-view angle is 1.9°. Combining remote sensing conditions with intelligent imaging (computational imaging, in-orbit AI, multimodal) characteristics, different from traditional optical cameras, the design needs to take into account five dimensions: optical performance, platform adaptation, intelligent imaging adaptation, environmental reliability, and payload integration.
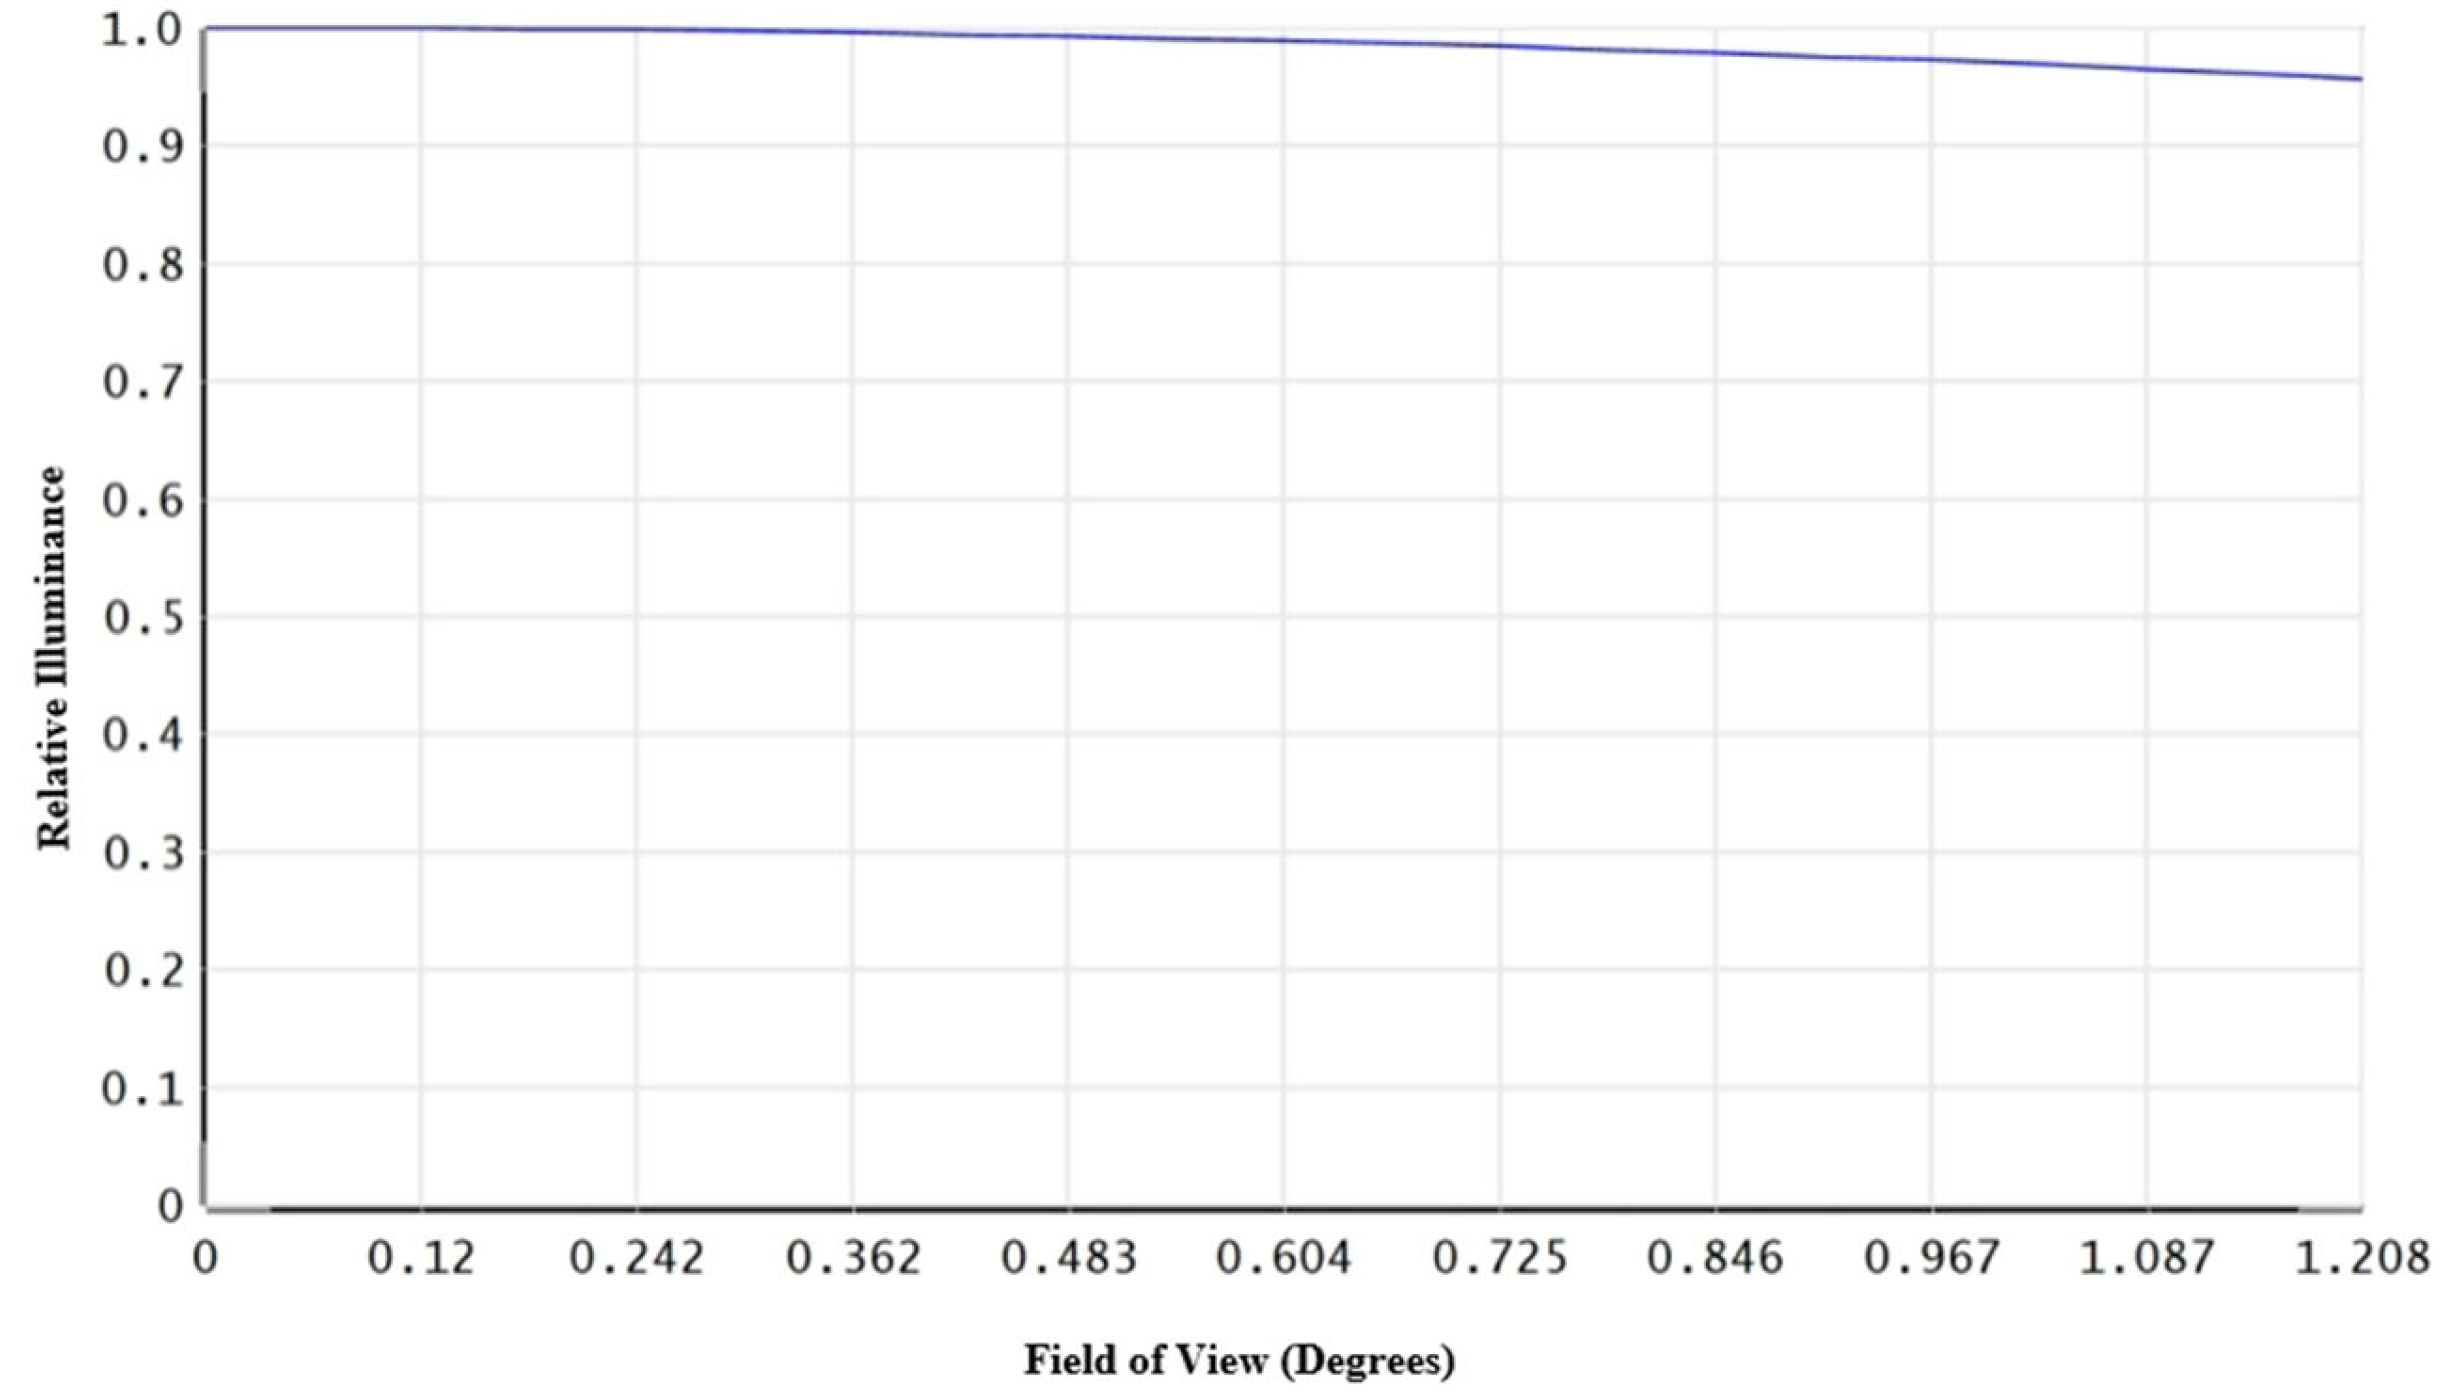
The uniformity of illumination on the image plane of an optical system is one of the key indicators for measuring its imaging quality, which directly affects the visual effect of imaging and the accuracy of subsequent image analysis. The relative illuminance curve of the image plane of this optical system is shown in Figure 3. From the trend presented by the curve, it can be seen that the illuminance change in the image plane is relatively gentle within the field of view (Y Field). After analysis and calculation, the unevenness of image surface illumination within the field of view is less than 4%. The essence of the RI curve of intelligent remote sensing cameras is “optical weakening + AI enhancement”: abandoning the traditional camera’s “full field of view optical perfection” in exchange for high uniformity, gradual descent, spectral consistency, and controllable and adjustable RI characteristics, which not only reduces payload weight and cost, but also meets the strict requirements of intelligent interpretation for brightness uniformity.
Good uniformity of image illumination means that the brightness distribution of the imaging area is relatively consistent throughout the entire field of view, and there will be no locally too bright or too dark situations. It can ensure that imaging details are clearly presented in various areas, avoiding image information loss or misjudgment caused by differences in illumination, and providing strong guarantees for the reliable application of optical systems in related fields.
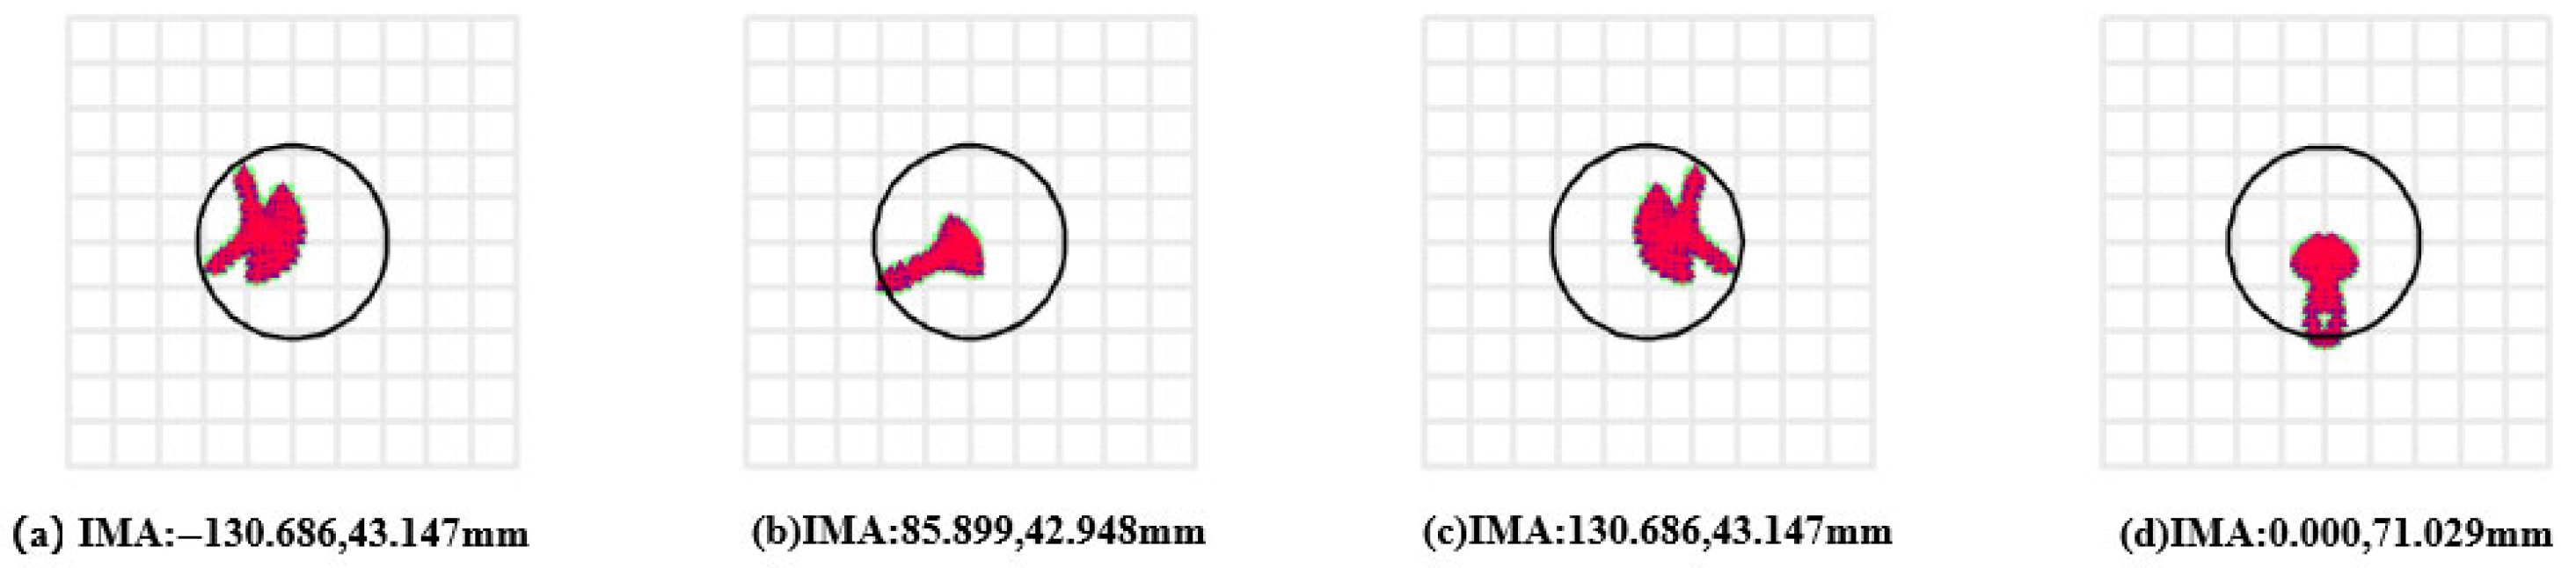
Figure 4 shows the full-field point array of the optical system, with the black circle indicating the size of the Airy spot, which is the diffraction limit. From Figure 4, it can be seen that the actual imaging spot diameter is smaller than the Airy spot diameter, indicating that the imaging quality of the system is close to the diffraction limit. The loose and controllable point array characteristics of intelligent remote sensing cameras reduce the strict requirements of optical systems for temperature, vibration, and atmospheric interference. By adopting a mode of moderate optical fault tolerance and algorithmic compensation, the adaptability to complex environments is greatly improved. It can maintain effective imaging and intelligent interpretation capabilities under extreme working conditions, while balancing lightweight and environmental robustness.
In this design process, full consideration was given to the diverse requirements of practical applications. The shading performance is the primary consideration, ensuring that as much stray light as possible is blocked to prevent it from entering the interior of the optical system. At the same time, lightweighting is also a key factor. Overly heavy light shields will increase the burden on the overall equipment, affecting transmission power consumption and cost. In addition, the stability of the structure cannot be ignored. The light shield needs to be able to maintain its structural stability under various environmental conditions, such as temperature changes, slight vibrations, etc., without deformation or damage, so as to continuously and effectively play its light-shielding role.
The energy distribution data of the optical system is shown in Figure 5, with imaging energy accounting for 97.82%, occupying an absolute dominant position, providing core energy support for efficient imaging of the system and high energy utilization efficiency. Meanwhile, the stray light in the system mainly includes three types: leakage light that does not pass through the primary and secondary mirrors (1.6%), focal frame scattering (0.14%), and scattered light from other structures (0.44%), with a comprehensive stray light coefficient of 2.18%. The optical system of the intelligent remote sensing camera has centralized energy, smooth attenuation throughout the field, controllable dispersion, less stray light, good band consistency, and algorithm compensation, balancing lightweight design and energy utilization efficiency in remote sensing detection.

2.3. Camera Body

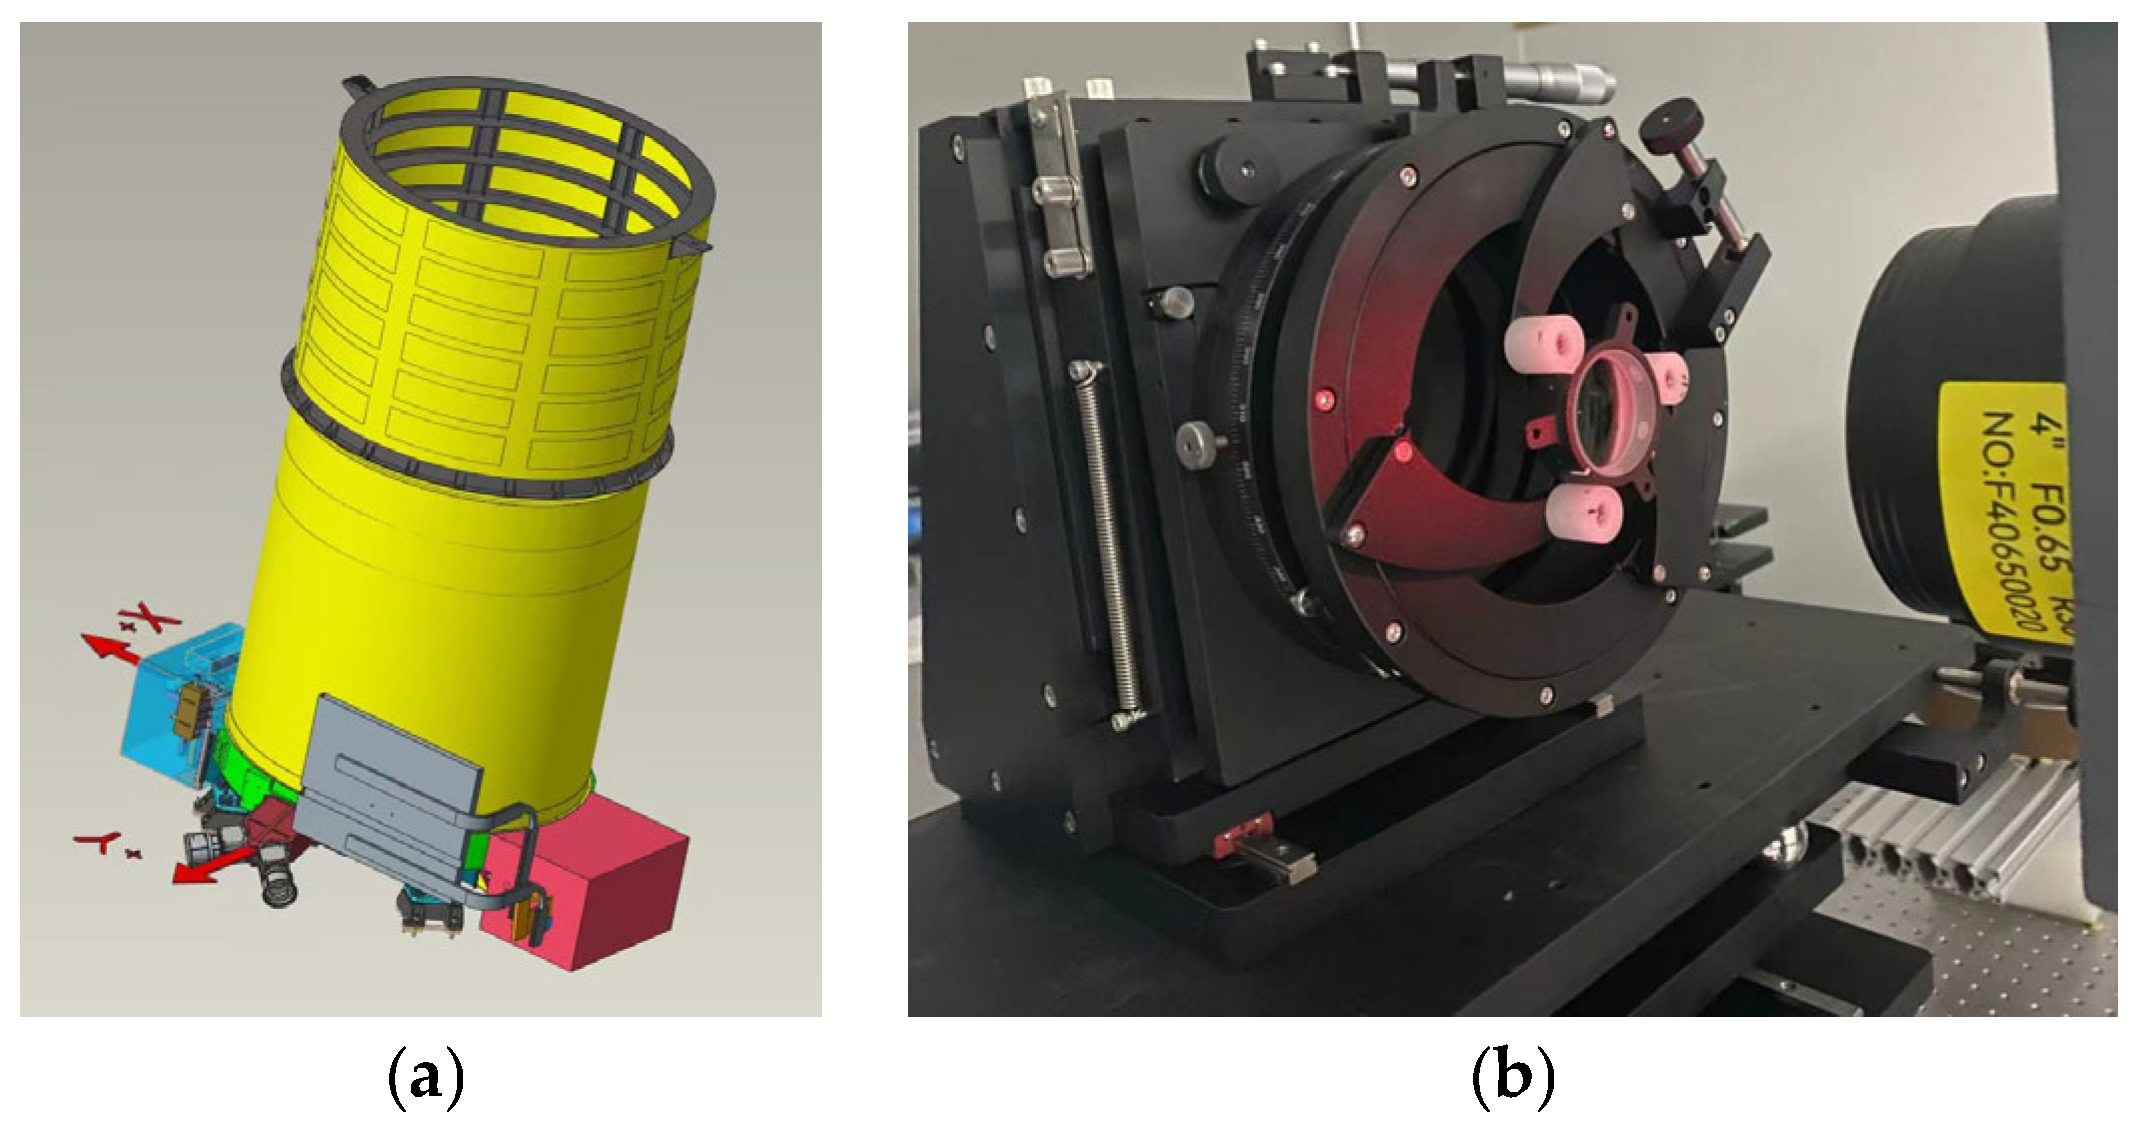
With the increasing demand for ground target resolution in Earth observation, various applications have put forward higher requirements for the resolution capability of optical systems. According to the Rayleigh criterion, the minimum angle that can be resolved by an optical imaging system is proportional to the wavelength of the optical wave and inversely proportional to the aperture of the optical system. Therefore, increasing the aperture of the light has become one of the important means to improve system resolution. However, increasing the aperture of the optical system requires increasing the size and mass of the optical components, and the size, mass, and cost of their supporting structures will also increase accordingly. Large-aperture space telescopes urgently need lightweight design. Space telescopes typically use reflective optical systems, and their large-aperture mirrors have become an important object of lightweight design. The lightweight design of mirrors will reduce their stiffness and their ability to resist environmental factors such as gravity that may cause a decrease in mirror surface accuracy. As shown in Figure 6, on the premise of meeting the requirements of mirror surface accuracy, designing and optimizing the structure of large-aperture mirrors, and maximizing the lightweight ratio, is one of the important contents of the optical mechanical system design of large-aperture space optical telescopes. The system adopts a lightweight telescope configuration, optimizes the aperture and optical path, controls vignetting, ensures uniform illumination and energy distribution of the image plane, achieves miniaturization, is lightweight, has strong mechanical adaptability, has a full-link extinction design, suppresses stray light, improves imaging signal-to-noise ratio, has a modular design, adapts to multimodal detection and has intelligent computing imaging.
The main structure of the camera consists of a main support structure, main optical components, rear main components, functional components, detector components, etc. The camera is fixedly installed on the satellite platform through an adapter. The structural design needs to meet both the dynamic and quality requirements of the camera body. The main support structure is made of high-stiffness SiC/C material, and a circular cavity structure design is used to minimize the structural quality. The installation interface of the optical and mechanical components is locally strengthened to achieve high stability and low thermal expansion of the overall optical and mechanical mechanism.
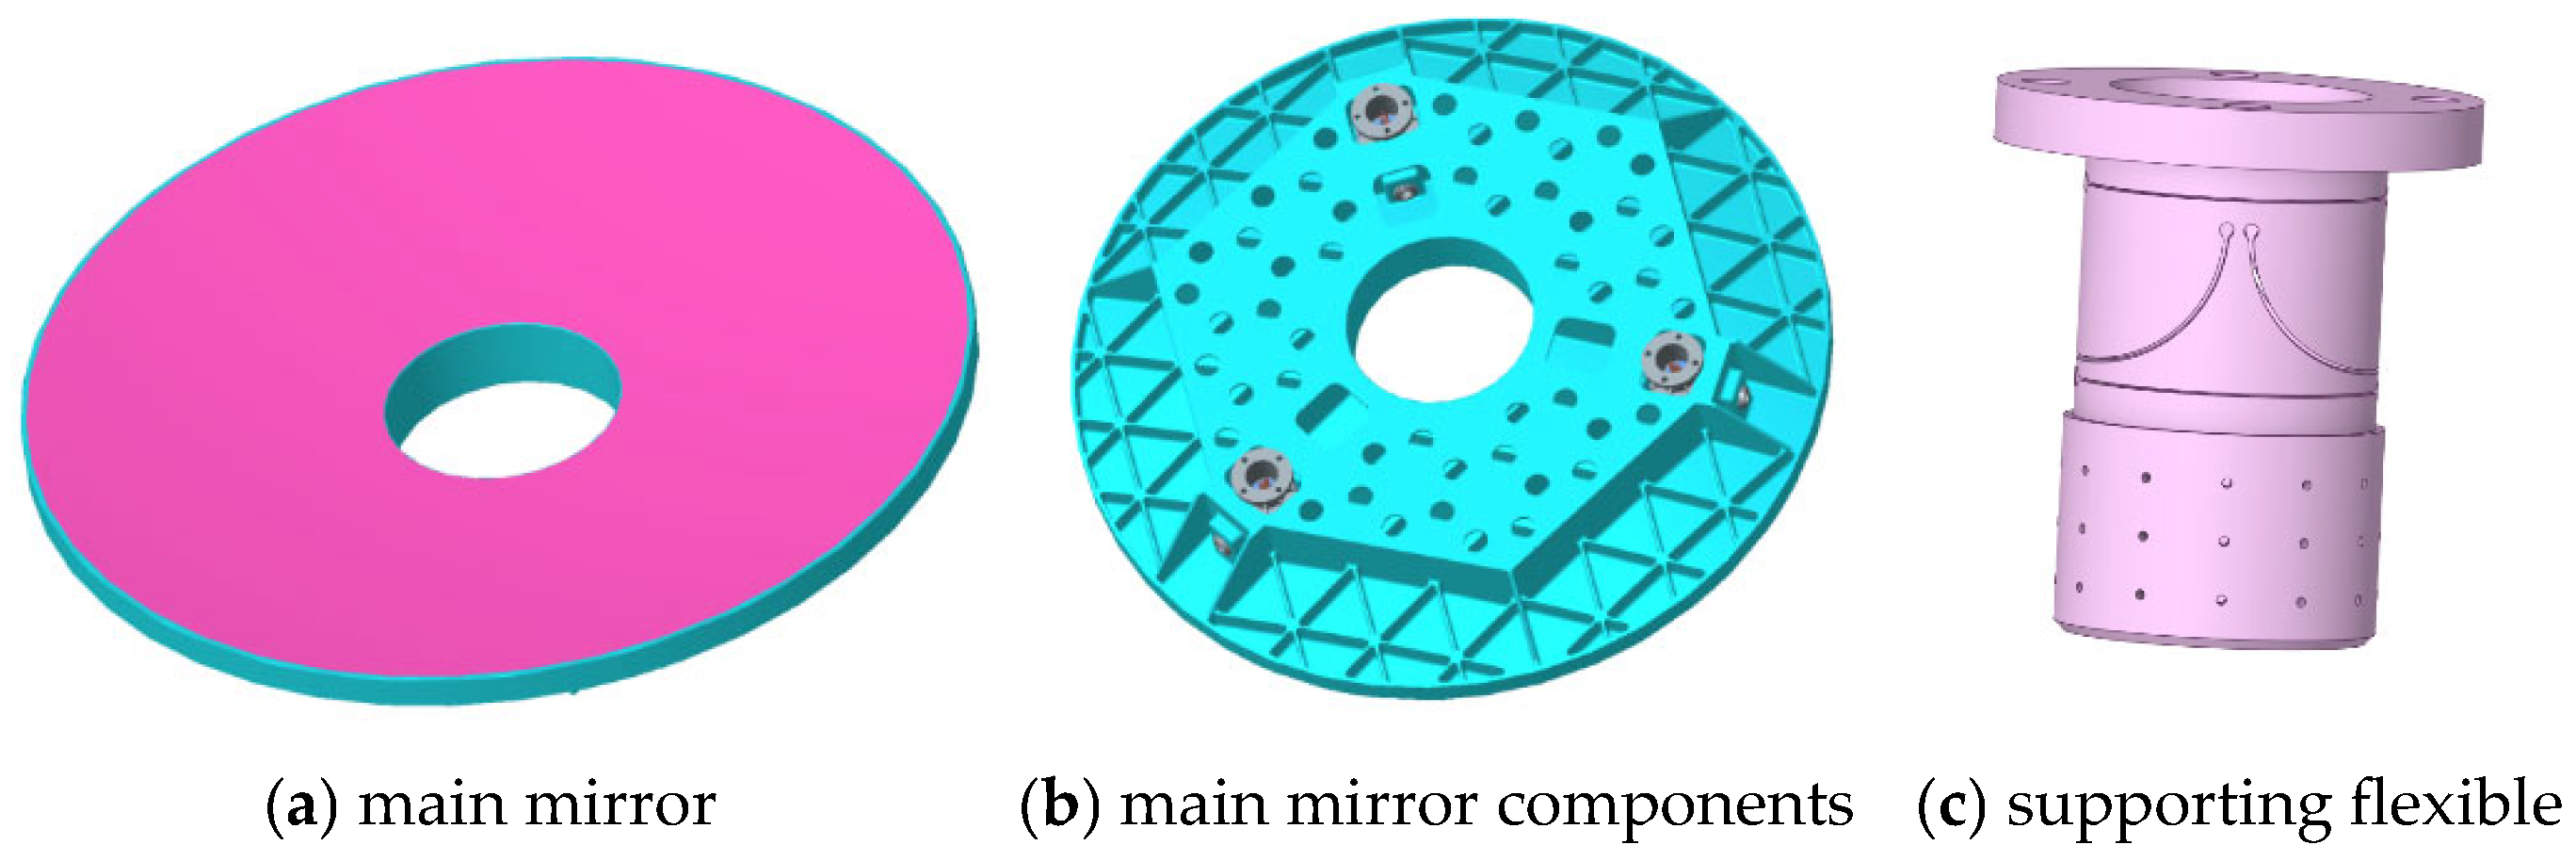
The main mirror is the largest optical component in the optical system, with a significant proportion of its mass. Therefore, from the perspective of maintaining good self-weight surface accuracy, reducing the quality of telescopes, and reducing launch costs, it is extremely necessary to carry out lightweight structural design for the large-aperture main mirrors. For the processing technology of silicon carbide mirrors for the main mirror, in order to improve the structural rigidity and lightweight rate of the mirror, a back closed structure is selected as the back structure of the main mirror. The main mirror material is made of SiC and adopts a lightweight triangular structure with a closed back. The panel thickness is 4 mm, and the main reinforcing rib thickness is 3 mm.
As shown in Figure 7, the main mirror adopts a three-point static support structure, which accurately constrains the six degrees of freedom of the reflector at three points without any additional constraints. The main mirror is made of lightweight optical materials with high specific stiffness and low thermal expansion, relaxing the requirements for surface accuracy and adopting a simplified non spherical system. A back hollow honeycomb structure achieves lightweight and high rigidity, with a thermal matching structure design to suppress temperature-dependent mirror deformation.
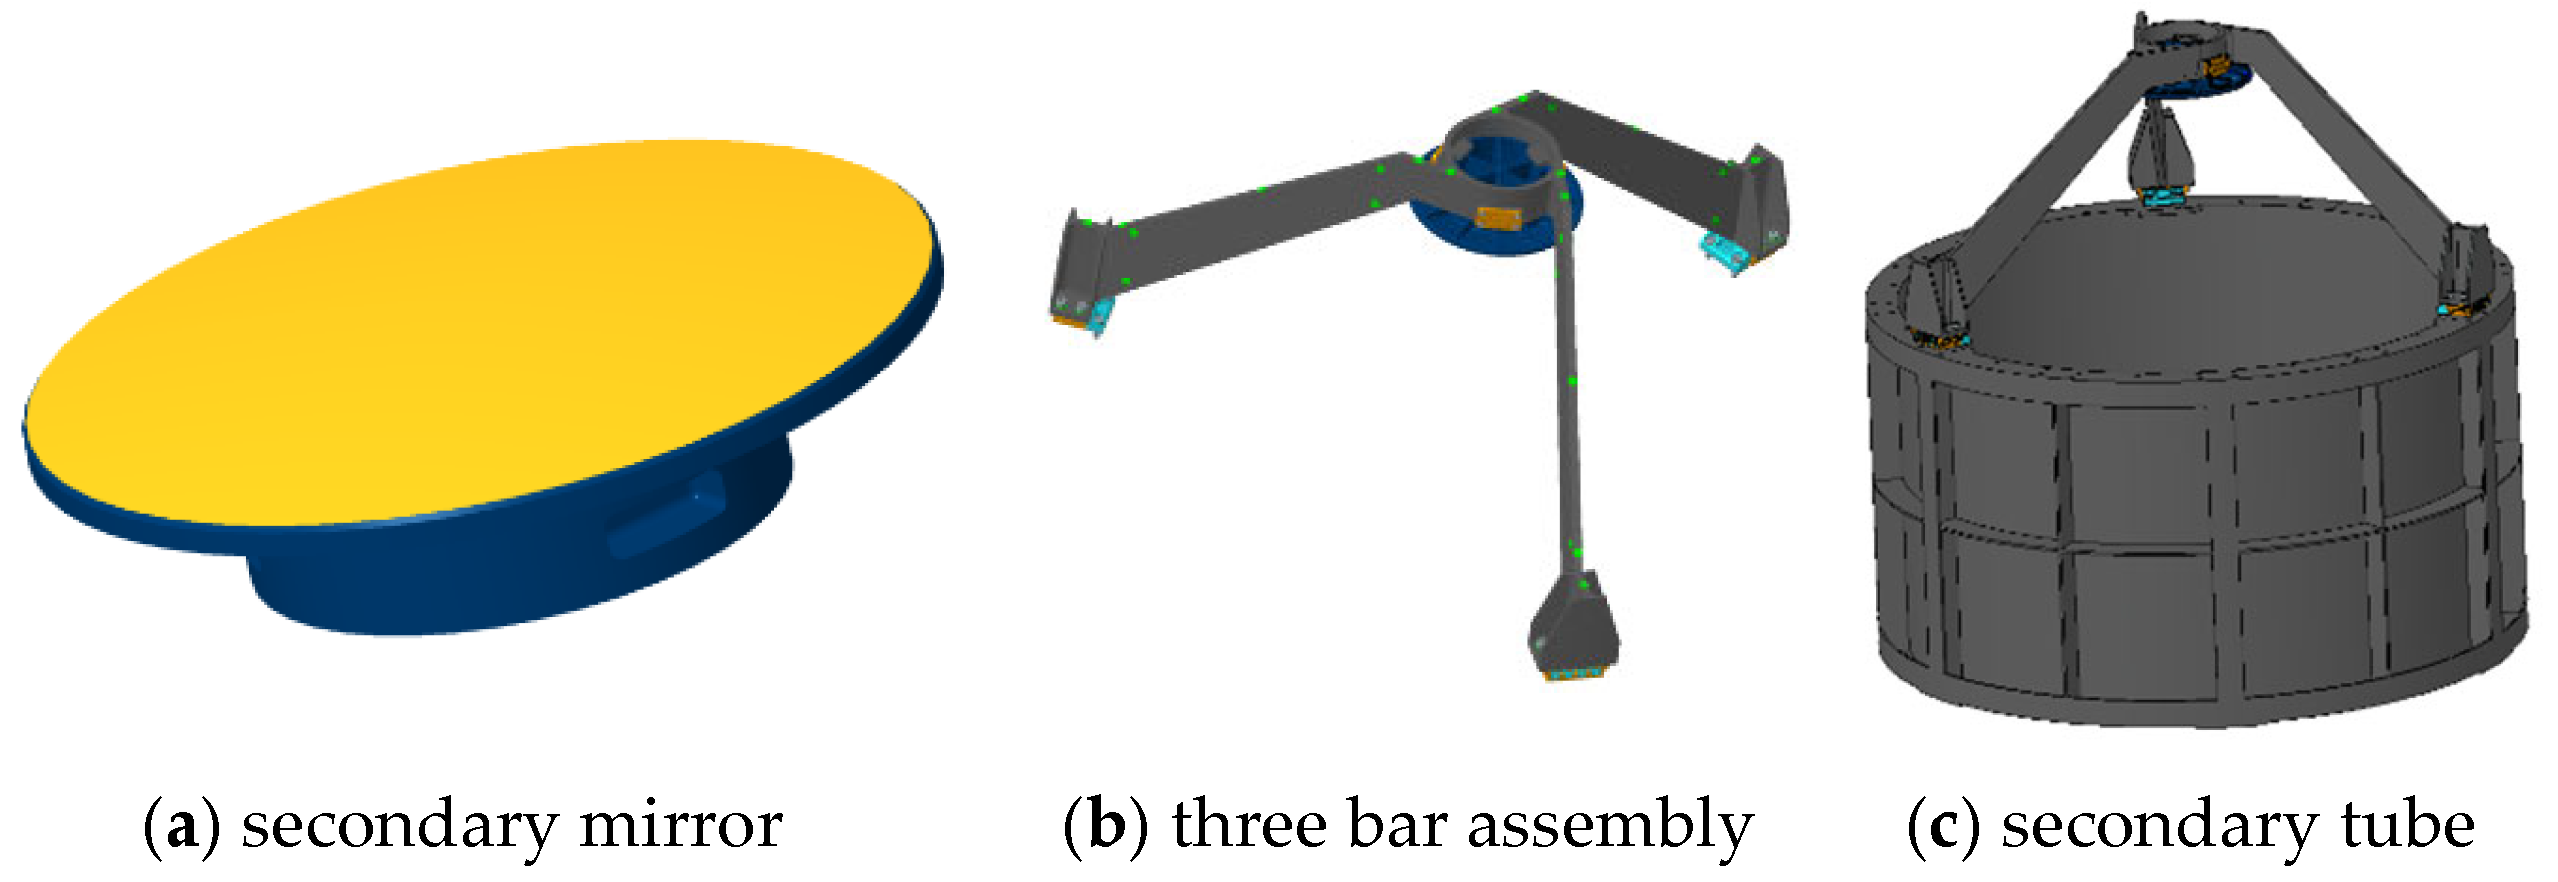
The secondary mirror is likewise fabricated from SiC, and a lightweight structural design is required to enhance its dynamic stiffness. Commonly employed lightweight hole patterns for reflective elements include triangular, hexagonal, quadrilateral, and sector-shaped configurations. Owing to the relatively small aperture of the secondary mirror, these different lightweighting patterns exert only a minor influence on its surface figure. Consequently, a symmetric fan-shaped lightweight hole configuration was adopted for the secondary mirror. As illustrated in Figure 8, the three support struts and the mirror barrel are manufactured from C/SiC composite material. The secondary mirror adopts a non-spherical structure to assist in correcting system aberrations, and is made of lightweight materials with low thermal expansion and high stiffness, which are thermally matched with the primary mirror. The small and lightweight design reduces center obstruction and minimizes diffraction effects. The symmetrical thin-walled support structure is resistant to vibration and deformation. The SiC secondary mirror utilizes an open-back, fan-shaped lightweight structure, with a faceplate thickness of 4 mm and primary reinforcing rib thickness of 3 mm.
Considering the secondary mirror and its support, as well as the obstruction formed by the central opening of the primary mirror, the transfer function diagram of the optical system is shown in Figure 9. The on-axis field-of-view OTF performance is excellent, with stable low-frequency and mid-frequency transmission. The full-field-of-view OTF decays smoothly from the center to the edges without any drastic jumps. The imaging quality of the full field and full spectral range is close to the diffraction limit, with a secondary mirror blocking diameter of 79 mm and a system transmission mean of 0.3161 at the Nyquist frequency of 71.4l lp/mm.
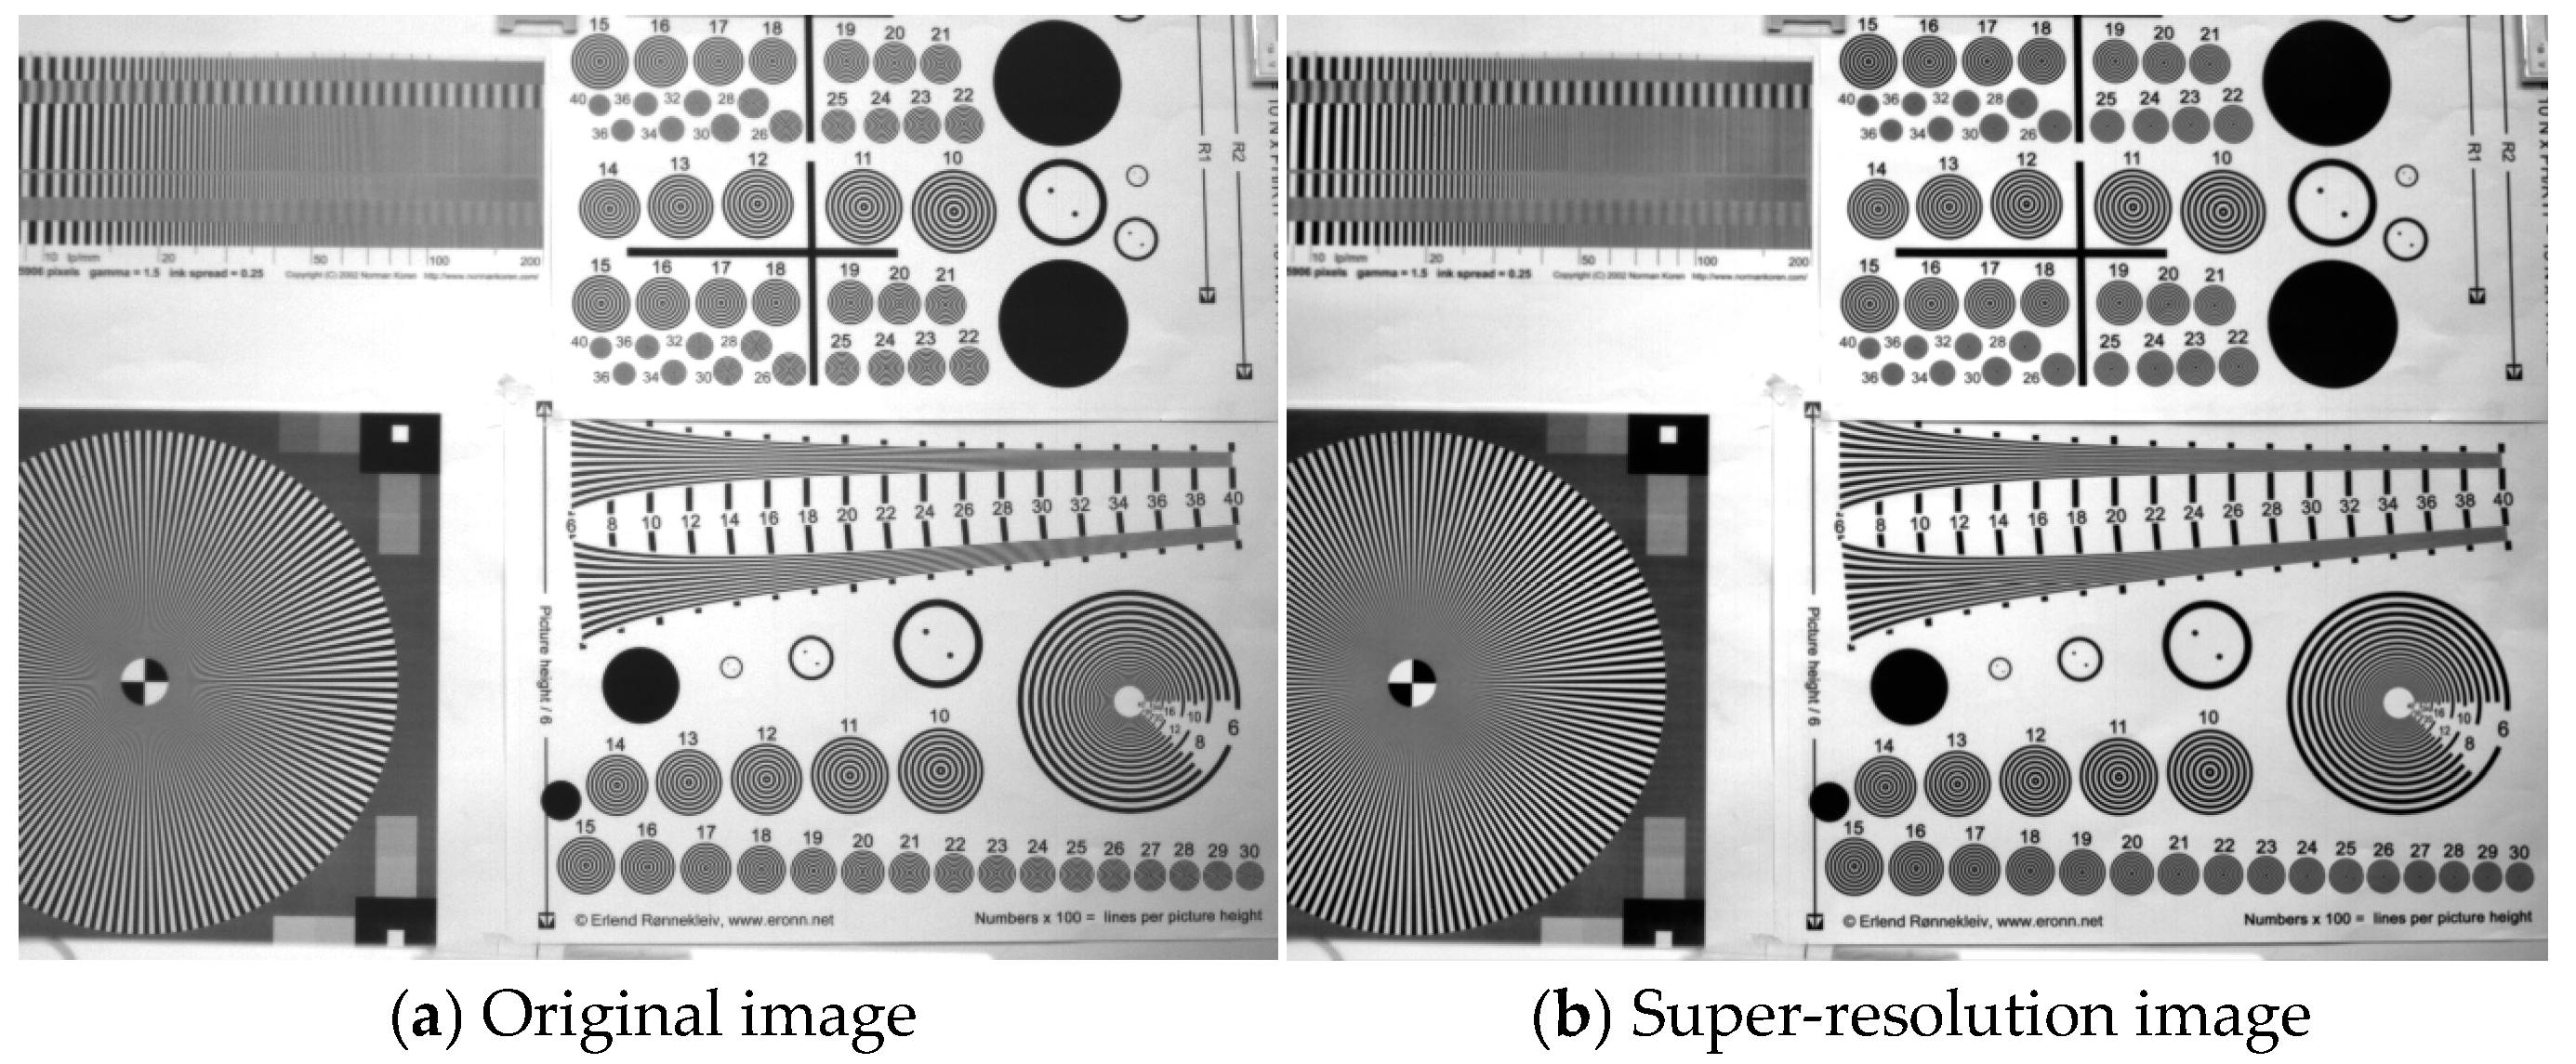
As a key component of space-based intelligent remote sensing, the formation of optical remote sensing images is closely related to the lighting mode of the scene, the optical transfer function of the system, and the sampling of the image sensor. The design of an optical remote sensing imaging system requires joint optimization in both optical and algorithmic aspects based on specific imaging tasks. By preprocessing the images obtained by the optical system, such as denoising, pixel super-resolution, background blurring, etc., better visual effects can be obtained, as shown in Figure 10. Image preprocessing corrects uneven illumination of the image plane and non-uniform response of the detector, compensates for optical residual aberrations, improves imaging blur and distortion, reduces multidimensional noise, and enhances image signal-to-noise ratio.
Based on the design plan, the components of the engineering prototype include optical lenses, optical mechanical structures, mechanisms, electronic standalone machines, etc. We have successively completed optical lens components such as optics and filters, optical mechanical structural components such as the main load-bearing plate and rear body support frame, and mechanical components such as the diffuse reflection plate calibration mechanism, on-board blackbody mechanism, and filter box mechanism. We have also completed the development and transformation of various channel video, management controller, mechanism controller, and other electronic standalone machines. Finally, the engineering prototype was developed through system installation and assembly, and relevant imaging testing, calibration testing, signal-to-noise ratio improvement testing, and other system level experiments were conducted to verify the core performance.


3. Compensation Mechanism and Verification of Optical Degradation Using Computational Methods

3.1. Algorithm Enhancement System and Compensation Logic

Based on the above PSF modeling and imaging degradation model, a four-level algorithm enhancement system of “in orbit PSF intelligent estimation model-driven deconvolution adaptive super-resolution reconstruction radiation fidelity correction” is constructed. The degradation compensation mechanism of each module is clarified, and the calculation process and validation data are sorted out to ensure that the compensation effect is quantifiable, reproducible, and verifiable.
The algorithm system adopts a design approach that combines model-driven and data-driven approaches. Each level of the module corresponds to compensation for specific degradation effects, with clear core formulas and calculation parameters to ensure logical closure and engineering feasibility.
In-orbit PSF intelligent estimation (compensating for spatial displacement and multi-scale wavefront errors): Based on the AS Mask R-CNN hybrid network, the input includes star point images and high-texture ground object images obtained by the payload in orbit, and outputs refined PSF for nine regions of the full field of view, introducing wavefront smoothness constraints (Zernike prior) during network training. After calculation, the PSF estimation error is ≤3%, and the normalized cross-correlation coefficient is ≥0.92, which can accurately match the actual PSF characteristics of the load.
Model-driven joint deconvolution restoration (compensating for surface shape error and tuning deviation): Based on a discrete-domain degradation model, the Richardson Lucy iterative deconvolution algorithm is used, combined with L1 regularization to suppress noise amplification. The core formula is
h a t f k + 1 ( m , n ) = h a t f k ( m , n ) c d o t f r a c h k ( m , n ) × g k ( m , n ) h k ( m , n ) × h a t f k ( m , n ) + v a r e p s i l o n
In the formula: h k ( m , n ) is the conjugate matrix of h k ( m , n ) ; ε = 1 × 10⁻⁶. The iteration count is set to 20 times and the regularization coefficient λ = 0.01. This step can reduce the FWHM of the edge area of the field of view from 2.2 pixels to 1.3 pixels, significantly suppressing non-uniform blurring.
Adaptive super-resolution reconstruction (compensating for resolution degradation): Based on the design requirements of the sub-satellite point resolution of the payload, multi-frame sub-pixel registration fusion and the lightweight Mask R-CNN super-resolution network are used to improve the spatial resolution of the restored image to the design specifications. The registration accuracy is ≤0.1 pixels, and the magnification of the super-resolution network is two times. After calculation, the MTF of the super-resolution image is ≥0.30, which meets the requirements of space remote sensing applications, simultaneously introducing edge protection constraints to avoid false textures.
Radiation fidelity and artifact suppression (compensating for clutter and noise): Based on the prior information of clutter and noise in the degradation model, the attention mechanism is used to locate the clutter artifact area, and adaptive threshold filtering is used to suppress noise (threshold is 3 σ, σ is the noise standard deviation). Using the radiation correction algorithm, the image radiation deviation is controlled within 5%, and the core formula is
h a t I ( m , n ) = I ( m , n ) c d o t f r a c I i d e a l ( m , n ) I m e a s u r e d ( m , n ) (where I_ideal is the ideal radiation value and I_measured is the measured radiation value).

3.2. Network Architecture

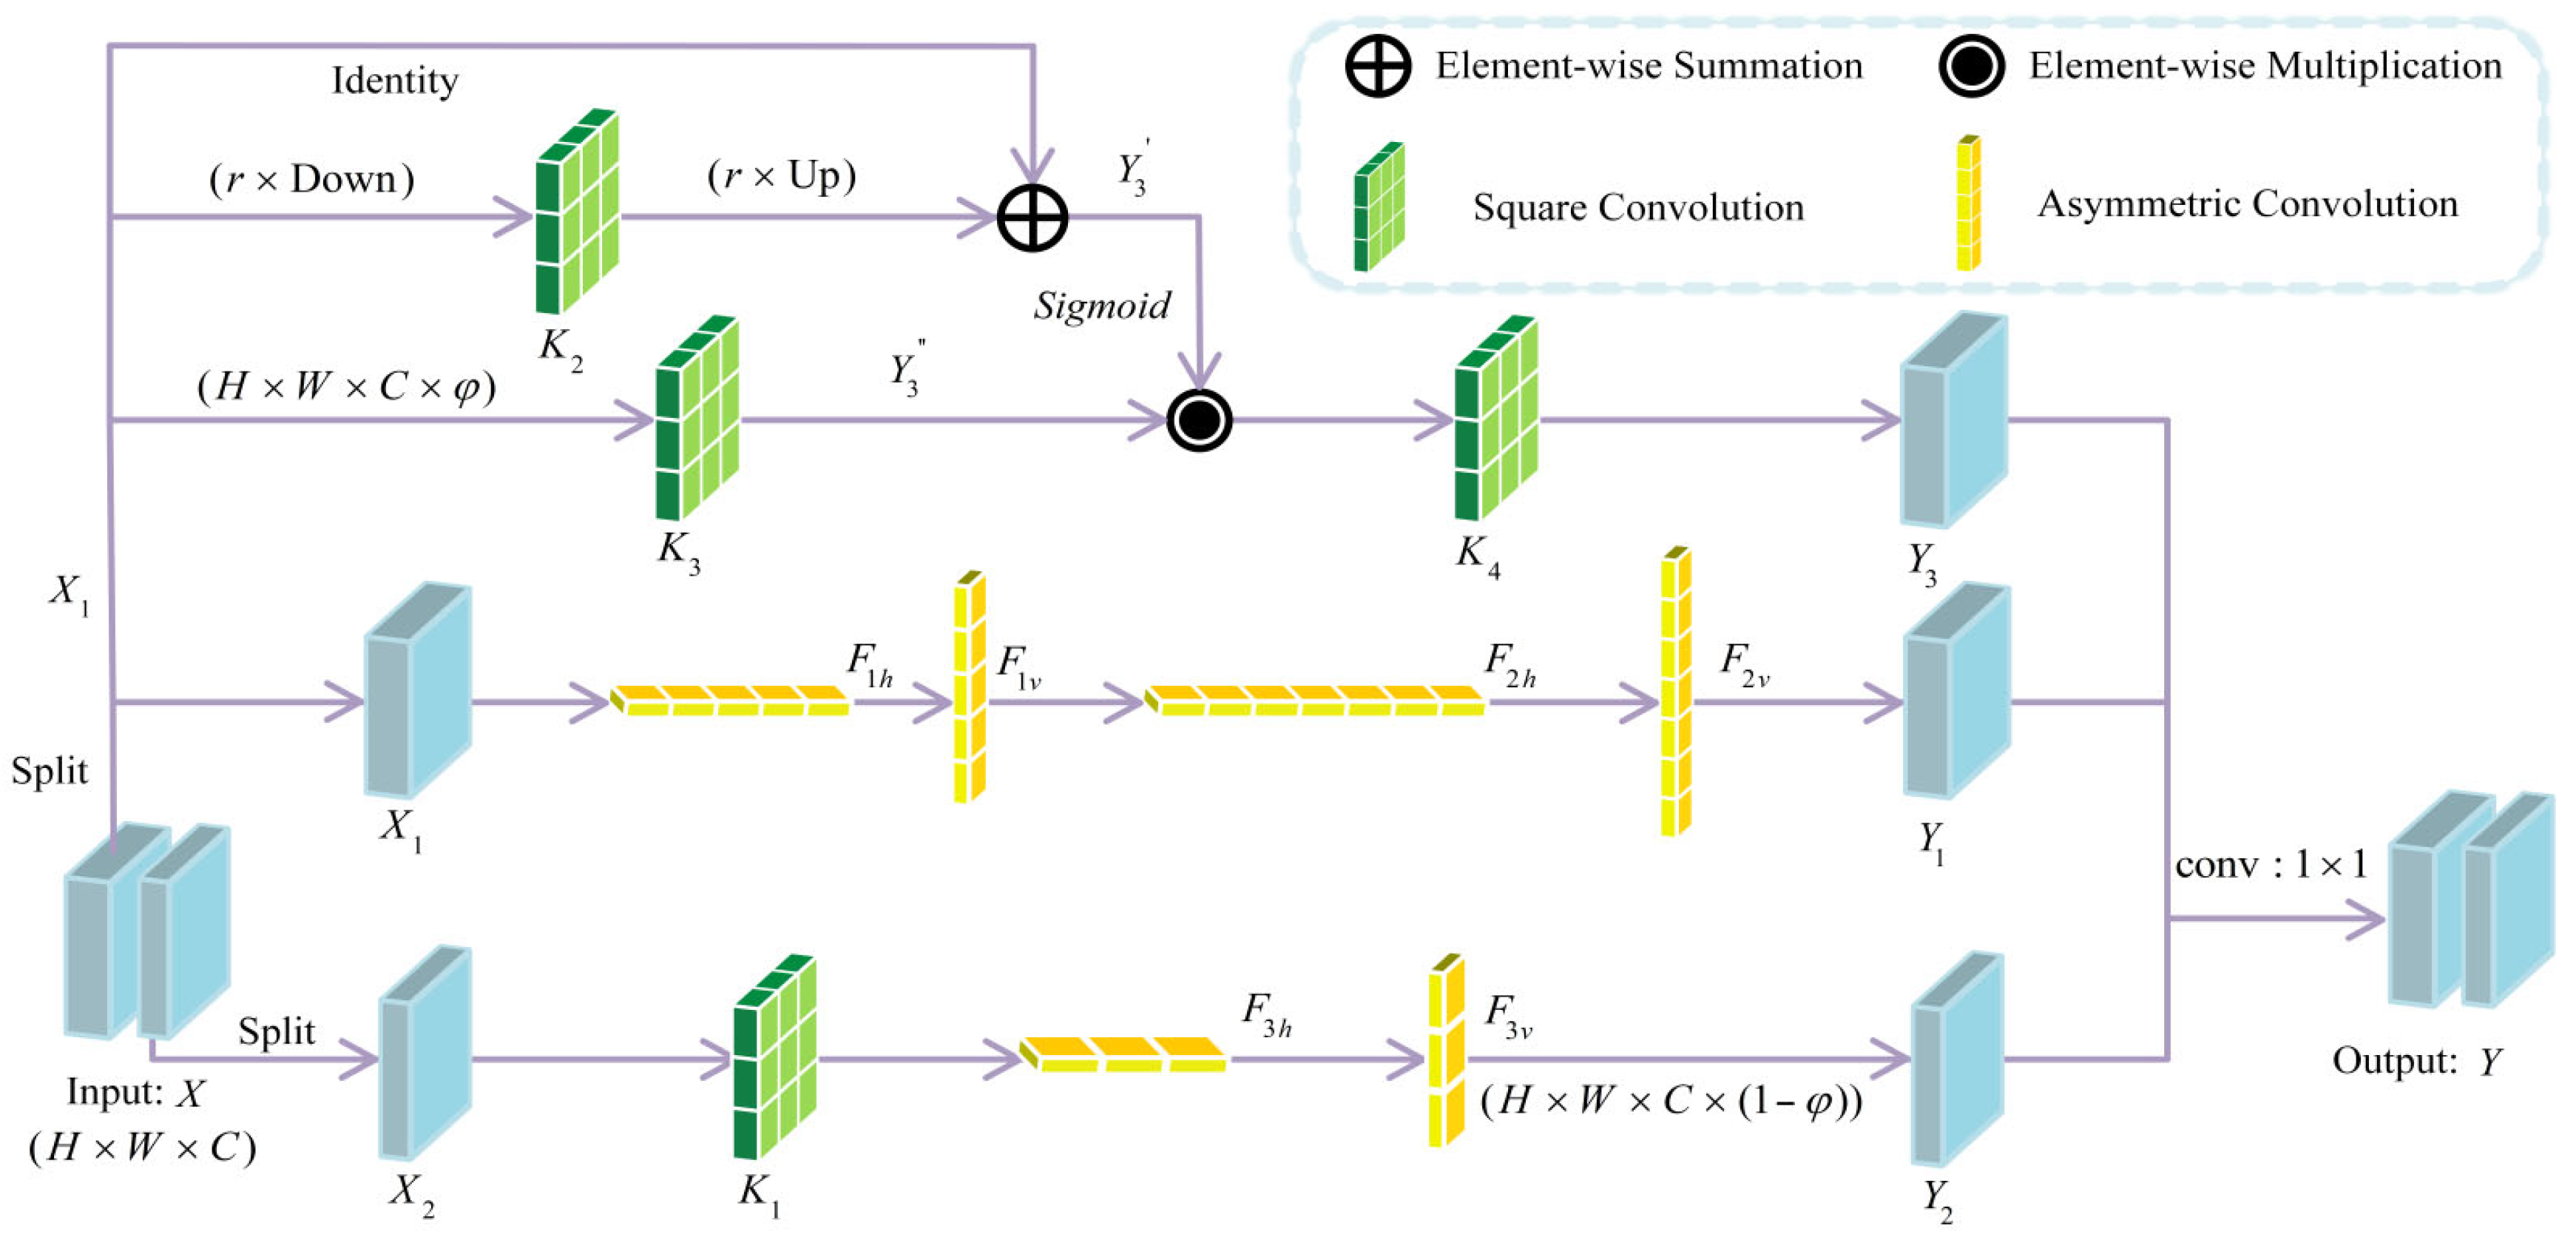
As the backbone network deepens, the hardware requirements for researchers also increase. The improved Self-calibrated Convolution (SC) improves the models’ ability to extract features without increasing the complexity of the backbone network. The Improved SC enables the feature map to be more discriminative by focusing on a larger spatial scope compared to the traditional 3 × 3-sized convolution kernel. Based on SC, the Improved SC increases the number of channels in the X1 branch to enhance the self-calibration.
The Asymmetric Convolution (AC) module uses convolution kernels with unequal length and width. In mainstream backbone networks (e.g., VGG16 and ResNet101), square kernels are commonly used to reduce the input scale, integrate information, extract features, and adjust the channels of the feature maps. AC can improve the model’s robustness to image flipping [8]. The output, produced by a 1 × N-sized horizontal kernel and an N × 1-sized vertical kernel, is equivalent in size to an N × N-sized square kernel.
A new module, named the AS Module, is proposed by combining AC and Improved SC, and it is integrated in the FPN structure successfully.
The structure of the AS module is shown in Figure 11. The channels of X 1 A ( H × W × ( φ × C ) ) are more than those of X 2 A H × W × ( ( 1 φ ) × C ) . φ expressed the channel ratio between X 1 and X . The shapes of Y 1 and Y 3 are the same as that of X 1 . X 2 successively passes a 3 × 3 - sized square kernel K 1 , a 1 × 3 - sized horizontal kernel F 3 h , and a 3 × 1 - sized vertical kernel F 3 v to obtain Y 2 , as shown in (1). The shape of Y 2 is the same as that of X 2 . Y 2 extracts the original spatial context information in X , and carries a stronger robustness to image flipping.
Y 2 = X 2 K 1 F 3 h F 3 v
where K i , i = 1 , 2 , 3 , 4 denotes a square kernel, F i j , i = 1 , 2 , 3 ;   j = h ( horizontal ) , v ( vertical ) denotes an AC, and * denotes the convolution operation. Then,  X 1 is successively passed through a 1 × 5 - sized horizontal kernel F 1 v , a 5 × 1 - sized vertical kernel F 1 v , a 1 × 7 - sized horizontal kernel F 2 h , and a 7 × 1 - sized vertical kernel F 2 v to obtain Y 1 , as shown in (2). Y 1 contains the feature information from a larger spatial field of view.
Y 1 = X 1 F 1 h F 1 v F 2 h F 2 v
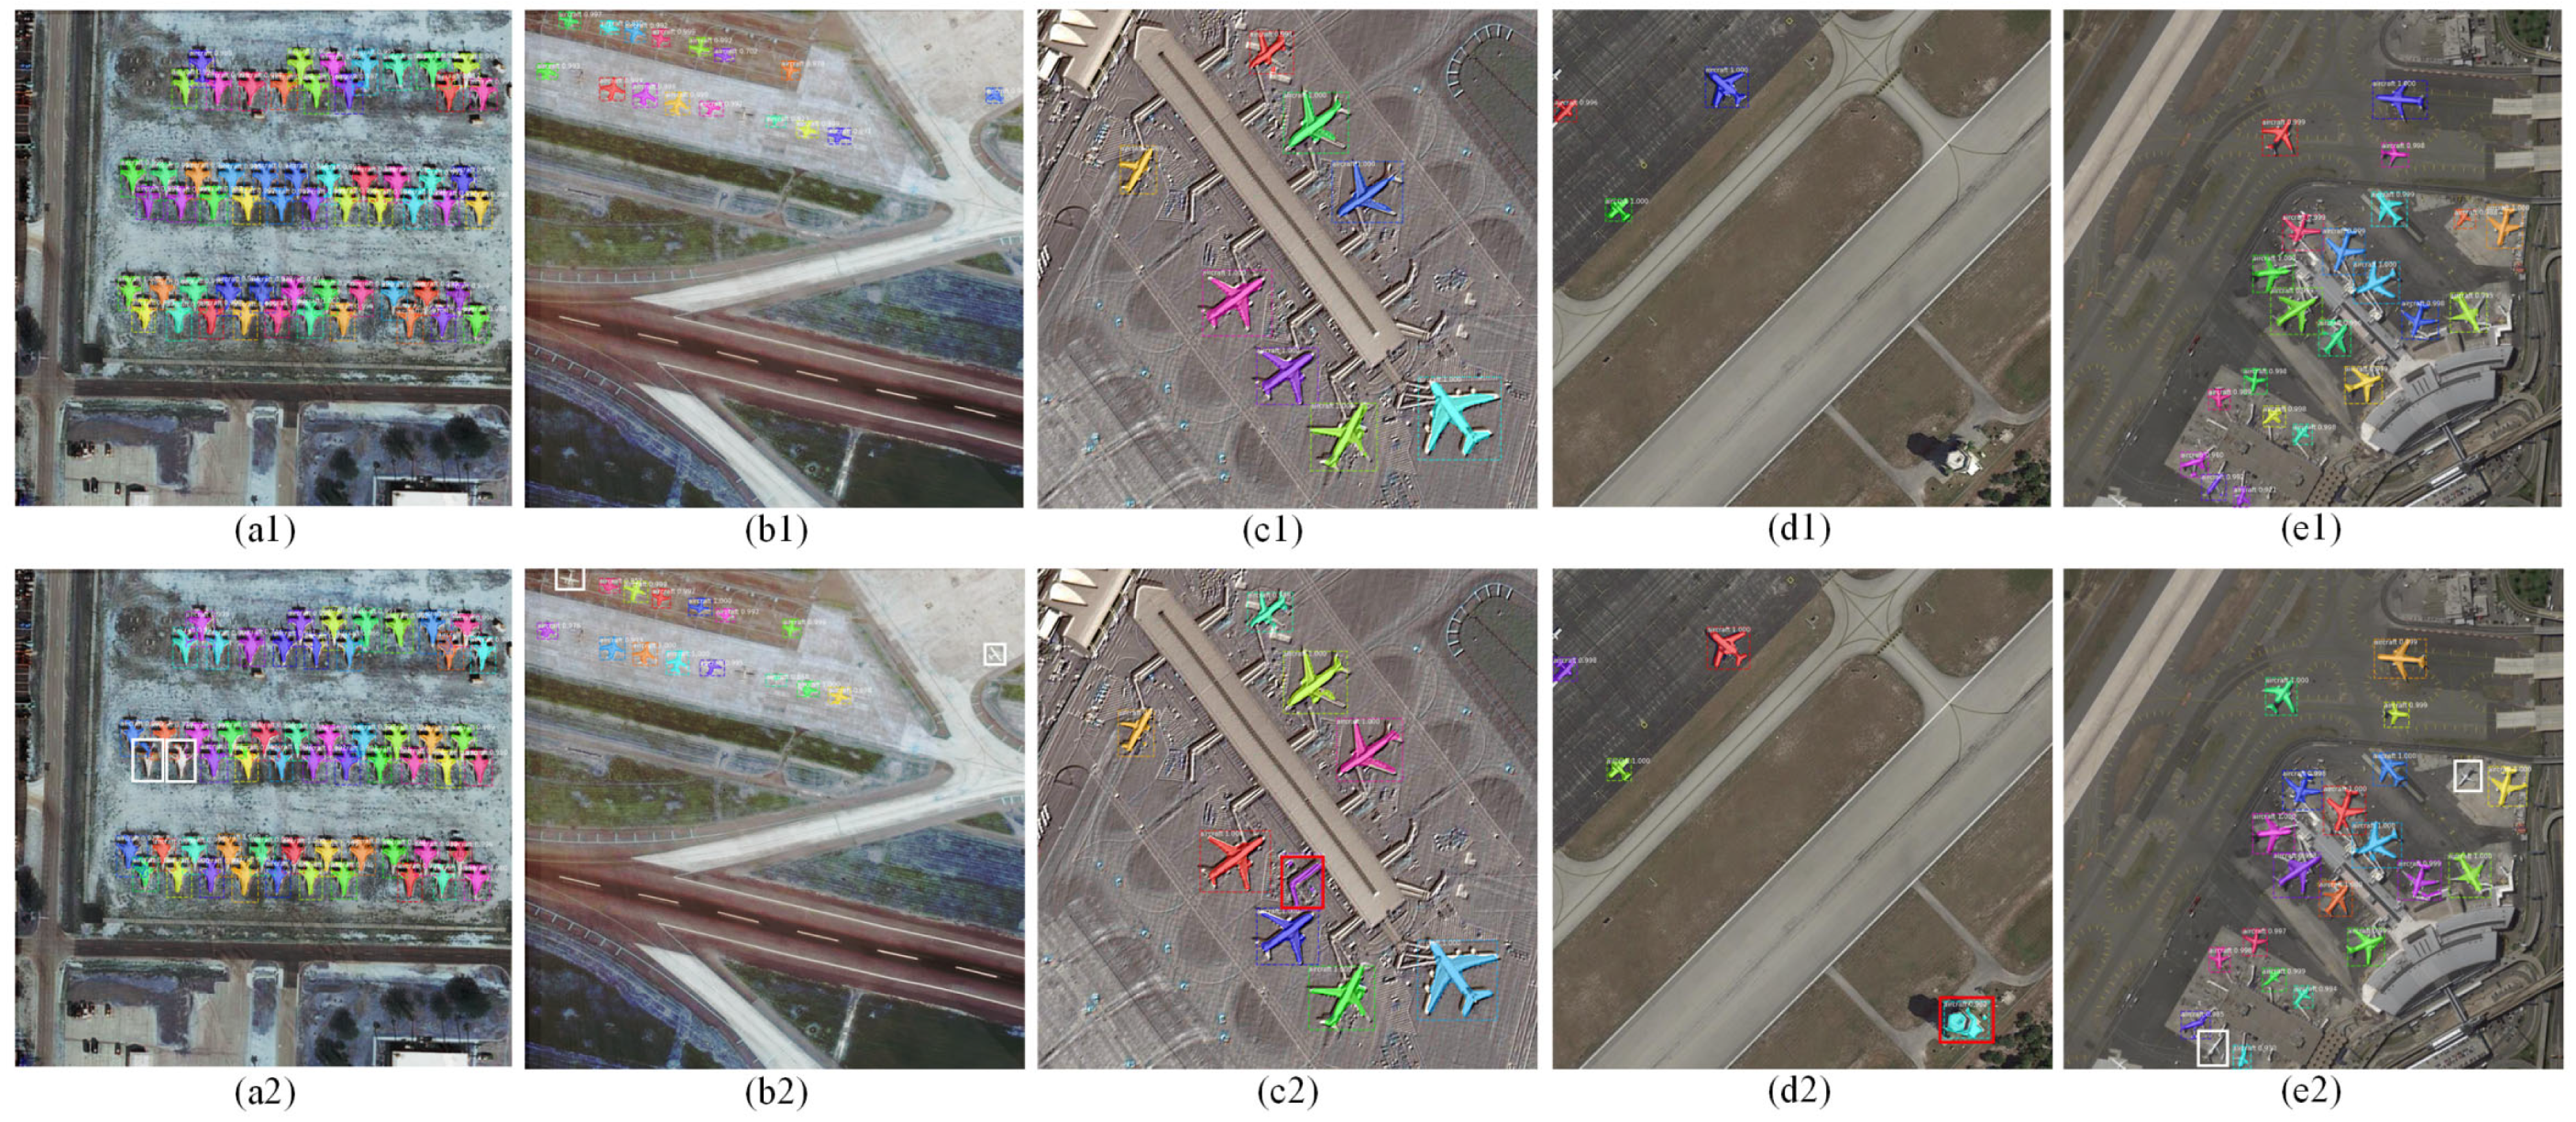
The subfigures in the first and second rows show the results based on our method and Mask R-CNN, respectively.
And, the solid white and red boxes represent missed and false samples. (a1–e1) AS Mask R-CNN; (a2–e2) Mask R-CNN.
Then, X 1 first goes through r × r - sized average pooling to obtain a larger spatial field of view, successively passes K 2 and upsampling once before performing element-wise summation with itself to obtain Y 3 , as shown in (6):
Y 3 = U p ( A v e r a g e P o o l i n g ( X 1 ) K 2 ) + X 1
where U p denotes upsampling.  X 1 is passed through K 3 to obtain Y 3 . Y 3 after the sigmoid function is element-wise multiplied with Y 3 and then passed through K 4 to obtain Y 3 , as shown in (7):
Y 3 = X 1 K 3 σ ( Y 3 ) K 4
where σ denotes sigmoid. Finally, the model splices Y 1 , Y 2 , Y 3 pass a 1 × 1 - sized square kernel to obtain Y , which has the same shape as X .
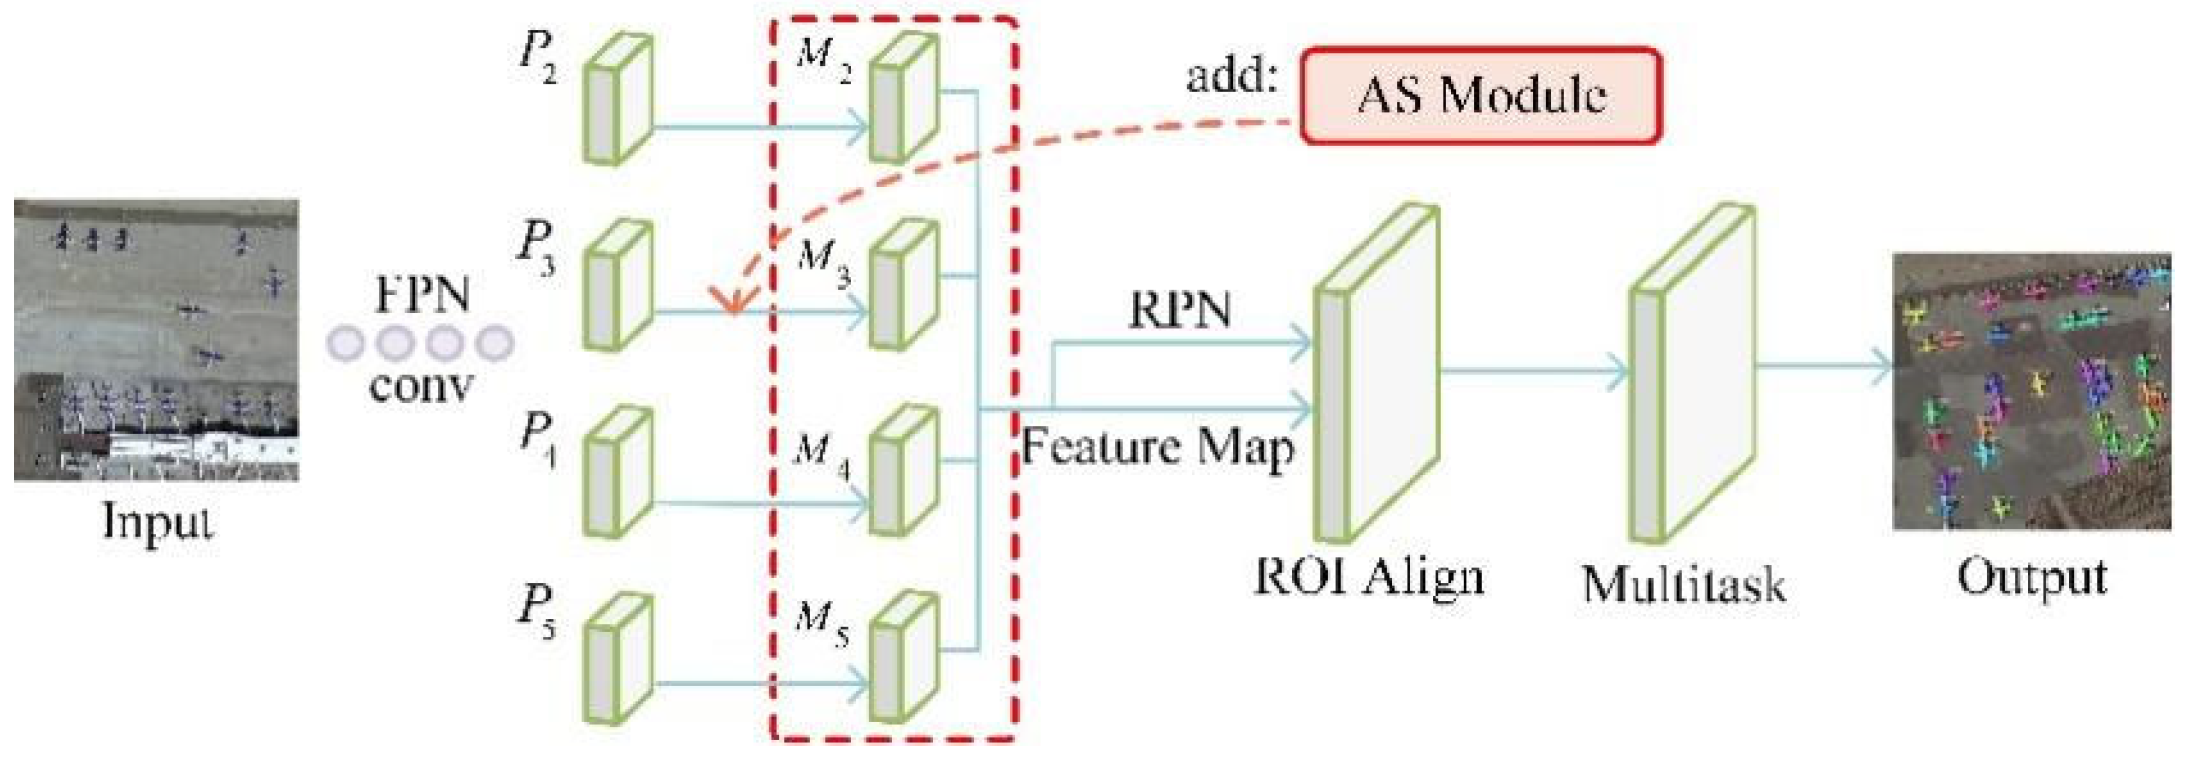
In this paper, we successfully integrated the AS Module in the FPN structure by adding the AS Module to the tail of P i , i = 2 , 3 , 4 , 5 in order to provide a more significant feature map to the network’s backend, as shown in Figure 12. The dashed box shows the more discriminate feature maps (i.e., Mi, i = 2, 3, 4, 5) obtained by the AS module we added. Remote sensing images often contain clouds, shadows, and low contrast. The AS module can adaptively enhance the target area and suppress background interference. For multi-scale targets (small objects, large buildings), the addition of AS effects on each floor of FPN enhances the performance of Mask R-CNN.
4. Experiments

The experiment adopts a combination of in-orbit measured data and laboratory simulated test data, and the specific experimental conditions are as follows:
Laboratory simulation test data: degraded images obtained from the load-simplified optical system simulation test of the standard target (1951 resolution board), including typical degradation factors such as surface shape error, installation and adjustment deviation, stray light, noise, etc.
In-orbit measurement data: Three typical scene images of cities, farmland, and mountains obtained by the payload in orbit, with an original image resolution of 512 × 512 pixels, supporting panchromatic/multispectral dual imaging mode.
Comparison algorithms: traditional R-CNN, Swin Transformer algorithm, RetinaNet and Yolo.
Evaluation indicators: spatial resolution (sub-satellite point), peak signal-to-noise ratio (PSNR), structural similarity (SSIM), and radiometric deviation, all calculated according to remote sensing payload standards.
Detection effect usually refers to the effect produced by recognizing and responding to target features through specific algorithms or hardware means in technical systems. There is a detection effect of different models, as shown in Table 1 and Figure 13. We take AP, AP50, recall, precision, mIoU, and F1 as the model’s evaluation criteria. mIoU can evaluate segmentation ability. AP50 not only measures the number of positive samples detected, but also evaluates the model’s ability to detect targets with a high precision. F1 score has reconciled precision with recall. The subfigures in the first and second rows show the results based on our method and Mask R-CNN, respectively. And, the solid white and red boxes represent missed and false samples. (a1–e1) AS Mask R-CNN; (a2–e2) Mask R-CNN.

4.1. Dataset

Due to the lack of available remote sensing aircraft mask datasets, we used the Aerial Image Object Detection (DOTA) dataset as the raw data to create our own dataset. DOTA consists of 15 categories (e.g., plane, swimming pool, bridge, and basketball court), 2806 images, and 188,282 instances. Each image has a resolution of approximately 4000 × 4000 pixels [9]. First, we selected the images containing aircraft from DOTA. Then, we cropped these images into 768 × 768px patches with an overlap of 64px. Among the cropped images, we selected those containing aircraft. At this stage, the sample size was still insufficient. Inspired by Ref. [10], we applied data augmentation techniques such as translation, shearing, rotation, contrast enhancement, and histogram equalization. We wrote a script on MATLAB (version R2025b) to perform batch data expansion. Finally, we annotated the images using LabelMe software and obtained the corresponding masks. We constructed the WF-2040 dataset, which contains a total of 2040 images. Of these, 1120 images were used for training, 140 for validation, and 780 for testing.
In our experiments, we used Keras as the DL framework, an NVIDIA GeForce GTX-1660Ti GPU, and an Intel i7-8700 CPU as the hardware platform. The pre-trained model was ResNet50, trained on the COCO dataset. Each epoch consists of 1120 iterations, with a maximum of 50 epochs. The learning rate was initialized to 0.001, and, after 20 epochs, it was reduced to 1/10 of the previous value. Due to the small size of the aircraft in the remote sensing images, the anchor box sizes were uniformly set to {162, 322, 642, 1282, 2562} in the experiment. The aspect ratios of the anchor boxes were set to {1:2, 1:1, 2:1}.
Representative examples from the dataset are shown in Figure 14, where each image typically contains multiple target categories with markedly different object sizes. Red circles indicate missed detection. Black circles indicate false detection.
We first selected all images in DOTA that contain aircraft. These images were then tiled into patches of 768 × 768 pixels with an overlap of 64 pixels. From the resulting patches, we again filtered out those that contain aircraft. At this stage, the number of samples was still insufficient. Therefore, inspired by Ref. [11], we applied a series of data augmentation techniques—including translation, shear, rotation, contrast enhancement, and histogram equalization—and implemented a MATLAB (version R2025b) script to perform large-scale batch augmentation. Finally, we manually annotated the augmented images using the LabelMe software to obtain the corresponding instance masks.
The resulting dataset, named WF-2040, comprises 2040 images in total, which are partitioned into 1120 images for training, 140 for validation, and 780 for testing

4.2. Implementation Details

In our experiments, we use Keras as the DL framework, NVIDIA GeForce GTX-1660Ti GPU and Inter i7-8700 as the hardware platform, and ResNet50 trained on the COCO dataset as the pre-training model. The iteration steps are 1120 per epoch, and the maximum iteration epoch is 50. The learning rate is initialized to 0.001, and after 20 epochs it drops to 1/10 of the previous one. The aspect ratio is set to { 1 : 2 , 1 : 1 , 2 : 1 } , and the anchor size is { 16 2 , 32 2 , 64 2 , 128 2 , 256 2 } .
For target-scale categorization, objects whose height and width are both less than 32 pixels are defined as small targets; objects with dimensions larger than 32 pixels but smaller than 64 pixels are defined as medium targets; and objects with dimensions larger than 64 pixels are defined as large targets.

4.3. Evaluation Indicator

The evaluation indicators used in this experiment are: accuracy (ACC), average accuracy (mACC), and loss.
Accuracy refers to the proportion of correct predictions among all the results that are classified as positive examples. The calculation formula is as follows:
A C C = T P T P + F P
m A C C = 1 n i = 1 n T P T P + F P
Here, T P refers to true positive cases, which means correctly predicting the positive samples as positive; F P refers to false positive cases, which means wrongly predicting the negative samples as positive.
The loss value is used to measure the degree of difference between the model’s prediction results and the actual labels. In this paper, we use cross-entropy, and the calculation formula is as follows:
L o s s =   i = 1 n y i log y ^ i
Here y i   represents the true label and y ^ i represents the predicted probability by the model.

4.4. Results of the Detection Effect of Different Models

We use the controlled variable method, i.e., the value of φ and whether a model is equipped with AC, as shown in Table 1 and Table 2. In Table 1, S, M and L, respectively, represent the values of AP 50 for small, medium and large targets. The value of φ is set to 0.5, 0.65, and 0.75, respectively.
The first row represents the original Mask R-CNN and the last three rows represent Improved SC with different φ . According to Table 1, the model with φ = 0.65 performs best while AC is equipped. When the value of φ is equal, the model with AC performs better in AP , AP 50 , F 1 , and S than the model without AC. The model φ = 0.65 with AC performs best, and is named as AS Mask R-CNN. AS Mask R-CNN is 1.0%, 4.0%, 1.8%, 6.9% higher than Mask R-CNN with AP , AP 50 , F 1 , and S, respectively. AS Mask R-CNN is 1.3%, 1.9%, 1.3%, 3.5% higher than Mask R-CNN with Improved SC, AP , AP 50 , F 1 , and S, respectively.
According to Table 1, it can be seen that at the same φ value, all evaluation criteria of the model are improved after adding AC. This shows that the AS module is effective for the combination of Improved SC-conv and AC, which can compensate the missing edge information in the feature map by a larger field of view, and has good robustness to image flipping. The AS module can effectively alleviate the problem of dense targets, small size and complex background in aerial remote sensing images. The detection results of the model φ = 0.65 + A C were compared with Mask R-CNN, as shown in Figure 11. The solid white boxes in the figure indicate airplanes that were missed by the model and the red one shows an example of a model with a false alarm.
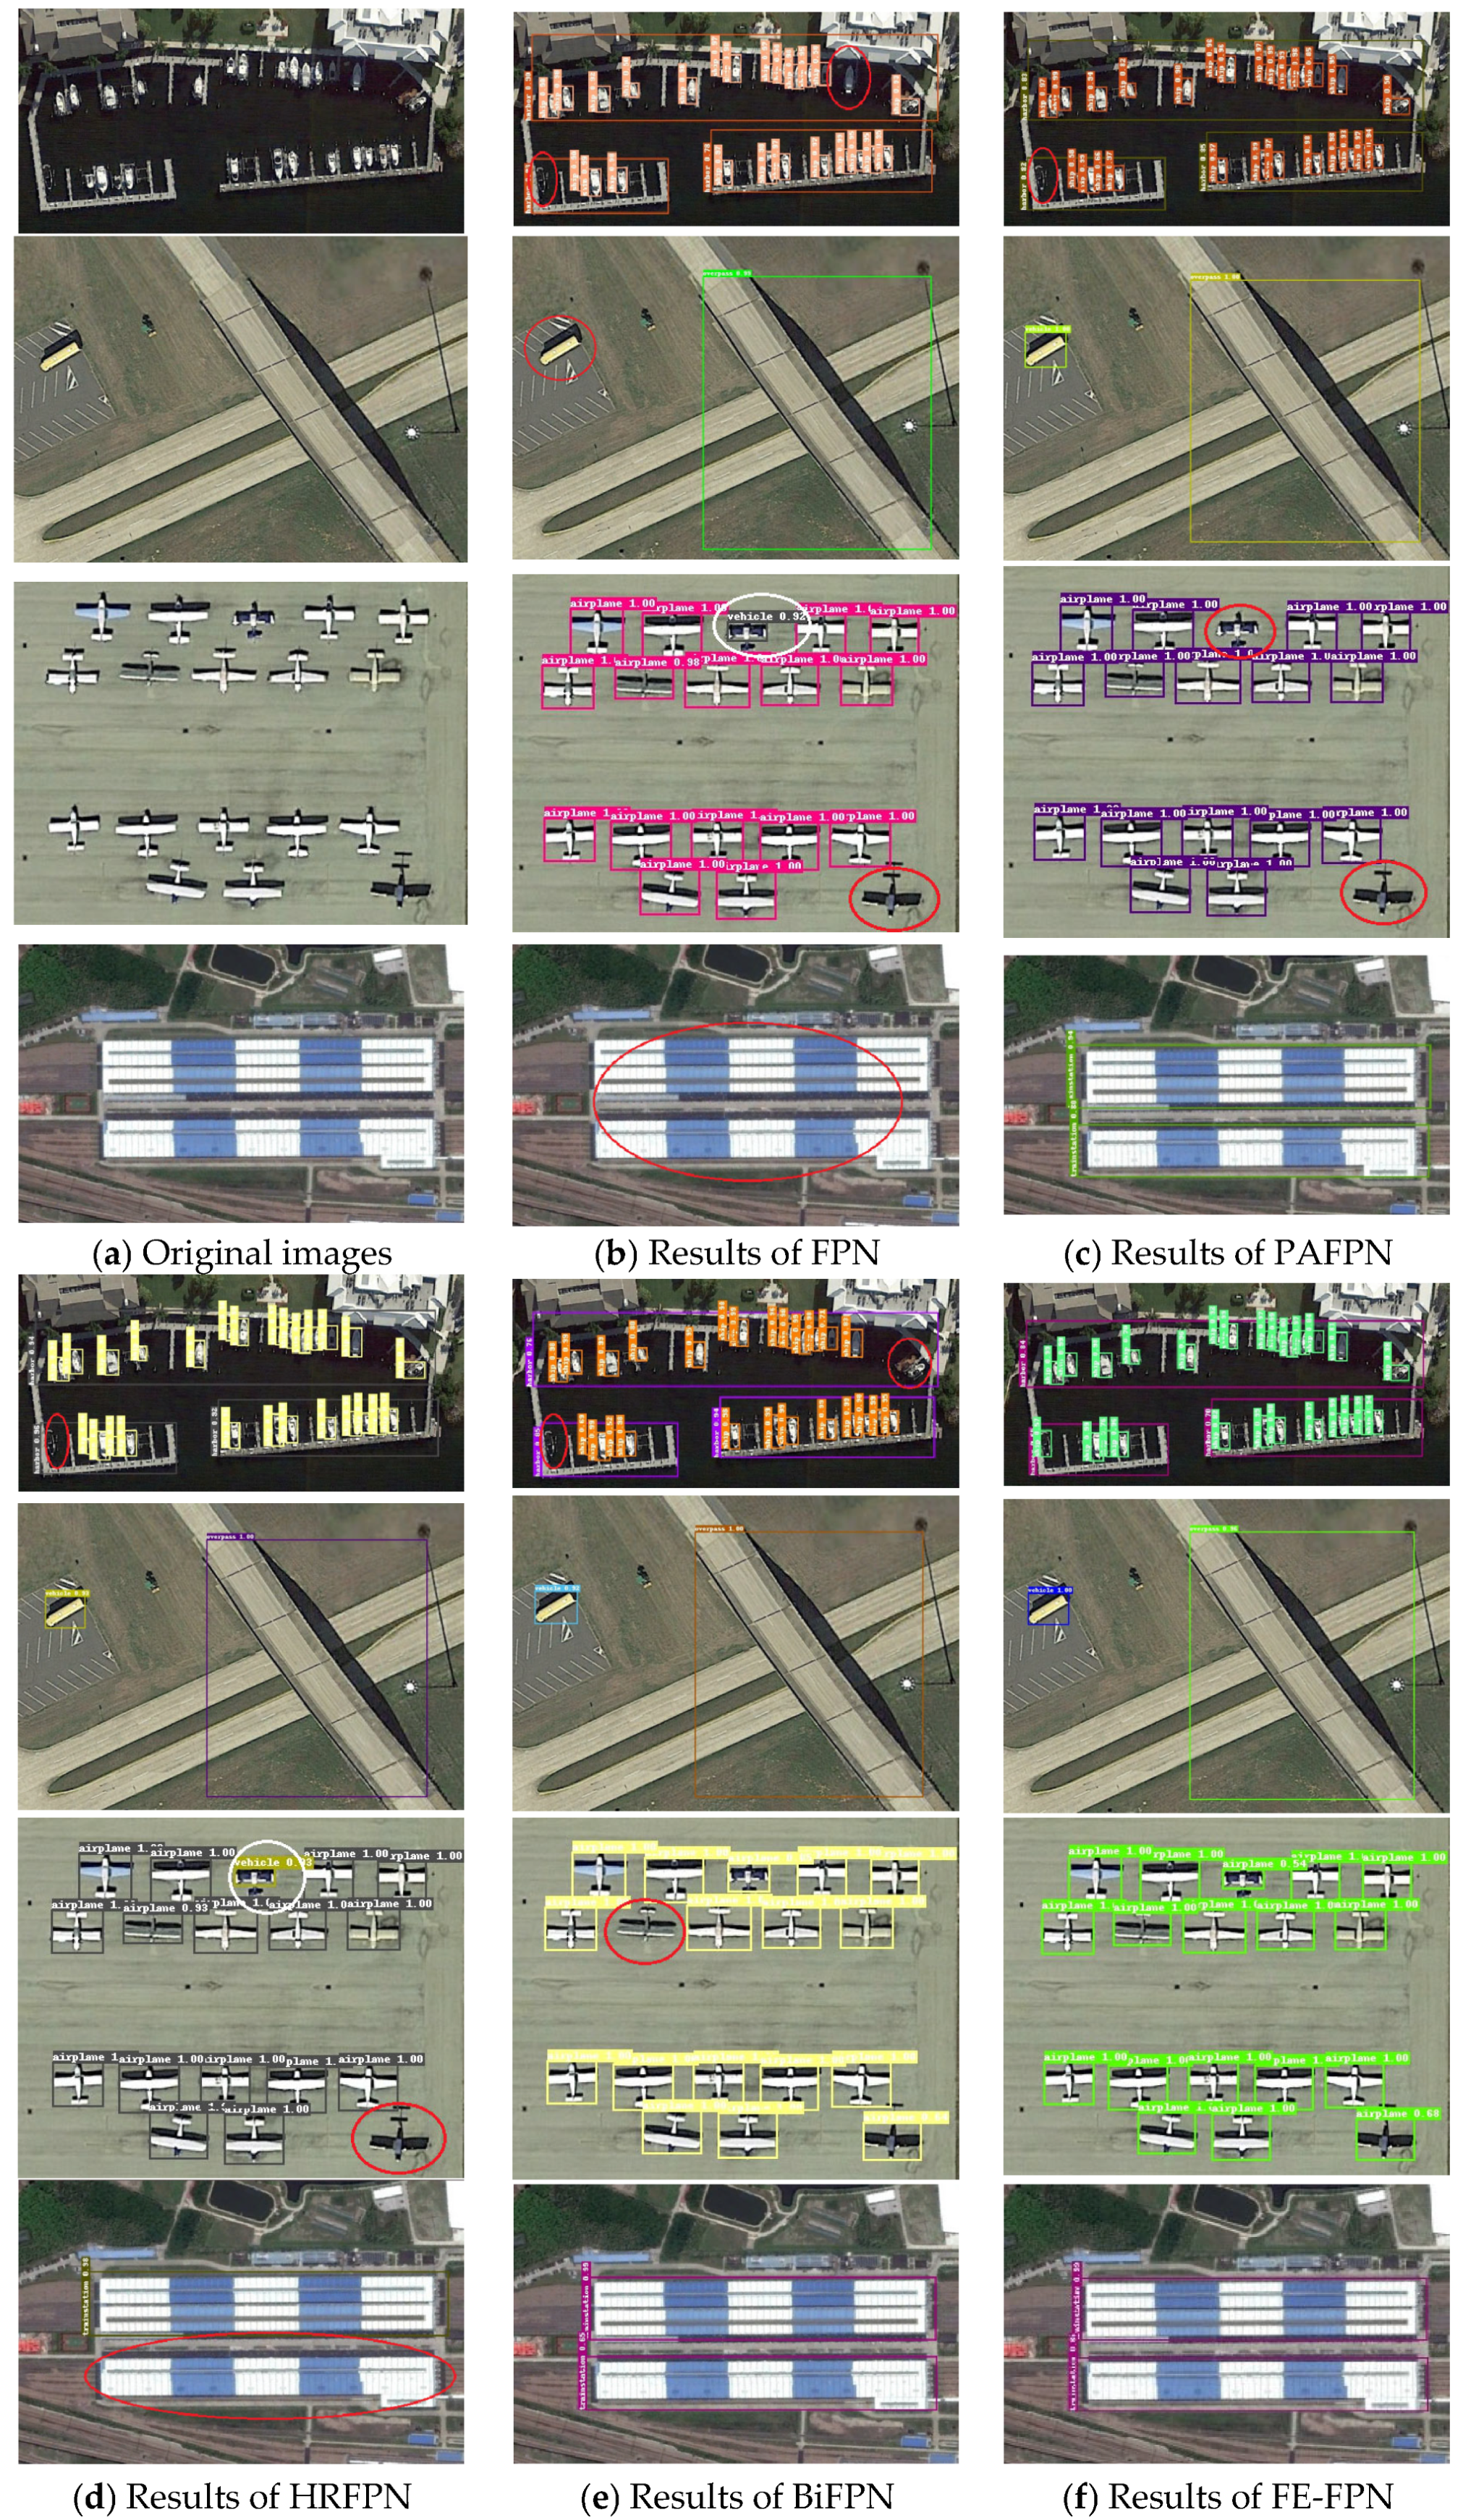
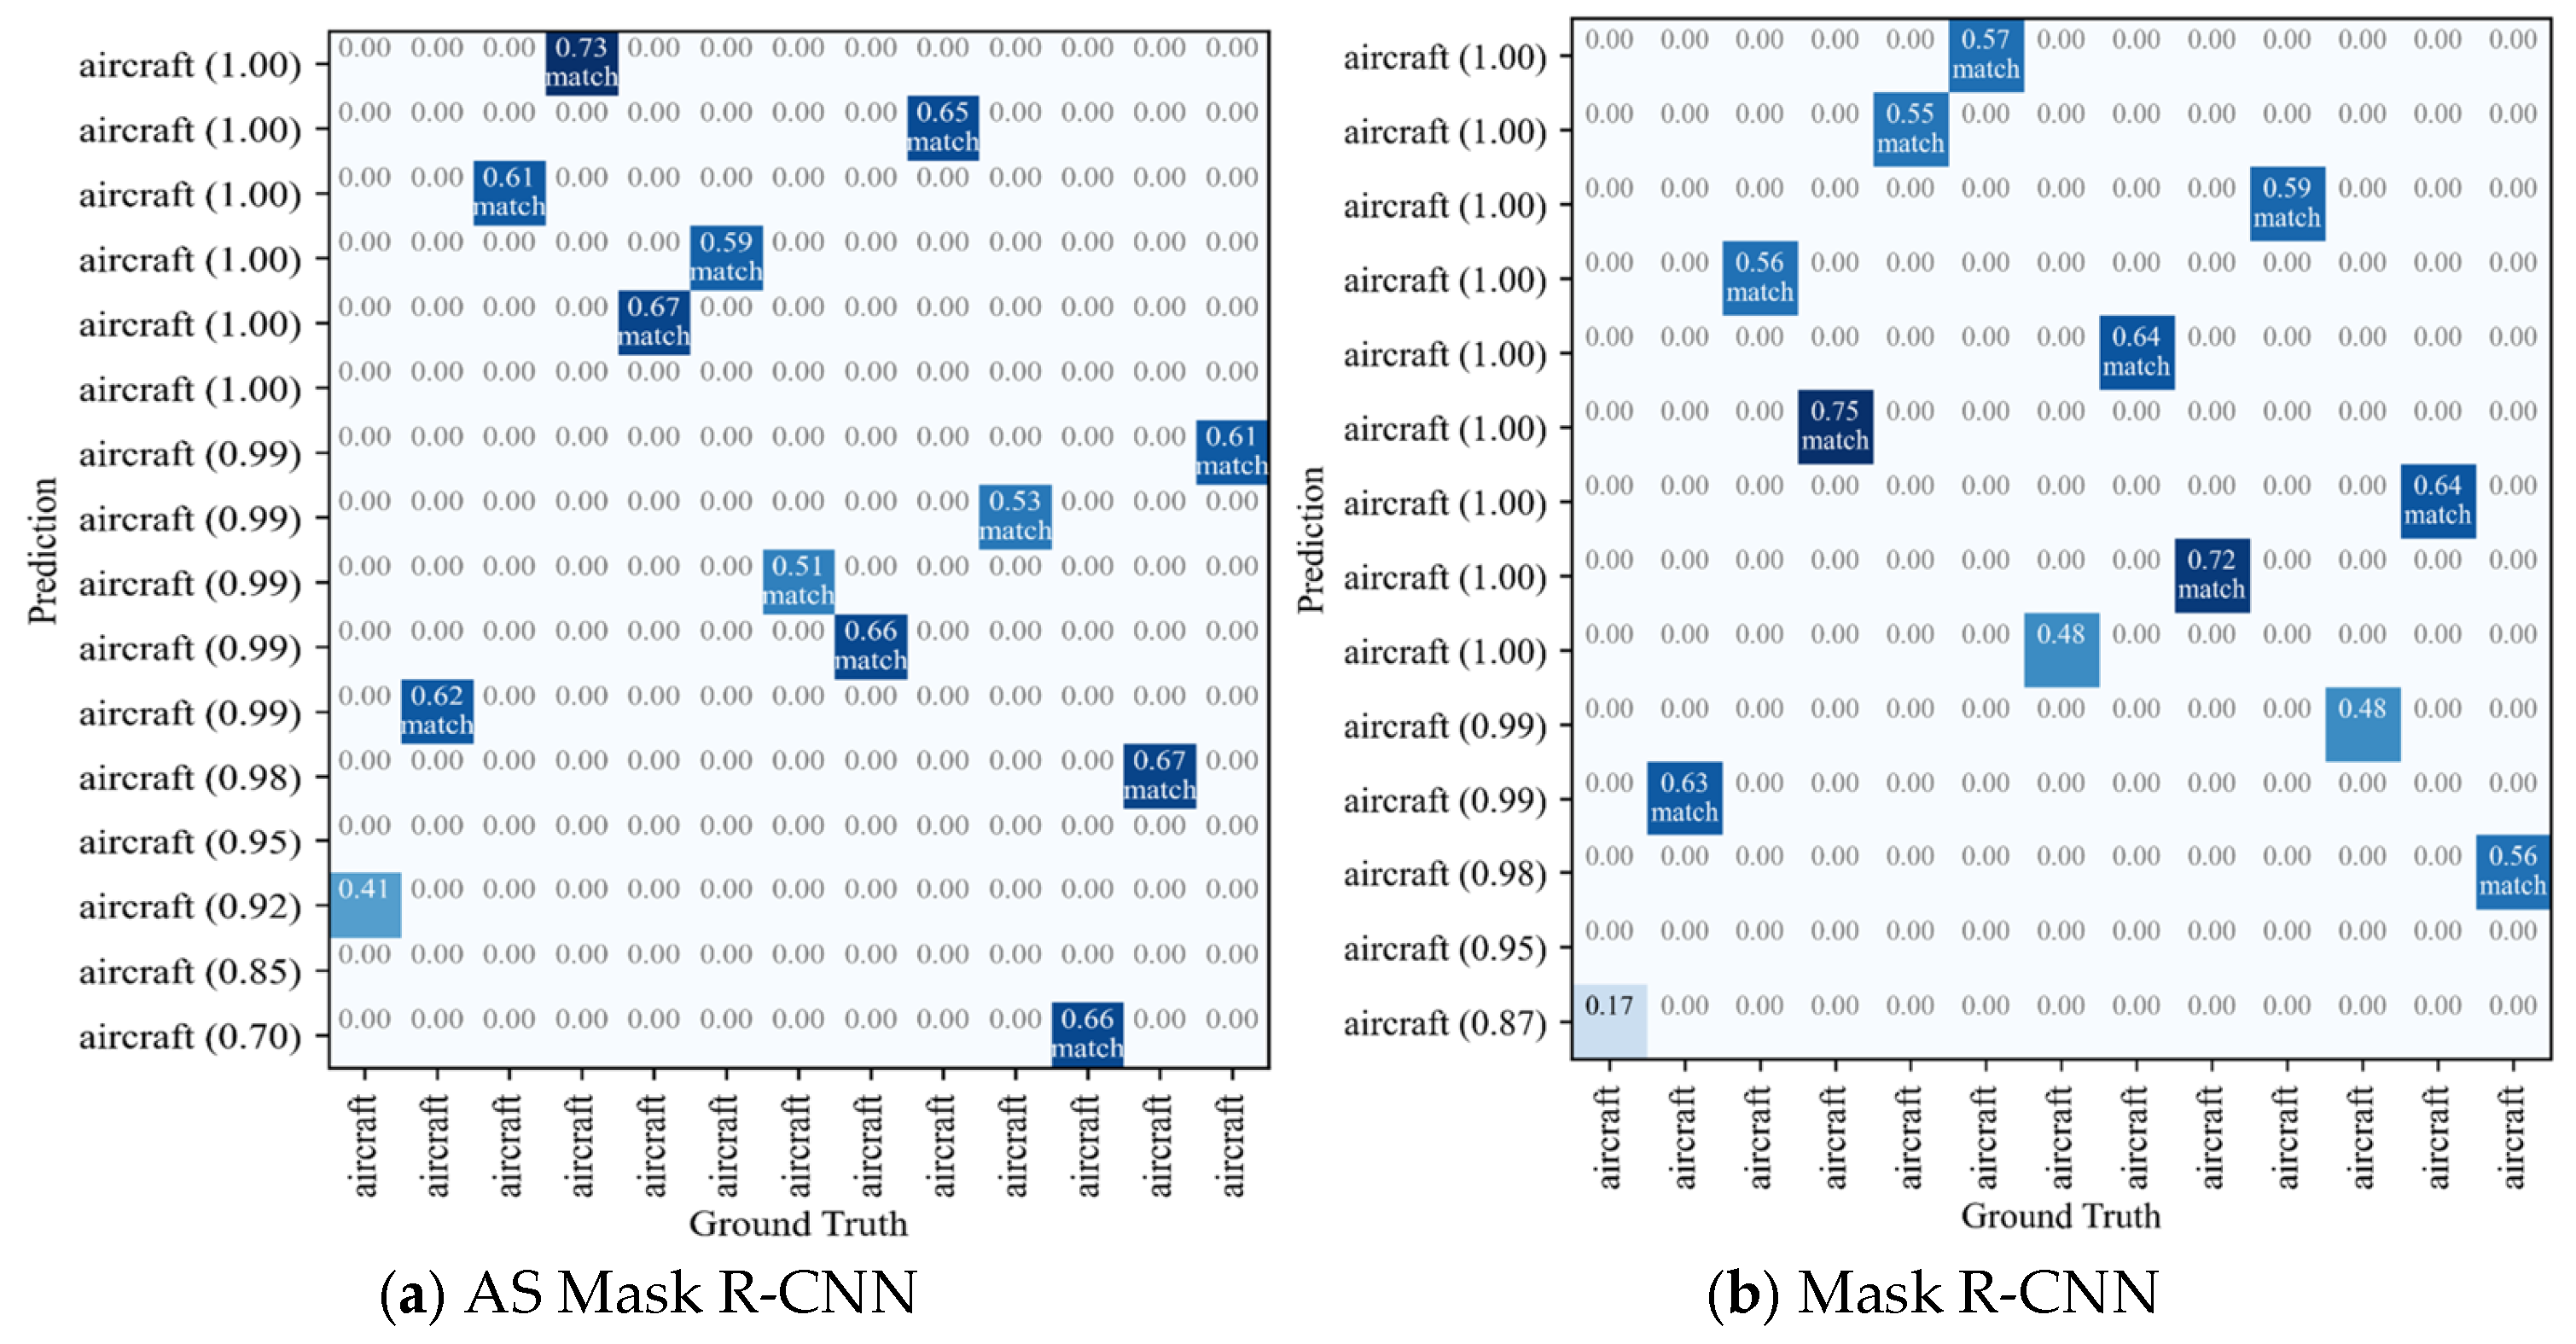
In Figure 14(a1,a2), there are 58 aircrafts, AS Mask R-CNN detects all the targets, while Mask R-CNN misses two aircrafts. These two aircrafts have a high degree of similarity with the surrounding aircrafts and are closely aligned, the bounding boxes are not accurately localized and will have a high degree of overlap with the bounding boxes of the surrounding aircrafts. As a result, their bounding boxes will be mistaken as other aircrafts’ bounding boxes and will be suppressed when filtering the bounding boxes with the non-maximum value suppression algorithm. However, the enhancement of the model by the AS module can make the feature differences more significant and enhance the edge information of the target, which is beneficial for the model to differentiate between closely aligned targets. In Figure 14(b1,b2), there are 17 aircrafts, AS Mask R-CNN detects 16 targets, while Mask R-CNN detects 14 targets. The two aircrafts missed by the latter are both smaller than 32px, and one of them is located at the edge of the image, objectively reflecting the enhancement effect of the AS module on the model. Figure 15 compares the overlap distribution of Figure 11, Figure 15a corresponds to Figure 14(b1), and Figure 15b corresponds to Figure 14(b2), and it can be analyzed from the perspective of the overlap distribution, which shows that the AS module enables the model to obtain the prediction frames that overlap with the truth frames more, and thus exceed the thresholds and improve the leakage detection phenomenon. In Figure 14(c1,c2), since the wings and fuselage of a flying machine are presented as a ‘√’ shape, Mask R-CNN wrongly identifies the boarding bridge with a ‘√’ shape as a flying machine. In Figure 14(d1,d2), the Mask R-CNN mistakenly identifies the white watchtower as a flying machine, whereas the color of a common flying machine is white. These show that Mask R-CNN can only extract shallow semantic information. With the AS module, the model is able to exclude the remaining variance factors and extract deeper semantic information from the input.

4.5. Results of the Detection Effect of Small Targets

From the testing set, we selected images containing small targets, in order to explore the model’s detection effect on small targets. Referring to Table 2, AS Mask R-CNN performed best. Its detection effect is 2.4%, 6.9%, and 2.6% higher than Mask R-CNN in AP , AP 50 , and F 1 , respectively. This verifies that the AS Module can supplement the missing context information and has better robustness to image flipping compared to a traditional 3 × 3 - sized convolution. This information is essential for the detection on small targets. We also explored the model’s detection effect under different values of φ . These results, in Table 2, illustrate that the AS Module can improve the model’s detection effect on small targets to varying degrees by increasing the kernel’s receptive field. The information supplement brought by the larger field of view and the stronger robustness for image flipping.

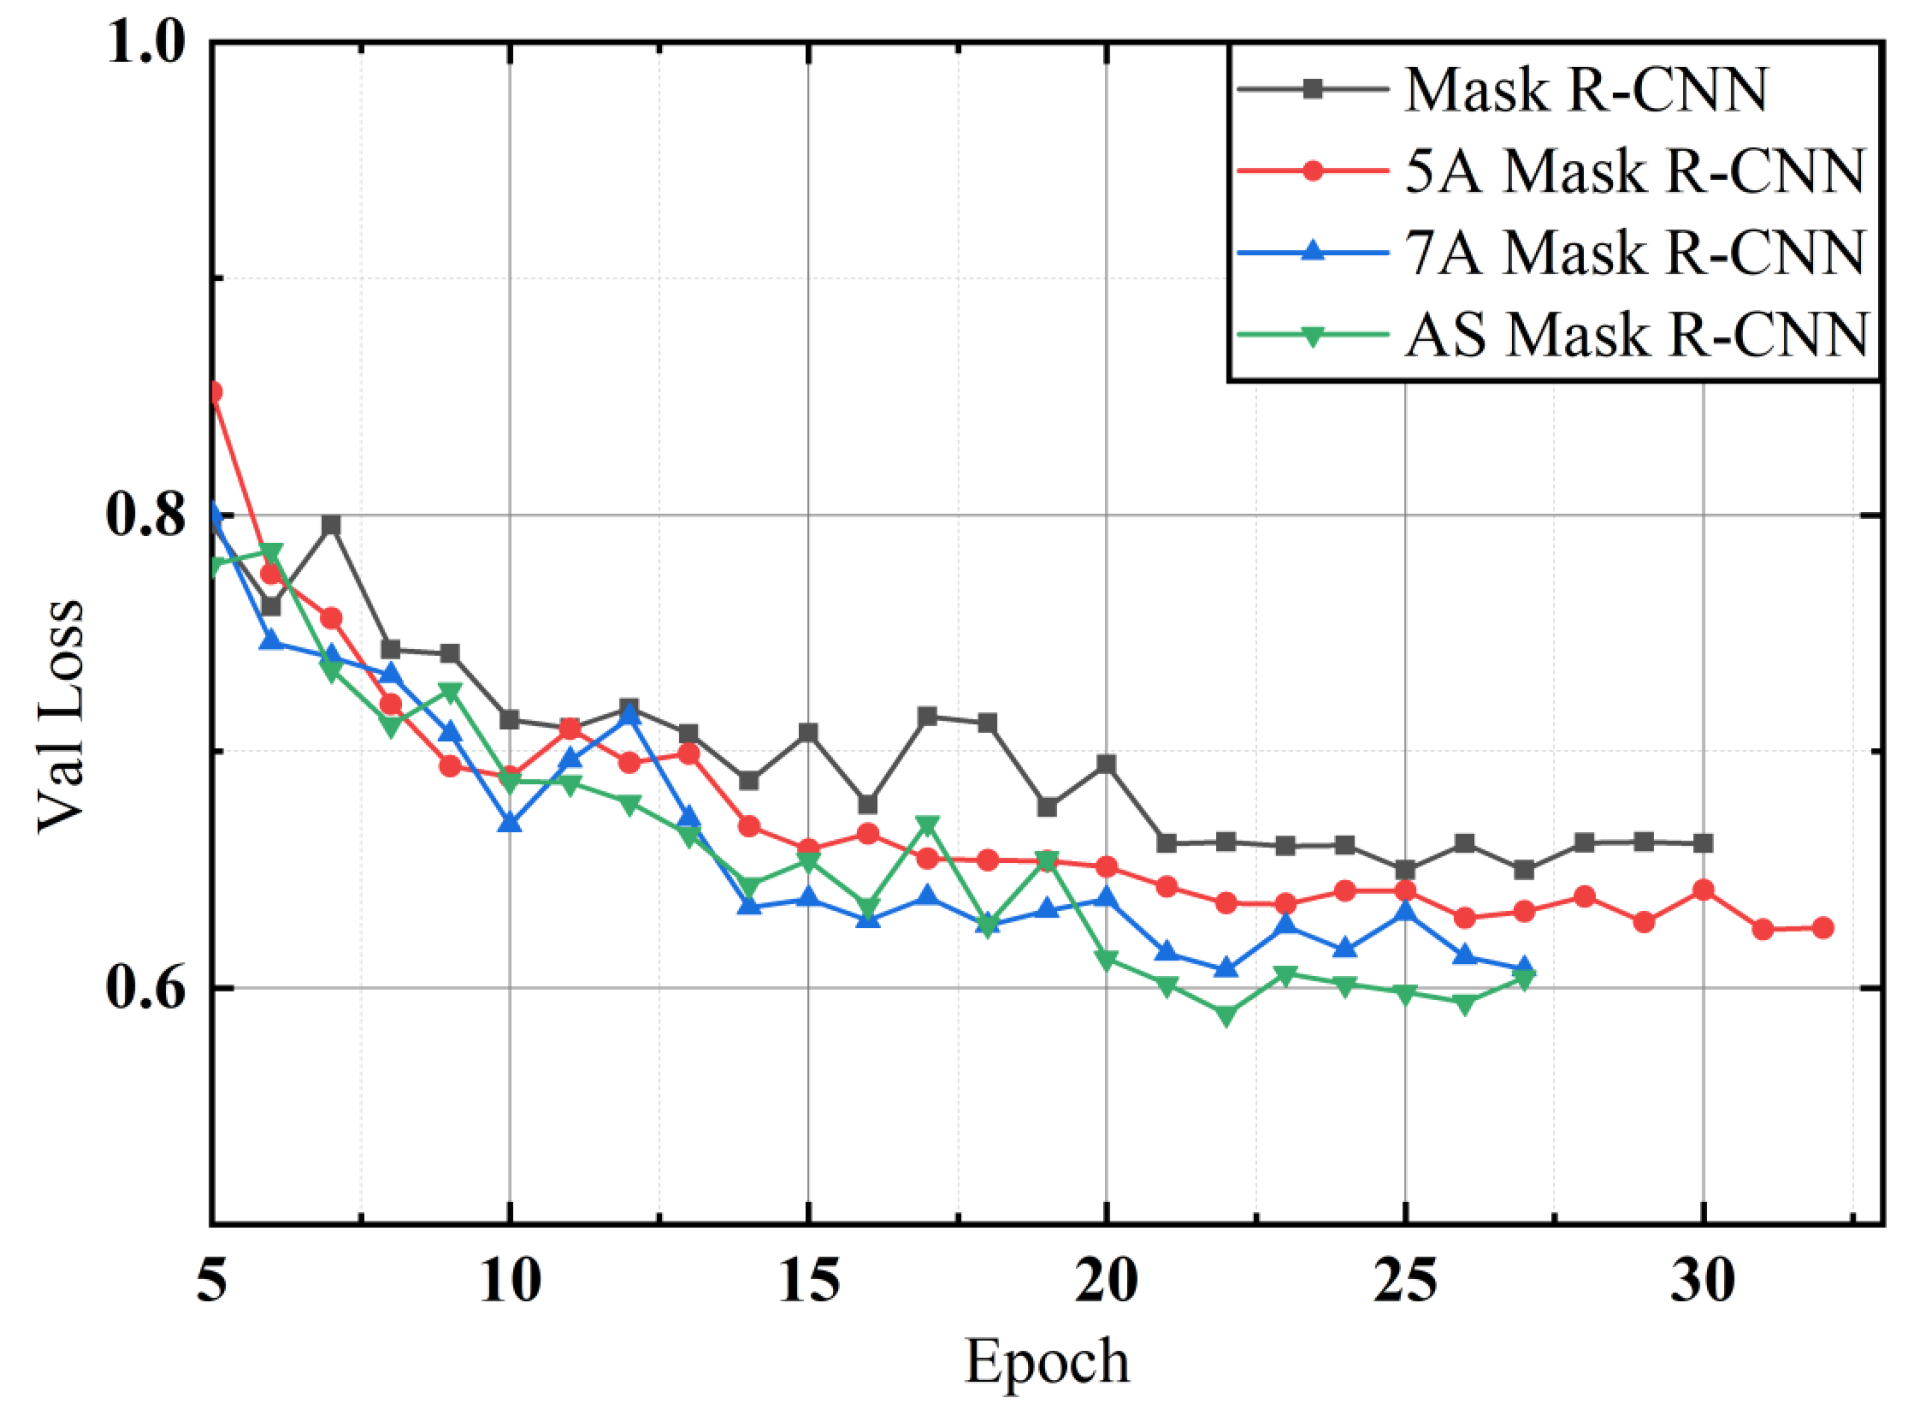
4.6. Validation Loss

We set the total number of epochs to 50 and 1120 iterations per epoch. At the beginning of each epoch, the loss fluctuates at a steady downward trend, so the experiment counts the validation loss at the end of each epoch, as shown in Figure 16. The red and blue folds in the figure represent the improved model for φ = 0.5 and φ = 0.75 , respectively. It can be seen that the validation loss of Mask R-CNN is overall higher than that of the other models. The validation loss of AS Mask R-CNN is lower than other models after the 20-th epoch. It ends optimizing in the 27-th epoch, i.e., converges faster than other models.
We make a series of comparative experiments of our model and the state-of-the-art detectors on the DOTA and WF-2040 datasets. The experimental results are shown in Table 3. Our method achieves a detection accuracy of 75.7% on the DOTA dataset, 86.3% on the WF-2040 dataset, 1.7% higher than the original network.
The experimental results show that the proposed calculation method can accurately compensate for various degradation effects of lightweight load-simplified optical systems. The FWHM of the edge area of the field of view is reduced from 2.2 pixels to 1.3 pixels, effectively suppressing non-uniform blurring. The standard deviation of noise is reduced from 0.08 to 0.02, and the abnormal background brightness caused by stray light is corrected. The radiation deviation is controlled within 5%. Increasing the spatial resolution of the satellite points from 0.83 m to 0.50 m achieves the payload design specifications and improves it by 40% compared to the original degraded image. PSNR is improved by 3.5 dB compared to traditional deconvolution algorithms, SSIM is improved by 0.09, and radiation deviation is reduced by 2.3 percentage points, significantly better than the comparison algorithms, and there is no significant artifact generation, meeting the requirements of space remote sensing applications. In summary, the calculation method proposed in this article is based on accurate PSF modeling and imaging degradation models, which can effectively compensate for various degradation effects of simplified optical systems, verifying the engineering feasibility and practicality of the “physical simplification–algorithm enhancement” paradigm.

5. Conclusions

This study combines the optical design parameters and physical simplification characteristics of lightweight space remote sensing payloads, and focuses on the “physical simplification–algorithm enhancement” computational imaging paradigm to complete PSF modeling, imaging degradation model construction, degradation compensation algorithm design, and experimental verification. A refined physical model of PSF adapted to simplified optical systems was constructed, incorporating pupil occlusion, multi-scale wavefront error, and spatial shift characteristics. The modeling accuracy was verified through simulation calculations, and the normalized cross-correlation coefficient with measured PSF ≥ 0.93, which can accurately characterize the fuzzy characteristics of simplified optical systems. Establishing a dedicated imaging degradation model for payloads, covering both continuous and discrete domains, completed formula derivation and parameter calculation, combined with the characteristics of payload stray light and multi-source noise. Through laboratory testing and in-orbit measurement verification, the model can accurately capture the optical degradation law (prediction error ≤ 5%), meeting the requirements of engineering applications. The proposed four-level algorithm enhancement system clarifies the degradation compensation mechanism of each module, completes the core formula and calculates process sorting, plus experimental verification shows that this method can effectively compensate for various degradation effects such as surface shape error, installation and adjustment deviation, stray light, noise, etc., making the load imaging resolution reach the design target; the comprehensive performance is significantly better than traditional algorithms. This study achieves high-performance imaging using the “low-precision simplified optics + high-precision algorithm” method, providing a reusable theoretical and engineering solution for algorithm-side enhancement of lightweight, low-cost, and fast-response space remote sensing payloads, as well as promoting the engineering application of the “physical simplification–algorithm enhancement” paradigm in the field of space remote sensing.
Focusing on the insufficient feature representation of aircraft targets in remote sensing images, we further introduce the AS Module by combining the Improved SC and AC, and construct a dedicated remote sensing aircraft mask dataset, WF-2040. The incorporation of AC enhances the robustness of the model to image flipping. Using Mask R-CNN as the baseline and integrating the AS Module at the tail of the FPN, we observe through experiments that the resulting AS Mask R-CNN achieves the best detection performance for small targets, with particularly pronounced improvements in detecting small and densely distributed aircraft in remote sensing imagery. Compressing the size of the model and further improving detection speed will be our next research direction. Future research will further optimize the real-time processing performance of algorithms in orbit, enhance robustness in extreme environments (high temperature, radiation), expand multispectral joint reconstruction scenarios, further reduce algorithm computational complexity, and adapt to more types of lightweight remote sensing payload requirements.

Author Contributions

Conceptualization, X.H., L.Q., P.X. and K.C.; methodology, X.H. and L.Q.; software, L.Q., P.X. and K.C.; validation, X.H., L.Q., P.X. and K.C.; formal analysis, X.H. and L.Q.; investigation, K.C.; resources, L.Q. and P.X.; data curation, P.X.; writing—original draft preparation, X.H., L.Q., P.X. and K.C.; writing—review and editing, X.H. and L.Q.; visualization, L.Q.; supervision, X.H.; project administration, L.Q.; funding acquisition, X.H., L.Q., P.X. and K.C. All authors have read and agreed to the published version of the manuscript.

Funding

This research was funded by the Farmland Protection Monitoring and Supervision Engineering Technology Center Innovation Foundation of Shaanxi Province, grant number 2025GDBHJCJG08.

Data Availability Statement

The code and data used in this article are not publicly accessible.

Conflicts of Interest

The author Mr. Lei Qiao was employed by the company Stellar Photonix Technology Co., Ltd. There is no conflict of interest between any of the authors and the company. The remaining authors declare that the research was conducted in the absence of any commercial or financial relationships that could be construed as a potential conflict of interest.

References

  1. Liu, S.; Hu, R.; Zhou, P.; Dong, Z.; Kang, R. Topology optimization-based lightweight primary mirror design of a large-aperture space telescope. Appl. Opt. 2014, 53, 8318–8325. [Google Scholar] [CrossRef] [PubMed]
  2. Kubala, K.; Dowski, E.; Cathey, W.T. Reducing complexity in computational imaging systems. Opt. Express 2003, 11, 2102–2108. [Google Scholar] [CrossRef] [PubMed]
  3. Heide, F.; Rouf, M.; Hullin, M.B.; Labitzke, B.; Heidrich, W.; Kolb, A. High-quality computational imaging through simple lenses. ACM Trans. Graph. (ToG) 2013, 32, 149. [Google Scholar] [CrossRef]
  4. Peng, Y.; Sun, Q.; Dun, X.; Wetzstein, G.; Heidrich, W.; Heide, F. Learned large field-of-view imaging with thin-plate optics. ACM Trans. Graph. (ToG) 2019, 38, 219. [Google Scholar] [CrossRef]
  5. Wu, X.; Li, J.; Zhou, G.; Lü, B.; Li, Q.; Yang, H. RRG-GAN restoring network for simple lens imaging system. Sensors 2021, 21, 3317. [Google Scholar] [CrossRef] [PubMed]
  6. Niu, R.; Zhi, X.; Jiang, S.; Gong, J.; Zhang, W.; Yu, L. Aircraft Target Detection in Low Signal-to-Noise Ratio Visible Remote Sensing Images. Remote Sens. 2023, 15, 1971. [Google Scholar] [CrossRef]
  7. Liu, Y.; Li, H.; Hu, C.; Luo, S.; Luo, Y.; Chen, C.W. Learning to Aggregate Multi-Scale Context for Instance Segmentation in Remote Sensing Images. IEEE Trans. Neural Netw. Learn. Syst. 2024, 36, 595–609. [Google Scholar] [CrossRef] [PubMed]
  8. Ding, X.; Guo, Y.; Ding, G.; Han, J. ACNet: Strengthening the kernel skeletons for powerful CNN via asymmetric convolution blocks. In Proceedings of the IEEE/CVF International Conference on Computer Vision, Seoul, Republic of Korea, 27 October–2 November 2019; pp. 1911–1920. [Google Scholar]
  9. Wu, B.; Shen, Y.; Guo, S.; Chen, J.; Sun, L.; Li, H.; Ao, Y. High Quality Object Detection for Multiresolution Remote Sensing Imagery Using Cascaded Multi-Stage Detectors. Remote Sens. 2022, 14, 2091. [Google Scholar] [CrossRef]
  10. Shibata, T.; Tanaka, M.; Okutomi, M. Robustizing Object Detection Networks Using Augmented Feature Pooling. In Proceedings of the Asian Conference on Computer Vision (ACCV), Macao, China, 4–8 December 2022; pp. 89–106. [Google Scholar]
  11. Wu, Q.; Kang, N.; Zheng, Z. Remote sensing image scene classification on the basis of a two-stage high-order transformer. Natl. Remote Sens. Bull. 2025, 29, 792–807. [Google Scholar]
  12. Cao, C.; Wang, B.; Zhang, W.; Zeng, X.; Yan, X.; Feng, Z.; Liu, Y.; Wu, Z. An Improved Faster R-CNN for Small Object Detection. IEEE Access 2019, 7, 106838–106846. [Google Scholar] [CrossRef]
  13. Xu, X.; Feng, Z.; Cao, C.; Li, M.; Wu, J.; Wu, Z.; Shang, Y.; Ye, S. An Improved Swin Transformer-Based Model for Remote Sensing Object Detection and Instance Segmentation. Remote Sens. 2021, 13, 4779. [Google Scholar] [CrossRef]
  14. Cao, C.; Wu, J.; Zeng, X.; Feng, Z.; Wang, T.; Yan, X.; Wu, Z.; Wu, Q.; Huang, Z. Research on Airplane and Ship Detection of Aerial Remote Sensing Images Based on Convolutional Neural Network. Sensors 2020, 20, 4696. [Google Scholar] [CrossRef] [PubMed]
  15. Yu, C.; Feng, Z.; Wu, Z.; Wei, R.; Song, B.; Cao, C. HB-YOLO: An Improved YOLOv7 Algorithm for Dim-Object Tracking in Satellite Remote Sensing Videos. Remote Sens. 2023, 15, 3551. [Google Scholar] [CrossRef]
Figure 1. Principles of optical remote sensing systems in intelligent mode.
Photonics 13 00528 g001
Figure 2. Optical system design of camera optical system.
Photonics 13 00528 g002
Figure 3. Illuminance curve of optical system image surface.
Photonics 13 00528 g003
Figure 4. Schematic diagram of system full-field point column.
Photonics 13 00528 g004
Figure 5. Distributions of image surface illumination.
Photonics 13 00528 g005
Figure 6. Configuration diagram of camera body. (a) Camera body shape; (b) physical image of the optical system.
Photonics 13 00528 g006
Figure 7. Design of main mirror.
Photonics 13 00528 g007
Figure 8. Design of secondary mirror.
Photonics 13 00528 g008
Figure 9. MTF curve of camera optical system.
Photonics 13 00528 g009
Figure 10. Comparison diagram of visual effects improvement.
Photonics 13 00528 g010
Figure 11. The structure of AS module.
Photonics 13 00528 g011
Figure 12. The overall structure of Mask R-CNN.
Photonics 13 00528 g012
Figure 13. Detection effects comparison between AS Mask R-CNN and Mask R-CNN ((a1e1) AS Mask R-CNN; (a2e2) Mask R-CNN).
Photonics 13 00528 g013
Figure 14. Comparisons of FPN, PAFPN, BiFPN, and FE-FPN. (af) Results of FPN, PAFPN, BiFPN, and FE-FPN, respectively.
Photonics 13 00528 g014
Figure 15. Overlap distributions for different models.
Photonics 13 00528 g015
Figure 16. Validation loss curves for different models.
Photonics 13 00528 g016
Table 1. Detection and segmentation performance based on different models.
ACSC ( φ = 0.50)SC ( φ = 0.65)SC ( φ = 0.75)AP50APmIOUPrecisionRecallF1SML
0.8670.3480.6200.7710.5560.6460.7370.8980.884
0.8820.3460.6290.7820.5580.6510.7670.8910.905
0.9070.3580.6220.7910.5720.6640.8060.9090.929
0.8800.3390.6220.7780.5590.6500.7520.8940.898
0.8610.3140.6040.7680.5530.6430.7360.8980.882
0.8880.3450.6300.7810.5590.6510.7710.9010.910
0.8670.3310.6190.7720.5530.6440.7440.8960.881
Table 2. Detection performance for small objects based on different models.
ACSC ( φ = 0.50)SC ( φ = 0.65)SC ( φ = 0.75)AP50APmIOUPrecisionRecallF1
0.7370.2610.5940.8440.4650.600
0.7670.2660.5960.8590.4690.606
0.8060.2850.6030.8710.4880.626
0.7520.2710.5900.8520.4720.607
Table 3. Comparison with other models on DOTA and WF-2040.
ModelmAP (%)FPSRunning
Time (ms)
Spatial
Resolution (m)
PSNR (dB)SSIMRadiometric
Deviation
DOTA
R-CNN [12]31.114.6680.8325.30.788.2
Swin Transformer [13]71.212.6790.6528.60.866.1
RetinaNet [14]54.114710.5529.10.877.3
Yolo [15]69.0510.1990.6128.80.877.1
Our method75.712.7790.532.10.953.8
WF-2040
R-CNN75.814.4690.7325.80.797.8
Swin Transformer84.66.61520.6529.60.866.0
RetinaNet57.514710.5229.80.886.3
Yolo64.4714.30.6030.80.886.4
Our method86.37.21390.532.00.953.8
Disclaimer/Publisher’s Note: The statements, opinions and data contained in all publications are solely those of the individual author(s) and contributor(s) and not of MDPI and/or the editor(s). MDPI and/or the editor(s) disclaim responsibility for any injury to people or property resulting from any ideas, methods, instructions or products referred to in the content.