Article

Graphene Oxide Sensitized No-Core Fiber Step-Index Distribution Sucrose Sensor

1
Guangxi Key Laboratory of Precision Navigation Technology and Application, Guilin University of Electronic Technology, Guilin 541004, China
2
Guangxi Key Laboratory of Automatic Detecting Technology and Instruments, Guilin University of Electronic Technology, Guilin 541004, China
3
School of Electronic Engineering and Automation, Guilin University of Electronic Technology, Guilin 541004, China
4
School of Physics and Optoelectronic Engineering, Foshan University, Foshan 528000, China
*
Author to whom correspondence should be addressed.
Photonics 2020, 7(4), 101; https://doi.org/10.3390/photonics7040101
Submission received: 23 September 2020 / Revised: 27 October 2020 / Accepted: 3 November 2020 / Published: 5 November 2020

Abstract

:
By coating graphene oxide (GO) onto the surface no-core fiber (NCF), we designed a single-mode no-core single-mode (SNS) fiber Step-Index Distribution sucrose sensor. With wavelength demodulation and the beam propagation method (BPM), the sensor without a GO coating was studied in the low RI range of 1.33~1.389, and the high RI range of 1.389~1.4185. The experiments show that the RI sensitivity of the sensor respectively reaches 132.9 nm/RIU and 292.22 nm/RIU. Both the numerical simulation and the experiments are highly consistent with the theoretical analysis results. Especially, having coated GO on the NCF for sensitization, a high sensitivity was achieved for the response to sucrose concentration solutions. The sensor’s RI sensitivity was increased from 132.9 nm/RIU up to 1348.67 nm/RIU in the ultra-narrow range of 1.33 to 1.3385. This result provides a theoretical and experimental basis for the enrichment and development of sensor detection with a low threshold sucrose concentration.

Graphical Abstract

1. Introduction

Refractive index (RI) sensing plays a significantly important role in many fields, such as biosensing, medical chemistry and food safety. There are many methods to measure RI sensing, for example, the fiber Bragg gratings, long-period fiber gratings, photonic crystal, Surface Plasmon Resonance (SPR) and multimode interference (MMI), etc. In 1999, Denis Donlagi first proposed the single-mode multi-mode single-mode (SMS) fiber structure which can be applied for sensing [1], and this SMS method has attracted extensive attention from researchers all over the world for its obvious advantages of high sensitivity, low cost and ease of fabrication. Based on multi-mode interference (MMI) theory and the self-image effect, this method of MMI has been widely applied in the areas of sensing measurement, such as RI [2], magnetic field [3], temperature [4], humidity and strain, etc. [5,6]. The traditional preparation method of a fiber optic sensor is to improve the sensitivity of the sensor by corroding the fiber cladding structure [7]. However, this corrosion method is difficult to control accurately. The result will not only contribute to the surface roughness of the prepared sensor fiber, but also reduce the mechanical strength of the fiber, which is not favorable for subsequent fusion and sensing applications. In addition, to solve the above problems, researchers began to consider using the surface plasmonic resonance (SPR) method for optical fiber sensing. Although the SPR method with a local surface enhancement effect can improve the performance of the sensor, the plasmonic sensor requires the introduction of metal with a negative dielectric constant as the excitation condition, which greatly increases the internal loss and affects the sensitivity and quality factor of the sensor. An SMS sensor based on step refractive index distribution can realize multi-mode interference. The use of no-core fiber (NCF) instead of multimode fiber can greatly overcome the above disadvantages caused by chemical corrosion, and increase repeatability while improving sensitivity. Since then, the NCF has contributed to the great progress in the field of optical fiber sensing [8,9,10,11,12,13,14]. In particular, in 2019, Zhang M Z et al. proposed the tapered NCF step-index sensor, whose structure was designed as single-mode no-core single-mode (SNS); the RI sensitivity of the sensor reaches 686 nm/RIU in the RI range of 1.333~1.350 [9].
In recent years, with the emergence of new two-dimensional materials, graphene, phosphine, transition metal sulfide and other materials [15,16,17,18,19,20,21], whose outstanding electronic and physical properties are derived from their 2D structures, have a great potential for application in high-performance chemical or biosensing, and for realizing new functional device [22,23,24,25,26]. As a typical two-dimensional material, graphene was first successfully fabricated by mechanical peeling in 2004 [27]. Due to its unique photoelectric properties, such as high carrier mobility [28], adjustable Fermi level [29], saturable absorption and excitable surface plasmon [30,31], etc., graphene is widely used in the field of biosensing. Although graphene has many excellent properties, the current large-scale production of high-quality graphene is still limited by complex processes and high costs, which need to be further improved. From the perspective of cost, graphene oxide (GO) and reduced graphene oxide (RGO) can be used to replace graphene in certain application areas. It can be considered that GO is a very thin graphite oxide flake [32,33,34], which is a layered material obtained by the strong oxidation of graphite with high crystallinity, which is then hydrolyzed. Since then, fiber optic sensing research based on GO has mushroomed in recent decades. In 2012, Shang J Z et al. discussed the origin of GO’s fluorescence, and for the first time observed the ultrafast fluorescence effect of GO in the visible spectrum [35]. This provides a good theoretical basis for the design of GO-based optical fiber sensors. In 2015, Dash et al. reported a sucrose RI sensor based on MZI-PCF. After coating GO on the MZI collapsed area, the wavelength sensitivity of the sensor could reach 230 nm/RIU, and the detection sensitivity increased to 130 dB/RIU [36]. In 2016, Wang Y Q et al. proposed a Bragg fiber grating relative humidity sensor based on coated GO film [37]. In the same year, Gao S S et al. proposed a GO U-shaped bending fiber sensor for ethanol solution detection, which achieved a higher resolution and sensitivity compared with similar devices without a GO film [38]. In 2017, Yu C et al. proposed a high-sensitivity NH3 optical fiber sensor, combining platinum (Pt)-nanoparticle junctions and GO materials, with a sensitivity of 10.2 pm/ppm [39]. In 2018, Divagar M et al. developed an optical fiber chemical sensor based on RI. By coating GO on a U-shaped curved plastic optical fiber, the sensor’s RI sensitivity and chemical resistance was significantly enhanced. The RI sensitivity was increased by 9.42 ± 0.37 (∆A845nm/∆RIU), which is 3.6 times that of the bare bend plastic optical fiber (BPOF) probe [40]. In 2020, Li J et al. proposed an optical fiber temperature and humidity sensor based on photonic crystal fibers coated with GO, and the temperature and humidity sensitivity were increased by 30% to 70% [41].
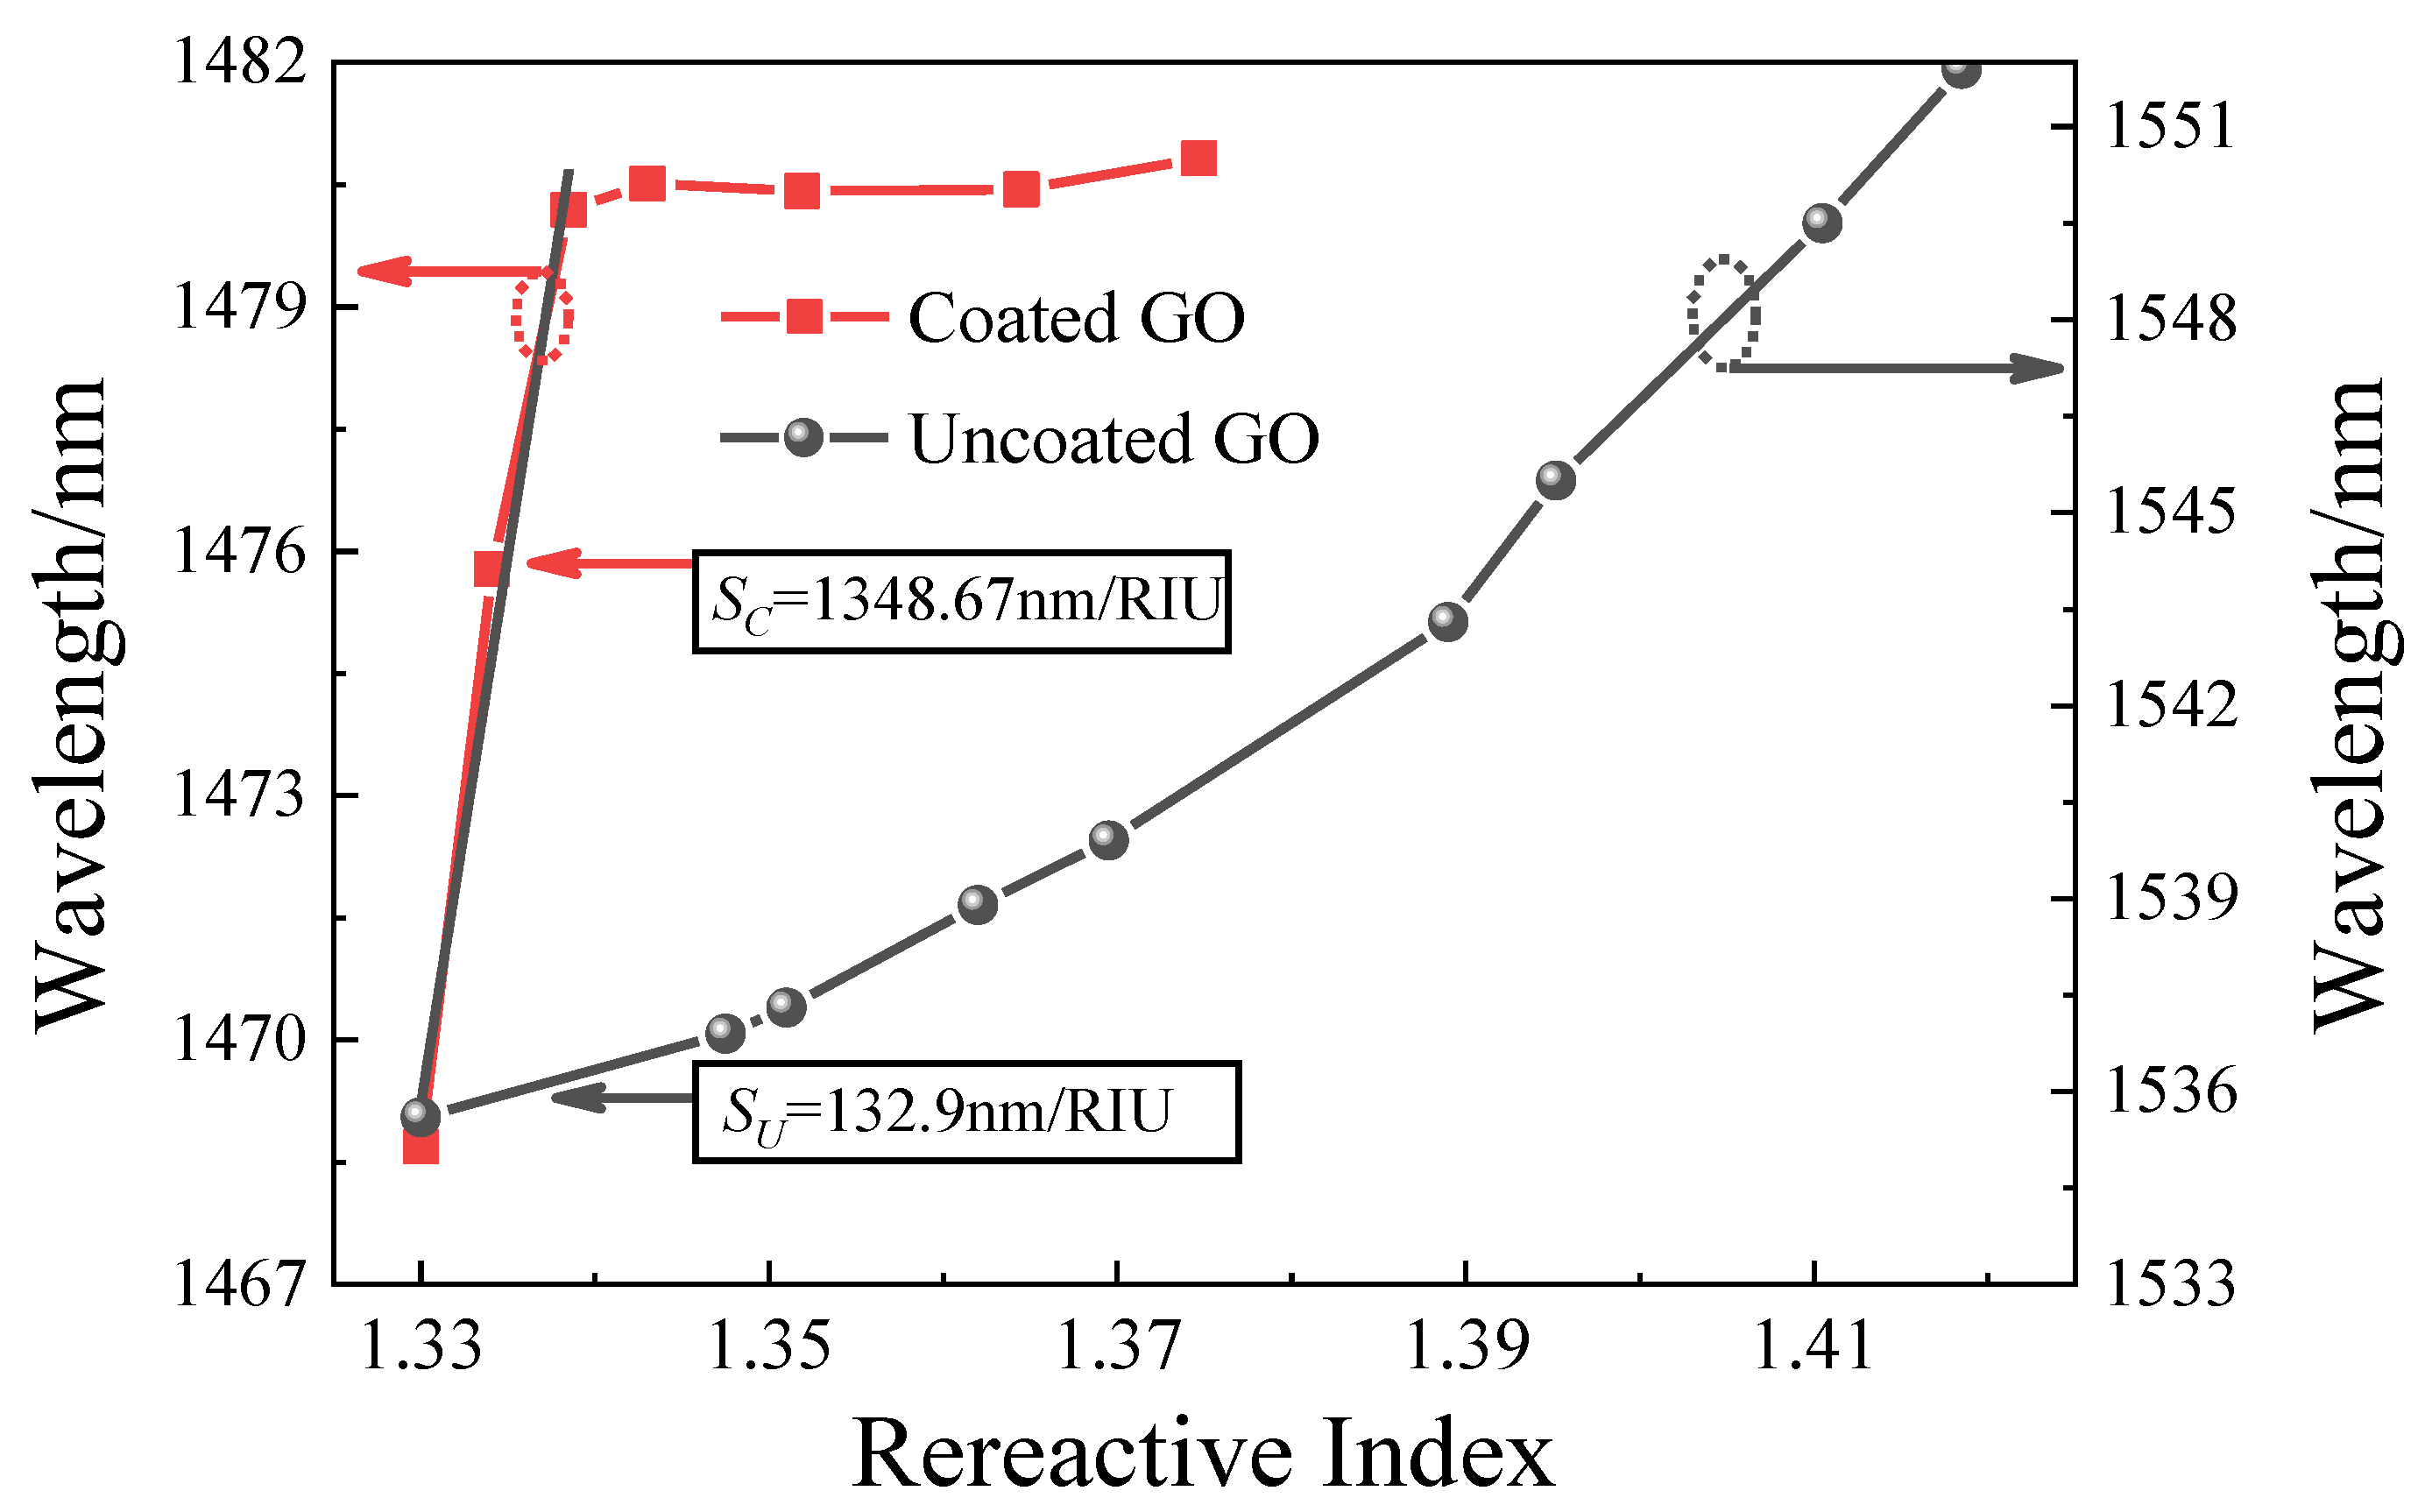
Based on GO coating, we propose an SNS step refractive index distribution sucrose sensor. The experimental results show that, with GO coated on the surface sensing area of the NCF, the sensor’s sensitivity is significantly enhanced up to 1348.67 nm/RIU, within an ultra-narrow RI range of 1.33 to 1.3385. The sensor’s RI sensitivity is increased from 132.9 nm/RIU up to 1348.67 nm/RIU. The experiment proves that the method of coating GO will reduce the measurement range of the RI, but it can improve the sensitivity of the SNS sensor at a low RI, which is improved by nearly 914.8%.

2. Sensor Principle

2.1. Working Principle

According to the refractive index distribution, the fiber can be divided into step type and gradual type. In this paper, we discuss the step refractive index distribution sensor whose structure is designed as single-mode no-core single-mode (SNS). The refractive index of the fiber core to the glass cladding is abrupt, and there is only one step, so it is called step type refractive index multimode fiber. The structure of an SNS sensor based on GO sensitization is shown in Figure 1. A piece of SMF is fused on both sides of a section of NCF, the GO film is coated on the surface of the NCF, and the surrounding solution of the measured substance is regarded as cladding. When the RI of the measured substance is less than that of the NCF, and the difference is not significant, the NCF can be regarded as a weakly guided multi-mode fiber (MMF) with step RI distribution. This structure is similar to the traditional SMS fiber’s structure. When incident light is coupled from single mode fiber into the NCF, a series of higher-order modes will be excited, and periodic light focus, namely the self-image effect, will be generated in the NCF. The energy distribution along the fiber’s propagation direction is specific when the fiber structure parameters remain unchanged. When the incident light wave is constant, there is a one-to-one correspondence between wavelength and energy, that is, a specific transmission spectrum. Because of the interference between different modes, the maximum or minimum of the energy will appear at a specific wavelength, that is, the peak or dip of interference will appear in the transmission spectrum.
It is assumed that single-mode fiber (SMF) and NCF are coaxially and non-eccentrically fused. Since the structure of the NCF is centrally symmetrical, only the linear polarization mode LP 0 m in the NCF is excited. If the light field input from SMF is E ( r ,   0 ) , then the light field of the first-order mode in NCF is E m ( r ) . Here, the optical field of the mTH order mode in NCF is Fm(r). According to the continuity condition of the electromagnetic field, the light field at the connection of SMF and NCF at the input end is [42]:
0 x | E ( r , 0 ) | 2 r d r = 0 x | E m ( r ) | 2 r d r , m = 1 , 2 ,
E ( r , 0 ) = m = 1 N c m F m ( r )
where N is the total number of modes in NCF, and c m is the excitation coefficient of the c order mode, which can be obtained by the following formula:
c m = 0 E ( r , 0 ) F m ( r ) d r 0 F m ( r ) d r
E ( r , z ) = m = 1 N c m F m ( r ) exp ( j β m z )
where β m is the longitudinal propagation constant of the m order mode.
Finally, the optical field is coupled into the single-mode fiber from the NCF and output. The transmittance can be obtained by the following formula:
T = 10 log 10 { m = 1 N n = 1 N c m c m * E m ( r ) E n * ( r ) exp [ j ( β m β n ) ] z }
The difference between the longitudinal propagation constants of the m mode and n mode is:
β m β n = μ m 2 μ n 2 2 k α NCF 2 n NCF
where α NCF is the radius of the NCF, k is the wave number, n NCF is the effective RI of the core mode of the NCF, and μ m and μ n are the normalized transverse wave numbers. It can be inferred, from the interference conditions, that constructive interference occurs when the phases of the two waves differ by an integer multiple of 2π, producing an optical field with the same amplitude as the incident light, that is, the self-image effect. In the SNS fiber structure, the surrounding medium is equivalent to the cladding of the NCF. As the external RI changes, the effective RI of the fundamental mode changes, causing the excitation coefficient of each fundamental mode to change. Finally, the transmission spectrum formed by the SNS fiber structure will change with the change of the external RI.
The peak wavelength of the transmission spectrum can be expressed as
λ peak = P n NCF D NCF 2 L
where P is the number of self-image cycles, L is the length of the NCF, D NCF is its diameter, and n NCF is its RI. It can be seen that when L , D NCF and n NCF change, the light field in the NCF changes, and the self-imaging period also changes. Therefore, in the NCF, the optical transmission loss of each order of transmission guide mode is different, and the output optical wavelength of the single mode fiber is also different. When the external RI increases, the peak wavelength of the SNS fiber structure will move into the long-wave direction. By calculating the peak wavelength interval, the measurement and sensing of the external environment RI can be achieved.

2.2. Simulation Analysis

The beam propagation method (BPM) was used to simulate the SNS structure. Here, the basic physical parameters of single-mode fiber (SMF) and NCF are shown in Table 1.
Figure 2a shows the simulation results of the internal transmission light field distribution of an SNS structure. It can be seen that, when light is transmitted in an SMF, the energy is mainly concentrated in the core. Since the incident light propagates from the SMF to the NCF, there is fiber core mismatch, and so several independent intrinsic modes will be excited. The modes of propagation excited by the SMF can interfere with the propagation process. These modes include guide modes that are confined within the fiber and radiation modes that leak out of the fiber. The periodic distribution of the optical field is formed in the no-core fiber (NCF), that is, the mode interference effect in the no-core fiber, as seen from Figure 2a. In this figure, we can see the three extreme points of interference, and the periodically guided phenomenon that is the self-image phenomenon. The total length of the four self-image cycles is approximately 60 mm, and the self-image cycle is approximately 15 mm. In order to study the output characteristics of the sensor, the length needs to be determined. In general, in order to make the medium power more effectively coupled into the output end, the multiple of the autofocus length is usually selected as the length of the NCF. As can be seen from the energy distribution diagram in the figure, if the location of the self-mapping point is connected to the outgoing single-mode fiber, we can get an SNS structure with extremely low insertion loss and multi-mode interference information. This is the meaning of obtaining the optimal length of the multimode fiber through simulation calculation. Here, twice the length of the autofocus is selected as the length of the NCF, that is, we take 3 cm as the length of NCF. Figure 2b shows the transmission spectrum variation under different external RI n . With the increase of n , the peak wavelength of the transmission spectrum moves toward the long wave direction, which is consistent with the theoretical derivation. It can also be seen that the higher the RI, the greater the distance is that the peak wavelength moves at the same RI difference, which indicates that the greater the RI, the higher the sensitivity of the sensor.

3. Device Fabrication

GO is a new two-dimensional material. It is a brownish yellow powder formed by the chemical oxidation stripping of graphene powder. The GO surface contains a large number of functional groups, such as -OH, -COOH, -O-, etc. The oxygen-containing functional groups of the GO are easily reacted with the chemical compounds of the amino groups, the carboxyl groups, the isocyanate groups etc., which realizes the hydrogen binding of the GO modification. The functional group also gives GO some new abilities, such as good dispersibility, a hydrophilic nature, an increased interaction of polymer, and so on. These excellent properties of GO make it possible to improve the fiber sensor’s sensitivity. By deposition of GO on the fiber surface, the coupling between the cladding mode and the surrounding medium is enhanced, thus improving the sensor’s sensitivity. The NCF is produced by YOFC, with a diameter of 125 μm, and the core refractive index is 1.444. The fabrication method of the device coated with GO on the SNS fiber’s surface is as follows:
(1)
Use the GO powder to prepare an 80 μg/mL GO aqueous solution and dissolve it with ultrasonic waves for 30 min;
(2)
Fix the optical fiber on the glass slide, soak the optical fiber with 1.0 M NaOH solution for 1 h at room temperature (27 °C) to generate an OH bond on the NCF surface, and then wash with ethanol and distilled water three times each;
(3)
Soak the treated fiber with freshly prepared 5% APTES ethanol solution for 1 h. The APTES reacts with -OH to from an Si-O-Si bond, and then the ethanol solution is used to wash out the unbound APTES and placed in an oven. Dry for 30 min at 70 °C;
(4)
Immerse the treated optical fiber in an aqueous GO solution of 80 μg/mL and place it on a heated plate at 42 °C for 3 h. The epoxy group of GO reacts with the -NH2 of APTES. As the aqueous solution evaporates, the GO gradually adsorbs onto the NCF surface. Finally, wash with distilled water to remove the unbound GO on the fiber’s surface, and dry the fiber at 70 °C for 1 h;
(5)
Weld the optical fiber. The welding uses the FUJIKURA Corporation’s 61S welding machine, made in Japan. Put the NCF and SMF in the welding machine’s fixture and use the automatic mode for non-eccentric welding. After the welding is completed, use the same method to weld another SMF section to obtain the SNS fiber structure we need.
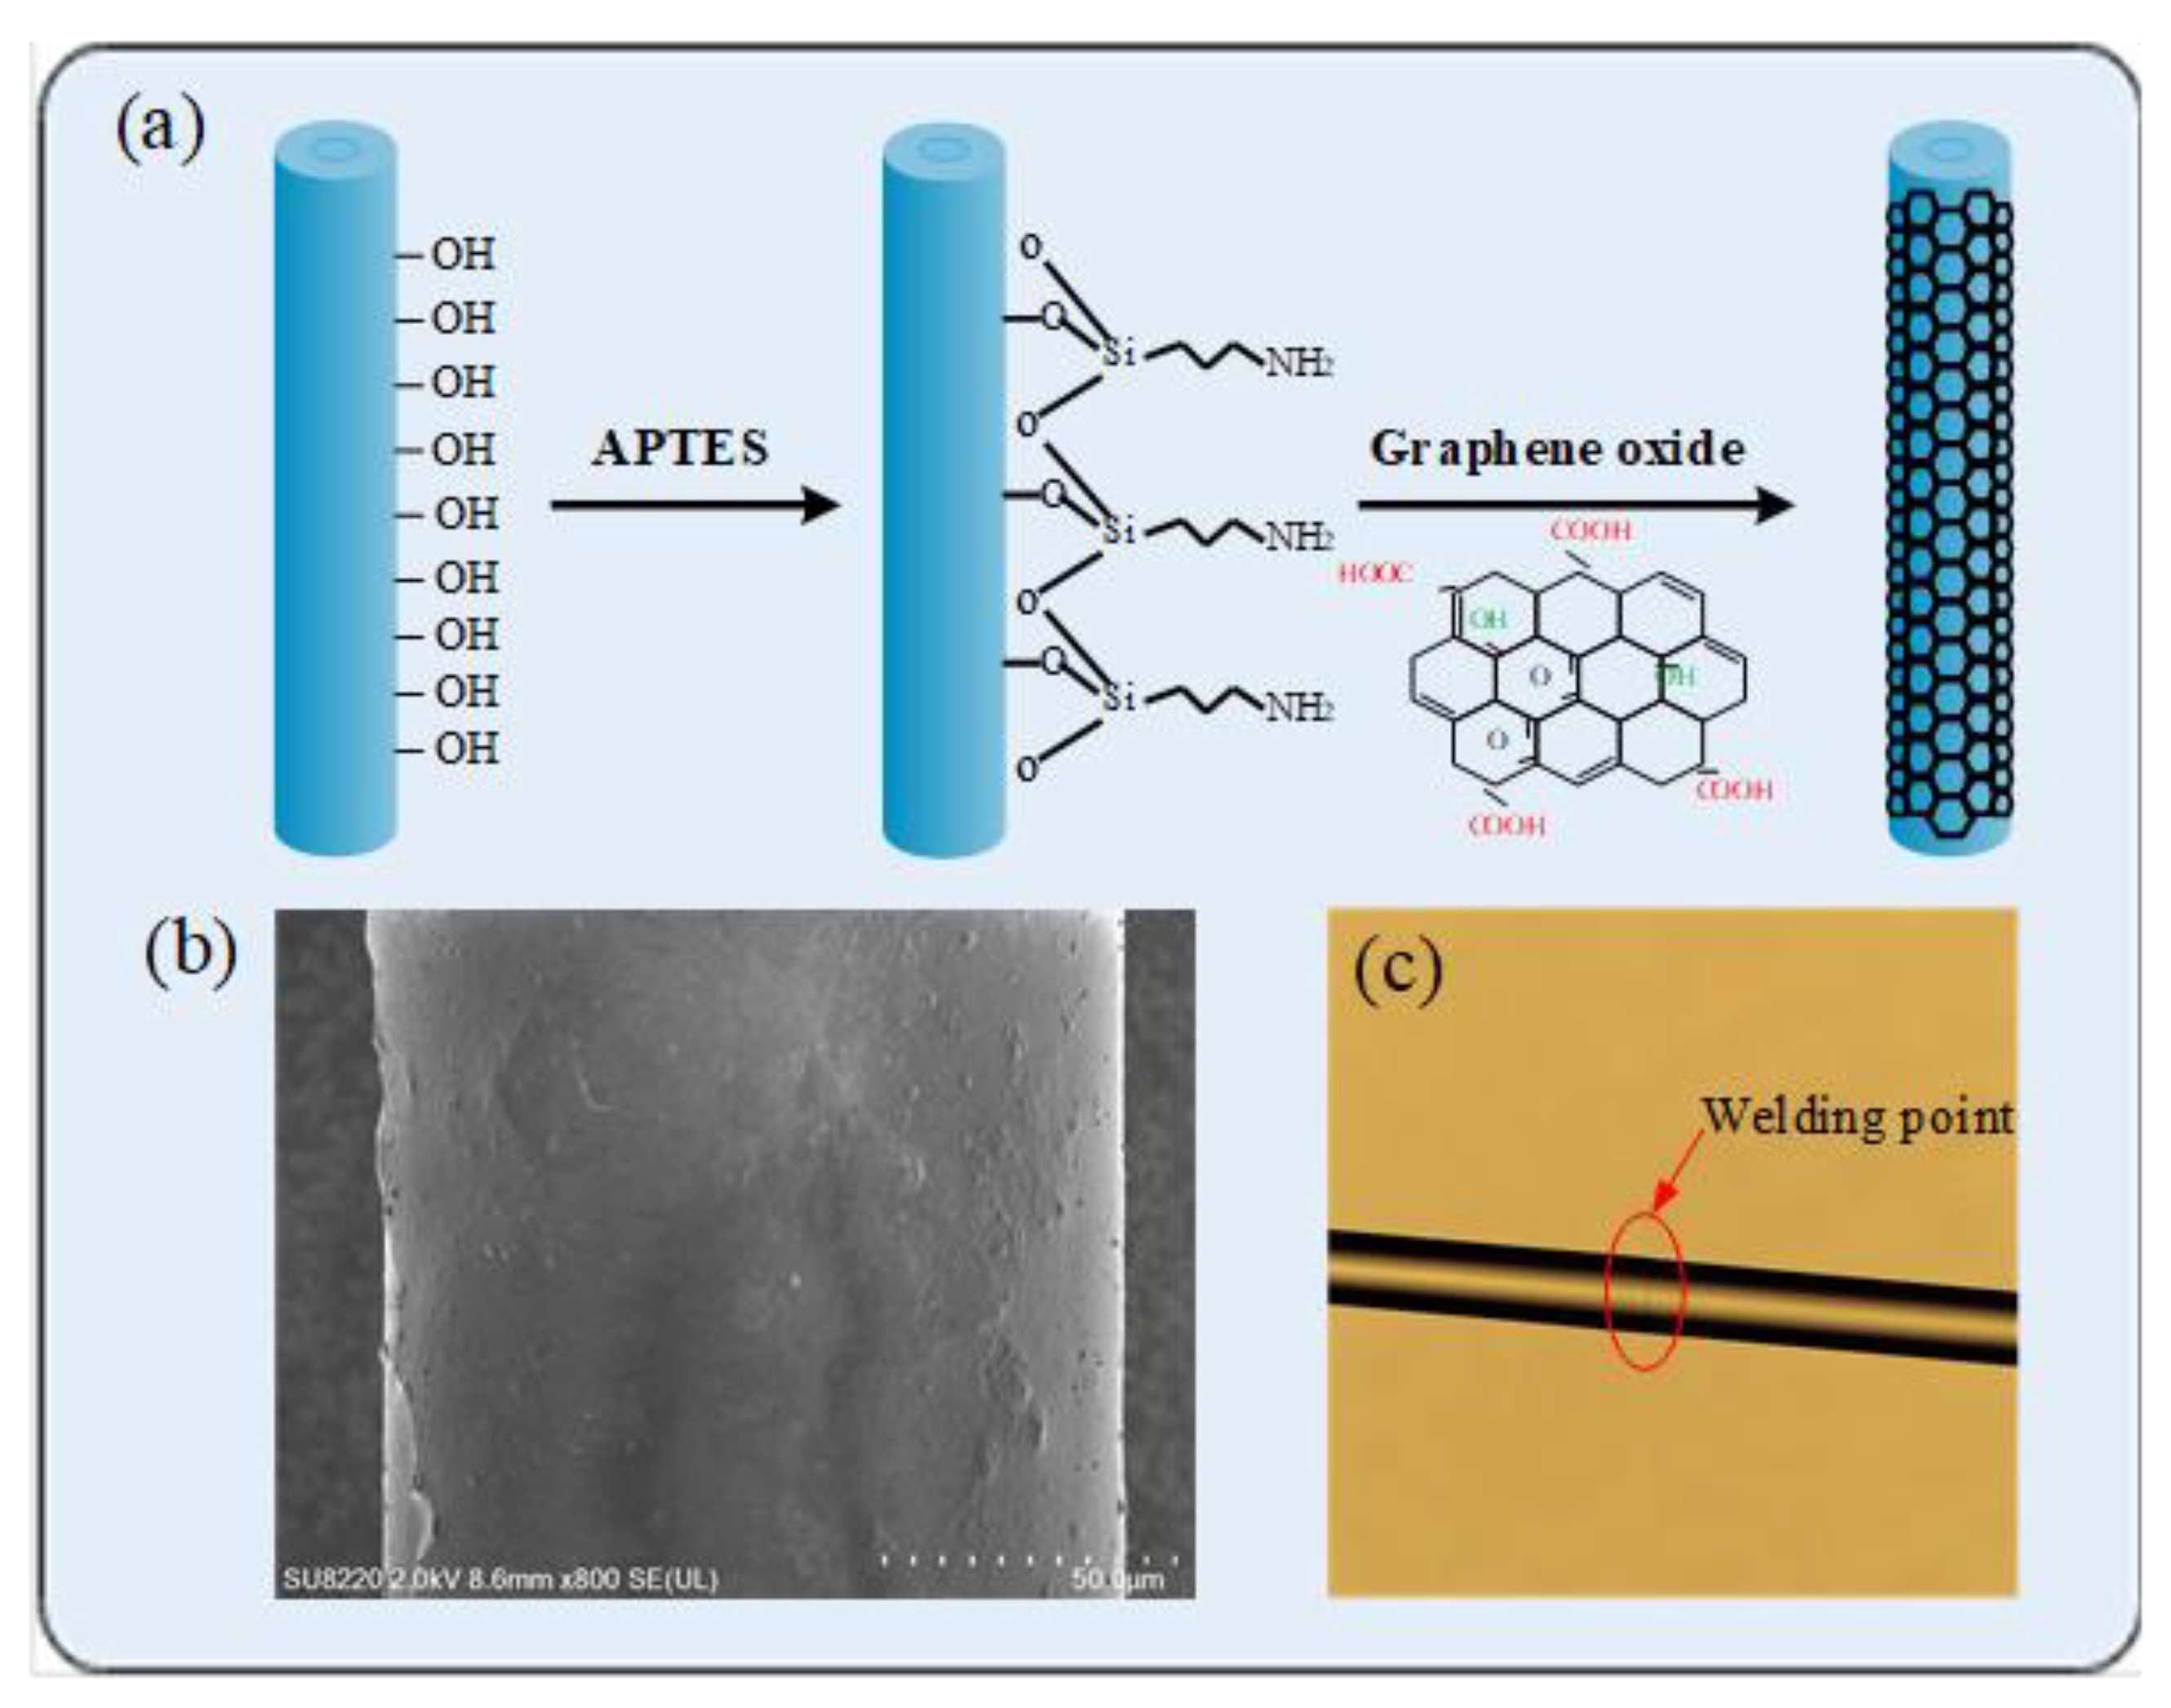
Figure 3a is the manufacturing flow chart, and Figure 3b is the NCF coated with GO. As shown in this figure, through an optical microscope, we can see that there is a layer of GO with a black color on the surface of the NCF coated with the GO film. Figure 3c is a microscope picture of the welding point. Since the diameter of the NCF is the same as the diameter of the single-mode fiber, the three-section fiber after fusion splicing can be perfectly coupled.

4. Experimental Results

4.1. Sensor Calibration

The SNS structure was fabricated by fusing a piece of SMF at both ends of a section of NCF. We used a balance to prepare nine groups of sucrose solutions with mass percentages of 0% to 50% at intervals of 10%, and poured them into a beaker. Then, we added distilled water and stirred them vigorously with a glass rod to dissolve them. After the solution was fully dissolved, we measured the refractive index of these solutions with an Abbe refractometer, mark the concentration of each solution separately, and then put them into sealed plastic bottles for experimental use. The relationship between sucrose concentration and refractive index is shown in Table 2.
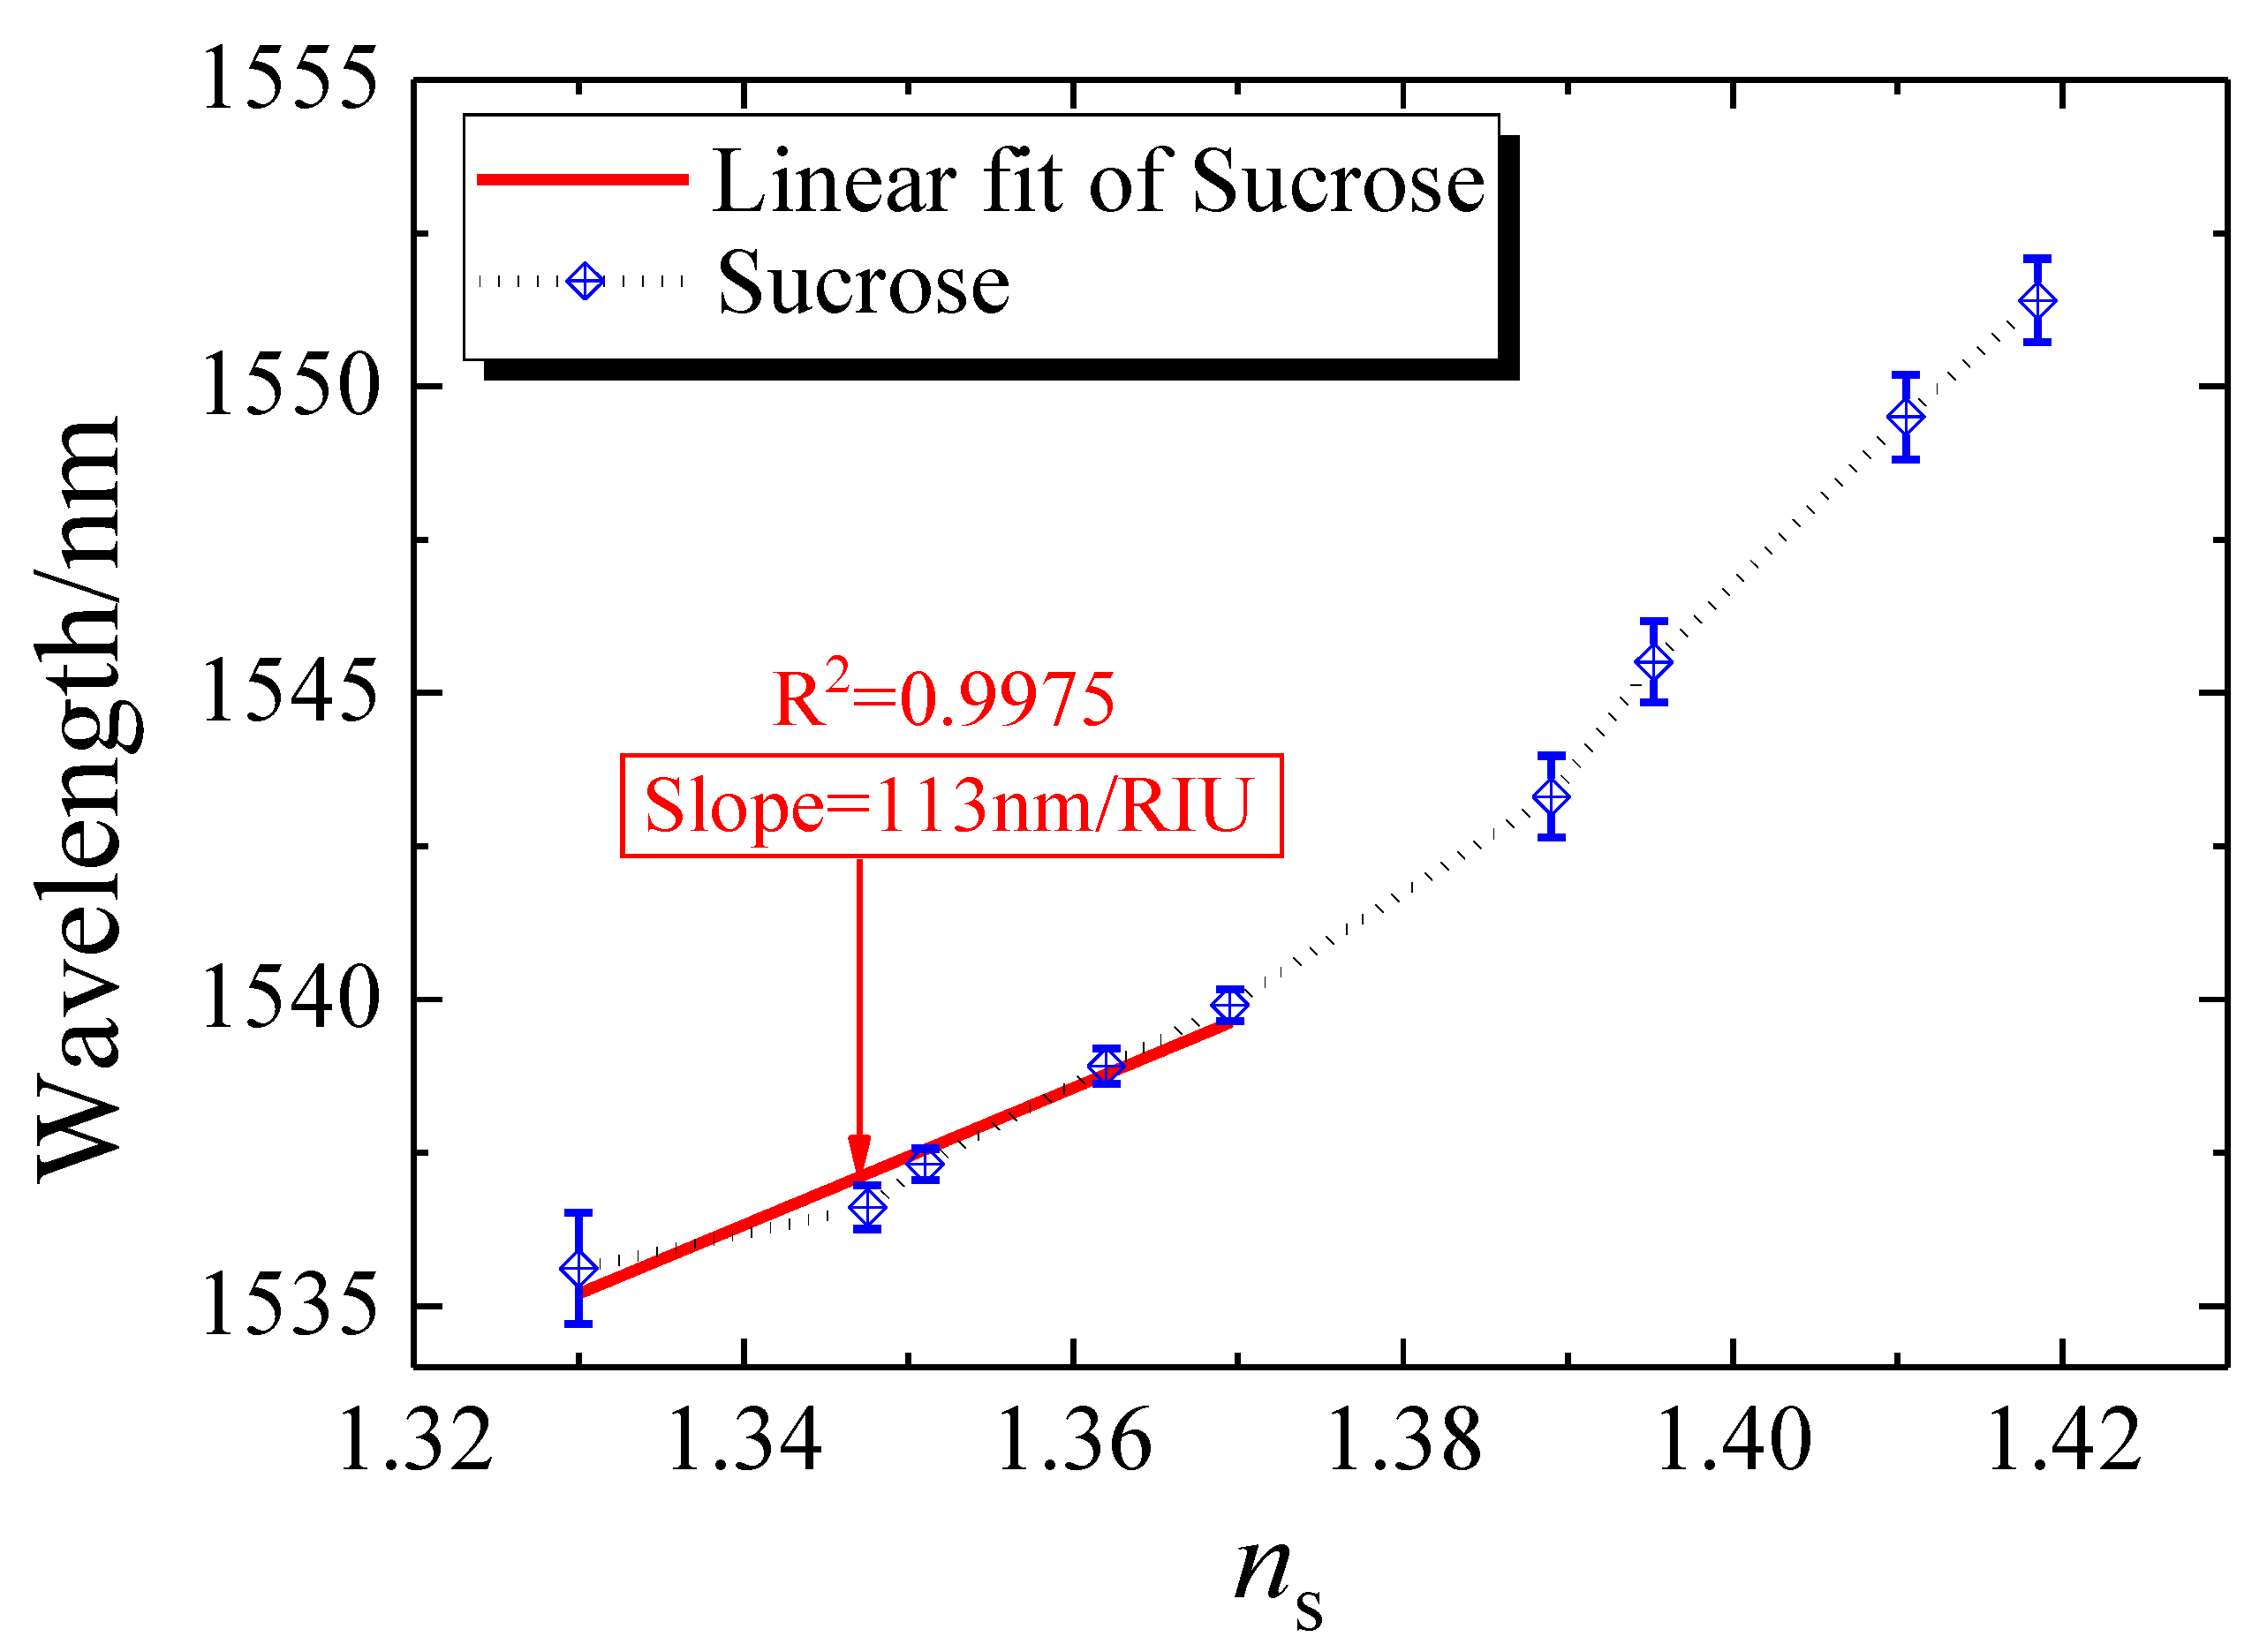
As shown in Figure 4 above, with the increase in the sucrose solution’s refractive index, the characteristic wavelength shifts to the direction of the long wave. From the refractive index of 1.33 to 1.3747, the wavelength shifted by 5.6 nm. We linearly fitted for the refractive index curve. The corresponding fitting curve slope for the sucrose solution reached 113 nm/RIU, and the relevant degree reached 0.9975. In order to ensure the accuracy of the experiment, we repeated the measurement data three times to take the mean value. The error analysis of the characteristic wavelengths at different refractive indexes of the solutions is shown in the error bar figure. At the refractive index of 1.33, the variance of characteristic wavelengths is the largest, which is 0.91, while the mean-variance of all characteristic wavelengths is 0.53. The error of the characteristic wavelengths measured in the overall experiment is relatively small. This result proves the universality of the sensor, and guarantees the validity of the matching solution with different refractive index concentrations.
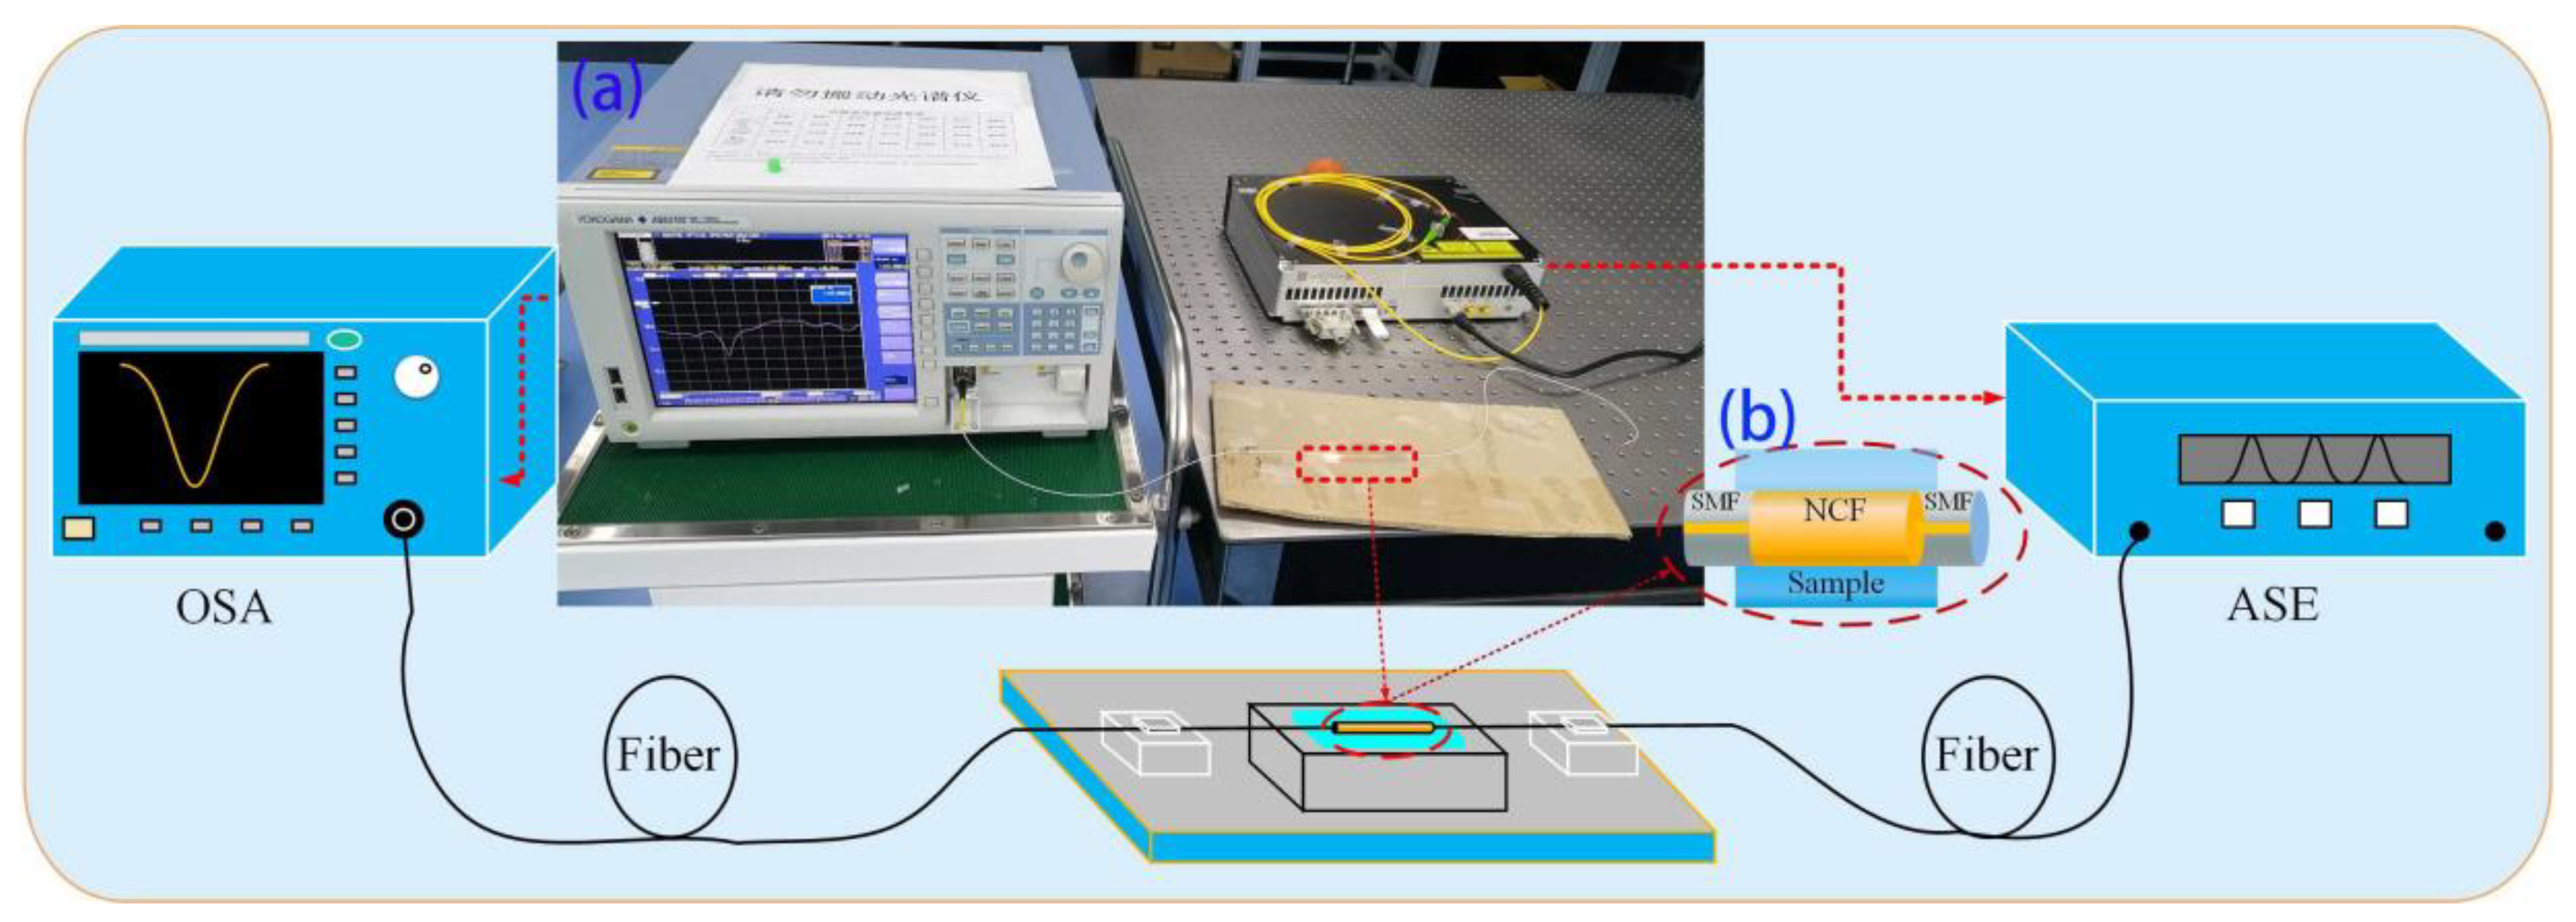
As shown in Figure 5, the SNS sensor is connected to the optical path via an Amplified Spontaneous Emission (ASE) supercontinuum broadband light source, and the other end is connected to an optical spectrum analyzer (OSA). The ASE used in the experiment is an SC-5-FC supercontinuum produced by Anyang Laser. The ASE’s maximum total output power is 800 mW, and the output spectrum ranges from 480 nm to 2200 nm, fully covering the experimental requirements (1500 nm~1600 nm). The model of OSA (discontinued) is AQ6370C from Yokogawa, Japan. The OSA’s wavelength ranges from 600 to 1700 nm. The fabricated SNS sensor is fixed on the glass slide and is connected to the optical path. In order to ensure the measurement result, the entire sensor is kept straight to prevent the fiber bending. Then, the data of the OSA under different RI solutions is recorded after turning on the supercontinuum broadband source. In this experiment, we adjusted the ASE from 0, and increased it by 10% every time, taking the empirical value as 30%. The input power was below the magnitude of 1Uw, which denotes the power within the unit of spectral range.

4.2. Results Analysis

After the sensor concentration calibration, we studied the RI sensing performance of the SNS structure with different sucrose concentrations. Figure 6 shows the experimental measurement of the uncoated GO transmission spectrum under variable RI conditions. As can be seen from Figure 6, with the increase of the RI of the external sucrose solution, the characteristic wavelength, i.e., the transmission dip, moves into the direction of the long wave, and the transmittance of the transmission dip gradually decreases regularly, which is consistent with the previous simulation results.
In this paper, the wavelength of transmission valley ( λ d i p ) and RI change of the external environment ( Δ n s ) were used for the sensor sensitivity analysis [43], and the corresponding sensitivity unit was nm/RIU.
S ( λ ) = Δ λ d i p Δ n s
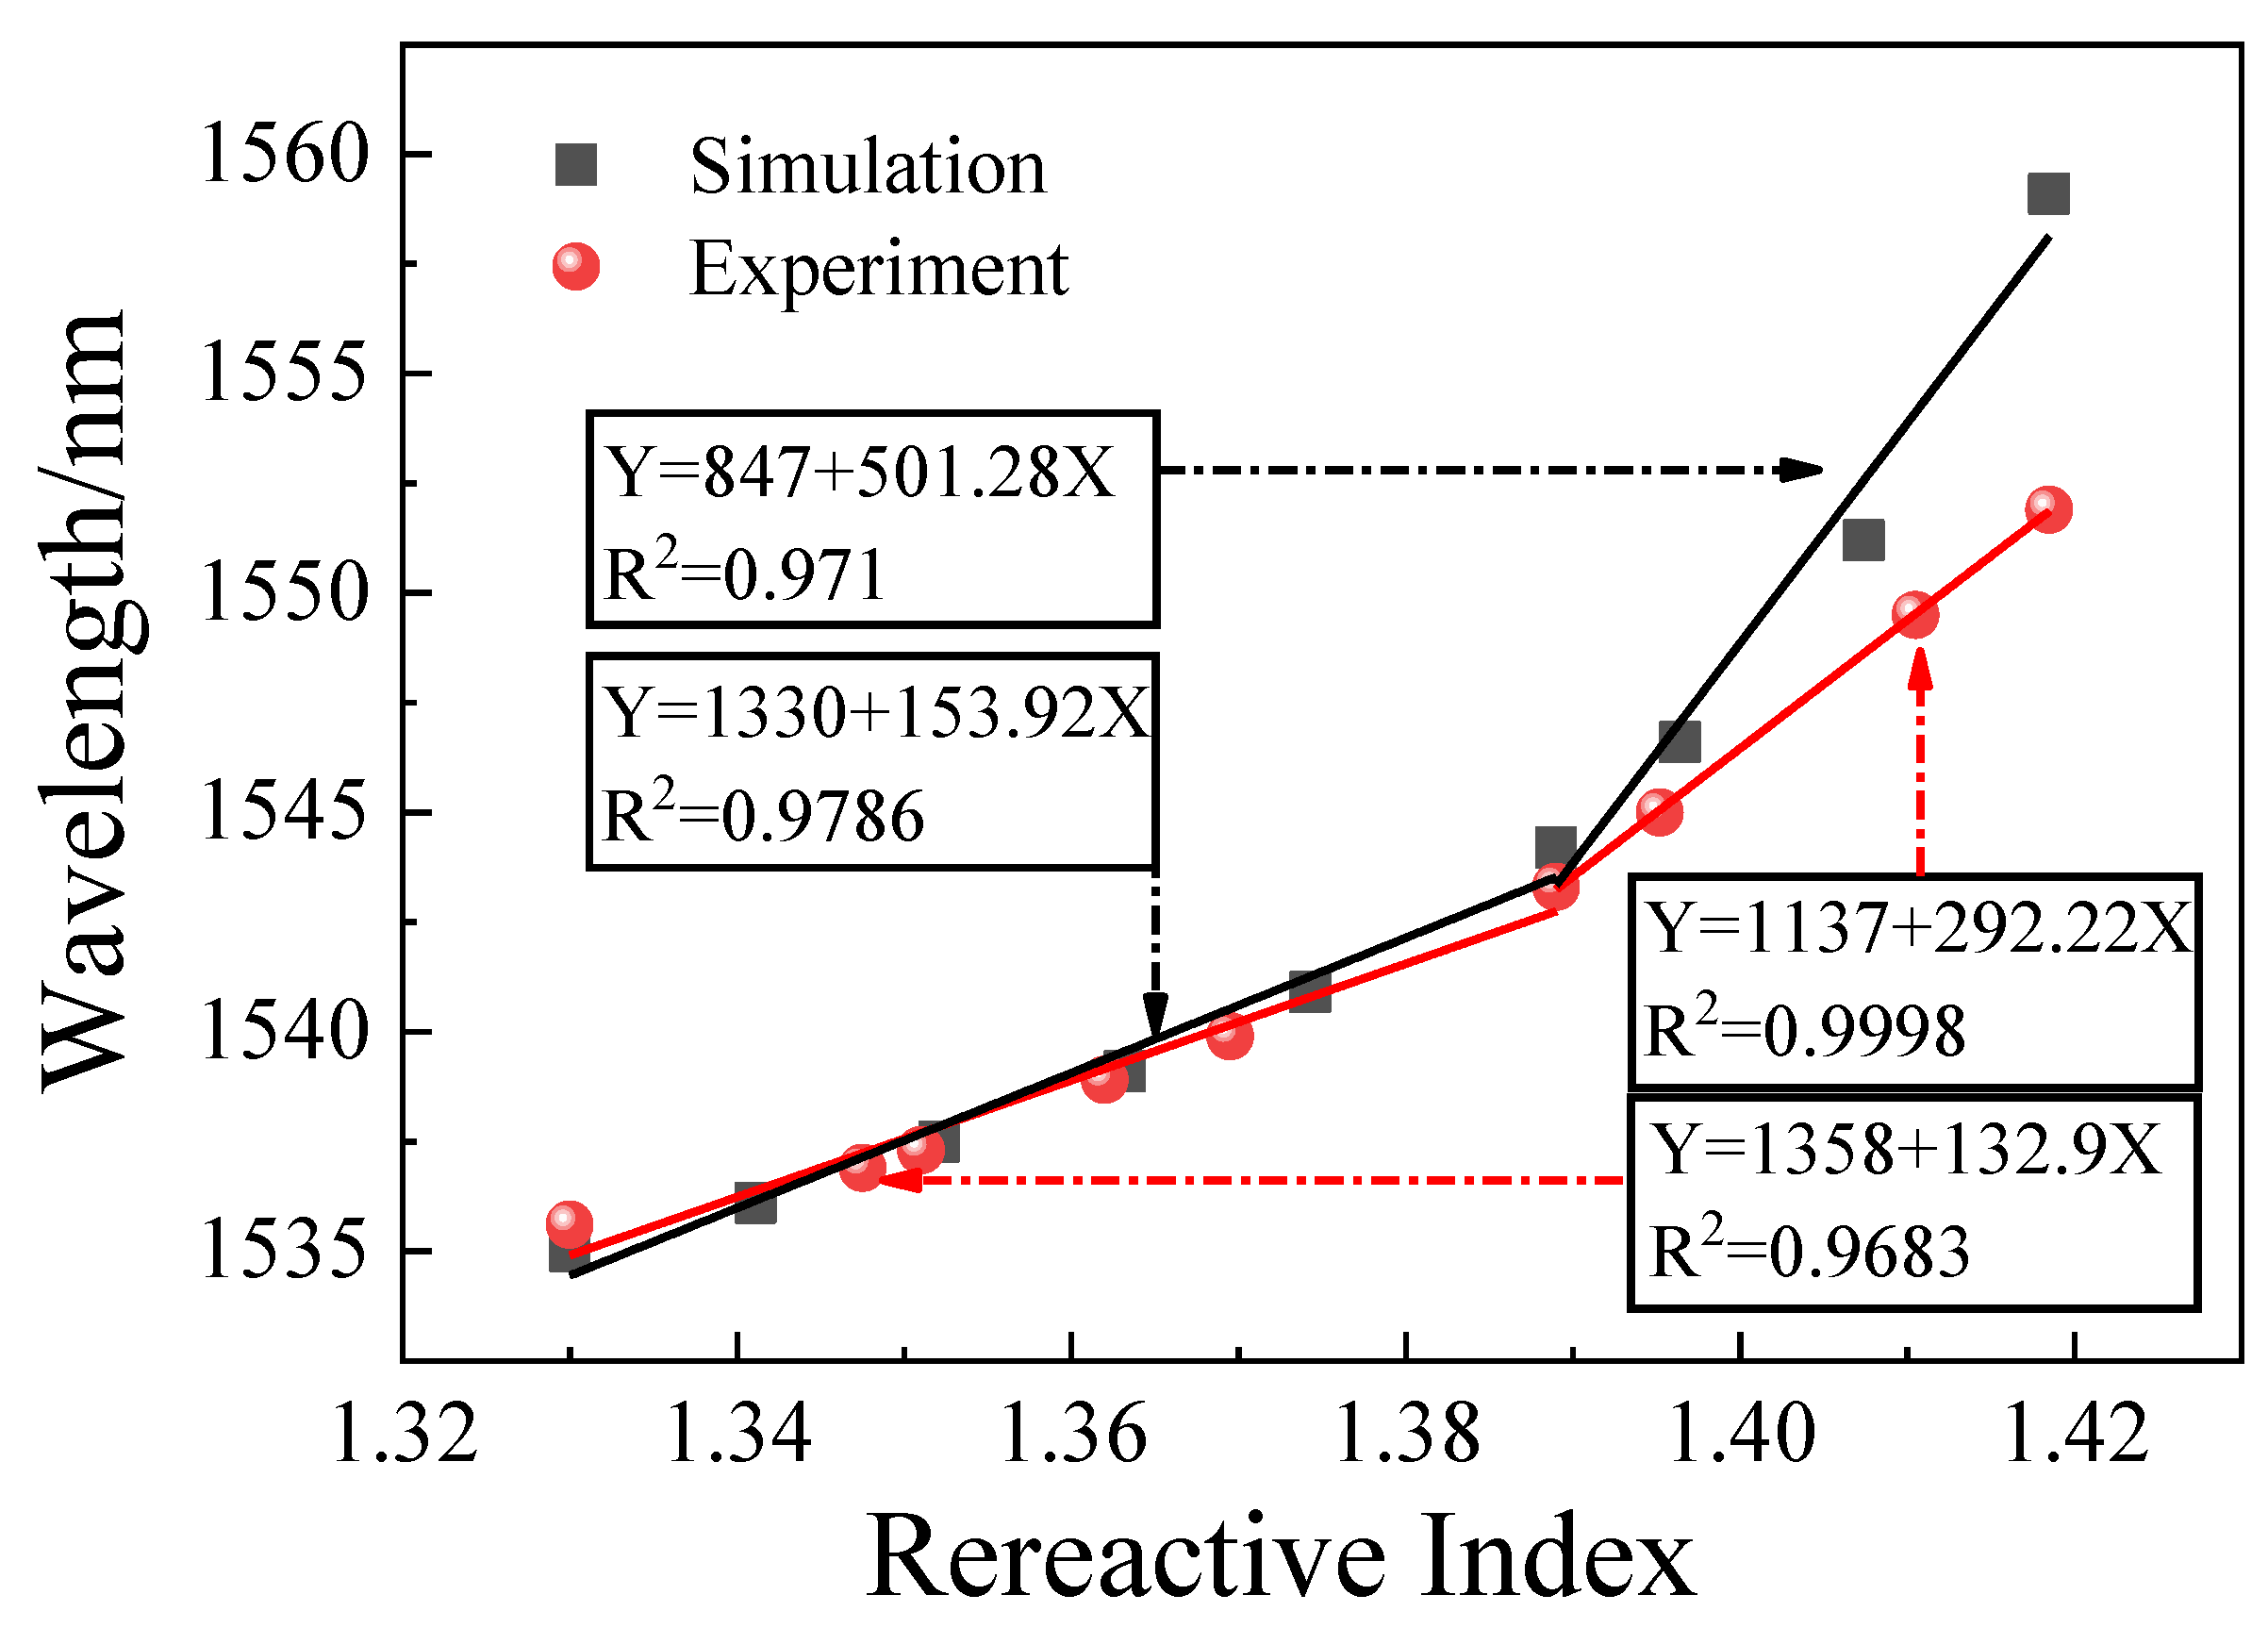
Figure 7 shows the sensitivity and linearity of the wavelength with varied RI in the simulation and experiments. We can see that the relationship between the shift of characteristic wavelength and RI is not linear. The characteristic wavelength and the solution’s RI can approximate to a linear relationship in the two ranges of the solution’s RI, from 1.33 to 1.389 and from 1.389 to 1.4185. After linear fitting, the RI was in the range of 1.33 to 1.389, the simulation sensitivity of the sensor was 153.92 nm/RIU, and the experimental sensitivity was 132.9 nm/RIU. With an RI from 1.389 to 1.4185, the simulation sensitivity reached 501.28 nm/RIU, while the sensitivity obtained by the experiment was 292.22 nm/RIU. This result shows that the sensor has a higher sensitivity to the solution with a higher RI, and the actual sensitivity measured by the experiment is lower than the theoretical sensitivity of the simulation. The reason for this analysis is that the more robust the nonlinearity of the evanescent wave energy is, the closer the environmental RI is to the RI of the NCF, which makes the penetration depth of the evanescent wave deeper, so the effective RI change of the core mode increases, corresponding to a higher sensitivity.
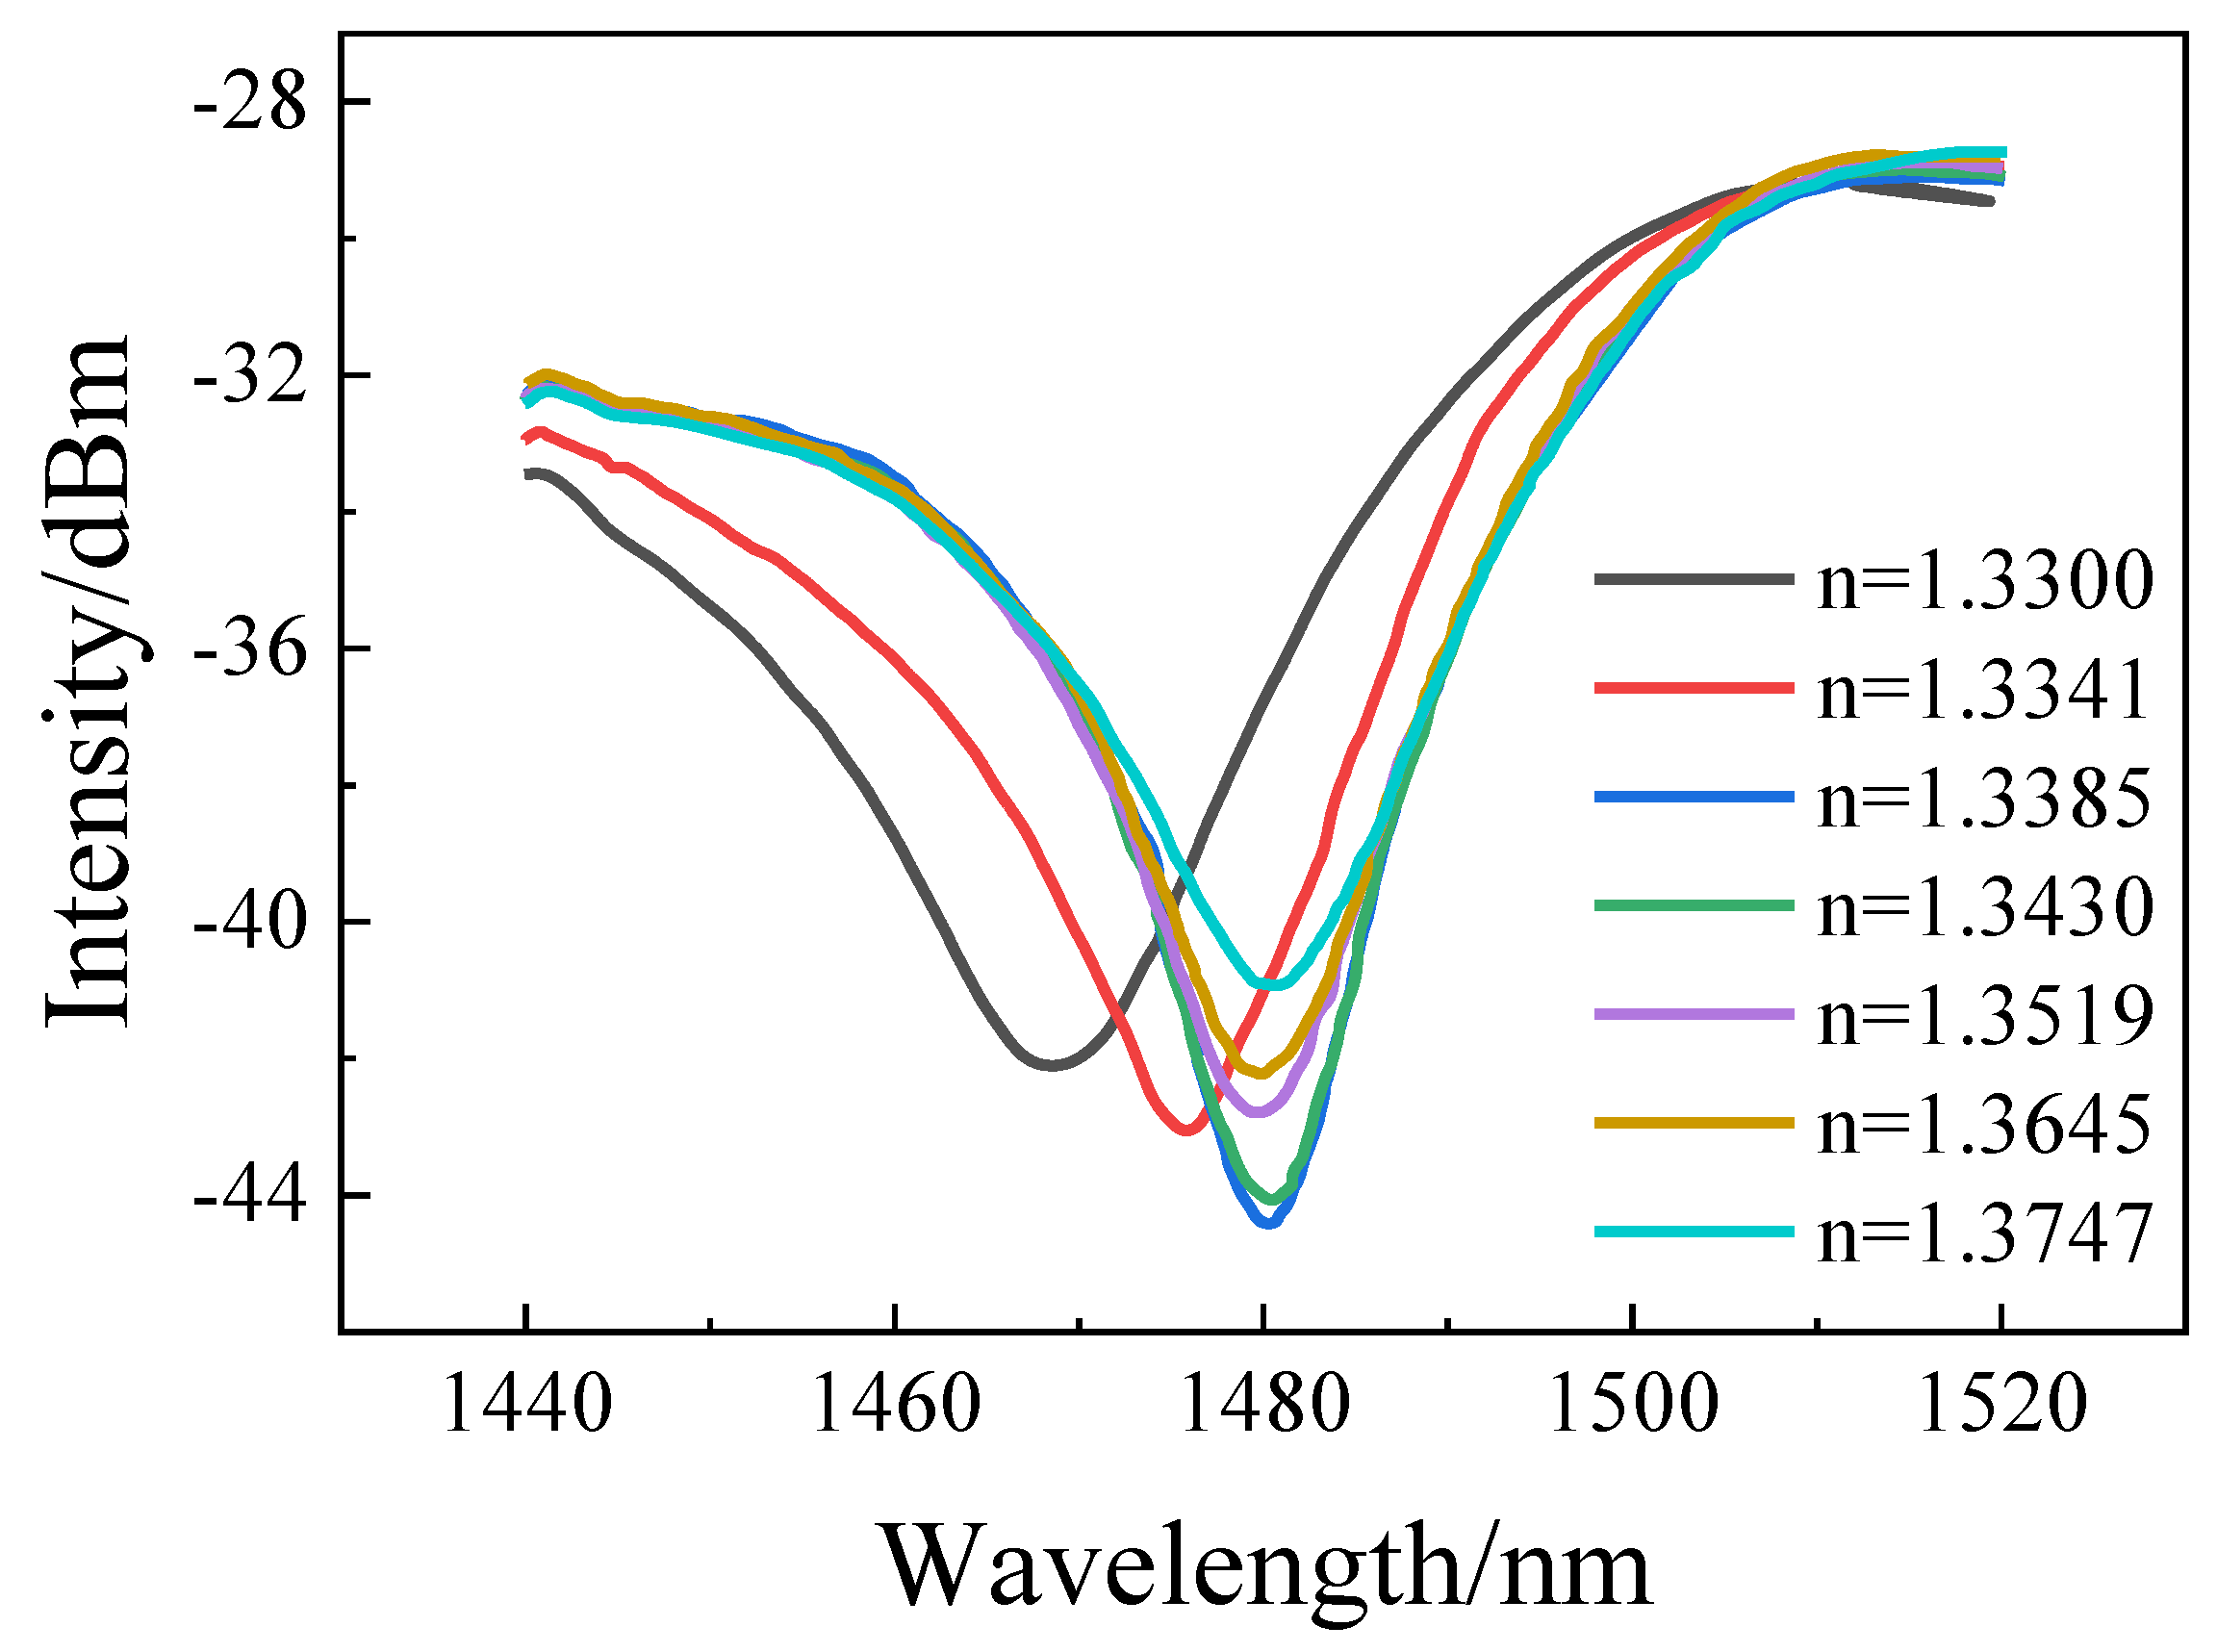
The RI of the optical fiber SNS structure coated with GO was measured as above, and the relationship between the transmission spectrum of the optical fiber and the RI can be obtained as shown in Figure 8. We can see that in the RI range of 1.33 to 1.3385, with the change in the RI, the transmission spectrum still moves into the long wave direction, but after 1.3385, the spectrum hardly moves, and as the RI increases, the resonance valley of the spectrum becomes shallow. This is because in the environment of high RI, that is, a high concentration sucrose solution, the solute adsorbed by the graphene oxide film tends to saturate. At this time, when the RI of the solution continues to increase, and the RI of the film changes slowly, the interference intensity tends to be stable, and the peak and valley positions of the transmission spectrum are almost unchanged.
Figure 9 is the relationship between the characteristic wavelength and the RI of the coated GO and the uncoated GO. We can see that the RI sensitivity of the uncoated GO sensor is S U = 132.9 nm/RIU, in the RI range of 1.3 to 1.3385.Compared with the sensor without the GO coating, after linear fitting, the RI sensitivity of the coated GO sensor is S C = 1348.67 nm/RIU, in the same RI range. The sensitivity is greatly improved. Experiments prove that the method of coated GO cannot be applied to the RI measurement when the RI is higher than 1.3385, but in the low RI range from 1.3 to 1.3385, the sensitivity of the SNS sensor coated with GO can be improved by nearly 914.8%. Here, we believe that the graphene oxide surface contains -OH and -COOH groups, which make it easy to form hydrogen bonds with sucrose’s -OH, thereby causing sucrose adsorption upon the surface oxidation of graphene. In a high concentration sucrose solution, the adsorption quickly reaches saturation, and the corresponding characteristic wavelength changes very little. Therefore, these excellent properties of GO make it possible to improve the sensing field of the sensor. By deposition of GO on the fiber surface, the coupling between the cladding mode and the surrounding medium is enhanced, thus improving the sensitivity of the sensor. Compared with the sensors with no GO cover, SNS was not sensitive to the changes in glucose concentration, and was only 132 nm/RIU. Here, the sensor’s sensitivity coated with GO would not produce continuous changes with varying refractive index concentrations. It will realize a jump within a particular range of low refractive index sensor sensitivity due to specific groups populating the graphene oxide and reaching their saturation values. Thus, we can only obtain the sensor’s jump graph at its minimum concentration threshold with coated with GO as seem from Figure 9. This research provides a new method for us to design a high sensitivity sensor to detect sucrose solution.
Table 3 compares the numerical results of several SMS-structured fiber-optic RI sensors and GO-coated fiber-optic RI sensors. From the year 2011 to 2020, We selected and compared SNS sensors’ sensitivity and the RI detection range. Obviously, the RI sensor of our SNS fiber structure based on GO-coated NCF has an extremely high sensitivity, in the RI range of 1.300 to 1.3385.

5. Conclusions

In this paper, we proposed an SNS sensor based on NCF coated with GO. We studied the principles of multimode interference and self-image sensing, and explained the working principle of the sensors theoretically, using BPM to simulate the transmission spectrum of the SNS sensor at different refractive indices. Based on simulation and theoretical bases, the SNS sensor based on NCF was fabricated. The transmission spectra of the sucrose solutions with different RI were tested, and the average sensitivity of the SNS sensor without GO coating was 132.9 nm/RIU, in the range of 1.33 to 1.389, and was 292.22 nm/RIU in the range of 1.389 to 1.4185. The SNS sucrose sensor coated with GO was experimentally investigated, and the sensitivity of the sensor coated with GO was greatly improved in the range of RI from 1.33 to 1.3385, reaching 1348.67 nm/RIU for response to sucrose concentration solutions, which is an order of magnitude higher than that of the conventional SNS structure. The study preliminarily explored a GO-sensitized glucose sensor, which provided a theoretical and experimental basis for the enrichment and development of sucrose sensor detection with a low threshold concentration. The monitoring of sucrose excessive intake is beneficial to the prevention and control of many disease, such as diabetes, obesity and dental caries related diseases. Considering the complexity of blood components, we need more elaborate experiments to be designed, or pretreatment processes for application to the more complex blood samples in future biosensor studies. This will be the direction of future research.

Author Contributions

G.X., H.Y. and L.G. conceived the design; K.Z. and Y.Y. performed the simulations and experiments; K.Z. analyzed the simulation data; H.Y. wrote the paper; L.Y., G.X., J.L. and K.Z. made revisions and finalized the paper. All authors have read and agreed to the published version of the manuscript.

Funding

This work is partially supported by the National Natural Science Foundation of China (61765004, 61827819), Natural Science Foundation of Guangxi Province (2017GXNSFAA198164, 2018GXNSFBA281175, 2016GXNSFAA380006), and the Guangxi Key Laboratory of Automatic Detecting Technology and Instruments (YQ20115), Science and Technology Projects of Guangxi Province (AD18281033) and the Open Fund of Foshan University.

Acknowledgments

I would like to thank associate professor Zhou Jianhua for his constructive suggestions, from the School of Materials Science and Engineering, Guilin University of Electronic Science and Technology, and graduate students Liu Mengyin, Xi Tao, Yang Shitai, Liu Yin and Ma Chao for their meaningful discussion.

Conflicts of Interest

The authors declare no conflict of interest.

References

  1. Donlagic, D.; Culshaw, B. Microbend sensor structure for use in distributed and quasi-distributed sensor systems based on selective launching and filtering of the modes in graded index multimode fiber. J. Lightwave Technol. 1999, 17, 1856–1868. [Google Scholar] [CrossRef]
  2. Kang, J.; Yang, J.R.; Zhang, X.D.; Liu, C.Y.; Wang, L. Intensity Demodulated Refractive Index Sensor Based on Front-Tapered Single-Mode-Multimode-Single-Mode Fiber Structure. Sensors 2018, 18, 2396. [Google Scholar] [CrossRef] [PubMed] [Green Version]
  3. Ascorbe, J.; Corres, J.M.; Matias, I.R. Magnetic field sensor based on a single mode-multimode-single mode optical fiber structure. In Proceedings of the 2015 IEEE SENSORS, Busan, Korea, 1–4 November 2015. [Google Scholar]
  4. Peng, Z.; Wang, L.; Yan, H. Research on high-temperature sensing characteristics based on modular interference of single-mode multimode single-mode fiber. In Proceedings of the SPIE/COS Photonics Asia, Beijing, China, 12–14 October 2016. [Google Scholar]
  5. An, J.L.; Zhao, Y.; Jin, Y.X.; Shen, C.Y. Relative humidity sensor based on SMS fiber structure with polyvinyl alcohol coating. Opt. Int. J. Light Electron Opt. 2013, 124, 6178–6181. [Google Scholar] [CrossRef]
  6. Ramakrishnan, M.; Rajan, G.; Semenova, Y.; Farrell, G. Overview of Fiber optic sensor technologies for strain/temperature sensing applications in composite materials. Sensors 2016, 16, 99. [Google Scholar] [CrossRef] [PubMed] [Green Version]
  7. Wu, Q.; Semenova, Y.; Wang, P.F.; Farrell, G. High sensitivity SMS fiber structure based refractometer analysis and experiment. Opt. Express 2011, 19, 7937–7944. [Google Scholar] [CrossRef] [PubMed]
  8. Hu, T.; Zhao, Y.; Cai, L. Temperature and Refractive Index Sensor using a High-Birefringence Fiber Loop Mirror and Single Mode-Coreless-Single Mode Fiber Structure. Instrum. Sci. Technol. 2016, 44, 366–376. [Google Scholar] [CrossRef]
  9. Zhang, M.Z.; Zhu, G.X.; Lu, L.D.; Lou, X.P.; Zhu, L.Q. Refractive index sensor based on ultrafine tapered single-mode nocladding single-mode fiber structure. Opt. Fiber Technol. 2019, 48, 297–302. [Google Scholar] [CrossRef]
  10. Aguilar-Soto, J.G.; Antonio-Lopez, J.E.; Sanchez-Mondragon, J.J.; May-Arrioja, D.A. Fiber Optic Temperature Sensor Based on Multimode Interference Effects. J. Phys. Conf. Ser. 2011, 274. [Google Scholar] [CrossRef]
  11. Zhou, X.L.; Chen, K.; Mao, X.F.; Peng, W.; Yu, Q.X. A reflective fiber-optic refractive index sensor based on multimode interference in a coreless silica fiber. Opt. Commun. 2015, 340, 50–55. [Google Scholar] [CrossRef]
  12. Zhou, G.R.; Wu, Q.; Kumar, R.; Ng, W.P. High Sensitivity Refractometer Based on Reflective Smf-Small Diameter No Core Fiber Structure. Sensors 2017, 17, 1415. [Google Scholar] [CrossRef] [PubMed] [Green Version]
  13. Baharin, N.F.; Azmi, A.I.; Abdullah, A.S.; Noor, M.Y.M. Refractive index sensor based on lateral-offset of coreless silica interferometer. Opt. Laser Technol. 2018, 99, 396–401. [Google Scholar] [CrossRef]
  14. Liu, X.X.; Zhang, X.P.; Liu, Y.; Liu, Z.G.; Peng, W. Multi-point fiber-optic refractive index sensor by using coreless fibers. Opt. Commun. 2016, 365, 168–172. [Google Scholar] [CrossRef]
  15. Zhang, H.; Xing, C.Y.; Jing, G.H.; Liang, X. Graphene oxide/black phosphorus nanoflake aerogels with robust thermo-stability and significantly enhanced photothermal properties in air. Nanoscale 2017, 9, 8096. [Google Scholar]
  16. Xing, C.Y.; Chen, S.Y.; Qiu, M.; Liang, X.; Liu, Q.; Zou, Q.S.; Li, Z.J.; Xie, Z.J.; Wang, D.; Dong, B.Q.; et al. Conceptually Novel Black Phosphorus/Cellulose Hydrogels as Promising Photothermal Agents for Effective Cancer Therapy. Adv. Healthc. Mater. 2018, 7, 1701510. [Google Scholar] [CrossRef]
  17. Xie, Z.J.; Xing, C.Y.; Huang, W.C.; Fan, T.J. Ultrathin 2D Nonlayered Tellurium Nanosheets: Facile Liquid-Phase Exfoliation, Characterization, and Photoresponse with High Performance and Enhanced Stability. Adv. Funct. Mater. 2018, 28, 1705833.1–1705833.11. [Google Scholar] [CrossRef]
  18. Jiang, X.T.; Zhang, L.J.; Liu, S.X.; Zhang, Y.Y.; He, Z.L. Ultrathin Metal–Organic Framework: An Emerging Broadband Nonlinear Optical Material for Ultrafast Photonics. Adv. Opt. Mater. 2018, 6, 1800561.1–1800561.11. [Google Scholar] [CrossRef]
  19. Qi, X.; Zhang, Y.P.; Ou, Q.D.; Ha, S.T.; Qiu, C.W.; Zhang, H.; Cheng, Y.B.; Xiong, Q.H.; Bao, Q.L. Photonics and Optoelectronics of 2D Metal-Halide Perovskites. Small 2018, 14, 1800682. [Google Scholar] [CrossRef]
  20. Zhang, Y.P.; Lim, C.K.; Dai, Z.G.; Yu, G.N.; Haus, J.W.; Zhang, H.; Prasad, P.N. Photonics and optoelectronics using nano-structured hybrid perovskite media and their optical cavities. Phys. Rep. 2019, 795, 1–51. [Google Scholar] [CrossRef]
  21. Jiang, Y.Q.; Miao, L.L.; Jiang, G.B.; Chen, Y.; Qi, X.; Jiang, X.F.; Zhang, H.; Wen, S.C. Broadband and enhanced nonlinear optical response of MoS2/graphene nanocomposites for ultrafast photonics applications. Sci. Rep. 2015, 5, 16372. [Google Scholar] [CrossRef] [Green Version]
  22. Zhou, Y.; Zhang, M.X.; Guo, Z.N.; Miao, L.L. Recent advances in black phosphorus-based photonics, electronics, sensors and energy devices. Mater. Horiz. 2017, 4, 997–1019. [Google Scholar] [CrossRef]
  23. Li, Z.J.; Qiao, H.; Guo, Z.N.; Ren, X.H. High-Performance Photo-Electrochemical Photodetector Based on Liquid-Exfoliated Few-Layered InSe Nanosheets with Enhanced Stability. Adv. Funct. Mater. 2018, 28, 1705237. [Google Scholar] [CrossRef]
  24. Tao, W.; Kong, N.; Ji, X.Y.; Zhang, Y.P. Emerging two-dimensional monoelemental materials (Xenes) for biomedical applications. Chem. Soc. Rev. 2019, 48, 2891. [Google Scholar] [CrossRef] [PubMed]
  25. Liu, J.; Jiang, X.T.; Zhang, R.Y.; Zhang, Y.; Wu, L.M.; Lu, W.; Li, J.Q. MXene-Enabled Electrochemical Microfluidic Biosensor: Applications toward Multicomponent Continuous Monitoring in Whole Blood. Adv. Funct. Mater. 2018, 29, 1807326. [Google Scholar] [CrossRef]
  26. Qiu, M.; Ren, X.R.; Jeong, T.; Won, M. Omnipotent phosphorene: A next-generation, two-dimensional nanoplatform for multidisciplinary biomedical applications. Chem. Soc. Rev. 2018, 47, 5588–5601. [Google Scholar] [CrossRef]
  27. Novoselov, K.S.; Geim, A.K.; Morozov, S.V.; Jiang, D.; Zhang, Y.; Dubonos, S.V.; Grigorieva, I.V. Electric field effect in atomically thin carbon films. Science 2004, 306, 666–669. [Google Scholar] [CrossRef] [Green Version]
  28. Hurch, S.; Nolan, H.; Hallam, T.; Berner, N.C.; McEvoy, N.; Duesberg, G.S. Inkjet-defined field-effect transistors from chemical vapour deposited graphene. Carbon 2014, 71, 332–337. [Google Scholar] [CrossRef]
  29. Vakil, A.; Engheta, N. Transformation optics using graphene. Science 2011, 332, 1291–1294. [Google Scholar] [CrossRef] [PubMed] [Green Version]
  30. Obraztsov, P.A.; Rybin, M.G.; Tyurnina, A.V.; Garnov, S.V.; Obraztsova, E.D.; Obraztsov, A.N.; Svirko, Y.P. Broadband light-induced absorbance change in multilayer graphene. Nano Lett. 2011, 11, 1540–1545. [Google Scholar] [CrossRef]
  31. Jablan, M.; Buljan, H.; Soljačić, M. Plasmonics in graphene at infra-red frequencies. Phys. Rev. B 2009, 80, 245435. [Google Scholar] [CrossRef] [Green Version]
  32. Stankovich, S.; Piner, R.D.; Nguyen, S.B.T.; Ruoff, R.S. Synthesis and exfoliation of isocyanate-treated graphene oxide nanoplatelets. Carbon 2006, 44, 3342–3347. [Google Scholar] [CrossRef]
  33. Stankovich, S.; Dikin, D.A.; Piner, R.D.; Kohlhaas, K.A.; Kleinhammes, A.; Jia, Y.Y.; Wu, Y.; Nguyen, S.B.T.; Ruoff, R.S. Synthesis of graphene-based Nano sheets via chemical reduction of exfoliated graphite oxide. Carbon 2007, 45, 1558–1565. [Google Scholar] [CrossRef]
  34. Arasu, P.T.; Noor, A.S.M.; Shabaneh, A.A.; Yaacob, M.H.; Lim, H.N.; Mahdi, M.A. Fiber bragg grating assisted surface plasmon resonance sensor with graphene oxide sensing layer. Opt. Commun. 2016, 380, 260–266. [Google Scholar] [CrossRef]
  35. Shang, J.Z.; Ma, L.; Li, J.W.; Ai, W.; Yu, T.; Gurzadyan, T.T. The origin of fluorescence from graphene oxide. Sci. Rep. 2012, 2, 792. [Google Scholar] [CrossRef] [Green Version]
  36. Dash, J.N.; Jha, R. Temperature insensitive PCF interferometer coated with graphene oxide tip sensor. IEEE Photonics Technol. Lett. 2016, 28, 1006–1009. [Google Scholar]
  37. Wang, Y.Q.; Shen, C.Y.; Lou, W.M.; Shentu, F.Y.; Zhong, C.; Dong, X.Y.; Tong, L.M. Fiber optic relative humidity sensor based on the tilted fiber Bragg grating coated with graphene oxide. Appl. Phys. Lett. 2016, 109, 031107. [Google Scholar] [CrossRef]
  38. Gao, S.S.; Qiu, H.W.; Zhang, C.; Jiang, S.Z.; Li, Z.; Liu, X.Y.; Yue, W.W.; Yang, C.; Huo, Y.Y.; Feng, D.J.; et al. Absorbance response of a graphene oxide coated U-bent optical fiber sensor for aqueous ethanol detection. RSC Adv. 2016, 6, 15808–15815. [Google Scholar] [CrossRef]
  39. Yu, C.B.; Wu, Y.; Liu, X.L.; Fu, F.; Gong, Y.; Rao, Y.J.; Chen, Y.F. Miniature fiber-optic NH3 gas sensor based on Pt nanoparticle-incorporated graphene oxide. Sens. Actuators B Chem. 2016, 244, 107–113. [Google Scholar] [CrossRef]
  40. Divagar, M.; Gowri, A.; John, S.; Sai, V.V.R. Graphene oxide coated U-Bent plastic optical fiber based chemical sensor for organic solvents. Sens. Actuators B Chem. 2018, 262, 1006–1012. [Google Scholar] [CrossRef]
  41. Li, J.X.; Tong, Z.R.; Jing, L.; Zhang, W.H.; Qin, J.; Liu, J.W. Fiber temperature and humidity sensor based on photonic crystal fiber coated with graphene oxide. Opt. Commun. 2020, 467, 125707. [Google Scholar] [CrossRef]
  42. Koshiba, M.; Saitoh, K.; Kokubun, Y. Heterogeneous multi-core fibers: Proposal and design principle. IEICE Electron. Express 2009, 6, 98–103. [Google Scholar] [CrossRef] [Green Version]
  43. Rifat, A.A.; Mahdiraji, G.A.; Sua, Y.M.; Ahmed, R.; Shee, Y.G.; Adikan, F.R.M. Highly sensitive multi-core flat fiber surface plasmon resonance refractive index sensor. Opt. Express 2016, 24, 2485–2495. [Google Scholar] [CrossRef]
Figure 1. Schematic diagram of sensor and physical picture of no-core fiber.
Photonics 07 00101 g001
Figure 2. BPM simulation results. (a) The energy distribution of the transmitted light field in the optical fiber. (b) Schematic diagram of SNS sensor transmittance change with external refractive index.
Photonics 07 00101 g002
Figure 3. (a) Flow chart of GO production. (b) SEM figure of GO-coated optical fiber sensor. (c) Welding point microscope picture.
Photonics 07 00101 g003
Figure 4. The relationship between the characteristic wavelength and different solutions’ refractive index.
Photonics 07 00101 g004
Figure 5. Diagram of experimental device. (a) Sensor test experiment device diagram. (b) Enlarged view of experimental apparatus.
Photonics 07 00101 g005
Figure 6. Experimental transmission spectrum of uncoated GO under different refractive index.
Photonics 07 00101 g006
Figure 7. The sensitivity and linearity of the wavelength with varying RI (simulation and experiment).
Photonics 07 00101 g007
Figure 8. The transmission spectrum under different refractive index after coated GO.
Photonics 07 00101 g008
Figure 9. The relationship between the characteristic wavelength and refractive index of coated GO and uncoated GO.
Photonics 07 00101 g009
Table 1. Optical fiber’s parameters.
TypeCore Refractive IndexCladding Refractive IndexCore Radius/μm
SMF1.46821.46288.2
NCF1.44401.3300~1.418562.5
Table 2. The relationship between refractive index and concentration of refractive index matching solution (sucrose).
Sucrose Concentration0%10%20%25%30%35%40%45%50%
The Refractive Index1.3301.3481.3511.3621.3701.3891.3951.4111.419
Table 3. Comparison of refractive index sensitivity of SMS structure from the literature.
StructureDetection RI
Range
RI SensitivityAgeRefs.
SMS fiber structure-based refractometer1.342~1.4371815 nm/RIU2011[7]
High-birefringence fiber loop mirror and SNS fiber structureaqueous of NaCl solution96.42 nm/RIU2016[8]
Ultrafine tapered SNS fiber structure1.333~1.350686 nm/RIU2019[9]
GO sensitized SNS Fiber1.330~1.33851348.67 nm/RIU2020Our work
Publisher’s Note: MDPI stays neutral with regard to jurisdictional claims in published maps and institutional affiliations.