1. Introduction
A nanoparticle levitated in a high vacuum [
1] provides an ideal platform for testing macroscopic quantum mechanics [
2] and for studies of nano-thermodynamics [
3]. Levitation offers extreme isolation of the nanoparticle from the thermal environment, making these excellent low dissipation mechanical devices for sensing force [
4], pressure [
5] and torque [
6].
While there are various nanoparticle levitation techniques [
1], the use of focussed optical fields offers high precision and control and enables cooling and control at the quantum level [
7,
8]. Precision applications require trapping under vacuum conditions; however, due to the conservative nature of optical potentials, a dissipation mechanism is required to load nanoparticles into optical traps.
A common loading technique is to suspend nanoparticles in a solvent and then to introduce them into the gas phase through nebulization in ambient conditions. The particles then diffuse to the optical trap and are captured, typically after a few minutes [
9,
10], after which the pressure is reduced. This method has some drawbacks, namely the potential to contaminate the vacuum system and delicate optics in the trapping region, and absorption of the solvent into porous dielectric nanoparticles [
10]. Nebulization also relies on having a large number of nanoparticles available, since the method is highly probabilistic, and so is not suitable for small samples of tailored particles.
Another method is to launch particles from the surface of a piezoelectric transducer [
11,
12,
13]. This method is clean and dry, and works at pressures down to a few mbar. Launching requires enough mechanical force to overcome the van der Waals force between the piezoelectric surface and the particles, making this method suitable only for particles with diameters greater than ∼400 nm. As with nebulization, piezoelectric launching is not suitable for nanofabricated particles grown on a substrate.
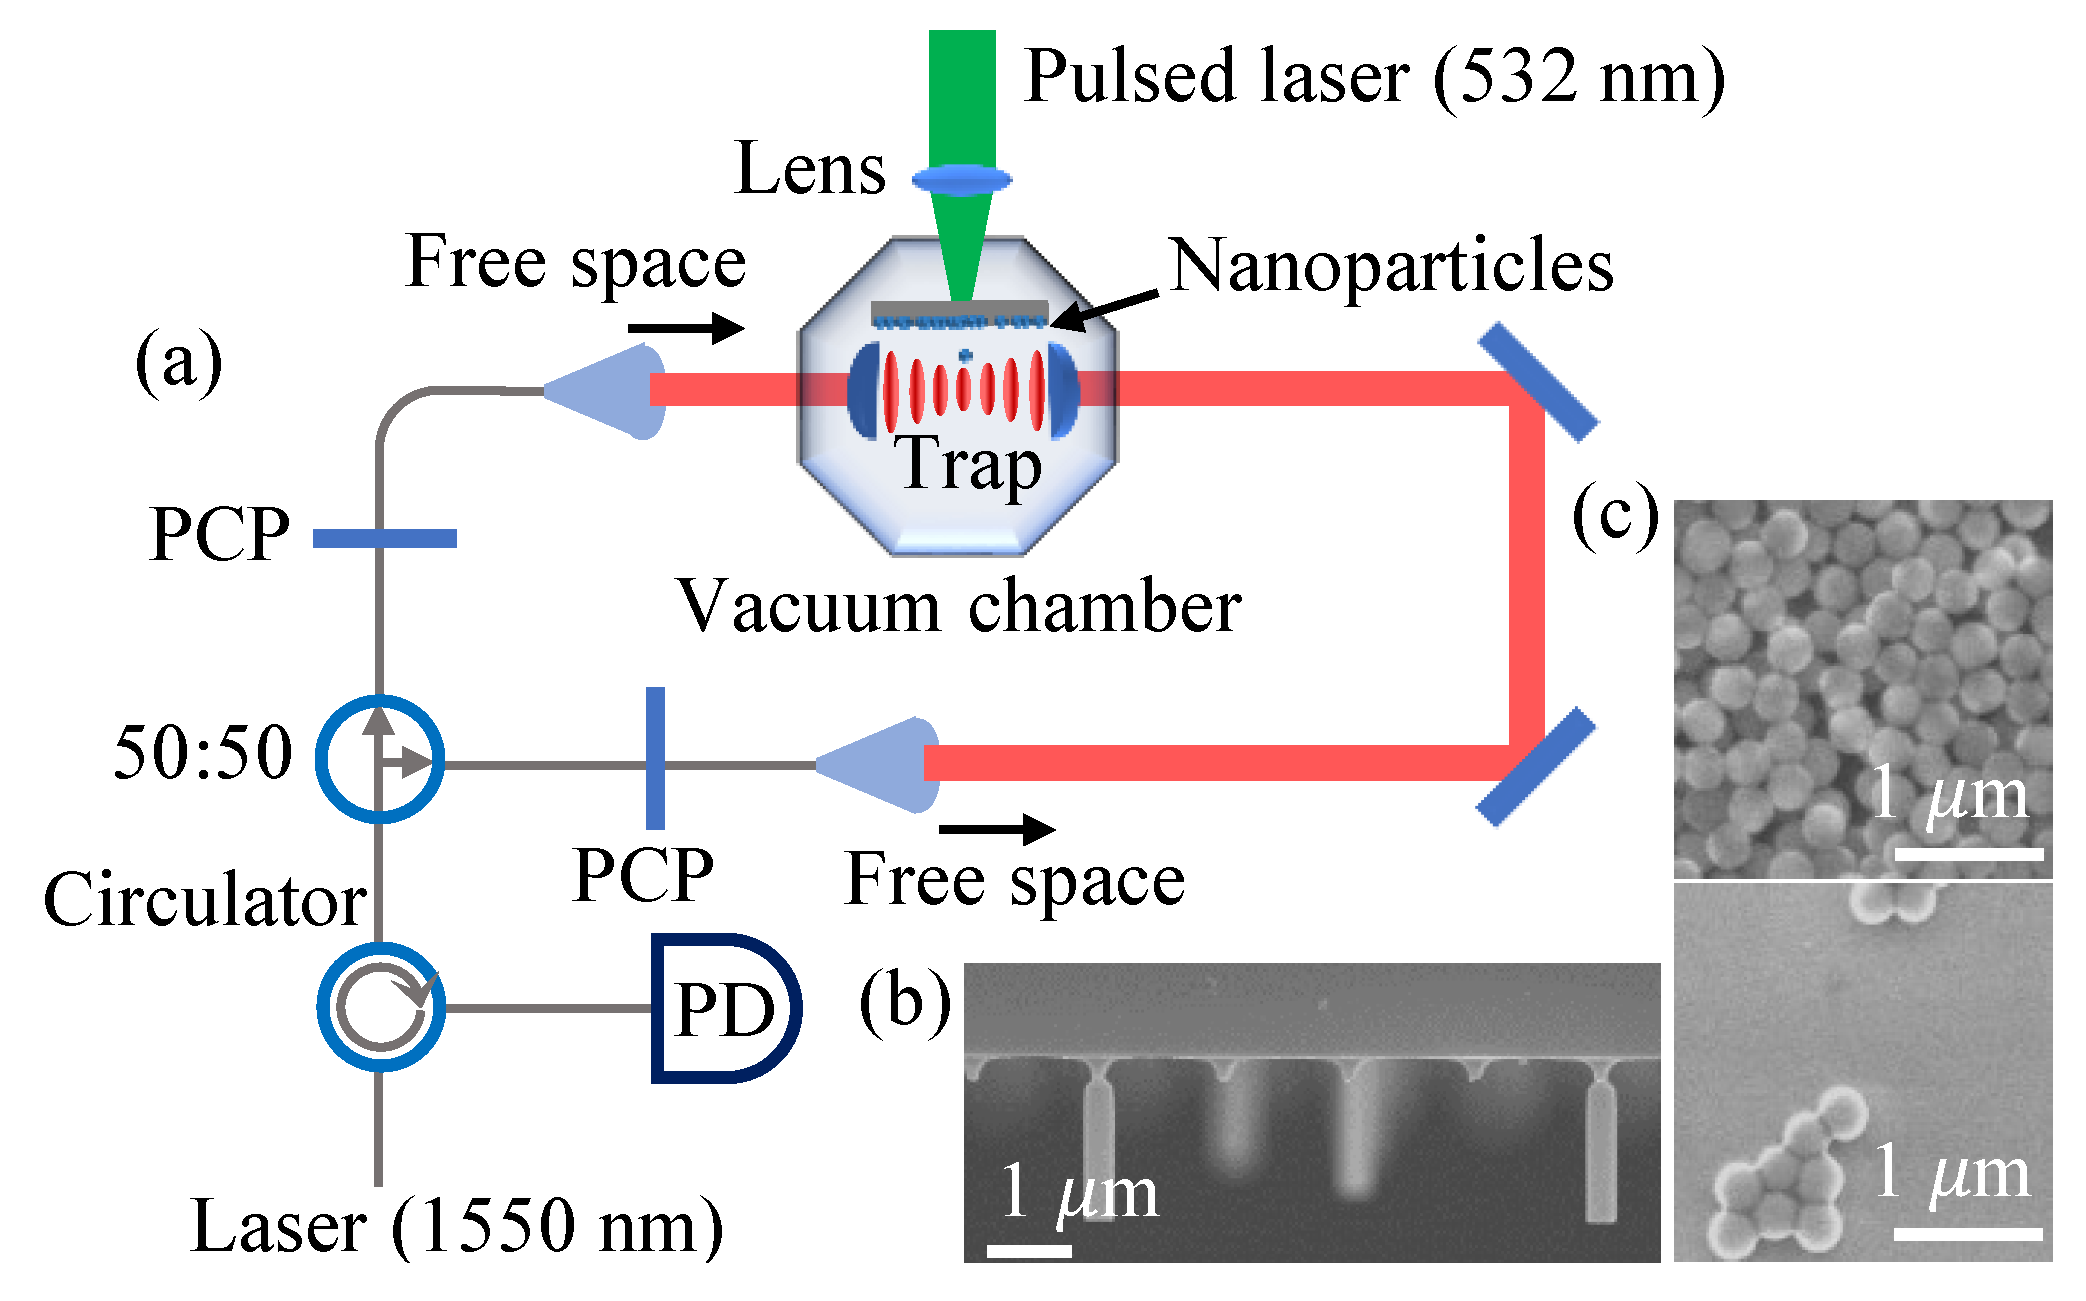
In this work, we use Laser-Induced Acoustic Desorption (LIAD), a dry and vacuum compatible method for loading nanoparticles into optical traps. In the LIAD method, a pulsed laser beam is focused onto the back side of a substrate upon which particles are distributed or grown. The pulse generates acoustic shock-waves through thermo-mechanical stress to locally eject particles from the substrate.
LIAD has been used for launching biological cells [
14], strands of DNA [
15] and silicon nanoparticles [
16]. This method can overcome the Van der Walls force between the particles coated onto a surface, and can also launch 3D etched silicon nanoparticles directly from their silicon substrate [
17]. The particles are only ejected from the region of the laser focus, allowing selective and efficient launching, and LIAD works for dielectric particles from <100 nm up to several micrometres at pressures down to 1 mbar.
Here, we will characterize the LIAD method as a technique for loading nanoparticles into an optical trap, presenting an efficient, flexible, clean and vacuum-compatible tool for the field of levitated optomechanics.
2. Experimental Method
In this manuscript, we will describe and characterize a method for launching commercial silica nanospheres from a substrate, since these are widely used by researchers. We note that we also use this method to launch nanofabricated silicon nanorods [
17] (supplied by Kelvin Nanotechnology, length: 950 nm, diameter 200 nm, grown with a separation of
m, with an underetched breaking-point, following the work presented in [
18]), where it is possible to launch individual nanoparticles, as illustrated in
Figure 1b.
One mg of silica nanospheres (non-functionalized dry silica supplied by Bangs Labs) with diameters of
nm are dispersed in 2 mL of isopropanol solution and sonicated in an ultrasonic bath for an hour to prevent aggregation. The dispersion of nanoparticles is pipetted onto a
cm
of aluminium sheet of thickness
m. A rigid aluminium sheet as a substrate has been shown to produce a lower mean launch velocity than aluminium foil, silicon wafer, or titanium foil [
17]. The sample was allowed to dry for several hours and was placed inside the vacuum chamber 8 mm above the optical trap, with the nanoparticles facing towards the trap, as shown in
Figure 1a.
Our optical trap is formed within the vacuum system by two counter-propagating focused laser beams (NKT Photonics Koheras AdjustiK seed laser with BoostiK E15 amplifier) with a wavelength of
nm, where each beam possesses an identical polarization. The trapping light is back-coupled through the optical system, and separated by a circulator onto a photodiode (
Figure 1a). This signal is maximized to ensure optimal alignment of the trapping beams and provides a read-out of the trapped nanoparticle motion.
We focus a pulsed laser beam (Litron Lasers NANO-S 120-20) onto the backside of the aluminium substrate to create an acoustic shock, causing release of the nanoparticles via LIAD. The pulsed laser has a wavelength of 532 nm, a pulse length of ∼4.6 ns, and we typically operate it in single-shot mode with a peak intensity of 588 GW/cm. The waist of the laser focus on the backside of the substrate is ∼17 m.
From the front side of the substrate, the nanoparticles are launched towards the optical trap, well directed along the Poynting vector of the pulsed laser. Careful alignment of the launch laser relative to the optical trap center is vital. We achieve this by ensuring the launch laser propagates normal to the optical bench. The optical trap is well centered in the vacuum system, and thus alignment of the launch laser through the center of the top viewport is sufficient to ensure good overlap. Due to the intensity profile of the focused launch laser beam, the launch area is typically smaller than the area described by the beam waist.
Figure 1c shows a scanning electron micrograph (SEM) of a substrate coated by nanospheres before and after launch.
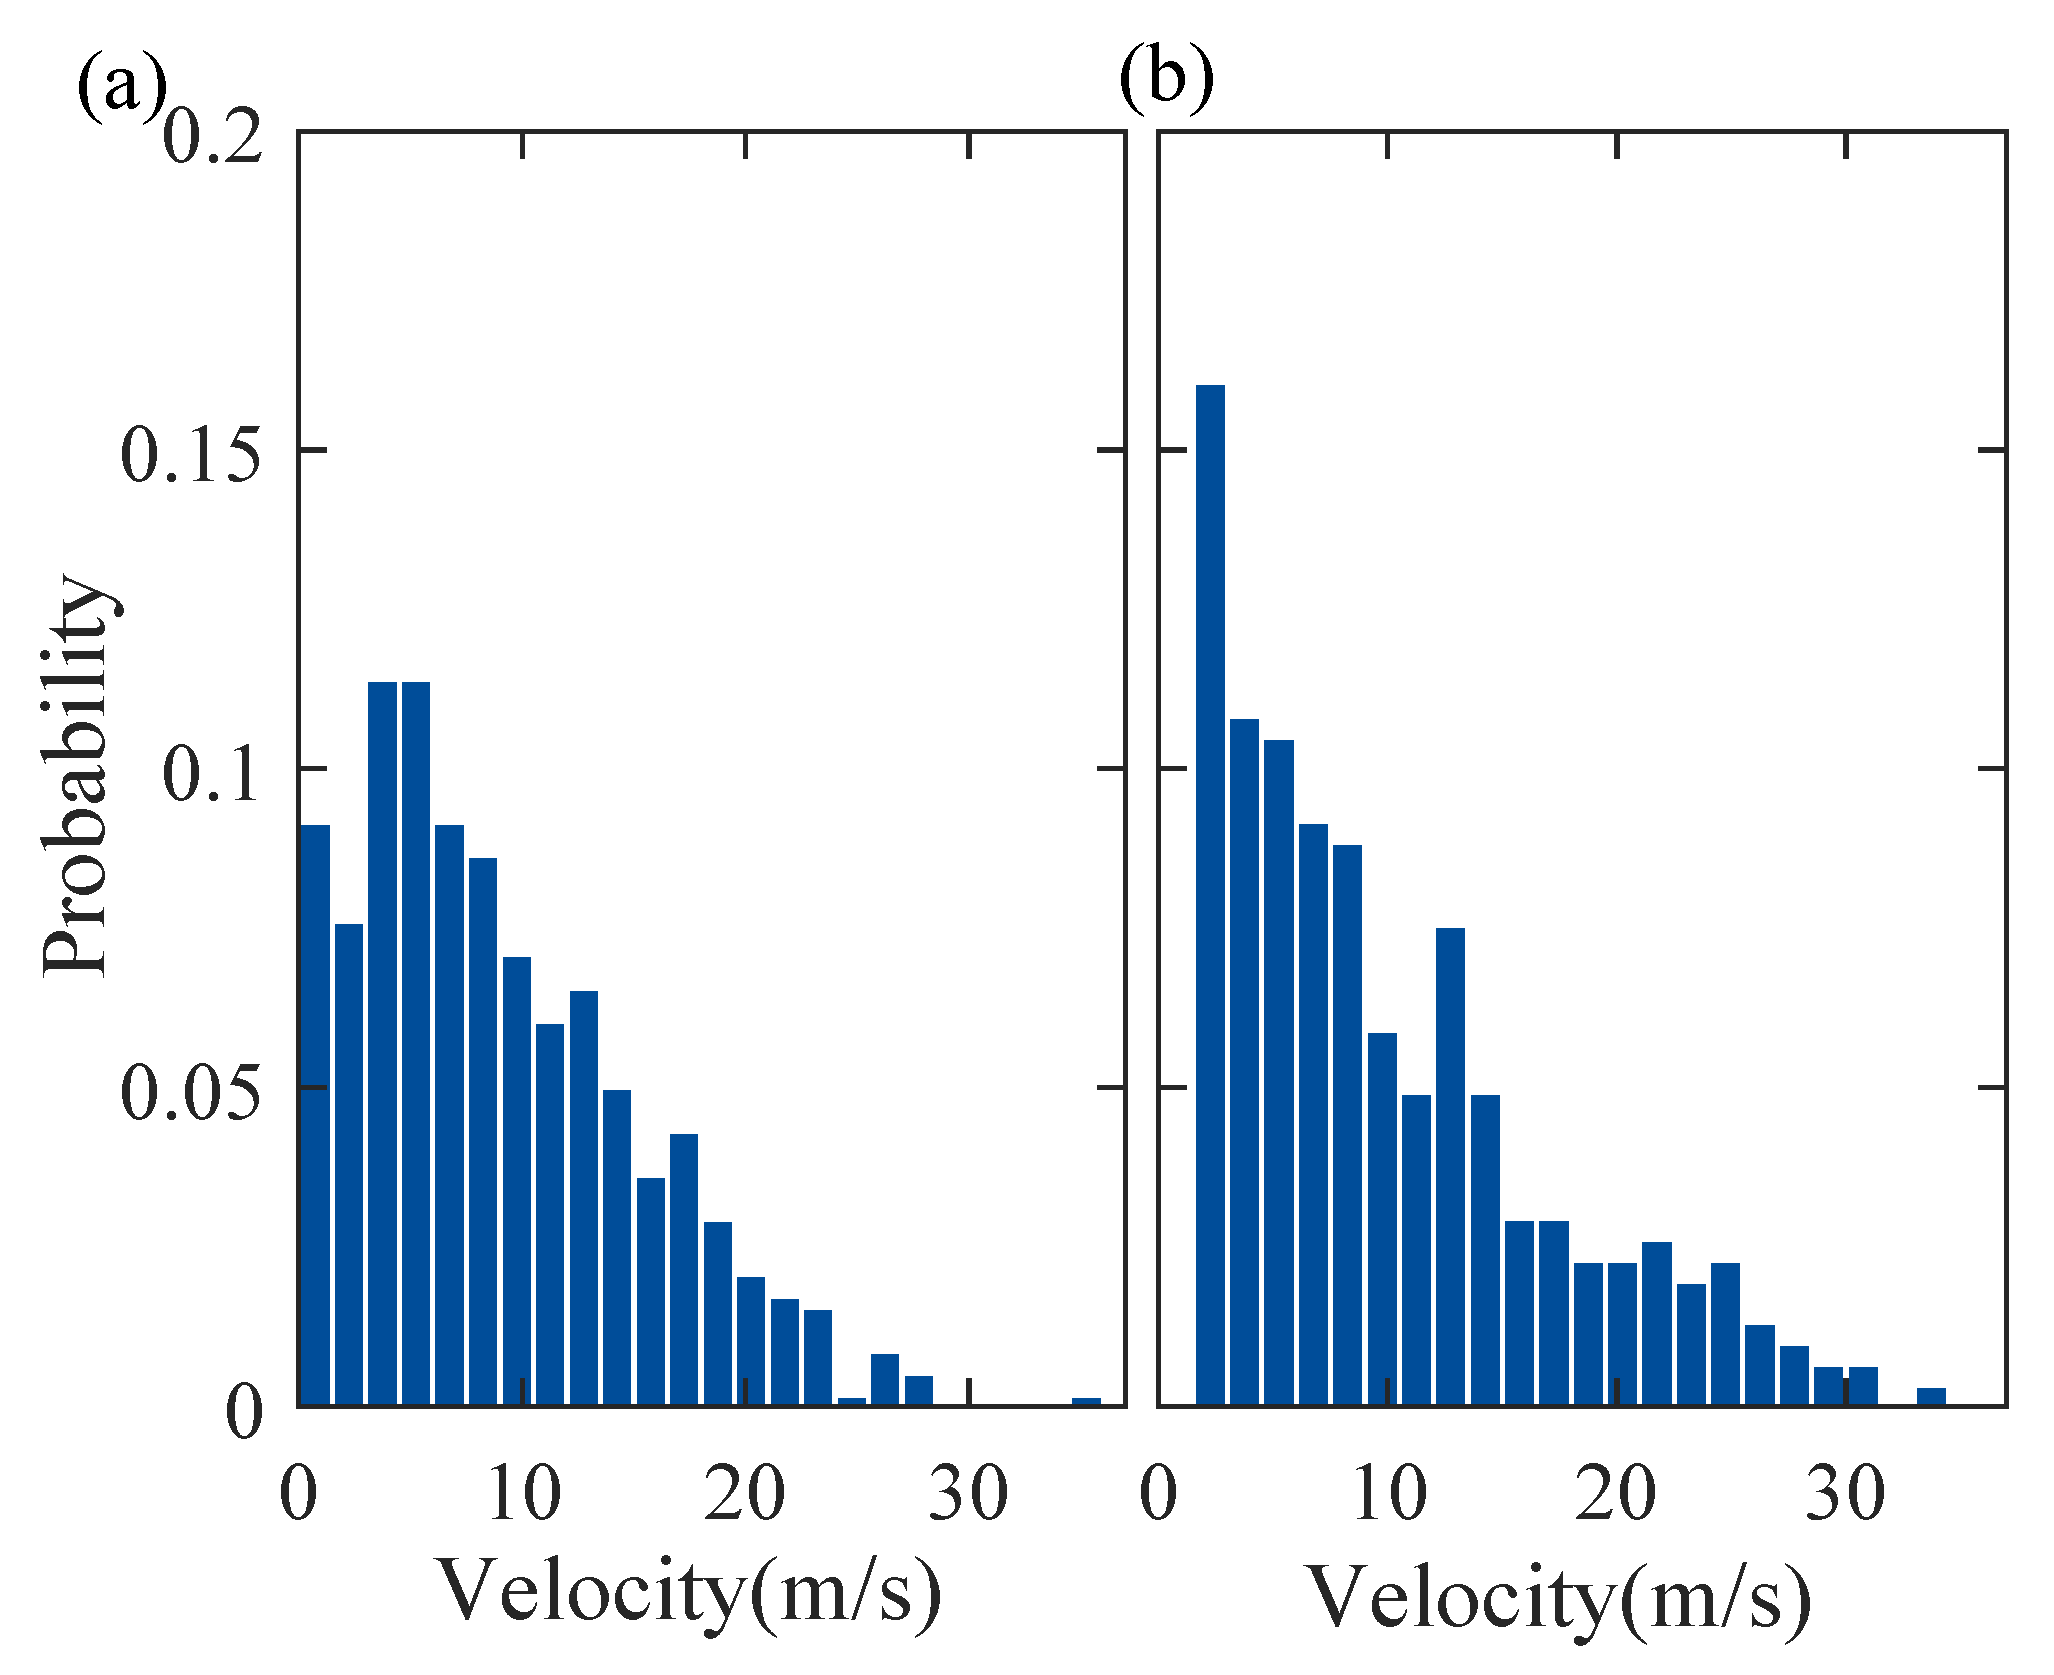
2.1. Velocity Distribution
We briefly present the velocity distribution of the launched particles, which is analyzed in more detail in [
17]. In that previous work, it was found that the velocity distribution is independent of the pulsed laser intensity, and we will not consider the physical mechanism of LIAD further in this manuscript.
To study the velocity distribution of nanospheres in our experiment, the particles are launched using laser pulses with a peak intensity of 588 GW/cm
, and their arrival time at the optical trap is recorded, as presented in
Figure 2. Gravity plays an insignificant role over the observed timescales.
Due to the finite transit-time of the particles from launch until observation, the gas pressure plays a significant role in determining the velocity distribution at the optical trap. By working at a low pressure of
mbar (where it is not possible to directly load the trap) the mean-free-path of the nanoparticle between collisions with gas molecules is much longer than the transit path. Hence, the velocity distribution at the optical trap, as presented in
Figure 2a, can be considered an accurate representation of the initial launch velocity distribution.
At a higher pressure of 0.12 mbar, the nanoparticles will go through thousands of collisions before reaching the trap region. This lowers the mean velocity, as presented in
Figure 2b and removes the slowest particles as they diffuse and never reach the optical trap.
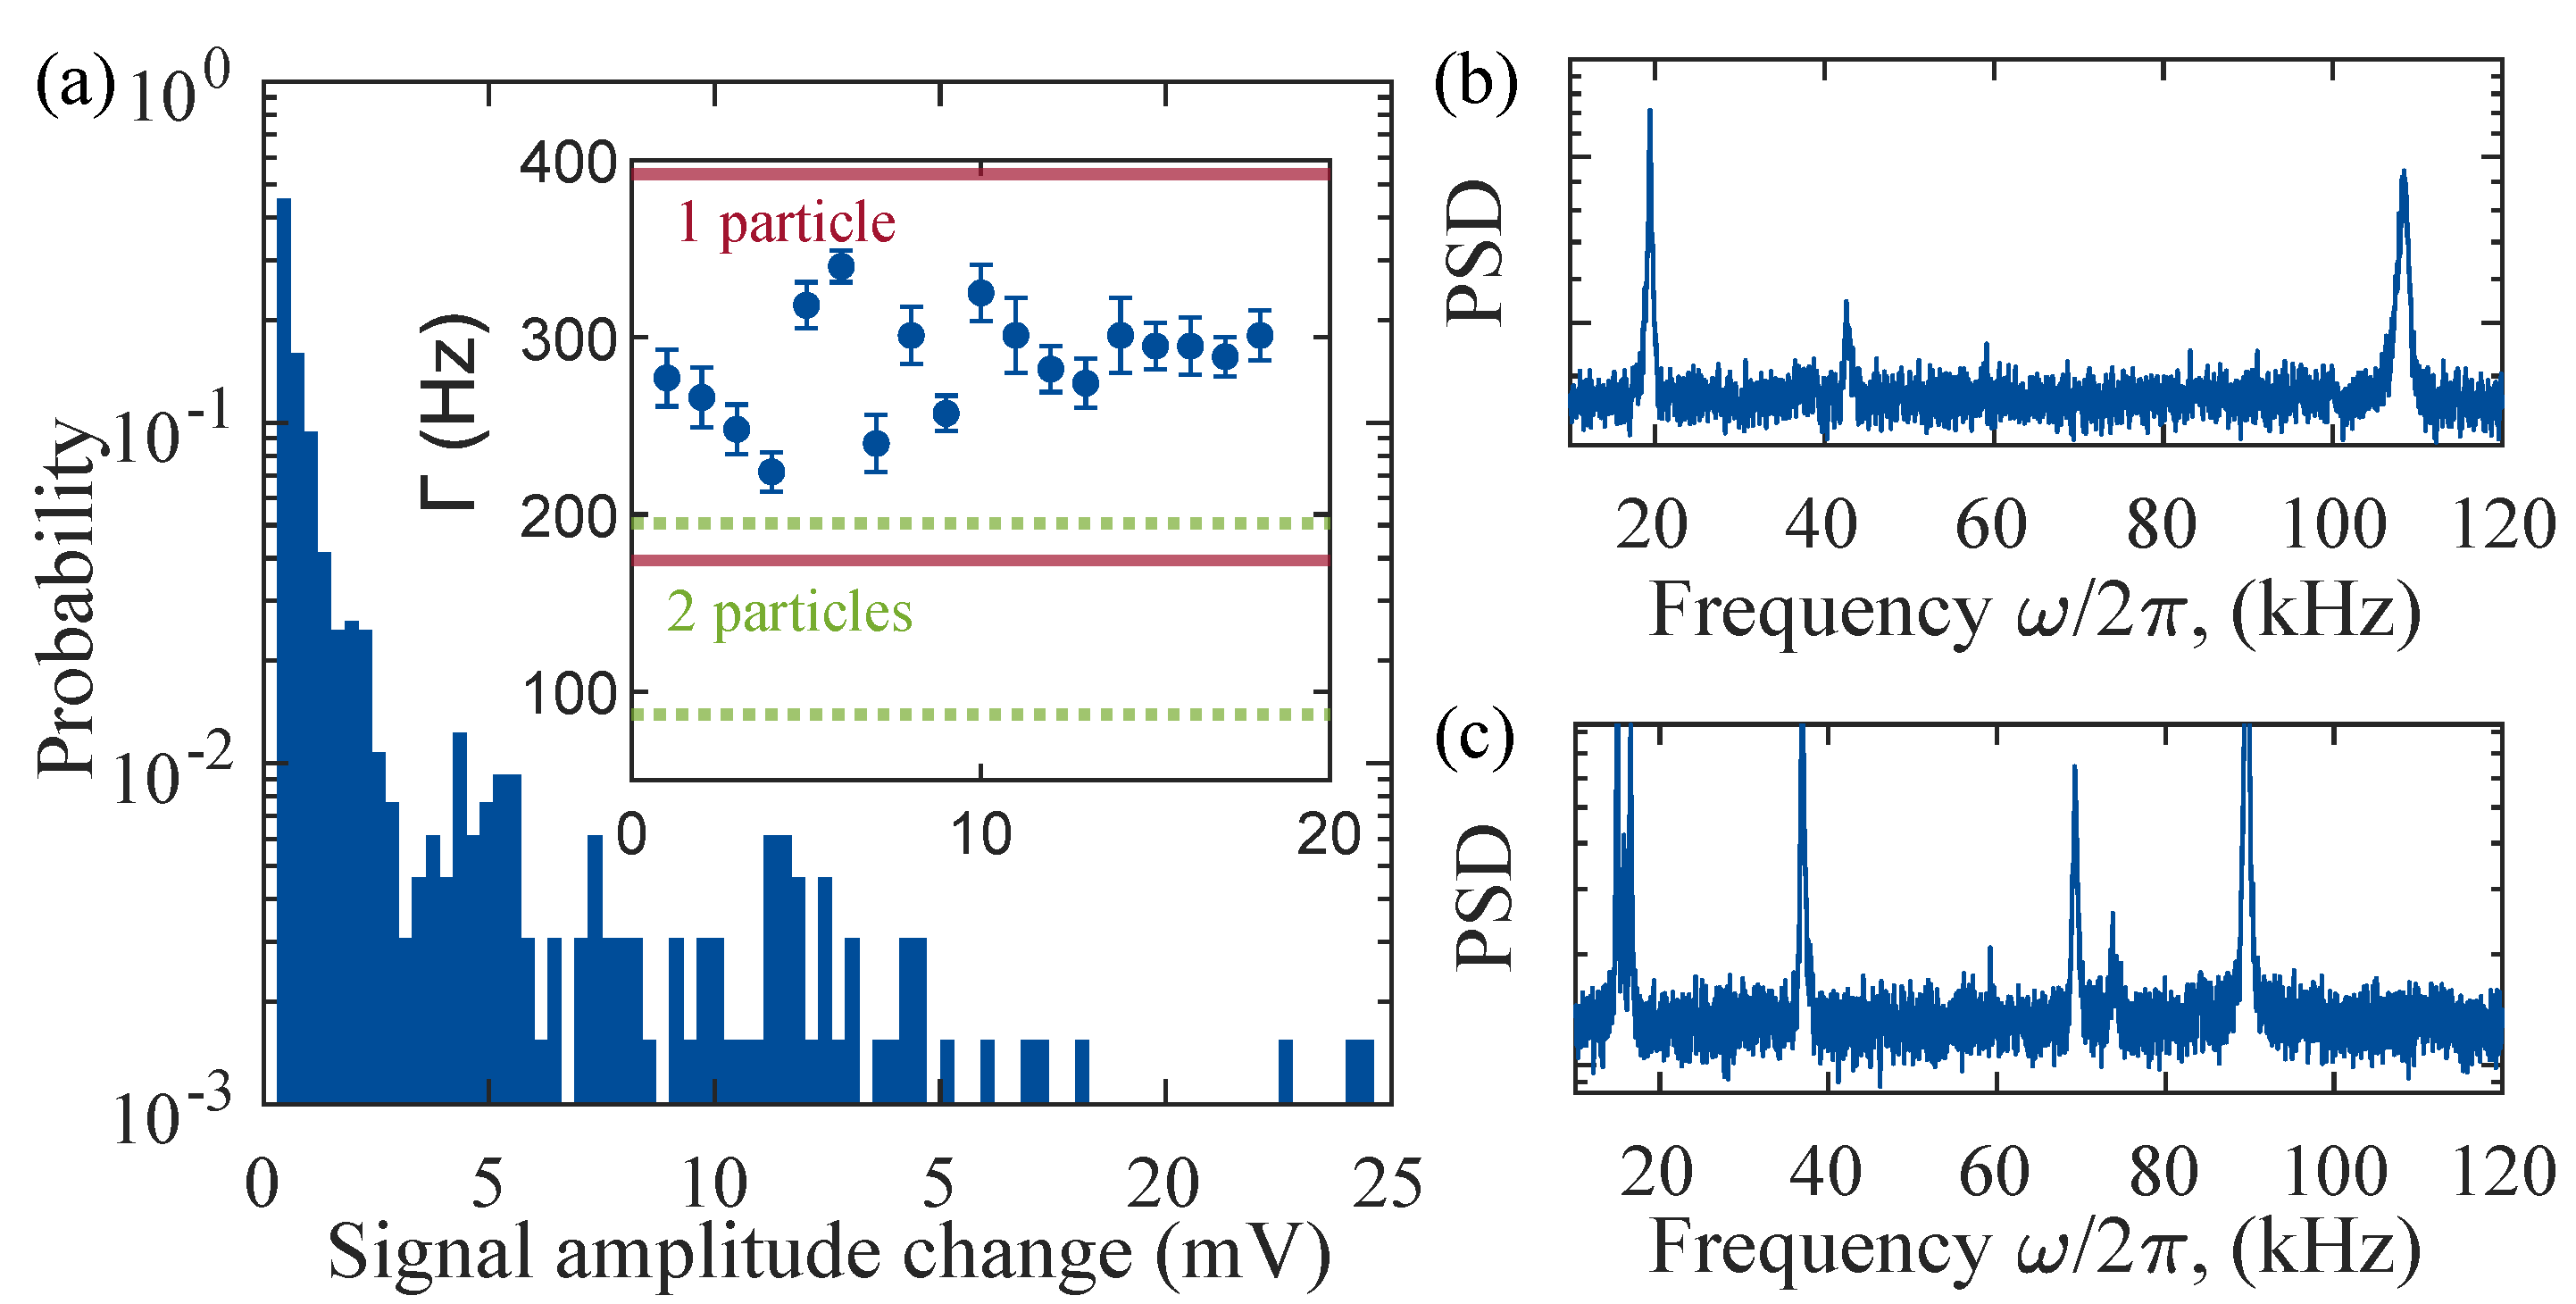
2.2. Identifying Trapping Events
In most applications, it is required to trap a single nanoparticle, and, in this manuscript, we describe the optimal conditions for achieving this. There are three categories of possible trapping events: single particle trapping, single cluster trapping and multiple separated particle or cluster trapping. Trapping events cause a change in our detected signal amplitude due to light scattering, and particle motion can be subsequently tracked.
Figure 3a shows a histogram of the signal amplitude change in response to a trapping event, reconstructed from over 800 events. We observe a peak corresponding to trapping single particles and a long tail corresponding to clusters or multiple particles. The width of the single-particle peak is due to the variability in exact trapping location within the optical standing wave; hence, we do not sharply and distinctly resolve integer numbers of trapped particles.
The signal can be analyzed to reconstruct the power spectral density (PSD) of trapped particle motion (as shown in
Figure 3b) yielding frequencies corresponding to center-of-mass motion. Trapping multiple particles yields a more complex PSD, as shown in
Figure 3c. The PSD of the motion of a single particle looks very similar to the one obtained by a cluster (
Figure 3b). To identify trapping events corresponding to single trapped particles from clusters, we extract the center-of-mass momentum damping rates,
[
19]. The damping rate depends on the pressure and the size of the particle.
We randomly analyzed experiments with the signal amplitude change that we attribute to a single particle at the pressure of 1 mbar and extracted the damping rate, as shown as the inset of
Figure 3a. These values are in good agreement with the theoretical predictions. There is very large uncertainty on the theoretical predictions that arise from the uncertainty in the pressure measurement (20%) and the particle size (10%). We do not aim to carefully distinguish single particles in this study, though this could be verified using the methods proposed by Li et al. [
20].
3. Results
We used LIAD to load nanoparticles directly into an optical trap at various pressures. Interactions between the nanoparticles and residual gas were required to provide the dissipative mechanism to load the conservative optical trap. However, unlike previously mentioned nebulization techniques, our loading method does not over-rely on the diffusion of nanoparticles into the trapping region, as they are directed by the LIAD mechanism, dramatically increasing the efficiency of trap loading.
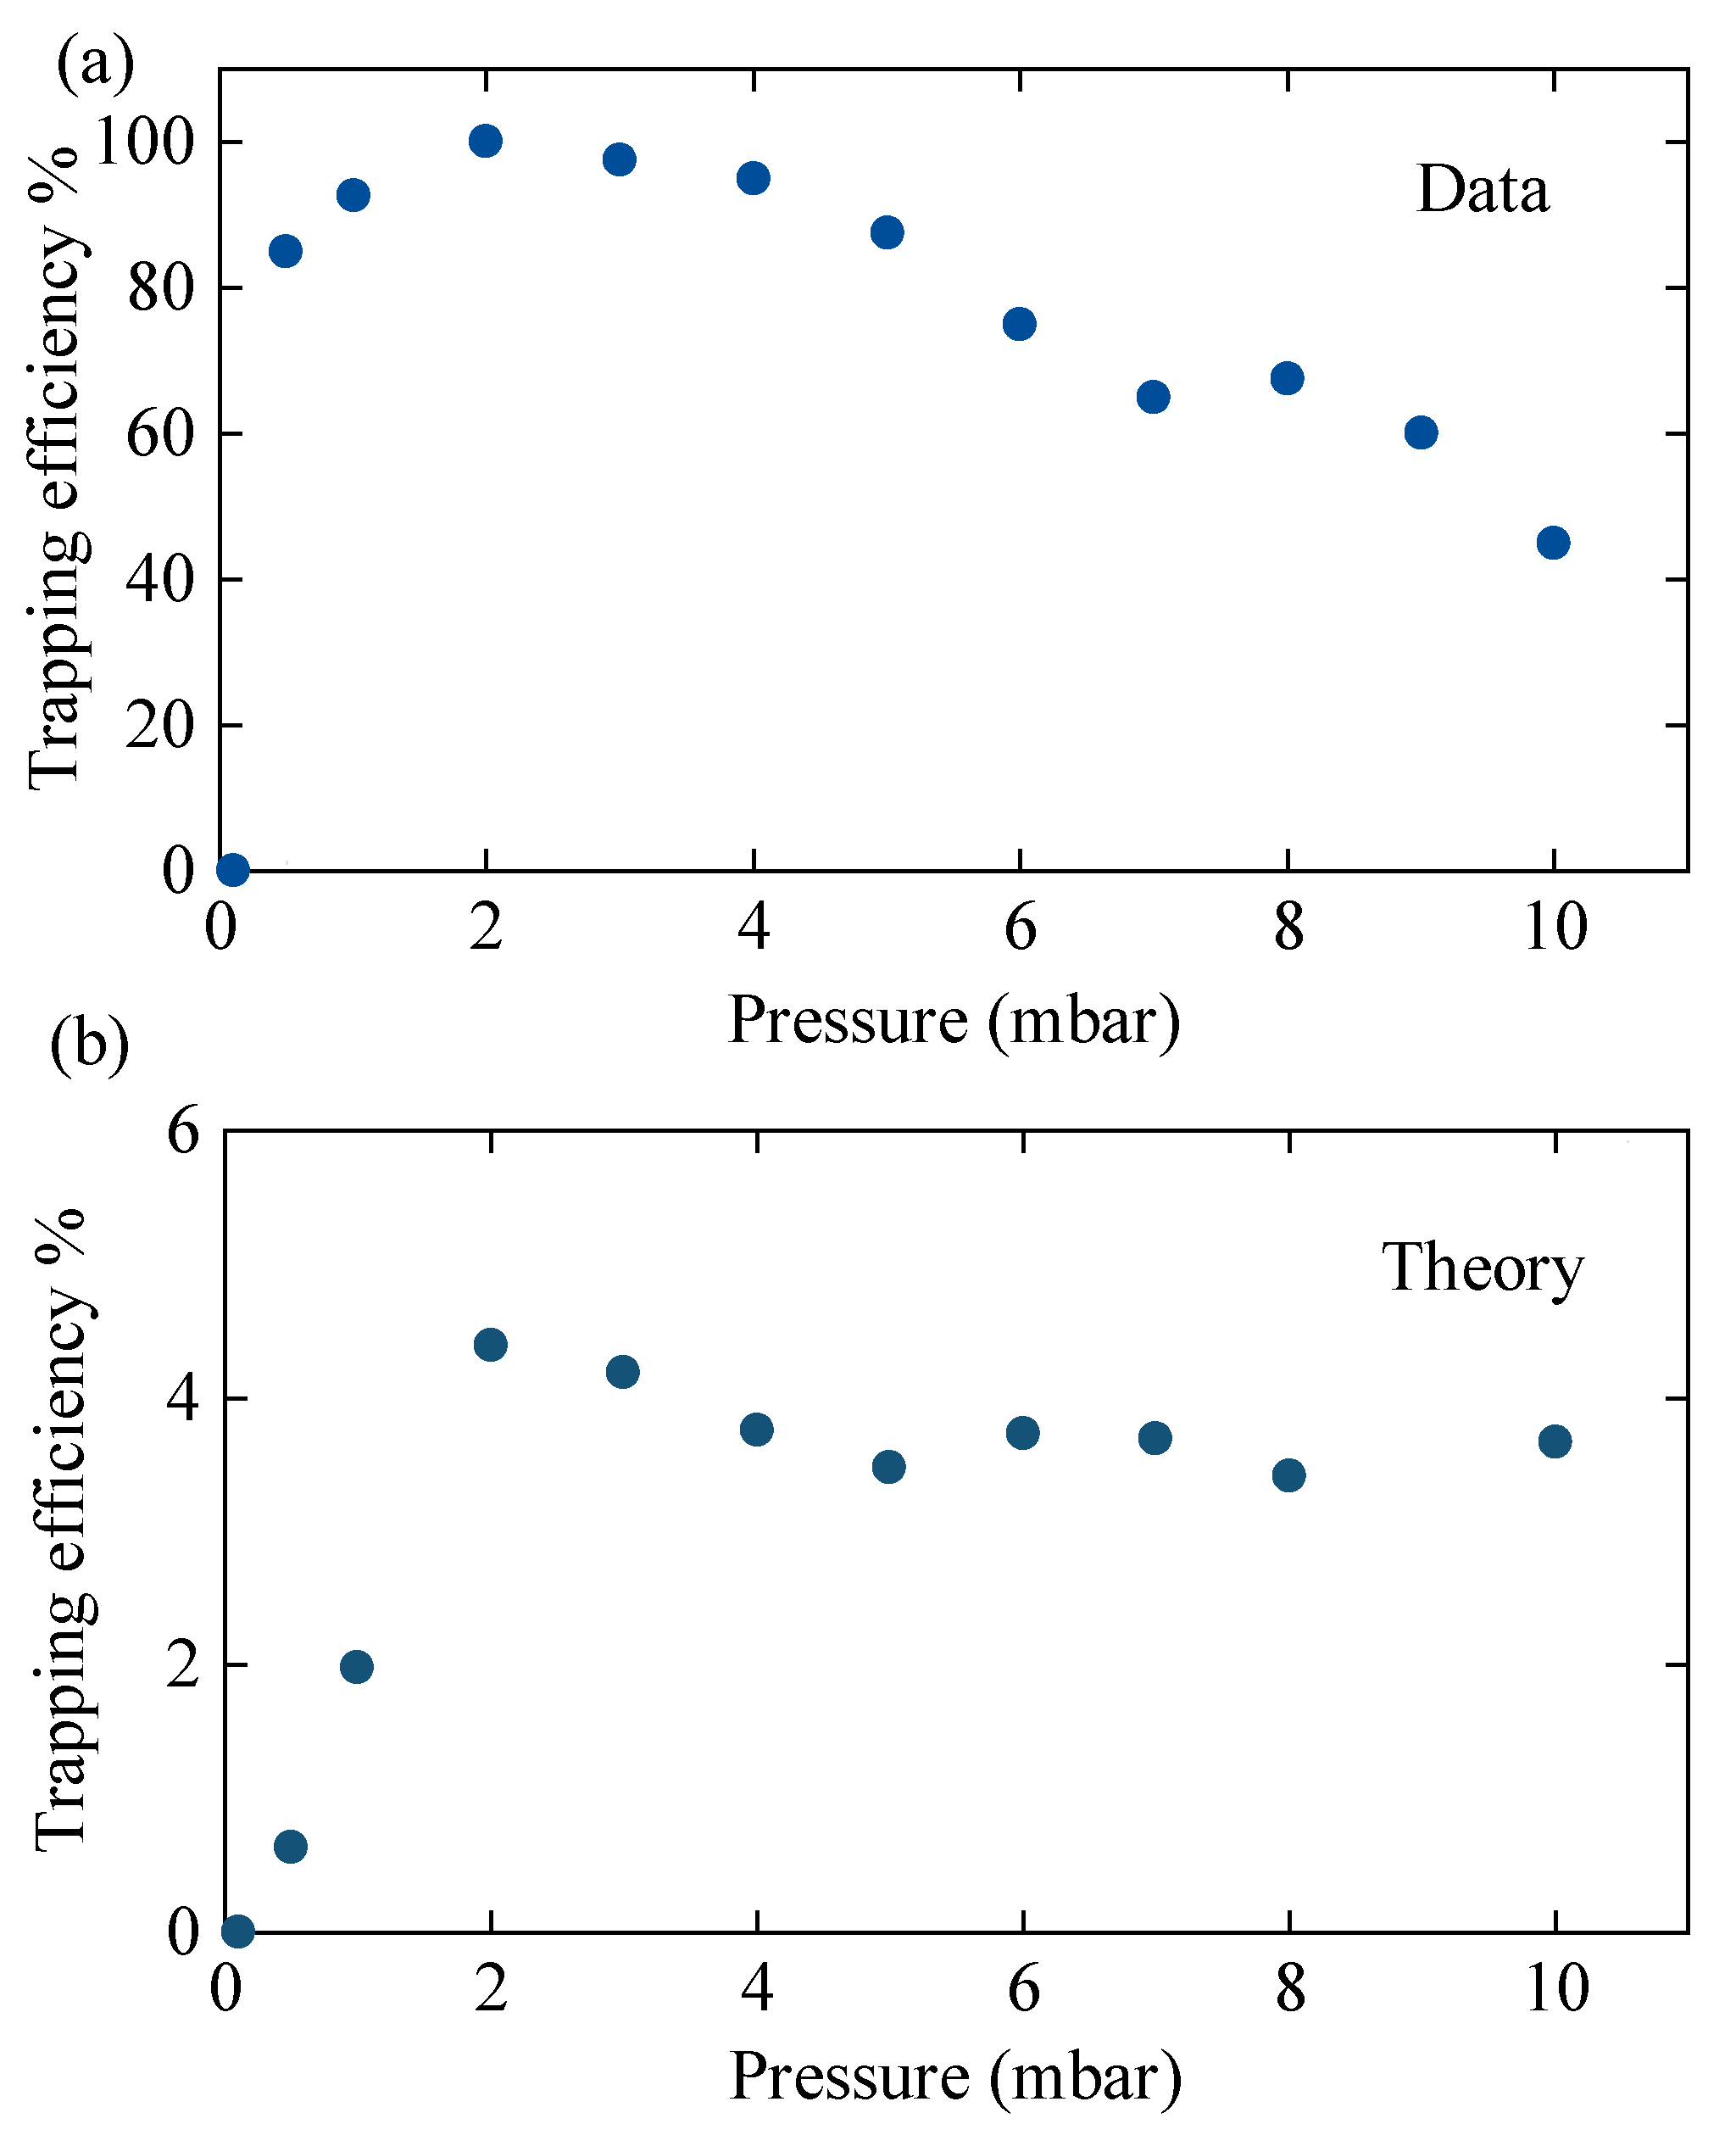
3.1. Trapping Efficiency with Pressure
We find that our trap loading technique is highly efficient across a wide range of pressures, as shown in
Figure 4a. Once particles are released from the substrate via LIAD, they travel towards the trap region in a direction defined by the Poynting vector of the launch laser, continuously losing energy through collisions with gas molecules. Eventually, they slow to their terminal velocity, at which point they fall under gravity and diffuse. The equation describing the vertical position of the particles, neglecting diffusion, is:
where
is the momentum damping rate (see [
3] for definitions),
g is the acceleration due to gravity, and
u is the initial velocity, which, in our case, is negative and defined by the distribution in
Figure 2a. The mean-square-displacement of the particle in any one dimension due to diffusion is
, where
T is the ambient gas temperature, and
M is the mass of the nanosphere [
3]. For guidance on the stochastic simulation of particle motion, see, for example, [
21].
By constructing a stochastic simulation of a particle launched toward an optical potential, we model the efficiency of our trap loading process, as shown in
Figure 4b. If the pressure is too low, then the particles pass through the trap region without slowing and are not trapped, leading to a pressure threshold in terms of the minimum trapping pressure. Above this pressure, particles reach the trapping region by diffusion, and the trapping probability levels off. Under these conditions, the particles may take many hundreds of seconds to be trapped.
We compare our simulation to the experimental data shown in
Figure 4a. Experimentally, the trapping efficiency decreases with increasing pressure, which we believe is due to experimental runs being terminated too early, before the hundreds of seconds it can take for trapping to occur. The overall trapping efficiency in the experiments is much higher than in the simulation. This is because, experimentally, multiple particles are launched at the same time increasing the probability of a trapping event occurring. Including the velocity distribution in the directions orthogonal to gravity, which we have not measured, would further improve the accuracy of the simulation.
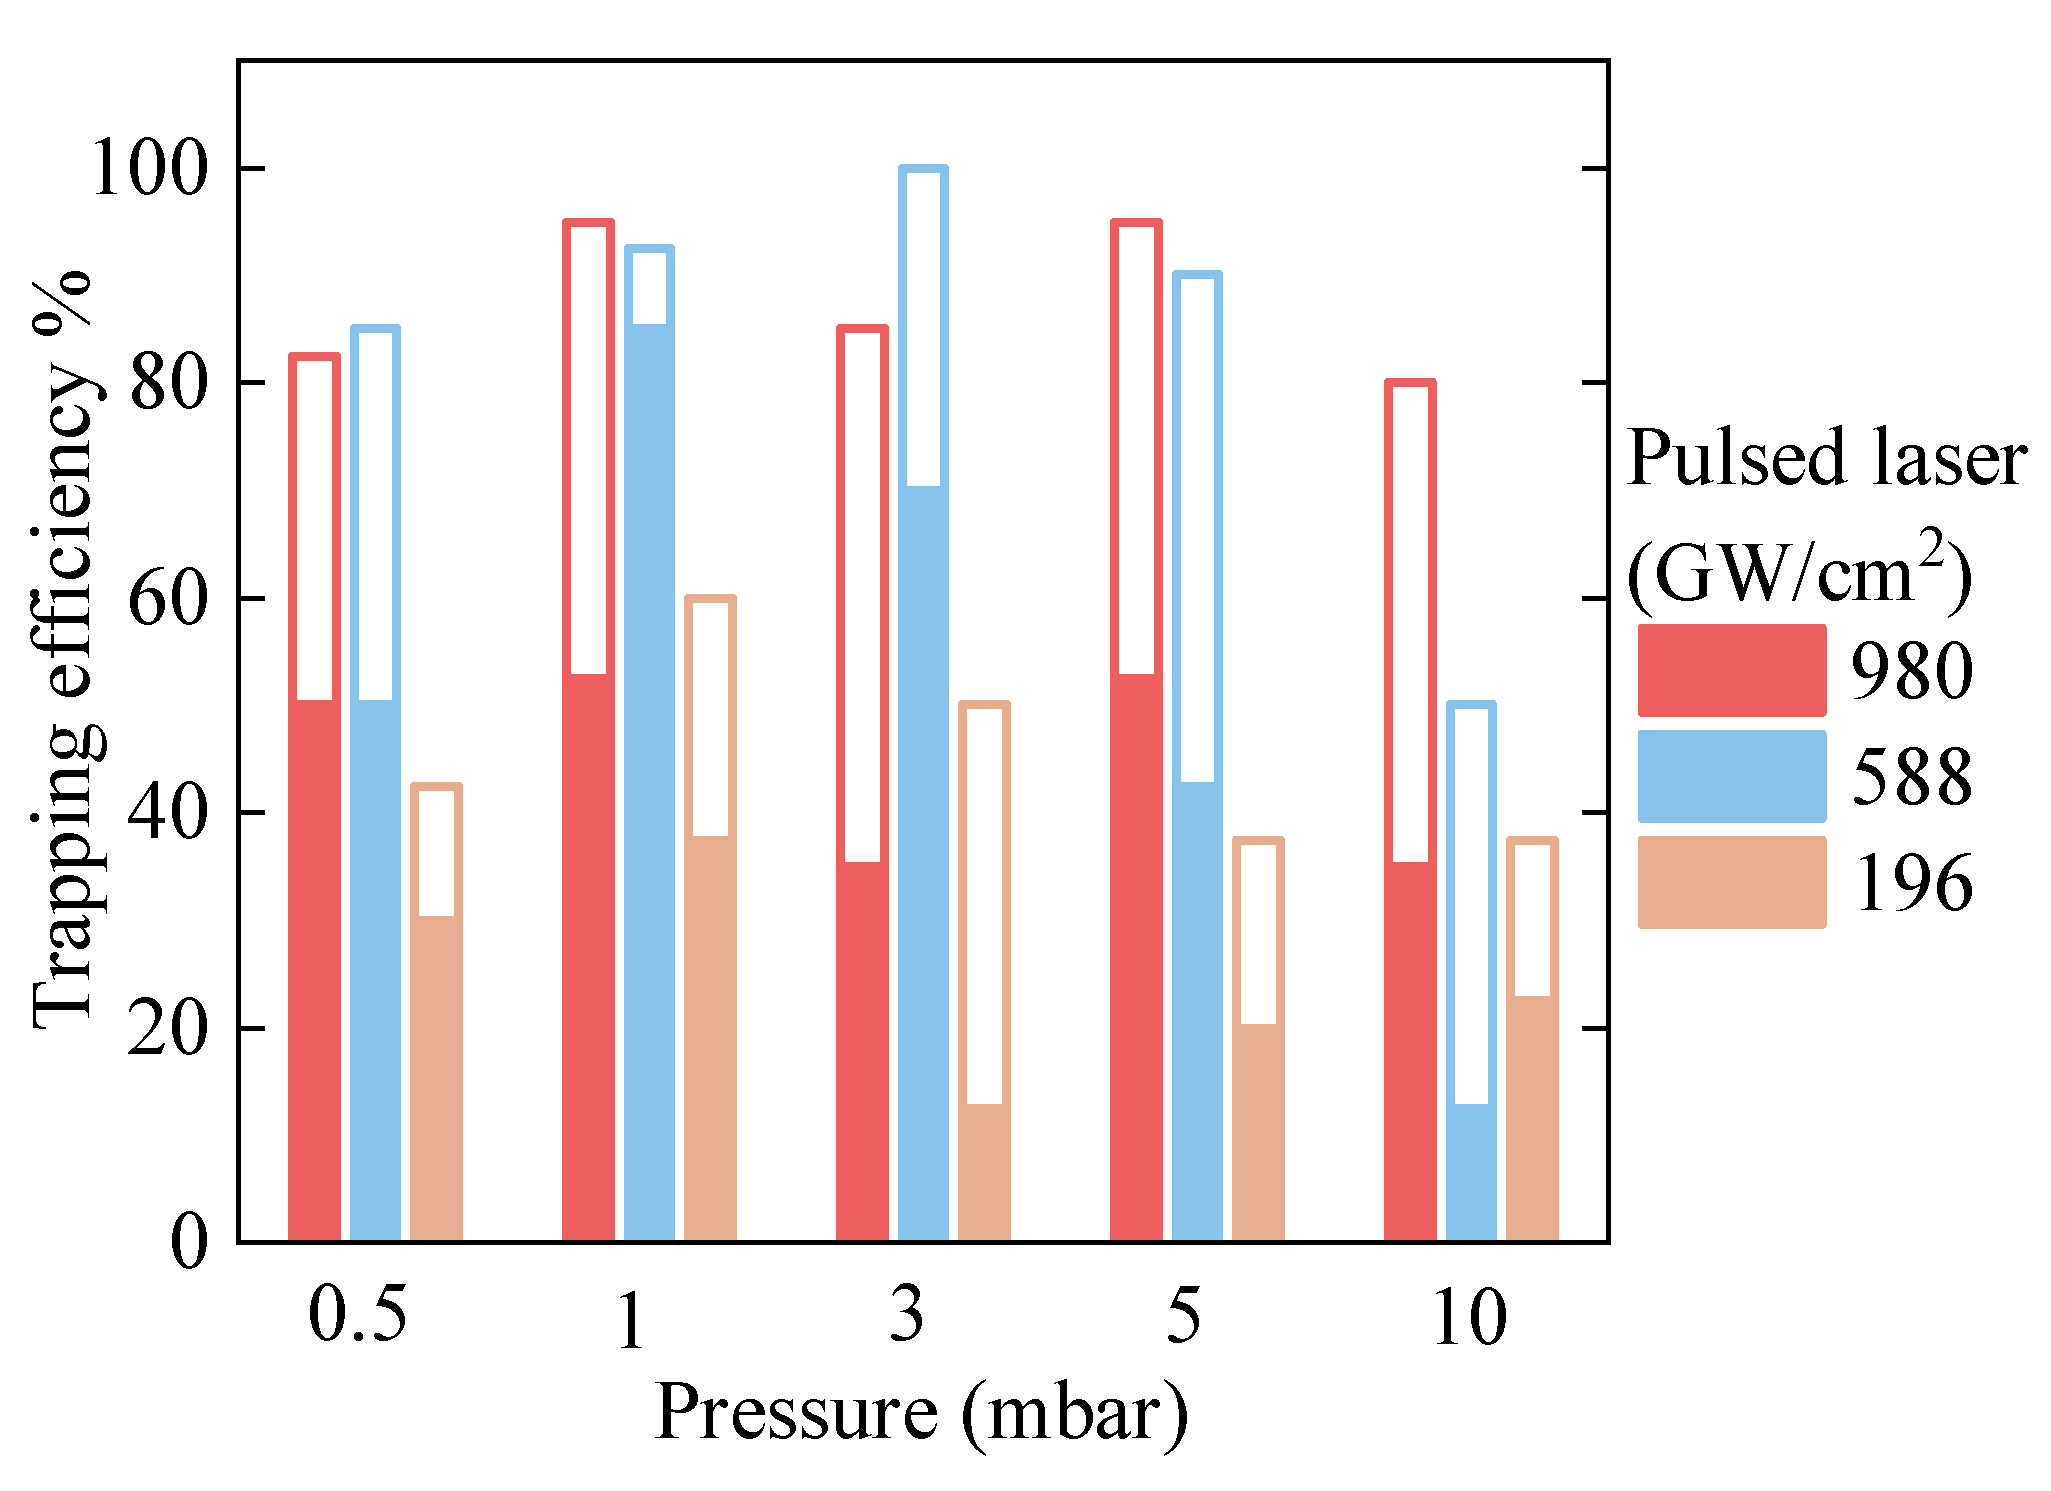
3.2. Launch Laser Intensity
The effect of the launch laser intensity on the LIAD process is complex and, surprisingly, does not significantly alter the launch velocity above a minimum threshold, as discussed elsewhere [
17]. However, the launch laser intensity strongly effects the number of particles launched per shot and the effective area from which the particles are launched.
These points are illustrated in
Figure 5. Each color represents a different launch laser intensity. When the intensity is low, the trapping efficiency drops as fewer particles are removed from the substrate. The solid bars in the histogram represent single particle trapping events, and the empty bars represent trapping of clusters or multiple particles. At higher launch laser intensities, we see that the overall trapping probability is not significantly increased, but the chance of trapping multiple particles increases.
3.3. Optical Trap Depth
The optical trap is formed by two counter-propagating tightly focused laser beams, as described above. We choose a counter-propagating trap over a single-beam trap to create a larger trapping volume to maximize the likelihood of trapping a particle. We show the effect of optical trap power in
Figure 6. The optical trap must be at least deep enough to confine a particle in thermal equilibrium with the environment, and realistically it must be significantly deeper due to thermal fluctuations. This yields a lower threshold for the trap power required to capture a particle. In our experiment, we were able to trap with optical powers as low as
mW. It is easier to trap at low powers at higher pressures, due to the additional dissipation provided by the gas.
We also observe that the trapping efficiency dropped at high optical trap power, which we attribute to particle heating as a result of the absorption of trap light by impurities in the material, which is further supported by the increased stability at higher pressures, where residual gas can cool the particles through collision [
22]. Another reason for the reduced trapping efficiency could be heating by the laser phase noise at high powers [
23].
4. Conclusions
We presented a clean, dry and efficient method for loading nanoparticles into optical traps, using Laser Induced Acoustic Desorption (LIAD). We found that there is an optimum pressure at which the traps can be loaded, which will depend on the size of particle and the distance between the sample and the trap. The optimum spacing between the sample and the trap, in terms of loading efficiency for a given pressure, will depend on the exact initial velocity distribution and the size of the launched particle. Unless the exact loading pressure is critical, any separation below 10 mm will be adequate for efficient loading.
We found that, by tuning the launch laser intensity, we could enhance the probability of trapping single particles. Around the optimum pressure, the particle motion was near ballistic, and trapping occurred in a few milliseconds, and, at higher pressures, particles diffused into the trapping region. We are also able to launch particles from localized regions of a sample, thus, enabling the launch and trapping of sparse particles.
We note that Bykov et al. [
24] developed a technique combining LIAD and the temporal control of a Paul trap potential to launch and capture charged nanoparticles directly under ultrahigh vacuum (UHV) conditions. This technique does not require a dissipation mechanism, since the potential is turned-on when the particle is at the center of the trap, at which point, it does not have enough energy to escape. However, since, in general, optical potentials are much less deep than those in a Paul trap, direct UHV loading into an optical trap would only work for nanoparticles with velocities
ms
, requiring the development of new soft-launching techniques.
Author Contributions
J.M. conceived the experiment. Data was acquired by M.N., Y.H. and J.A.S., and analyzed by M.N. and Y.H. All authors contributed to the writing of the manuscript. All authors have read and agreed to the published version of the manuscript.
Funding
This research was funded by H2020 European Research Council grant agreements Nos. 803277 and 957463.
Institutional Review Board Statement
Not applicable.
Informed Consent Statement
Not applicable.
Data Availability Statement
Not applicable.
Acknowledgments
The authors would like to thank Ben Blackburn at the King’s College London Physics Research Facility for their assistance with SEM imaging. J.M. acknowledges P. Asenbaum, S. Kuhn and M. Arndt at the University of Vienna for the initial conception of the LIAD technique for launching nanoparticles.
Conflicts of Interest
The authors declare no conflict of interest.
References
- Millen, J.; Monteiro, T.S.; Pettit, R.; Vamivakas, A.N. Optomechanics with levitated particles. Rep. Prog. Phys. 2020, 83, 026401. [Google Scholar] [CrossRef] [PubMed] [Green Version]
- Millen, J.; Stickler, B.A. Quantum experiments with microscale particles. Contemp. Phys. 2020, 61, 155–168. [Google Scholar] [CrossRef]
- Millen, J.; Gieseler, J. Single particle thermodynamics with levitated nanoparticles in thermodynamics. In The Quantum Regime. Fundamental Theories of Physics; Springer: Cham, Switzerland, 2018; Volume 195, pp. 853–885. [Google Scholar]
- Ranjit, G.; Cunningham, M.; Casey, K.; Geraci, A.A. Zeptonewton force sensing with nanospheres in an optical lattice. Phys. Rev. A 2016, 93, 053801. [Google Scholar] [CrossRef] [Green Version]
- Kuhn, S.; Stickler, B.; Kosloff, A.A.; Patolsky, F.; Hornberger, K.; Arndt, M.; Millen, J. Optically driven ultra-stable nanomechanical rotor. Nat. Commun. 2017, 8, 1670. [Google Scholar] [CrossRef] [Green Version]
- Ahn, J.; Xu, Z.; Bang, J.; Ju, P.; Gao, X.; Li, T. Ultrasensitive torque detection with an optically levitated nanorotor. Nat. Nanotechnol. 2020, 13, 89–93. [Google Scholar] [CrossRef] [Green Version]
- Aspelmeyer, M.; Kippenberg, T.J.; Marquardt, F. Cavity optomechanics. Rev. Mod. Phys. 2014, 86, 1391–1451. [Google Scholar] [CrossRef]
- Delić, U.; Reisenbauer, M.; Dare, K.; Grass, D.; Vuletić, V.; Kiesel, N.; Aspelmeyer, M. Cooling of a levitated nanoparticle to the motional quantum ground state. Science 2020, 367, 892–895. [Google Scholar] [CrossRef] [Green Version]
- Summers, M.D.; Burnham, D.R.; McGloin, D. Trapping solid aerosols with optical tweezers: A comparison between gas and liquid phase optical traps. Opt. Express 2008, 16, 7739–7747. [Google Scholar] [CrossRef]
- Delić, U. Cavity cooling by coherent scattering of a levitated nanosphere in vacuum. Ph.D. Dissertation, Department of Physics, University of Vienna, Vienna, Austria, 2019. [Google Scholar]
- Ashkin, A.; Dziedzic, J.M. Optical levitation by radiation pressure. Appl. Phys. Lett. 1971, 19, 283–285. [Google Scholar] [CrossRef]
- Arita, Y.; Mazilu, M.; Dholakia, K. Laser-induced rotation and cooling of a trapped microgyroscope in vacuum. Nat. Commun. 2013, 4, 2374. [Google Scholar] [CrossRef] [PubMed] [Green Version]
- Millen, J.; Fonseca, P.Z.G.; Mavrogordatos, T.; Monteiro, T.S.; Barker, P.F. Cavity cooling a single charged levitated nanosphere. Phys. Rev. Lett. 2015, 114, 123602. [Google Scholar] [CrossRef] [Green Version]
- Peng, W.; Lin, H.; Chu, M.; Chang, H.; Lin, H.; Yu, A.; Chen, C. Charge monitoring cell mass spectrometry. Angew. Chem. Int. Ed. 2007, 46, 3865–3869. [Google Scholar] [CrossRef]
- Bald, I.; Dabkowska, I.; Illenberger, E. Probing biomolecules by laser-induced acoustic desorption: Electrons at near zero electron volts trigger Sugar-Phosphate Cleavage. Angew. Chem. Int. Ed. 2008, 47, 8518–8520. [Google Scholar] [CrossRef]
- Asenbaum, P.; Kuhn, S.; Nimmrichter, S.; Sezer, U.; Arndt, M. Cavity cooling of free silicon nanoparticles in high vacuum. Nat. Commun. 2013, 4, 2743. [Google Scholar] [CrossRef] [Green Version]
- Millen, J.; Kuhn, S.; Patolsky, F.; Kosloff, A.; Arndt, M. Cooling and manipulation of nanoparticles in high vacuum. In Proceedings of the Optical Trapping and Optical Micromanipulation XIII, San Diego, CA, USA, 16 September 2016; 9922. [Google Scholar]
- Kuhn, S.; Asenbaum, P.; Kosloff, A.; Sclafani, M.; Stickler, B.A.; Nimmrichter, S.; Hornberger, K.; Cheshnovsky, O.; Patolsky, F.; Arndt, M. Cavity-assisted manipulation of freely rotating silicon nanorods in high vacuum. Nano Lett. 2015, 15, 5604–5608. [Google Scholar] [CrossRef] [PubMed] [Green Version]
- Gieseler, J.; Millen, J. Levitated nanoparticles for microscopic thermodynamics—A Review. Entropy 2018, 20, 326. [Google Scholar] [CrossRef] [PubMed] [Green Version]
- Li, C.; Jing, J.; Zhou, L.; Fu, Z.; Gao, X.; Li, N.; Chen, X.; Hu, H. Fast size estimation of single-levitated nanoparticles in a vacuum optomechanical system. Opt. Lett. 2021, 46, 4614–4617. [Google Scholar] [CrossRef] [PubMed]
- Volpe, G.; Volpe, G. Simulation of a Brownian particle in an optical trap. Am. J. Phys. 2013, 81, 224–230. [Google Scholar] [CrossRef] [Green Version]
- Millen, J.; Deesuwan, T.; Barker, P.; Anders, J. Nanoscale temperature measurements using non-equilibrium Brownian dynamics of a levitated nanosphere. Nat. Nanotechnol. 2014, 9, 425–429. [Google Scholar] [CrossRef] [PubMed] [Green Version]
- Kamba, M.; Kiuchi, H.; Yotsuya, Y.; Aikawa, K. Recoil-limited feedback cooling of single nanoparticles near the ground state in an optical lattice. Phys. Rev. A 2021, 103, L051701-1–L051701-5. [Google Scholar] [CrossRef]
- Bykov, D.S.; Mestres, P.; Dania, L.; Schmöger, L.; Northup, T.E. Direct loading of nanoparticles under high vacuum into a Paul trap for levitodynamical experiments. Appl. Phys. Lett. 2019, 115, 034101-1–034101-5. [Google Scholar] [CrossRef] [Green Version]
| Publisher’s Note: MDPI stays neutral with regard to jurisdictional claims in published maps and institutional affiliations. |
© 2021 by the authors. Licensee MDPI, Basel, Switzerland. This article is an open access article distributed under the terms and conditions of the Creative Commons Attribution (CC BY) license (https://creativecommons.org/licenses/by/4.0/).


