Abstract
This paper exploits for the first time the use of machine learning (ML) based techniques to identify complex structured light patterns under free space optics (FSO) jamming attacks for secure FSO-based applications. Five M-ary modulation schemes, construed using Laguerre and Hermite Gaussian (LG and HG) mode families, were used in this investigation. These include 8-ary LG, 8-ary superposition-LG, 16-ary HG, 16-ary LG and superposition-LG, and 32-ary LG and superposition-LG and HG formats. The work was conducted using experimental demonstrations for two different jammer positions. The convolutional neural network (CNN)-based ML method was utilized to differentiate between the stressed mode patterns. The experimental results show a 100% recognition accuracy for 8-ary LG, 8-ary superposition-LG, and 16-ary HG at 1, −2, and −2 dB signal-to-jammer ratios (SJR), respectively. For SJR values < 0 dB, the standard LG modes are the most affected by jamming and are not recommended for data transmission in such an environment. Besides, the accuracy of determining the jammer direction of arrival was investigated using CNN and a simpler classifier based on linear discriminant analysis (LDA). The results show that advanced networks (e.g., CNN) are required to achieve reliable performance of 100% direction determination accuracy, at −5 dB SJR, as opposed to 97%, at 2 dB SJR, for a simple LDA classifier.
1. Introduction
It is anticipated in the year 2050 that more than two-thirds of the world population will live in urban areas, where advanced technologies should play a significant role to optimize the life-style in future smart cities. Free space optics (FSO) is one promising technology with an expected market size investment of $300 million in 2029 [1]. FSO has been extensively considered by various communication sectors including wireless communication networks, optical interconnect in data centers, underwater communications, and next generation Internet of things systems [2,3,4,5]. This is owing to the unique features of FSO technology such as ease and low installation cost, high-throughput, long reach distance, and low link latency.
In this regard, different light beam structures were used in data multiplexing and M-ary pattern coding applications [6,7]. These include the traditional Gaussian beam and complex light structures such as Laguerre, Hermit, and Bessel Gaussian (LG, HG, and BG) mode families. Nonetheless, the wireless optical link is subject to propagation challenges that limit the FSO efficiency. These include intrinsic atmospheric conditions and extrinsic human-made risks (i.e., jamming and interception threats). In the former, the effect of atmospheric turbulence, rain, fog, and dust has been comprehensively investigated theoretically and by experimental demonstrations [8]. Additionally, traditional digital signal processing (DSP), adaptive optics (AO), and machine learning (ML) methods were used alternatively to mitigate atmospheric effects. For instance, the work in [9,10] studied the mitigation of crosstalk-based turbulence using DSP for multiplexed LG modes propagating in an emulated weak-turbulance channel. A 15-tap 4 × 4 multi-input multi-output (MIMO) equalizer is used for four multiplexed LG channels each carrying 20 Gbps quadrature phase shift keying (QPSK) signal. In addition, the authors in [11] exploited AO components to alleviate atmospheric turbulence on the data multiplexed LG mode family, where pre- and post-compensation of weak and moderated turbulence is achieved using an AO feedback closed loop.
Besides, ML-based methods have been used, broadly, as a classifier to identify structured light signals, in M-ary pattern coding systems, and as a regressor to predict various atmospheric conditions. In this regard, artificial neural network (ANN) has been utilized to identify 16-ary superposition LG modes transmitted over a strong turbulence channel, of 3 km link, in Vienna city [7]. Moreover, convolutional neural network (CNN) has been used as a classifier and regressor in [12] to identify 16-ary superposition LG modes and jointly predict the turbulence level, respectively. In [13], the k-nearest neighbour (kNN), support vector machine (SVM), and CNN have been compared to identify 8-, 16-, and 32-ary structured light beams generated using LG and HG mode families, in a dusty environment. Moreover, the CNN-based regressor was used to predict the visibility range of the communication channel. In [14], a chaotic interleaving processing step has been applied to 16-ary orbital angular momentum (OAM) states to mitigate FSO turbulence after coding the original transmitted bits using low-density parity-check codes and Turbo codes. The CNN-based classifier was used to identify various OAM-states with an achieved accuracy of 99% after optimizing CNN hyperparameters. In addition to the free space conditions, the underwater environment effects, such as water bubbles, temperature inhomogeneity, and water turbid, have been studied using CNN algorithm on single and superposition LG modes that form 16-ary OAM states [3]. It is worth noting that the immunity of ML-based approaches to environment (atmospheric or underwater) conditions has stimulated the recent interest in ML-based methods as an alternative option to traditional DSP and/or AO-based receivers [7].
On the other side, the investigation of extrinsic threats such as FSO beam tapping and jamming are still in its fancy. For instance, in [15] the alleviation of FSO tapping has been studied using free space spatial diversity and encoder/decoder techniques. Moreover, the effect of jamming on standard Gaussian beam is analytically investigated in [16,17]. In [16], the jamming effect on the bit error rate (BER) performance of FSO system is studied using numerical simulation. In addition, in [17] the FSO channel outage probability is evaluated under jamming effect, where jamming mitigation is investigated by proposing a multi-input-single-output (MISO) FSO system. Moreover, a closed-form expression of the average BER has been obtained in [18] for a 2 × 1 MISO optical space shift keying system under jamming effect and in a turbulent FSO channel. So far, these methods are based on numerical analysis to mitigate and/or study FSO system under jamming; however, ML-based techniques are not yet reported in literature for extrinsic free space challenges. Table 1 shows the recent progress of ML-based identification for M-ary pattern coding under various channel conditions, where intrinsic channel conditions are considered more.

Table 1.
ML-based identification of M-ary light pattern coding systems under different transmission challenges.
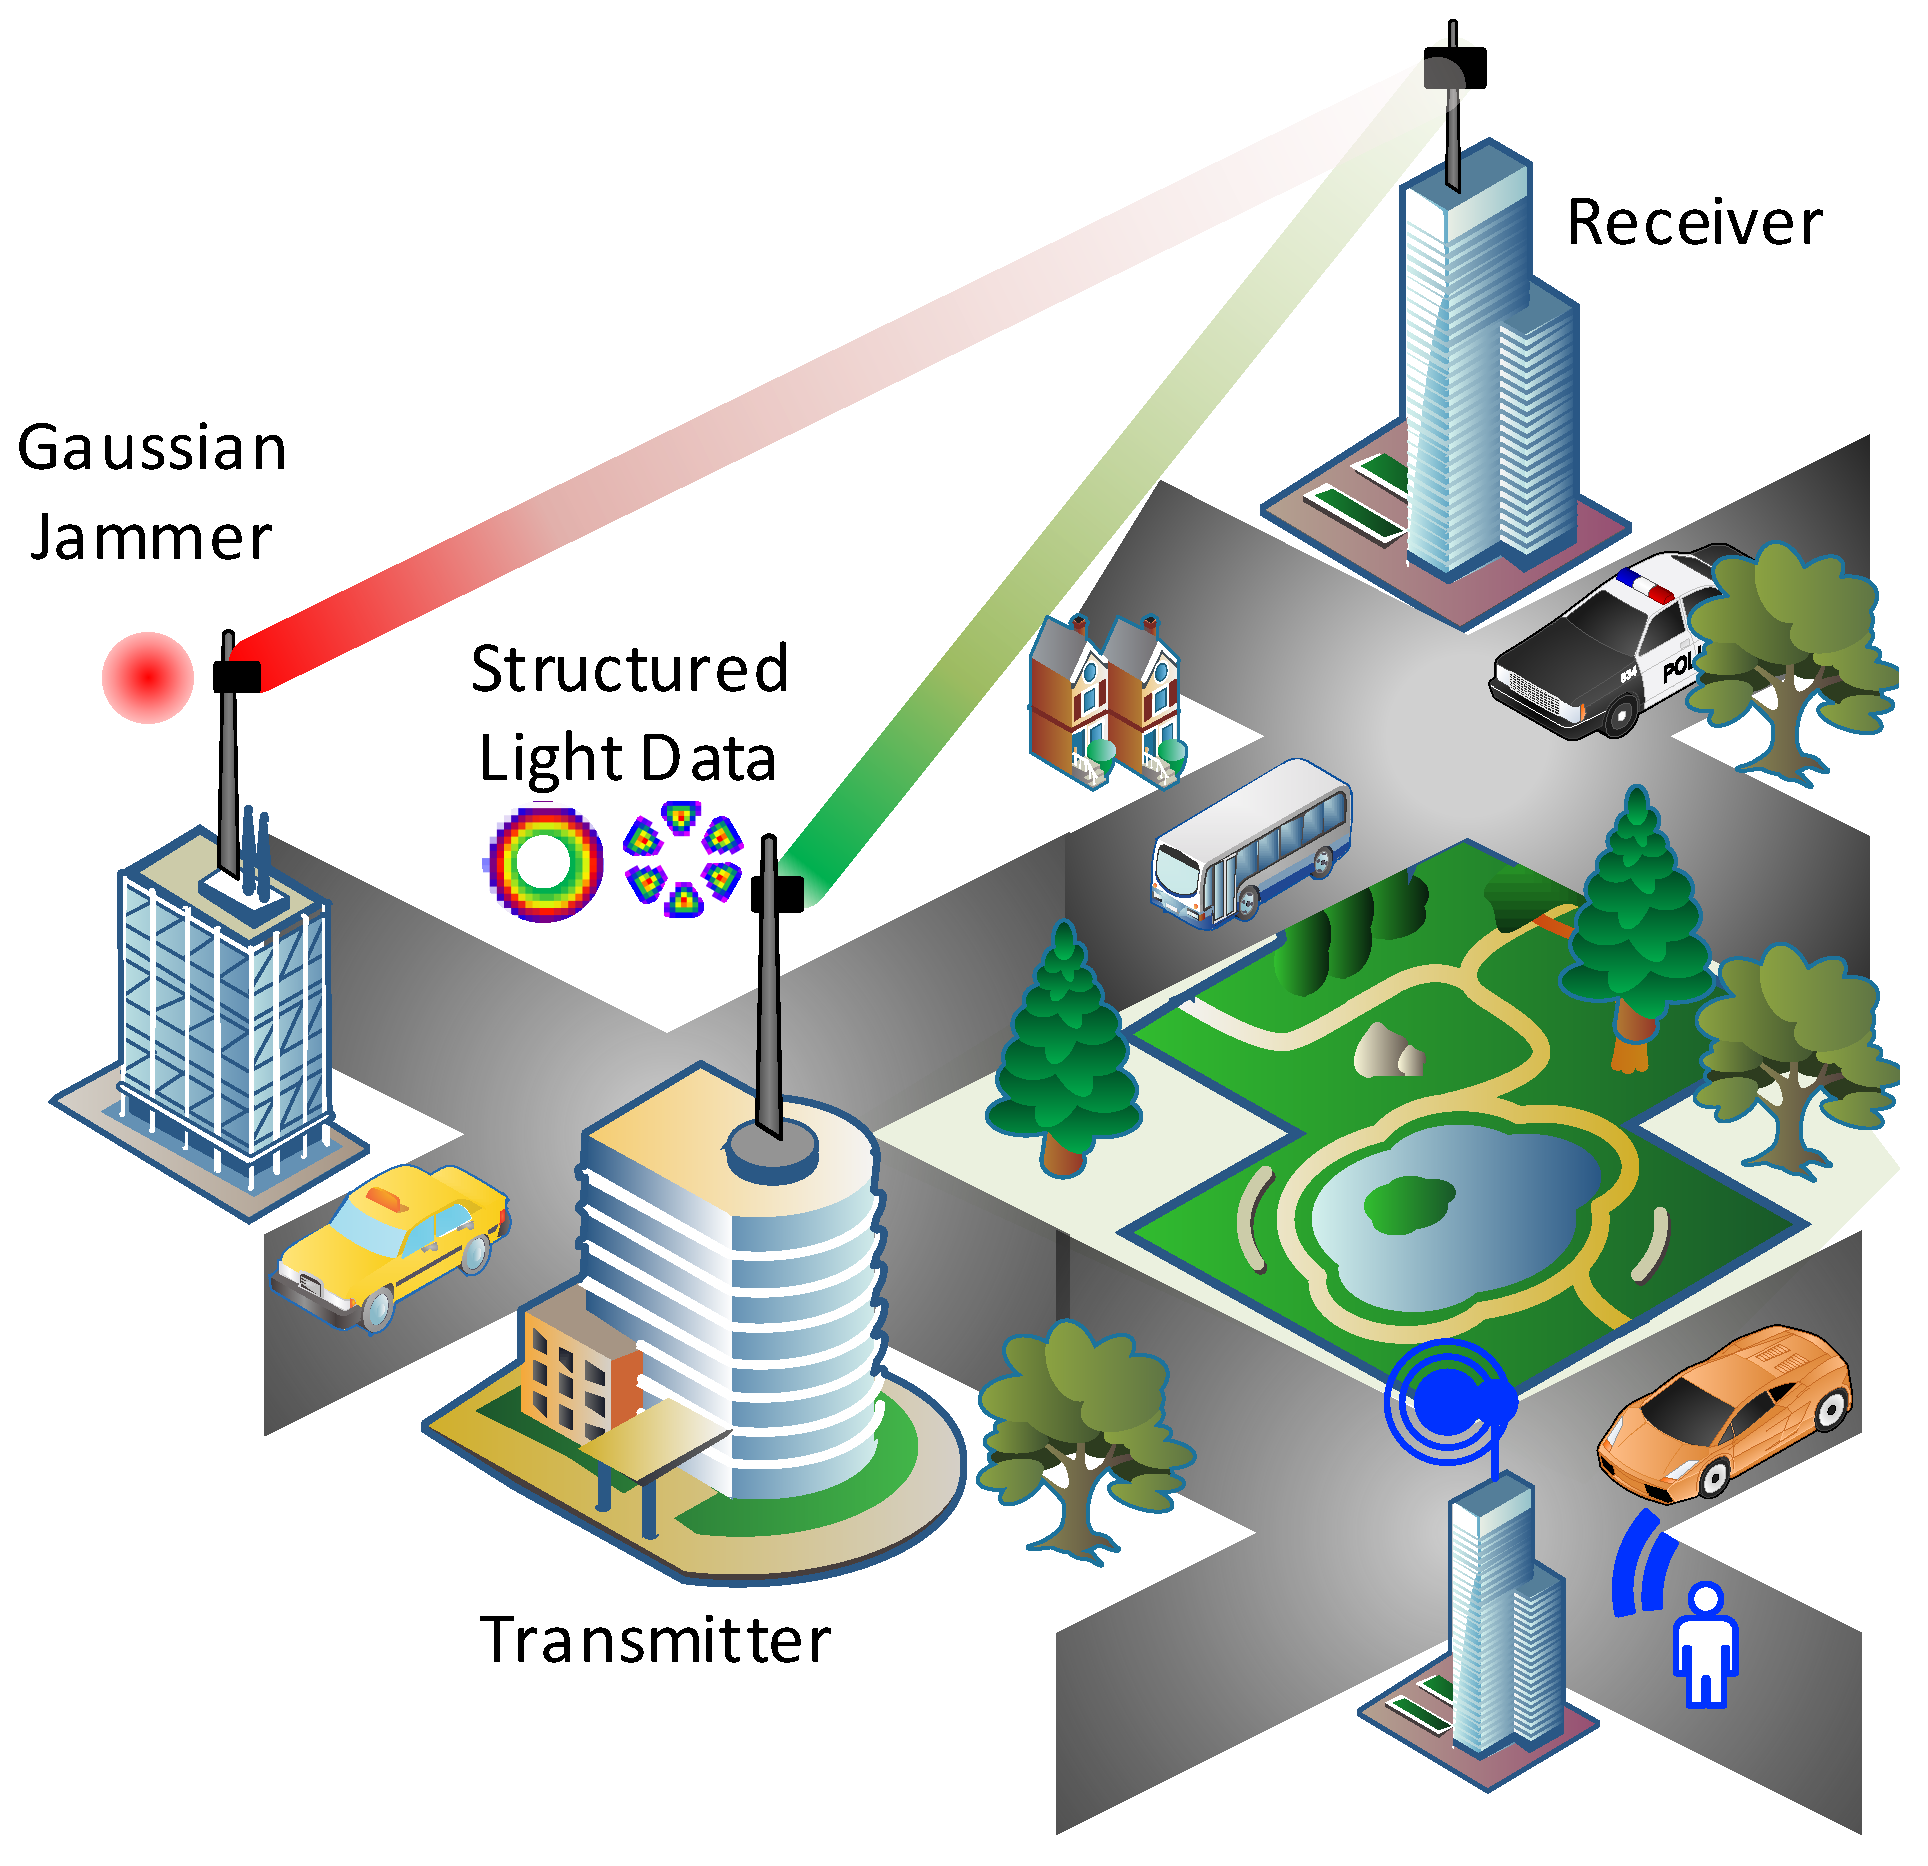
It is worth noting that, to the best of authors knowledge, no work has been yet reported in literature that investigates the jamming effect on complex structured light beam mode families using ML-based techniques. Therefore, in this paper we experimentally investigate the effect of jamming signal on LG, superposition-LG, and HG mode families. As shown in Figure 1, structured light patterns can be used to transfer information bits between two buildings; however, a simple standard Gaussian jammer can be used to corrupt the pattern at the receiver side. In particular, the following is considered in this work:
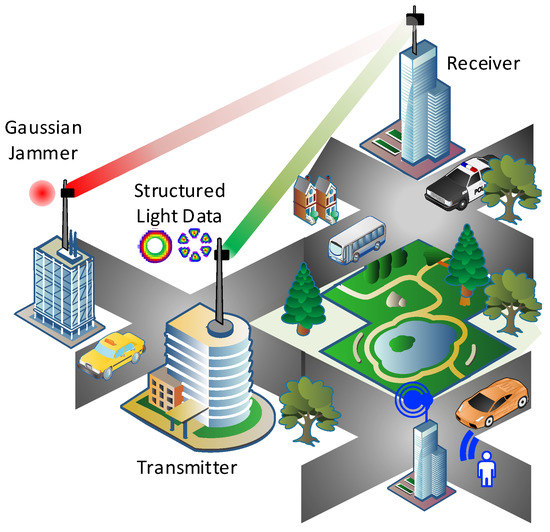
Figure 1.
Structured light communication patterns between buildings with extrinsic Gaussian profile jammer.
- An FSO pattern coding system is experimentally built to generate 8-ary LG, 8-ary superposition-LG (we call it Mux-LG), 16-ary LG and Mux-LG, 16-ary HG, and 32-ary formed by all considered modes.
- The identification accuracy of different mode families is assessed, in a direct detection FSO system, using CNN-based classifier and under signal-to-jammer ratio (SJR) ranging from −5 to 3 dB.
- The direction-of-arrival (DoA) of the jamming signal is determined using CNN- and linear discriminant analysis (LDA)-based classifiers.
The rest of paper is organized as follows. Section 2 presents the structured representation of LG and HG mode families. The experimental setup and data set collection are discussed in Section 3. CNN- and LDA-based classifiers are introduced in Section 4. The experimental results and their analysis are reported in in Section 5. Section 6 discusses the limitations and the practicability of the proposed system. Finally, Section 7 provides concluding remarks.
2. Mode Basis Background
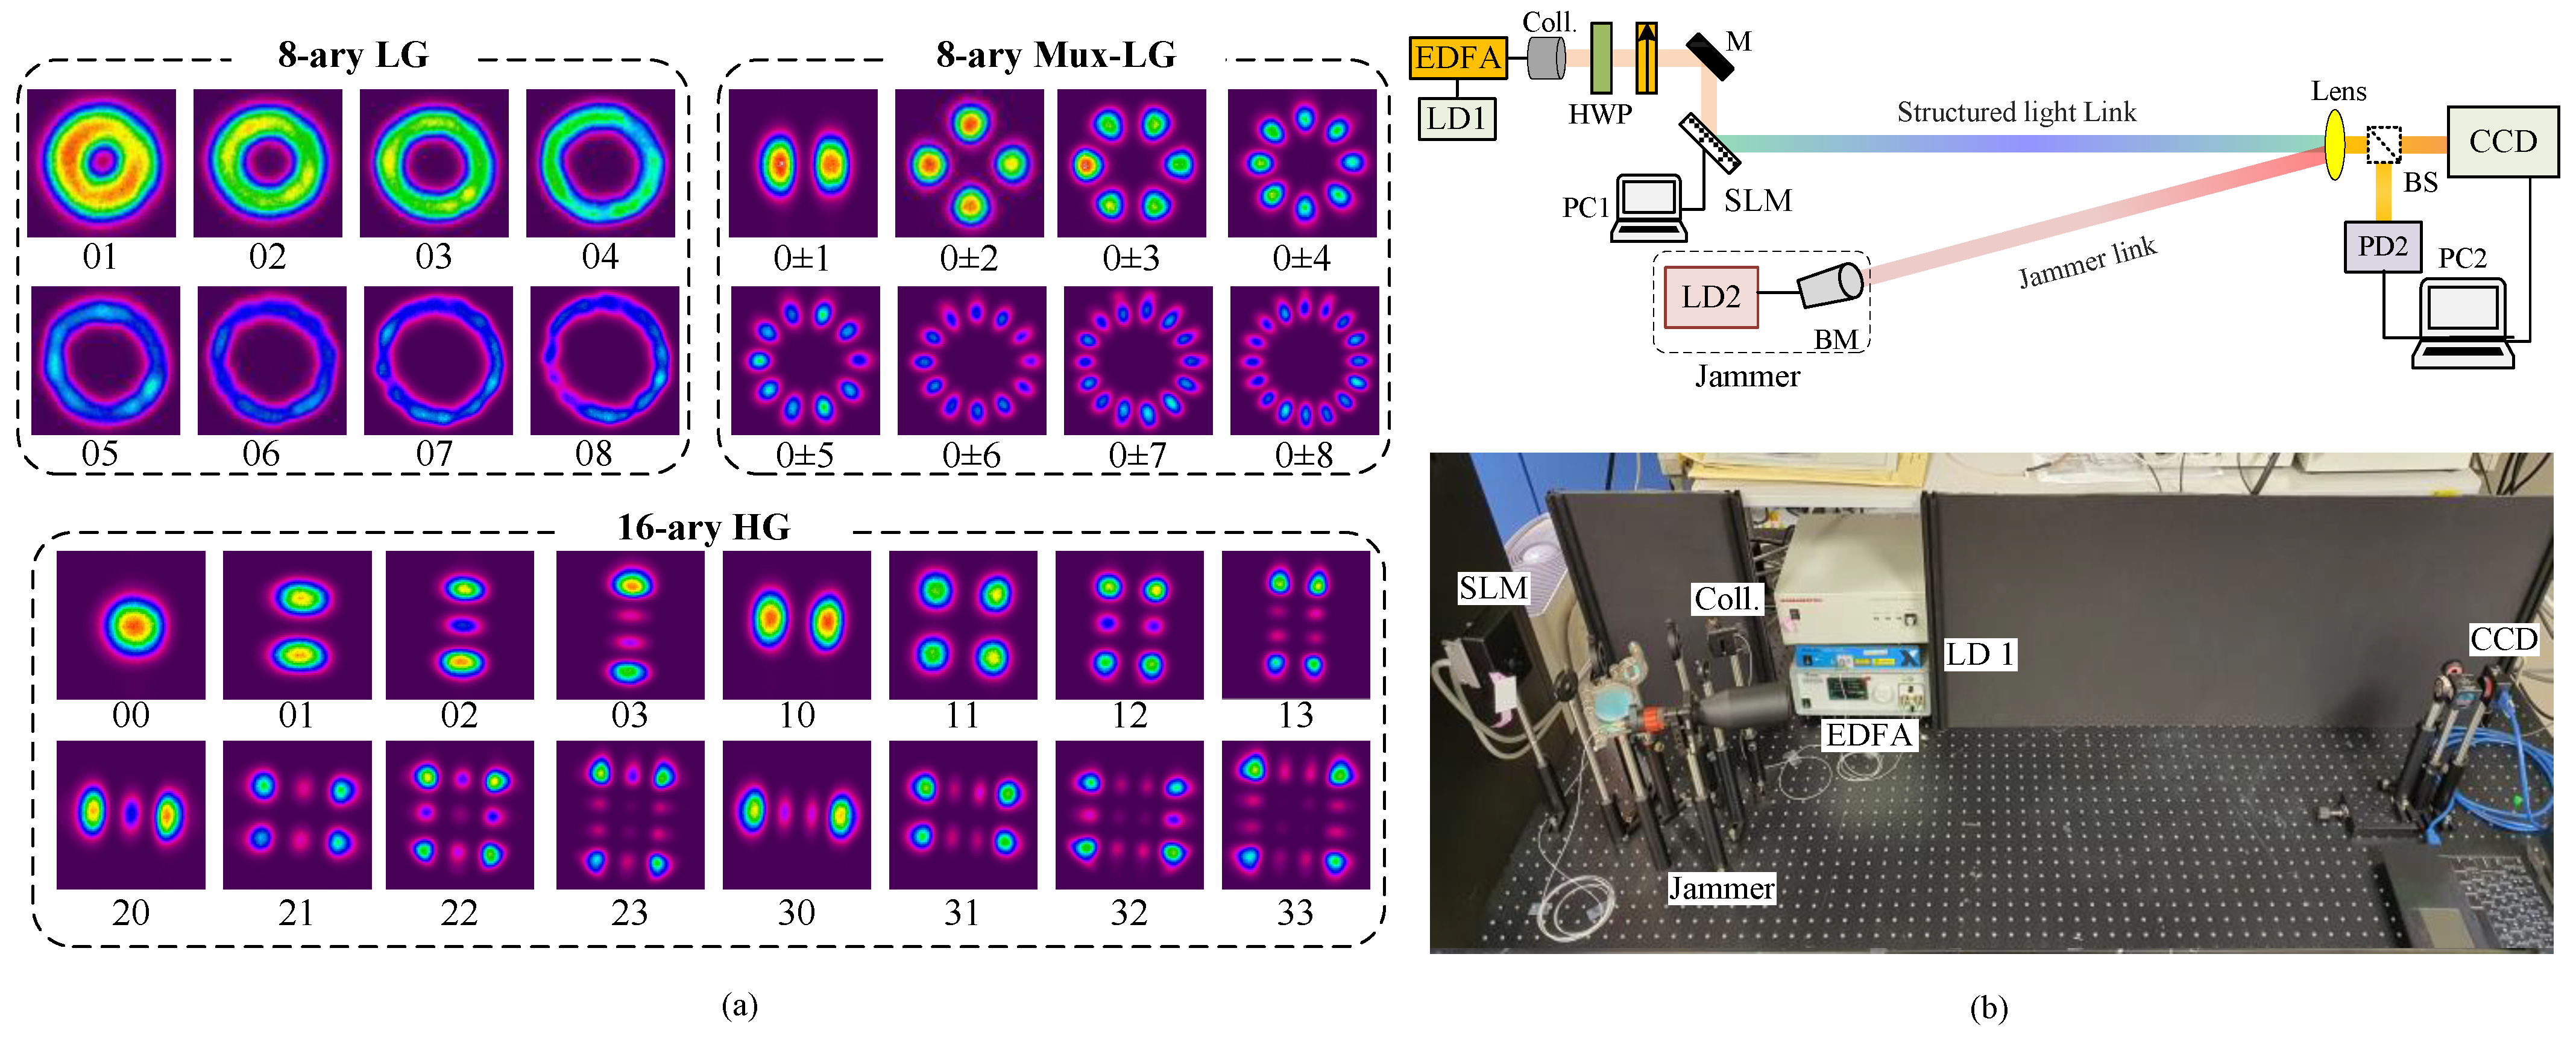
It has been shown that the distribution of laser light amplitude, in free space, can be represented, in rectangular coordinates, by the product of Hermitte polynomials , where n and m are the polynomials order, or in cylindrical coordinates by Laguerre polynomial (·), where ℓ and p are the azimuthal and radial indices, respectively [19]. In this work, the HG and LG orthogonal modes are used as code words for data transmission in an M-ary pattern coding system, where M is the modulation order of LG or HG coding system. In Figure 2a, the laboratory-generated LG and HG modes are shown, which are used to build an M-ary coding communication system with M = 8, 16, and 32. In particular, Hermite–Gaussian and Laguerre–Gaussian functions provide an exact representation of the higher-order solutions of the free space paraxial wave equation in rectangular and cylindrical coordinates, respectively [20]. The HG modes can be written in rectangular coordinates as [20], where or is the solution in x or y transverse dimension, and is given by
where is Hermite polynomial of order n, is the beam waist, is the wave number and is the operating wavelength, is the spot size with is Rayleigh size, is Gouy phase, and denotes the radius of curvature.
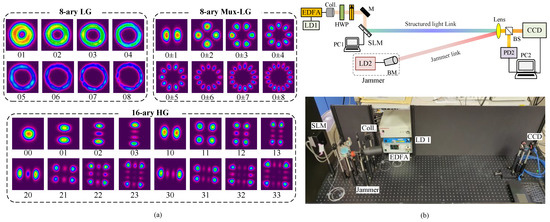
Figure 2.
(a) Laboratory-generated transverse intensity profiles of LG, superposition-LG and HG modes, (b) Experimental setup of M-ary structure pattern transmission with Gaussian jammer. LD: Laser diode; Coll.: Collimator; HWP: Half-wave plate; M: Mirror; SLM: Spatial light modulator; BM: Beam magnifier; PC: Computer; BS: Beam splitter; PD: Photodiode; CCD: Charge-coupled device. Inset is a photograph of the laboratory setup.
Similarly, the LG modes characterized by the azimuthal and radial indices can be expressed in cylindrical coordinates as [20]
where A is a normalized constant, is the generalized Laguerre polynomial, and the parameters , , and are the same as in Equation (1).
3. Experimental Setup and Dataset
In this work, the jammer effect on two laser mode families is investigated in direct detection FSO system. Figure 2b shows the demonstrated experimental setup used in this investigation. The information carrier link is built using a Teraxion continuous wave (CW) laser source operating at 1550 nm (LD1). The laser output power is boosted up to ∼20 dBm using an Erbium doped fiber amplifier (EDFA) before collimated in free space using Thorlabs F230FC-1550. A free space set of a half wave plate (HWP) and a polarizer (P) is used to maximize the intensity and align the polarization of the collimated light, respectively. An Hamamatsu (X13138-08) programmed liquid crystal on silicon-spatial light modulator (LCOS-SLM) is utilized to modulate the phase of the horizontally polarized incident Gaussian beam. According to the M-ary order, a computer (PC1) is used to program the LCOS-SLM with different hologram sets to convert the incident Gaussian mode into LG, Mux-LG, and/or HG modes.
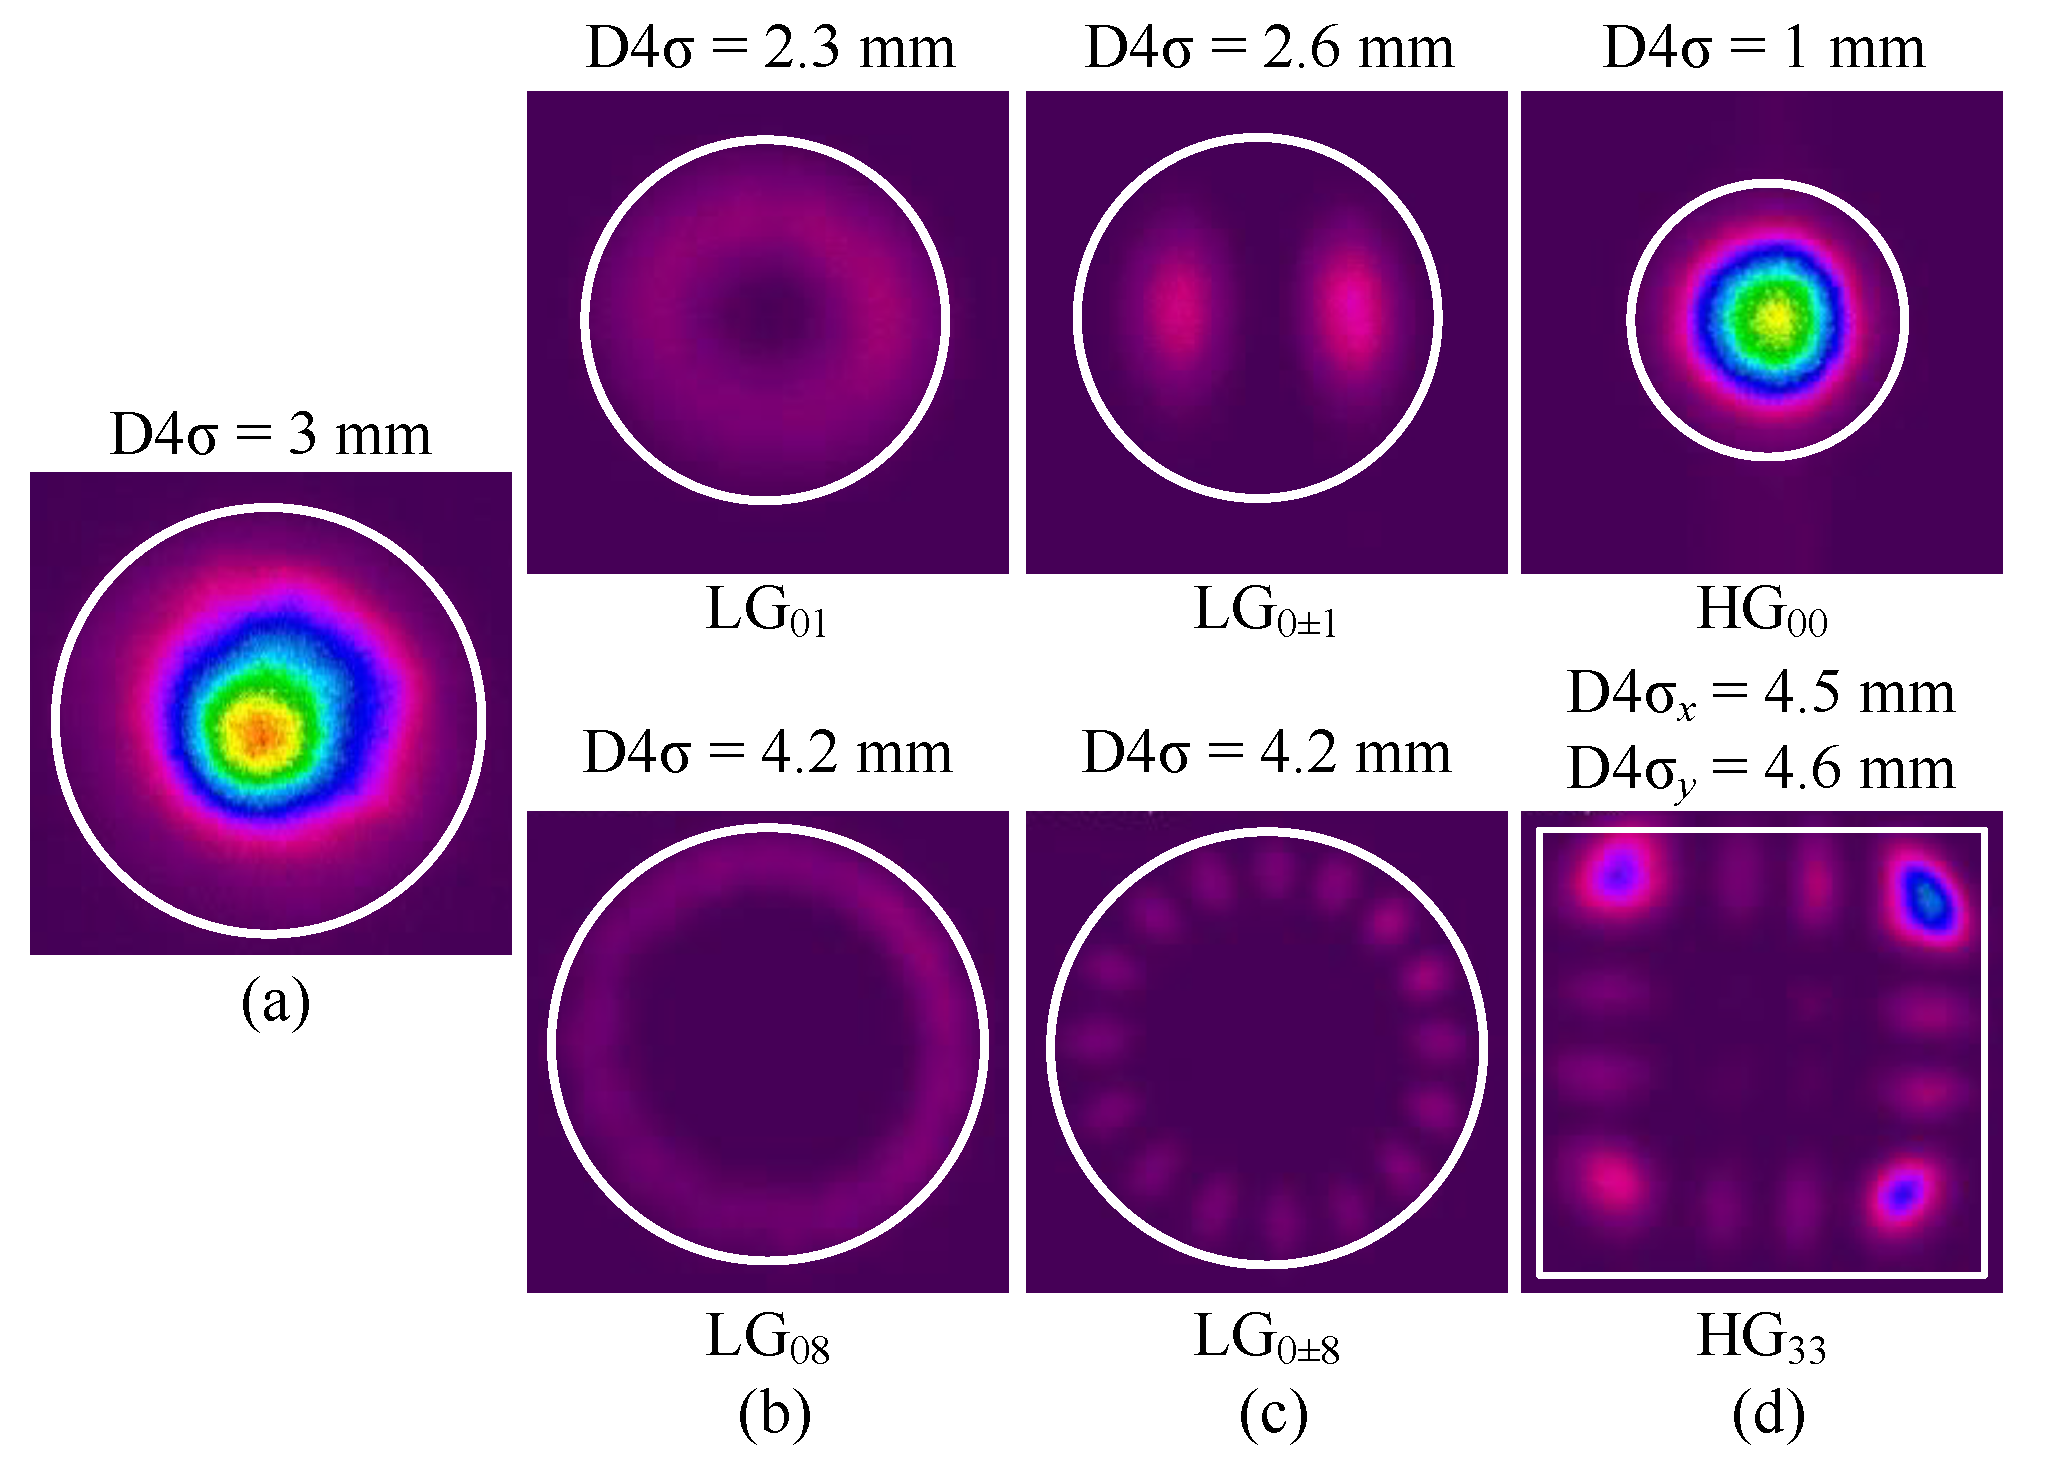
On the other side, the jamming link is a standard Gaussian beam generated using another CW laser source (LD2) working in C-band with an output power varying from 8 to 15 dBm to change the signal-to-jamming ratios (SJRs). A 15x Thorlabs GBE-15C beam magnifier (BM) is used to adjust the beam diameter of the jamming signal. Both mode pattern and jamming signals are transmitted over a free space link of 1-meter inside the lab. The free space direct detection receiver is constructed using a Thorlabs LB1471-C convex lens of 50 mm focal length and a charge-coupled device (CCD) detector (Ophir-Spiricon LBP2-IR2) that captures and stores the intensity profiles of the different jammed modes in PC2. Moreover, a beam splitter is used initially to measure the the power of the received pattern and jamming signals and to adjust the SJR values. Figure 3 compares the received beam width diameters statistically measured by D4 method (i.e., four times beam profile standard deviation in x or y directions) [21], for left-hand jammer, LG, Mux-LG, and HG mode profiles. The measured beam diameter of the jamming signal is 3 mm, see Figure 3a, whereas the measured beam widths of the LG/Mux-LG modes varying from ∼2.3 mm (LG) to 4.2 mm (LG), as shown in Figure 3b,c. For HG modes, the beam diameters change from ∼1 mm (HG) to 4.5 mm (HG) in x and y directions.
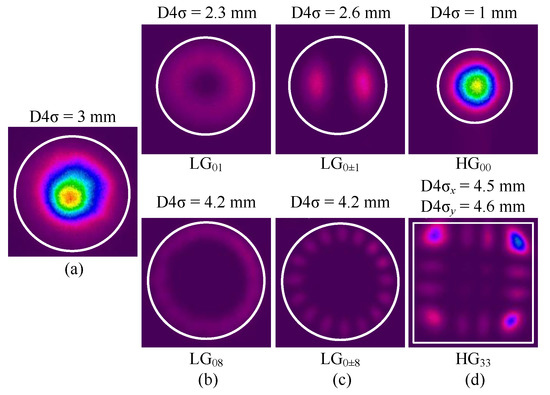
Figure 3.
Measured beam width diameters using D4 method for (a) Jammer, (b) LG modes, (c) Mux-LG modes, and (d) HG-modes.
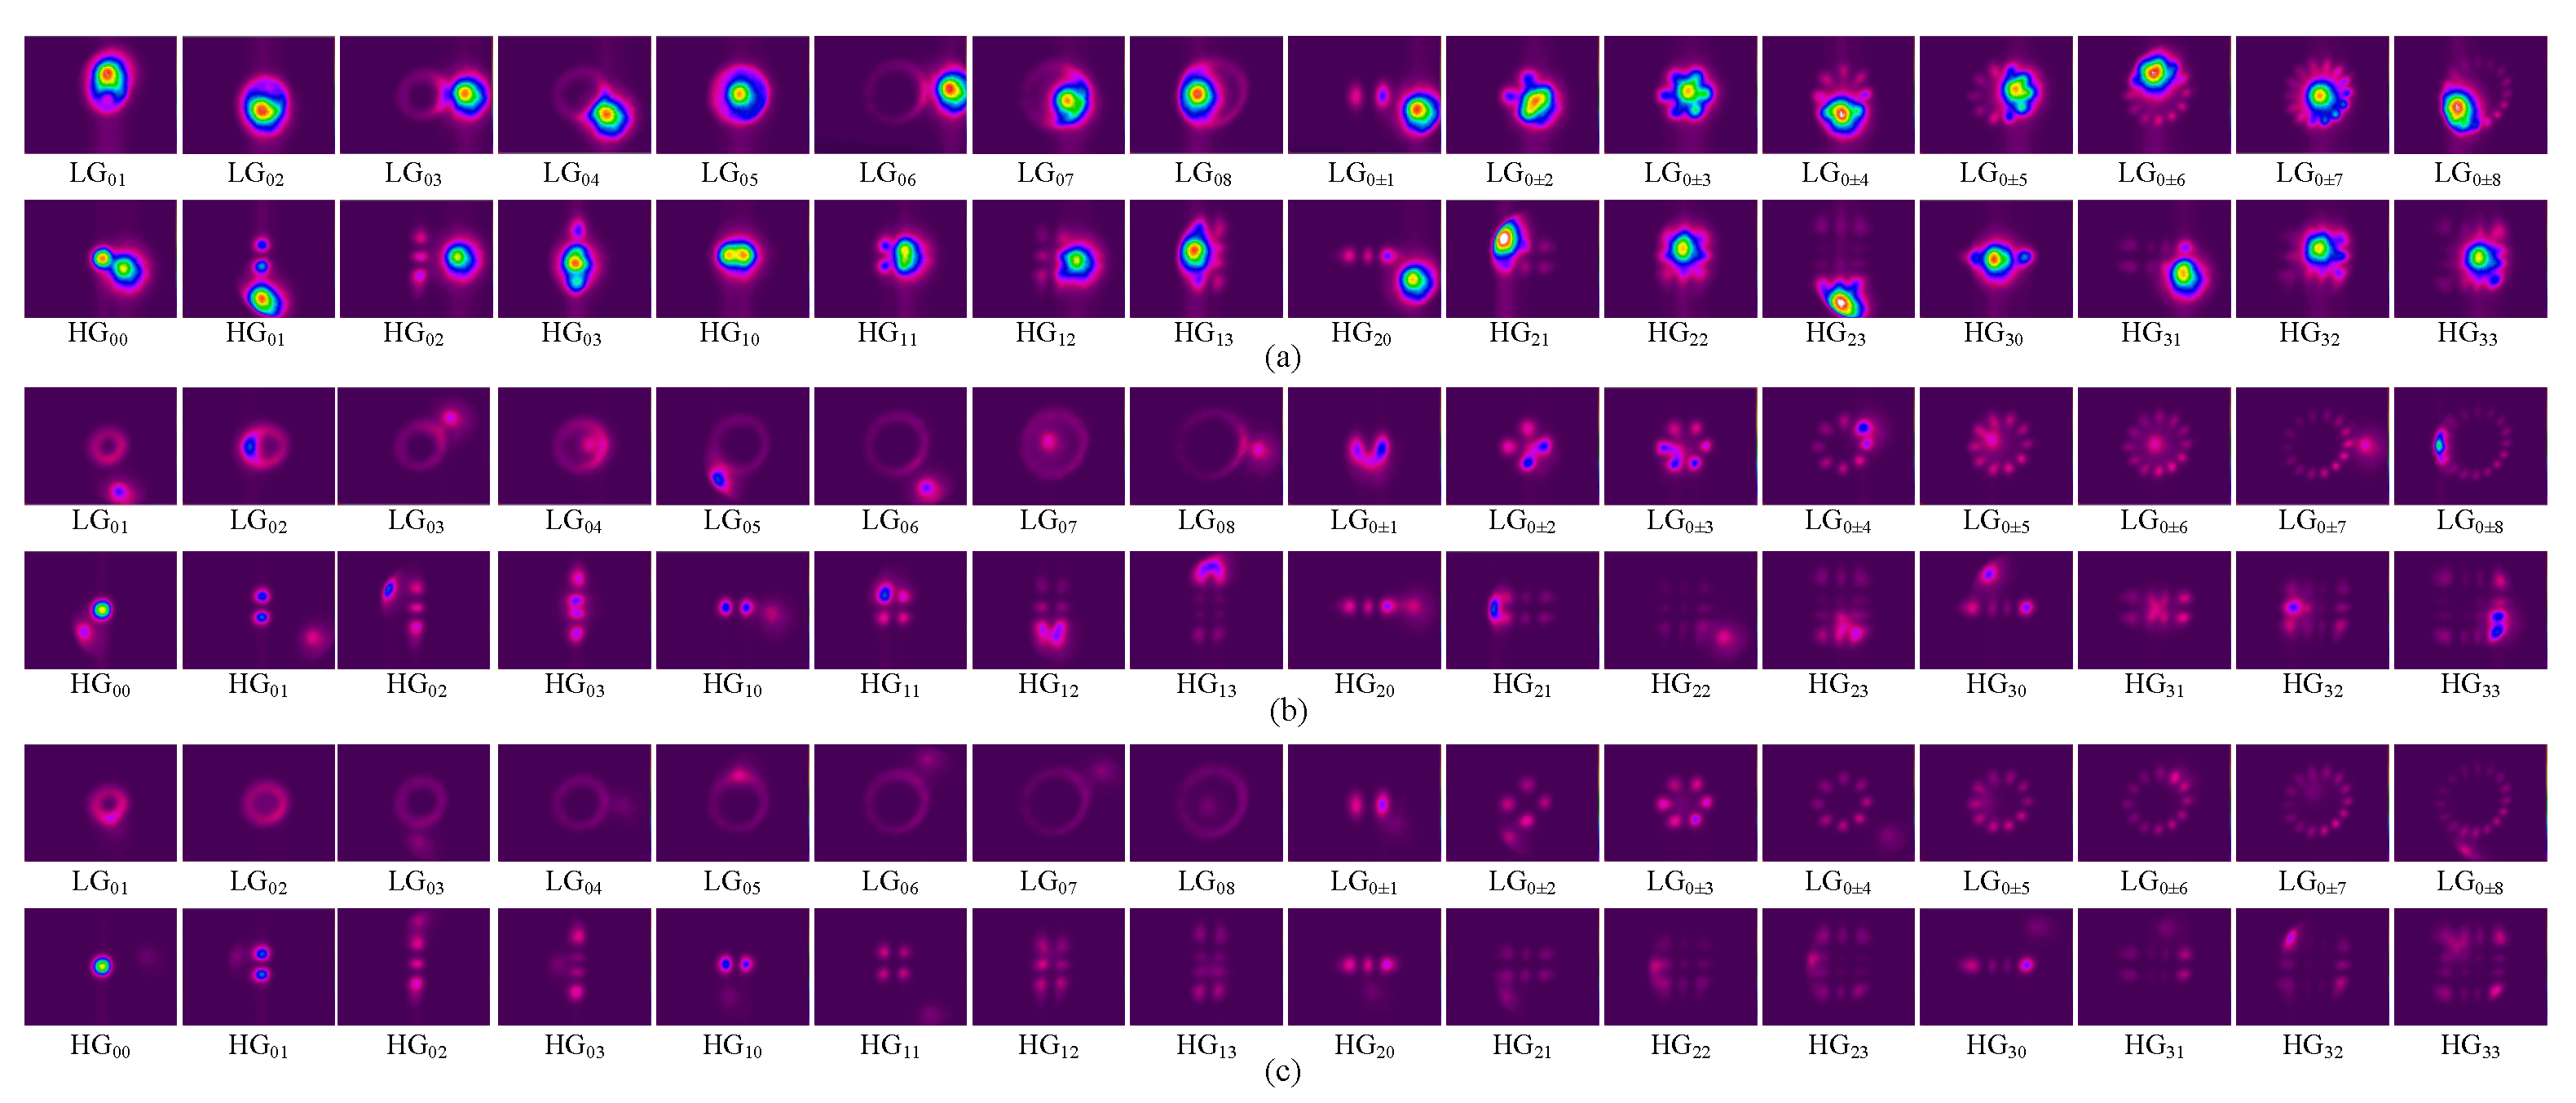
In order to mimic the random wandering-around of a jammer, a 3-axis translation stage is used to randomly change the incident position of the jammer. Besides, in this investigation, both the left- and right-hand jammer direction-of-arrivals (DoAs) are considered. A dataset of the jammed patterns was created by recording the received intensity profiles using the CCD detector. The CCD recorded the received profiles with a frame rate of 1 frame/sec (which is sufficient to capture the slow jammer wandering), for a duration of 200 s (∼3.3 min). In addition, the profiles was recorded at different SJRs varying from −5 to 3 dB with a step size of 1 dB. It is worth noting that the choice of the lower (−5 dB) and upper (3 dB) SJR values is owing to the devices power limitations and the performance consistency, respectively. This creates a data set of 14,400, 28,800, and 57,600 frames for 8-ary LG/Mux-LG, 16-ary HG/LG+Mux-LG, and 32-ary LG+Mux-LG+HG modes, respectively. Figure 4 shows examples of the various intensity profiles of the randomly jammed mode pattern at SJRs of −5, 0, and 3 dB, of a left-hand DoA jammer. It can be seen that the jammer attack frequently appears at the right-hand side of the sensor’s active area. Moreover, when the jammer’s incident angle exceeds the lens’s angle of view, the jammer distribution shows a non-circular/distorted shapes as in LG, HG, and HG at 0 dB SJR. The recorded images have been used for the training and testing of CNN-based classifier, such that 70% were used in the training phase whereas the remaining 30% are for testing the classifier. It worths noting that to predict the jammer’s DoA, another dataset was built that considers the 8-ary LG modes only. This generates a dataset of 28,800 frames for the left- and right-hand jammer’s DoA. In the next sections, the obtained accuracies for both M-ary modulation classification and DoA determination are discussed.
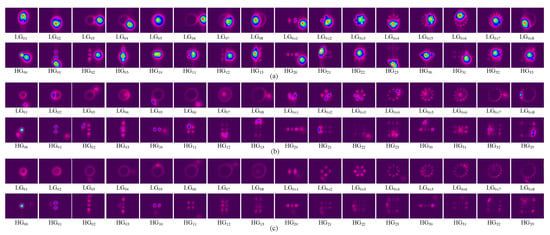
Figure 4.
Measured beam profiles of left-hand DoA jammer at SJRs of (a) −5 dB, (b) 0 dB, and (c) 3 dB.
4. Modes Identification and DoA Determination Classifiers
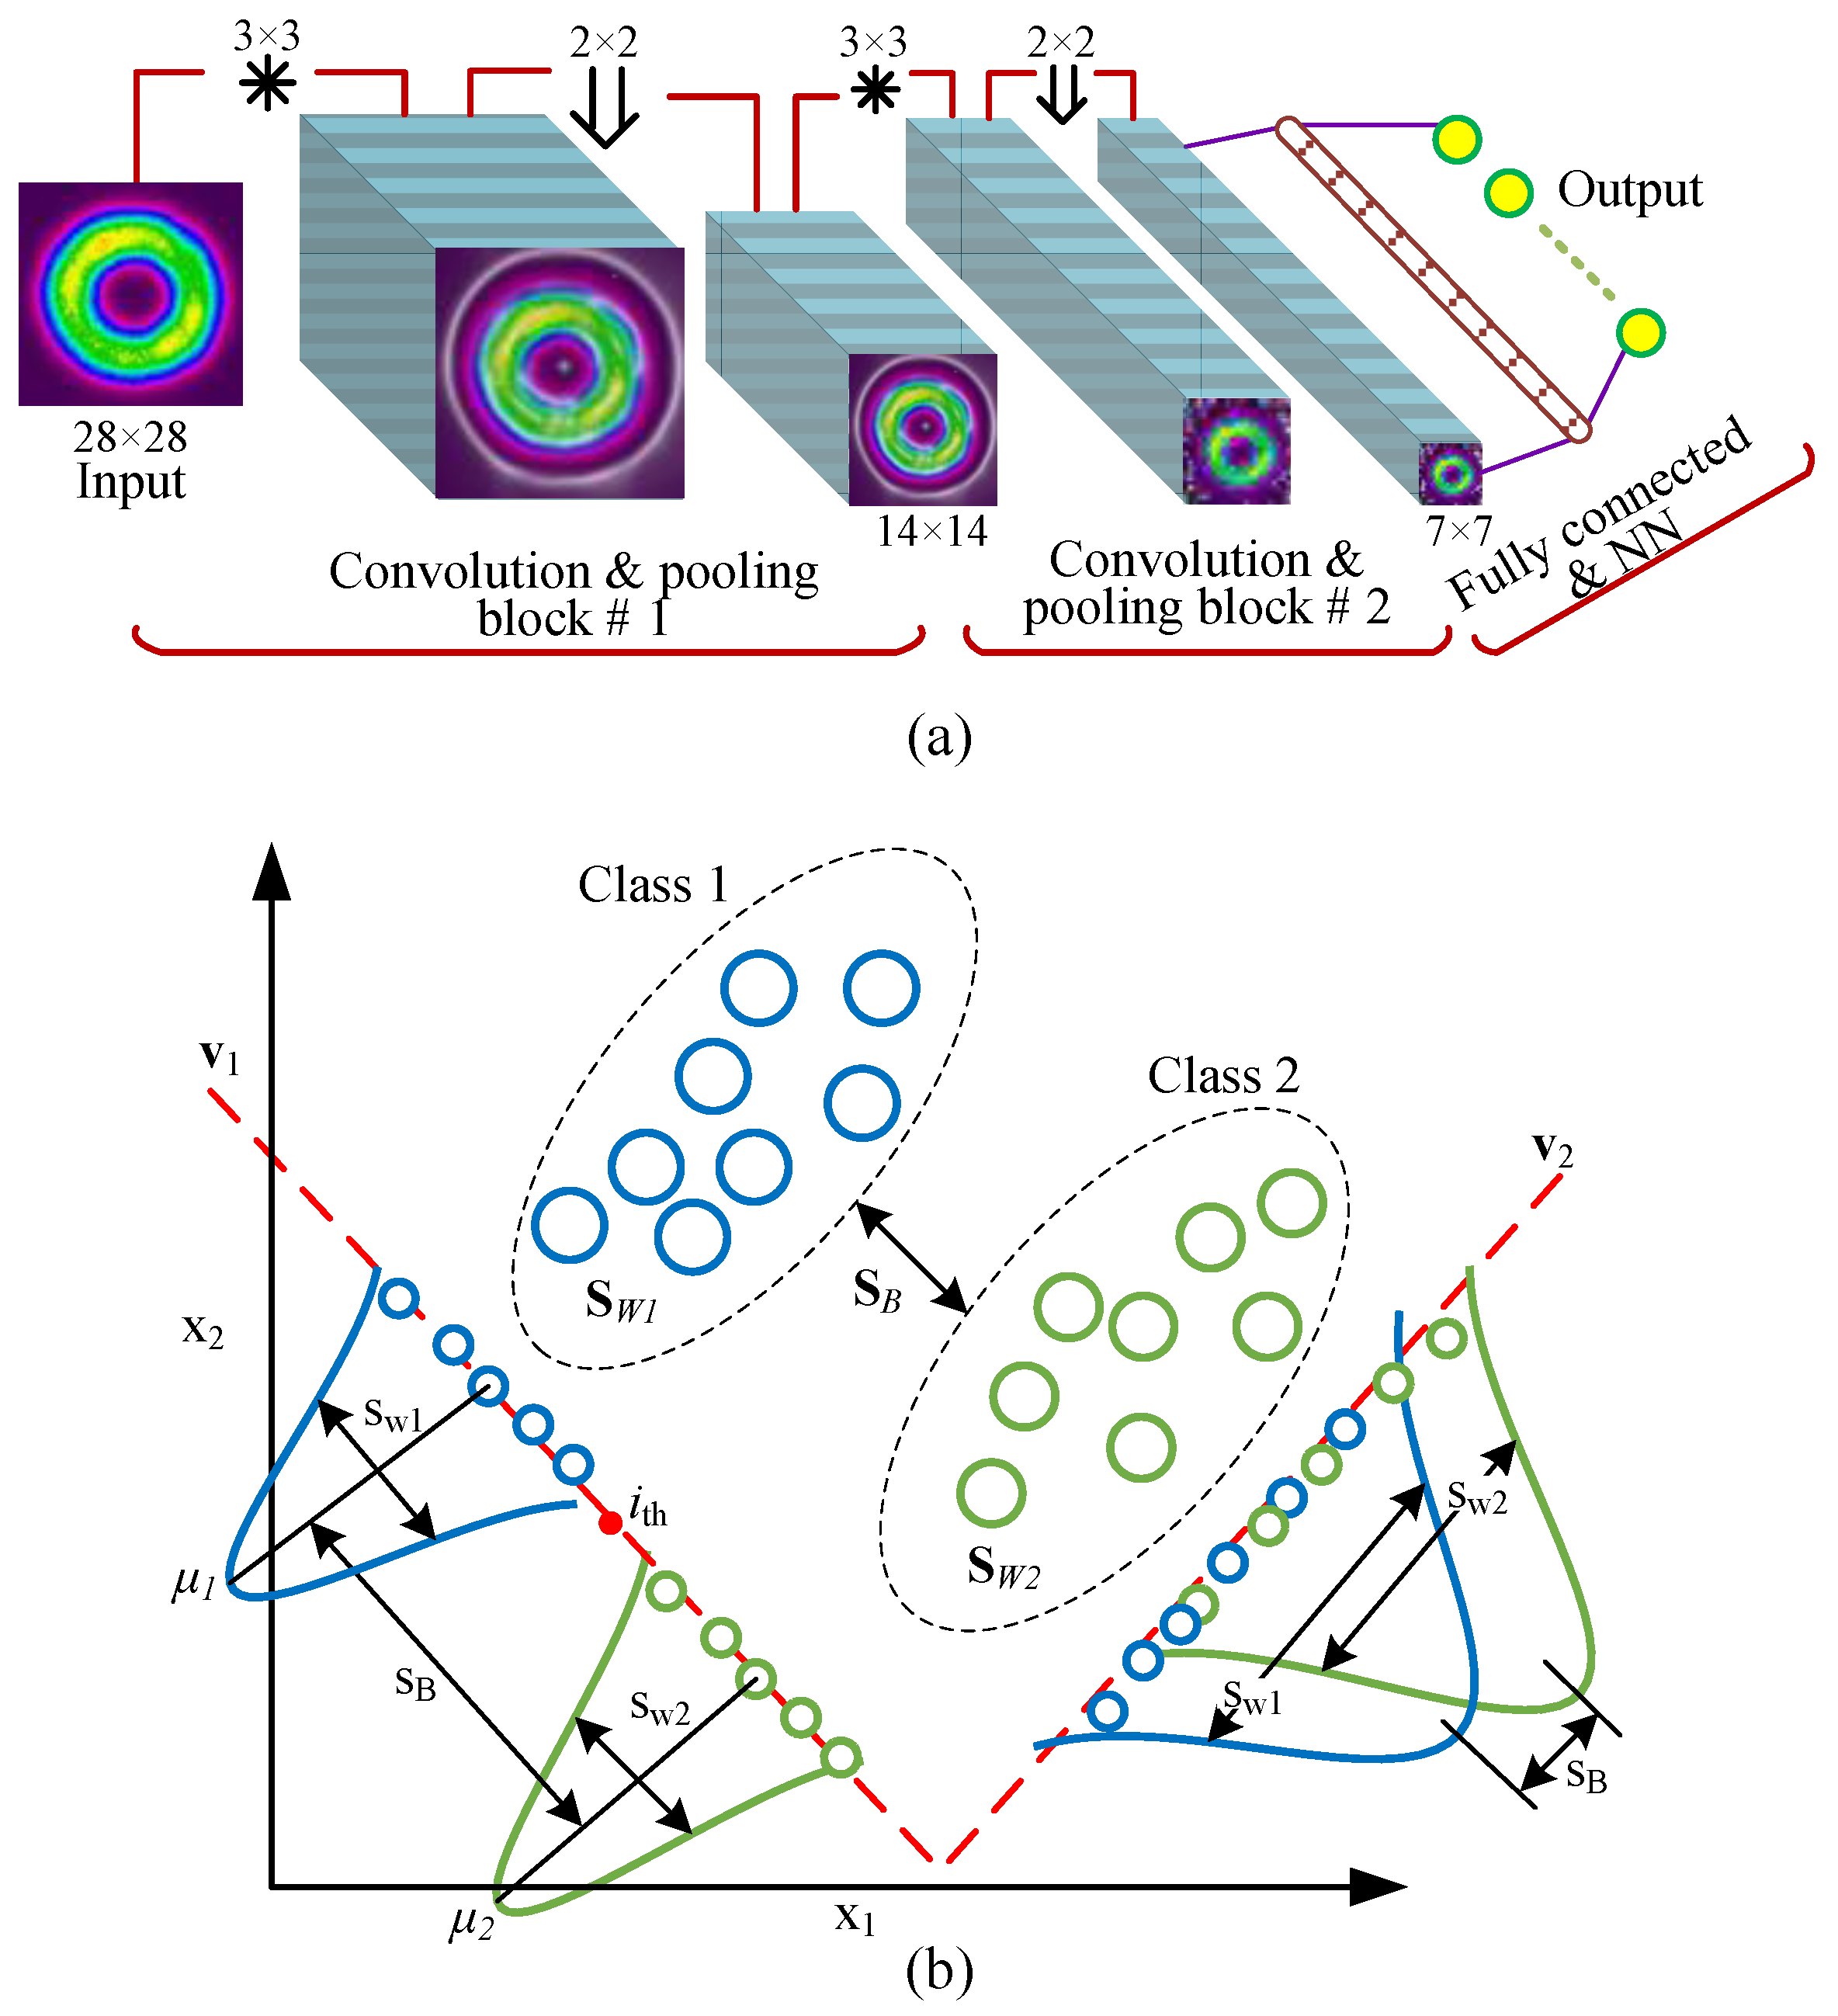
The free space direct-detection method depends on observing the image of the intensity profiles. Therefore, the CNN-based classifier is exploited to identify the images of different mode patterns, as it can directly process the two-dimensional input signal types. The CNN, shown in Figure 5a, is used to automatically extract features from the raw image data which leads to better discrimination between modes and, consequently, better performance in the testing phase. The CNN network is constructed using three main processing layers. These are the convolutional, pooling, and fully direct connected layers. In our work, the CCD colored recorded images were greyscaled and resized to 28 × 28 pixels to reduce the processing complexity. The resultant images were processed using the convolutional and pooling layers. The convolutional layer is considered as the core building block of CNN-based classifier. The input mode image is subdivided into different windows, which are convolved with kernel filters to produce the feature maps. The result of the convolution layer is passed through a nonlinear activation function. In this work, the activation function is the Rectified Linear Unit (ReLU). The convolutional layer is then followed by a pooling layer to reduce the size of the feature map. Two blocks of alternating convolutional and pooling layers were considered, where the convolutional layers use 16 and 32 kernels with 3 × 3 pixels, respectively. The output feature maps pass through the pooling layers with a max-pooling of 2 × 2 pixels. This produces 32 feature maps with 7 × 7 pixels after the second pooling layer. Then, these feature maps are flattened to 1-D vector with 1568 length and applied to a fully connected layer which contains 256 weights, sufficient to solve the problem without requiring much resources. Finally, the CNN output layer is 8, or 16, or 32 elements vector (e.g., 8 for 8-ary LG modes and 16 for 16-ary HG modes). The softmax activation function is implemented at the output layer. The position of output vector element of highest value determines the type of received mode pattern. Note that the entries of output vector are of values ≤ 1, where each entry represents the probability of corresponding mode type. The sum of all output vector probabilities equals to one.
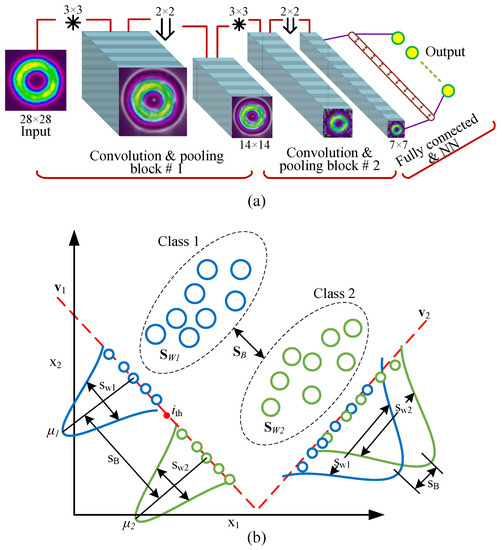
Figure 5.
(a) CNN-based classifier architecture. (b) LDA-based classifer principles.
The network training is relying on the back propagation algorithm which updates the network’s weights based on gradient of the loss. The loss function (L) is the cross-entropy, given by [22]
where K is the number of classes, N is the number of samples, and y and t are the predicted and target class (mode) probabilities, respectively. In the training phase, instead of using the entire dataset as input to the CNN, which requires high memory space, the dataset is divided into different batches. Every batch contains 64 images. Further, to reduce the training time, batch normalization (i.e., subtracting the mean of each batch and dividing by the batch standard deviation) is considered. Batch normalization considerably decreases the training time when normalizing the input of each processing layer in the network, not only the network input layer. Moreover, an important hyperparameter for tuning Deep Neural Networks (DNNs) is the use of optimizer. In this study, the adaptive moment optimizer (Adam) is considered with learning rate equals 5 ×. Adam is easy to implement, computationally efficient, and requires less memory resources [23]. Because overfitting is a common challenge in training DNN models, L2 regularization of 10 is used to prevent it. On the other side, to determine the jammer DoA, the CNN-based and LDA classifiers are considered and their performances are compared. The later is considered owing to its simplicity. The idea of the LDA technique is to project the original dataset of size () onto a new space of size (), where , as shown in Figure 5b. In our development, N represents the number of mode images in the training dataset and D is the number of features (image pixels). Therefore, the LDA can be performed using the following steps [24]:
- (1)
- Compute the between-class covariance matrix of the training dataset.
- (2)
- Compute the within-class covariance matrix of the training dataset.
- (3)
- Find the transformation matrix that maximizes and minimize .
The eigenvectors and the corresponding eigenvalues of the transformation matrix provide the information about LDA space. The directions of LDA space is represented by the eigenvectors, while the associated eigenvalues denote the magnitude of the eigenvectors. Therefore, every eigenvector indicates one axis of the LDA space; however, the eigenvalue represents the robustness of this eigenvector. The robustness of the eigenvector reflects its potential to distinguish between the various classes, i.e., increase and decreases . Thus, it achieves the goal of LDA. The LDA space is constructed using the eigenvectors that have the largest eigenvalues. It is worth noting that for K number of classes, the number of non-zero eigenvalues will be [22]. Finally, the training dataset is projected on LDA space. The classifier then designed to have a decision threshold () that separates the two adjacent classes. The decision threshold can be calculated as [22]
where and represent the training dataset means of the two adjacent classes in LDA space. Once the threshold value is calculated, it can easily be used to classify a new data by first projecting it on LDA space, and then comparing its value with the value of . Figure 5b illustrates an example of classification using LDA. It can be observed that there is a significant overlap between the classes in case of the eigenvector (i.e., with lowest eigenvalue) which leads to error in classification. However, the eigenvector (i.e., with largest eigenvalue) shows a considerable improve in separation between classes.
5. Experimental Results and Discussion
5.1. M-ary Mode Identification
Investigation is conducted to examine the identification accuracy, using CNN-based classifier, for each individual mode for 8-ary LG, 8-ary Mux-LG, and 16-ary HG formats. Figure 6 shows the classification accuracy in percent evaluated at SJR ranging form −5 to 3 dB. For LG modulation set, all modes reach 100% accuracy at SJR equals 0 dB, except LG which requires 1 dB more to reach 100% accuracy. However, for 8-ary Mux-LG and 16-ary HG modulation schemes, all modes can reach a recognition accuracy of 100% at SJR of −2 dB. This shows an improvement of 3 dB over the 8-ary LG format. At low SJR (i.e., −5 dB), the mode accuracy reduces to ∼85%, 96%, and 95% for LG, LG, and HG. This can be interpreted from the confusion matrix shown in Figure 7 at −5 dB SJR, where the diagonal values represent the correct classification accuracy ratios for each mode. However, the rest of the matrix values represent the misclassification with the other modes. For instance, the LG provides 87.9% correct accuracy and confuses with LG, LG, LG, and LG with 4.1%, 6.23%, 1.63%, and 0.13%, respectively. It can be observed that the misclassification ratio is large with neighboring modes and decreases as it moves away which is expected owing to the similarity of LG adjacent modes. It can be seen that mode LG is confused with neighbouring modes LG and LG. Moreover, in Figure 7b,c, the confusion for 8-ary Mux-LG and 16-ary HG formats is shown at −5 dB SJR. For Mux-LG modulation, the mode LG is confused with G and G. Moreover, for HG modulation, mode HG is confused with HG and HG.

Figure 6.
Individual mode accuracy for (a) 8-ary LG, (b) 8-ary Mux-LG, and (c) 16-ary HG modulation schemes.

Figure 7.
Confusion matrices for (a) 8-ary LG, (b) 8-ary Mux-LG, and (c) 16-ary at SJR of −5 dB.
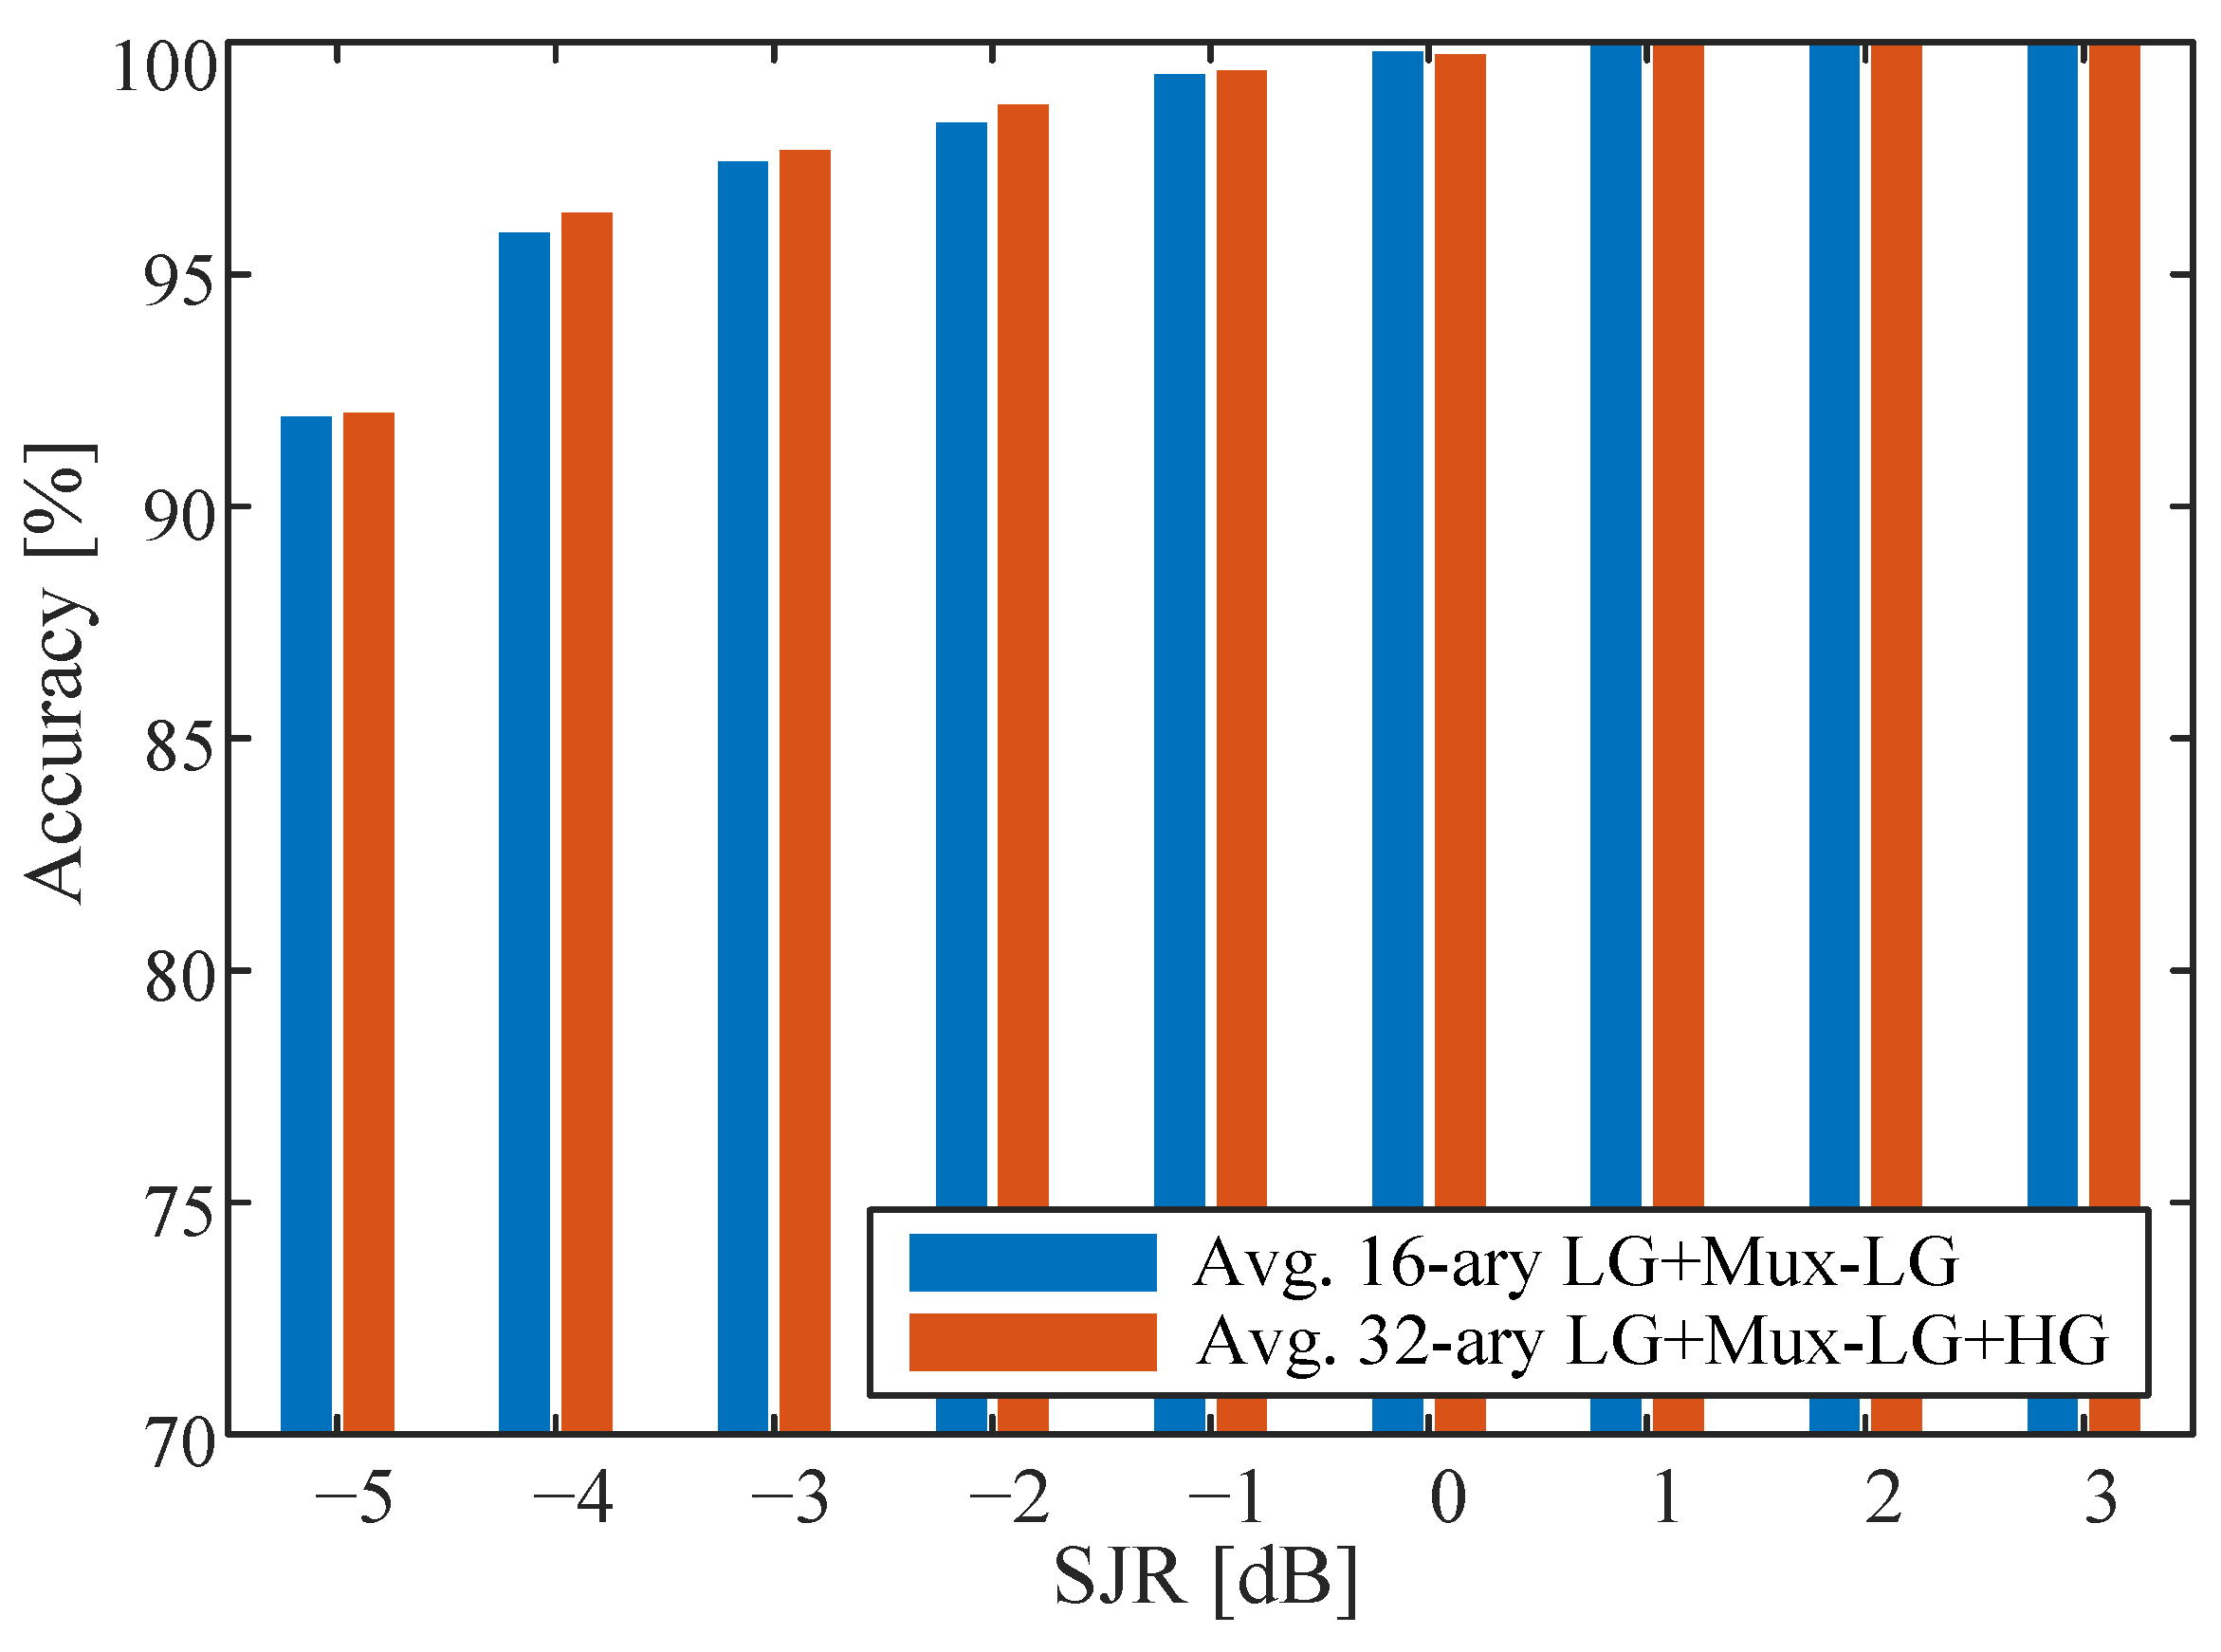
Figure 8 shows the average accuracy of 16-ary LG+Mux-LG and 32-ary LG+Mux-LG+HG modulation schemes. It can be noted that the average classification, for both modulation schemes, achieves ∼92% at −5 dB SJR. Moreover, these modulation schemes need at least 1 dB SJR to reach 100% classification accuracy. This can be explained by the high effect of the jammer on the standard LG modulation schemes. Hence, combining the standard LG modes with Mux-LG and HG patterns, to increase data transmission rate, reduces the system performance under jamming threat.
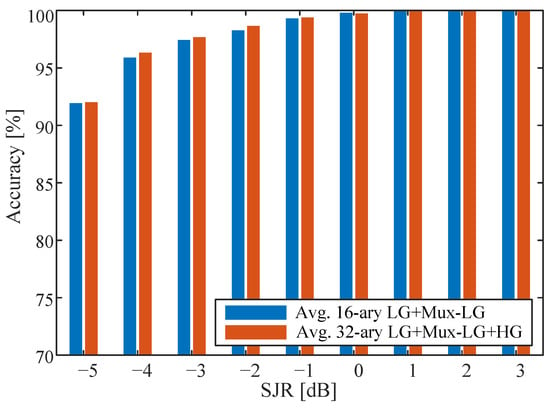
Figure 8.
Average accuracy for 16-ary LG+Mux-LG and 32-ary LG+Mux-LG+HG modulation schemes.
5.2. Jammer DoA Determination
Here, the classification methods are used to identify jammer threat direction of arrival (DoA). In this experiment, both right-hand and left-hand jammer positions with respect to the transmitter have been considered for 8-ary LG formats only (i.e., worst results reported in the previous sub-section). The dataset comprises 28,800 images created from the two jammer directions with a capturing duration of 200 s for each mode, and for SJR ranging from −5 to 3 dB with 1 dB step (i.e., total dataset size: 200 images × 2 directions × 8 modes × 9 SJR values). Two classifiers have been trained and tested using 70% and 30%, respectively, of the obtained dataset. The first classifier uses the CNN network; however, the output layer contains two nodes, which denote direction of jammer either right or left. In the second technique, a simple classifier based on LDA is used. Using this technique, each image with size (28 × 28) is flattened into one vector, resulting in an input dimensionality of N = 784. The LDA has the ability to reduce the dataset into only 1D. Then a threshold value is obtained to classify between left or right DoA.
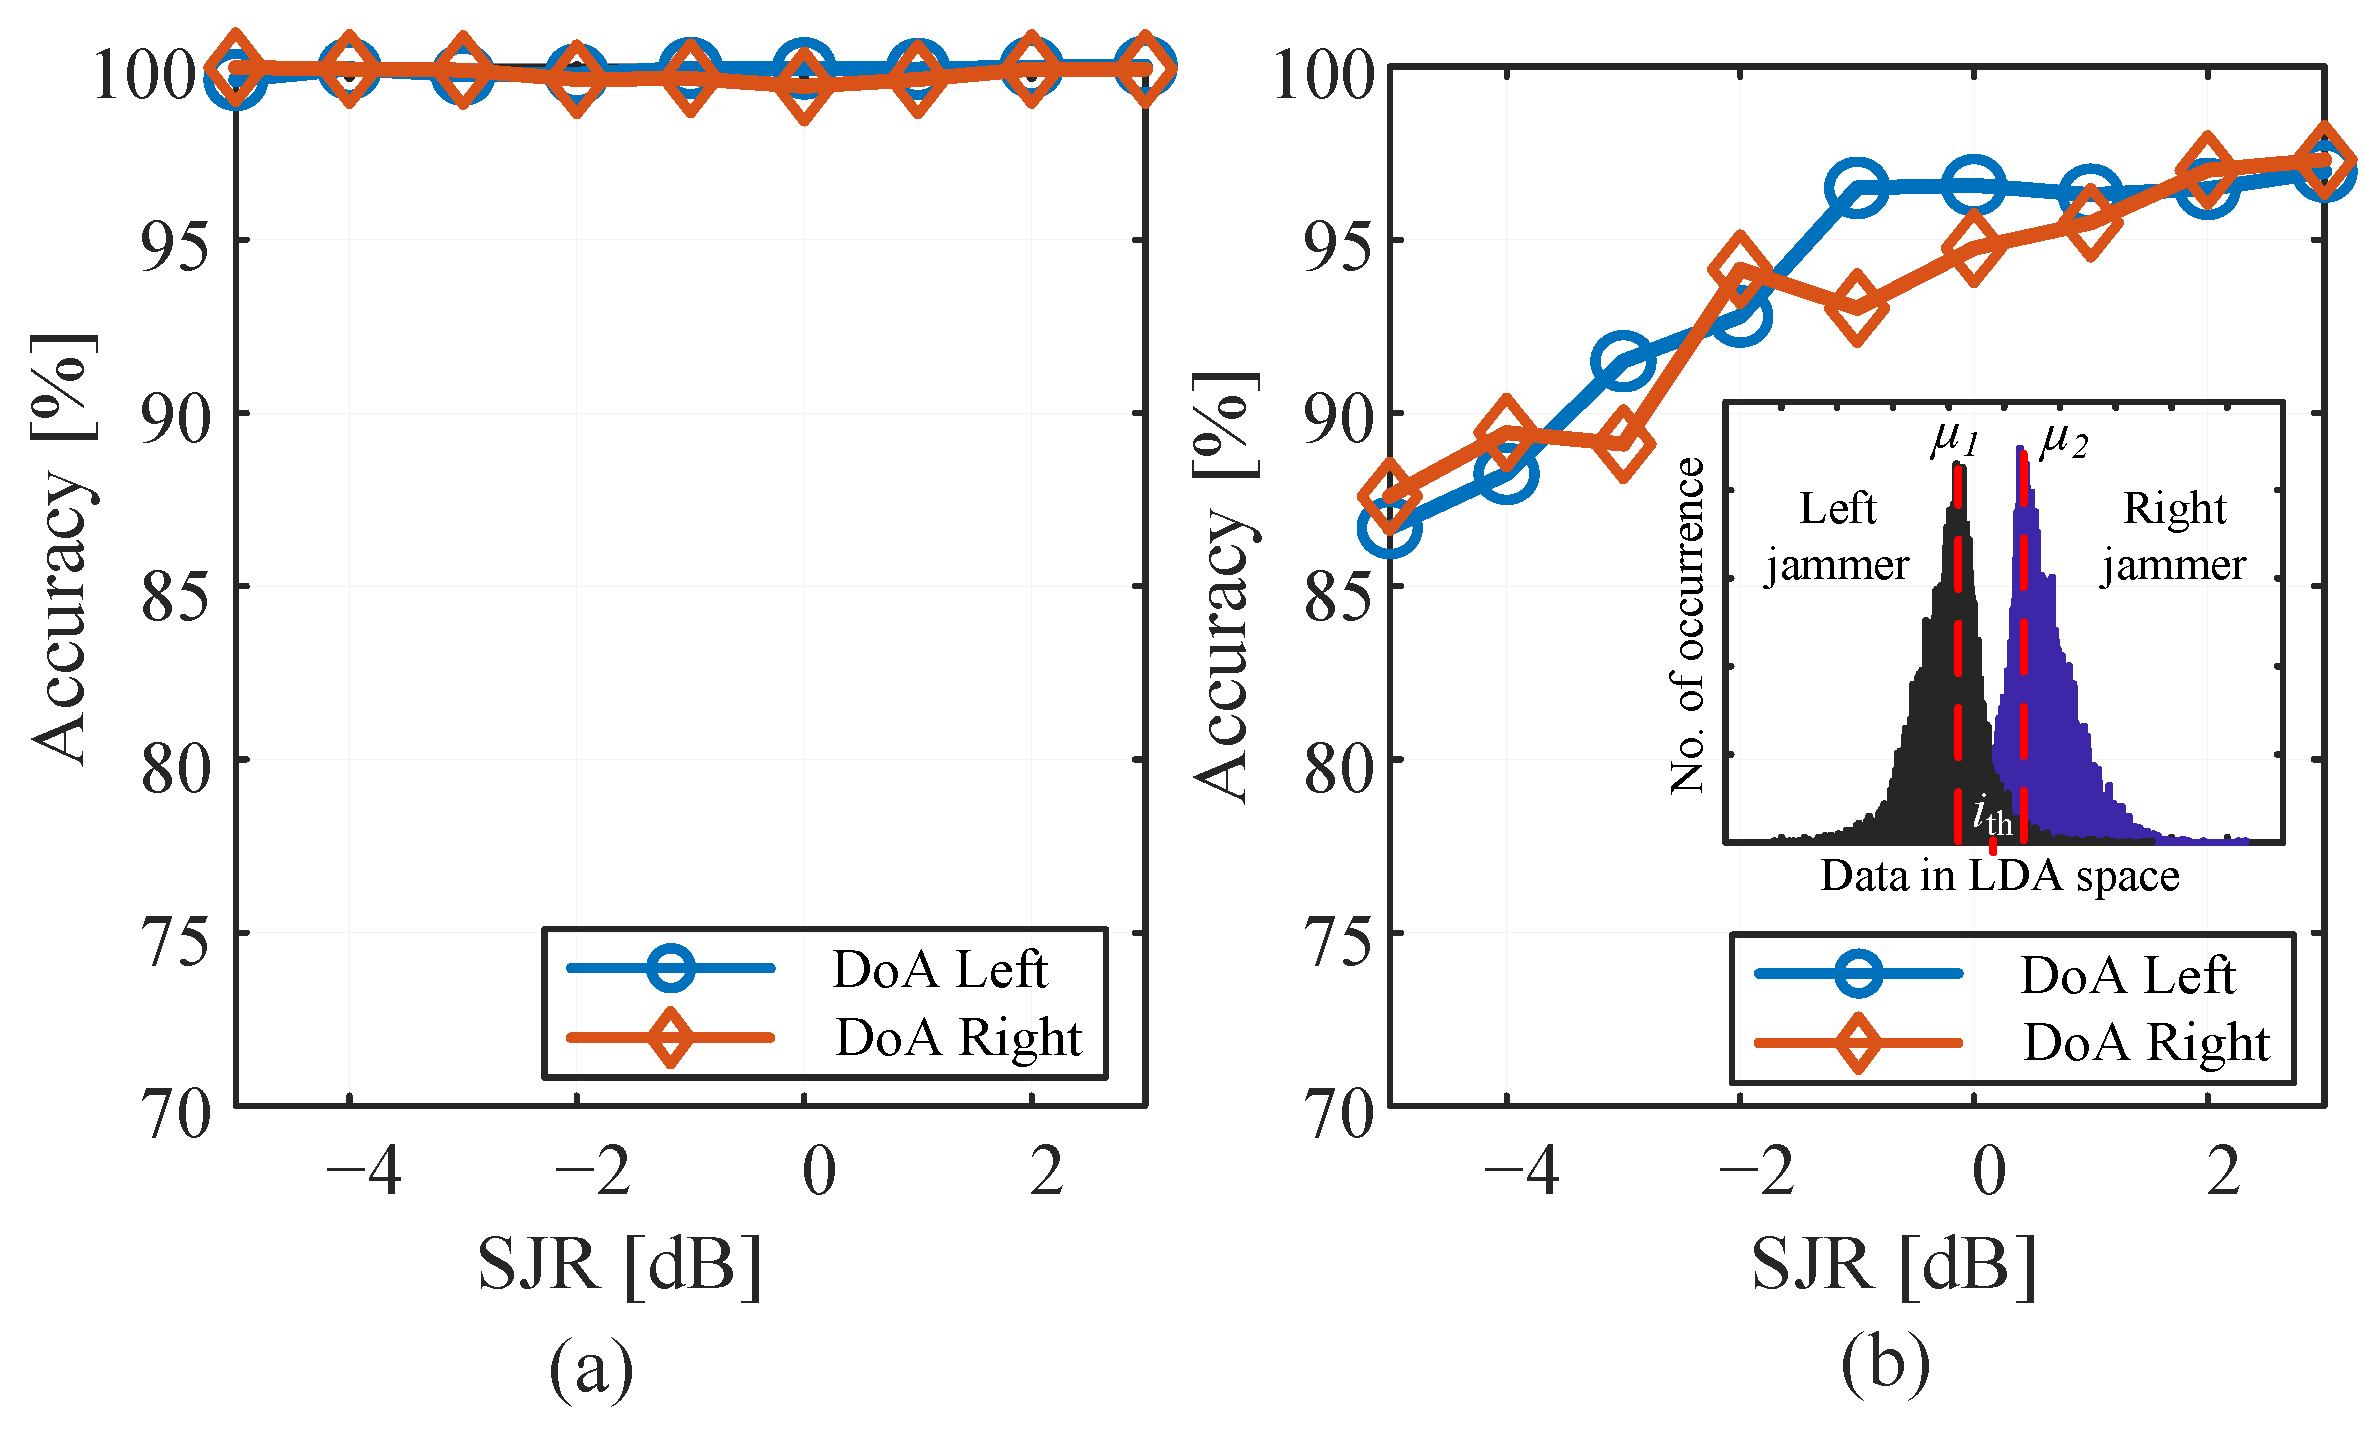
Figure 9 shows the classification performance in terms of the recognition accuracy for LDA- and CNN-based classifiers. The CNN-based method is able to identify the left and right jammer DoA with 100% accuracy for all SJRs. This could be attributed to the clear and frequent incidents of the left-hand jammer on the right-side of the received mode (see Figure 4) and the vice versa is expected for the right-hand jamming. However, exploiting LDA-based algorithm (i.e., low-complexity classifier) reduces the DoA identification to a maximum of 97% at SJR of 2 dB. Inset in Figure 9b shows the distribution of data on LDA space. It is observed that much useful information of data was preserved in 1D space, with the existence of a clear separation between the two DoA jammers, except a small region of interference. While LDA classification accuracy is less than the CNN classifier, nevertheless it gives acceptable results, especially at SJR ≥ 0 dB, where the accuracy reaches more than 95%.
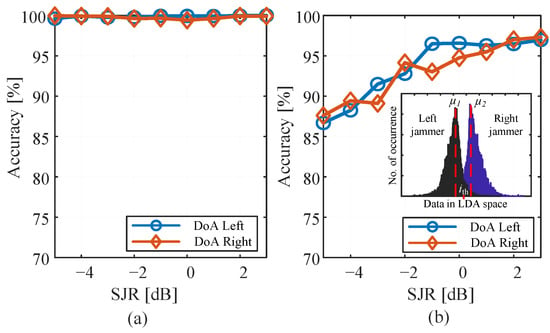
Figure 9.
Jammer DoA identification using (a) CNN-based and (b) LDA-based algorithms.
6. Discussion
The rapid evolve of FSO market size motivates the development of new methods and technologies that provide robust, reliable, fast, and secure FSO systems. This work focused on the security issue of a well-researched FSO technology that uses structured light as bit pattern codes. The demonstrated system is based on two main parts, the first is the jammer signal which is a simple off-the-shelf laser source. The second part is the data communication link which comprises an SLM (at the transmitter-side) and a CCD camera (at the receiver-side).
The practical implementation of the data communication link is limited by the cost and the switching speed (i.e., data transmission rate) of the structured light beam generator. Complex SLM can be replaced by 3D-printing microscale spiral phase plates that can generate pure structured light beams and are easily integrated with laser sources [25]. This increases the proliferation of the structured light beam generator in future FSO nodes. On the other side, the direct-detection method using a CCD camera and a robust ML algorithm reduce the hardware complexity at the receiver nodes, as they eliminate any modal decomposition process [7]. However, the limiting factors of the CCD camera are its sensitivity and frame capture rate. The former controls the free space distance; the latter limits the communication data rate.
7. Conclusions
In this paper, we investigated the performance of complex light structured patterns under human-made jamming threats. Two widely used laser mode families have been utilized to generate five modulation schemes. These are the 8-ary LG, 8-ary Mux-LG, 16-ary HG, 16-ary LG and Mux-LG, and 32-ary LG and Mux-LG and HG. Direct detection-based free space receivers with ML-based algorithm have been used to identify the attacked modes. This study showed that standard LG modes are highly affected by jamming and is not recommended for data transmission at low SJR (i.e., less than 0 dB). This can be attributed to the structural similarity of the standard Gaussian jammer and the LG profiles as opposed to Mux-LG and HG structures. Moreover, the CNN-based algorithm can identify the jammer DoA with 100% accuracy under sever jamming conditions. The work in this paper can be extended to study and investigate human-made eavesdropping of structured light signal in the coexistence of atmospheric distortions.
Author Contributions
Conceptualization, A.M.R. and S.A.A.; methodology, A.M.R. and S.A.A.; experiment, A.M.R.; software, W.S.S. and S.A.A.; validation, A.M.R. and W.S.S.; investigation, A.M.R., W.S.S., and S.A.A.; writing—original draft preparation, A.M.R. and W.S.S.; writing—review and editing, A.M.R. and S.A.A.; supervision S.A.A.; funding acquisition, S.A.A. All authors have read and agreed to the published version of the manuscript.
Funding
This research was funded by Deputyship for Research & Innovation, Ministry of Education in Saudi Arabia project number DRI-KSU-1088.
Institutional Review Board Statement
Not applicable.
Informed Consent Statement
Not applicable.
Data Availability Statement
Not applicable.
Acknowledgments
The authors extend their appreciation to the Deputyship for Research & Innovation, Ministry of Education in Saudi Arabia for funding this research work.
Conflicts of Interest
The authors declare no conflict of interest.
References
- Global Free Space Optics Communications Analysis. Available online: https://www.businesswire.com/ (accessed on 21 March 2021).
- Wang, K.; Lim, C.; Wong, E.; Alameh, K.; Kandeepan, S.; Skafidas, E. High-Speed Reconfigurable Free-Space Optical Interconnects with Carrierless-Amplitude-Phase Modulation and Space-Time-Block Code. J. Light. Technol. 2019, 37, 627–633. [Google Scholar] [CrossRef]
- Trichili, A.; Issaid, C.B.; Ooi, B.S.; Alouini, M.S. A CNN-Based Structured Light Communication Scheme for Internet of Underwater Things Applications. IEEE Internet Things J. 2020, 7, 10038–10047. [Google Scholar] [CrossRef]
- Nguyen, D.N.; Vallejo, L.; Bohata, J.; Ortega, B.; Ghassemlooy, Z.; Zvanovec, S. Wideband QAM-over-SMF/turbulent FSO downlinks in a PON architecture for ubiquitous connectivity. Opt. Commun. 2020, 475, 126281. [Google Scholar] [CrossRef]
- Ansari, N.; Fan, Q.; Sun, X.; Zhang, L. SoarNet. IEEE Wirel. Commun. 2019, 26, 37–43. [Google Scholar] [CrossRef]
- Wang, J.; Yang, J.Y.; Fazal, I.M.; Ahmed, N.; Yan, Y.; Huang, H.; Ren, Y.; Yue, Y.; Dolinar, S.; Tur, M.; et al. Terabit free-space data transmission employing orbital angular momentum multiplexing. Nat. Photonics 2012, 6, 488–496. [Google Scholar] [CrossRef]
- Krenn, M.; Fickler, R.; Fink, M.; Handsteiner, J.; Malik, M.; Scheidl, T.; Ursin, R.; Zeilinger, A. Communication with spatially modulated light through turbulent air across Vienna. New J. Phys. 2014, 16, 113028. [Google Scholar] [CrossRef]
- Trichili, A.; Park, K.; Zghal, M.; Ooi, B.S.; Alouini, M. Communicating Using Spatial Mode Multiplexing: Potentials, Challenges, and Perspectives. IEEE Commun. Surv. Tutor. 2019, 21, 3175–3203. [Google Scholar] [CrossRef]
- Huang, H.; Xie, G.; Ren, Y.; Yan, Y.; Bao, C.; Ahmed, N.; Ziyadi, M.; Chitgarha, M.; Neifeld, M.; Dolinar, S.; et al. 4 × 4 MIMO equalization to mitigate crosstalk degradation in a four-channel free-space orbital-angular-momentum-multiplexed system using heterodyne detection. In Proceedings of the 39th European Conference and Exhibition on Optical Communication (ECOC 2013), London, UK, 22–26 September 2013; pp. 1–3. [Google Scholar]
- Huang, H.; Cao, Y.; Xie, G.; Ren, Y.; Yan, Y.; Bao, C.; Ahmed, N.; Neifeld, M.A.; Dolinar, S.J.; Willner, A.E. Crosstalk mitigation in a free-space orbital angular momentum multiplexed communication link using 4 × 4 MIMO equalization. Opt. Lett. 2014, 39, 4360–4363. [Google Scholar] [CrossRef] [PubMed]
- Ren, Y.; Xie, G.; Huang, H.; Ahmed, N.; Yan, Y.; Li, L.; Bao, C.; Lavery, M.P.J.; Tur, M.; Neifeld, M.A.; et al. Adaptive-optics-based simultaneous pre- and post-turbulence compensation of multiple orbital-angular-momentum beams in a bidirectional free-space optical link. Optica 2014, 1, 376–382. [Google Scholar] [CrossRef]
- Li, J.; Zhang, M.; Wang, D.; Wu, S.; Zhan, Y. Joint atmospheric turbulence detection and adaptive demodulation technique using the CNN for the OAM-FSO communication. Opt. Express 2018, 26, 10494–10508. [Google Scholar] [CrossRef] [PubMed]
- Ragheb, A.; Saif, W.; Trichili, A.; Ashry, I.; Esmail, M.A.; Altamimi, M.; Almaiman, A.; Altubaishi, E.; Ooi, B.S.; Alouini, M.S.; et al. Identifying structured light modes in a desert environment using machine learning algorithms. Opt. Express 2020, 28, 9753–9763. [Google Scholar] [CrossRef] [PubMed]
- El-Meadawy, S.A.; Shalaby, H.M.; Ismail, N.A.; Abd El-Samie, F.E.; Farghal, A.E. Free-space 16-ary orbital angular momentum coded optical communication system based on chaotic interleaving and convolutional neural networks. Appl. Opt. 2020, 59, 6966–6976. [Google Scholar] [CrossRef] [PubMed]
- Ji, J.; Zheng, Z.; Peng, F.; Zhang, J.; Wu, B.; Xu, M.; Wang, K. 10 Gb/s Two-User Spatial Diversity FSO-CDMA Wiretap Channel Based on Reconfigurable Optical Encoder/Decoders. IEEE Access 2020, 8, 38941–38949. [Google Scholar] [CrossRef]
- Paul, P.; Bhatnagar, M.R.; Jaiswal, A. Alleviation of Jamming in Free Space Optical Communication over Gamma-Gamma Channel with Pointing Errors. IEEE Photonics J. 2019, 11, 1–18. [Google Scholar] [CrossRef]
- Paul, P.; Bhatnagar, M.R.; Jaiswal, A. Jamming in Free Space Optical Systems: Mitigation and Performance Evaluation. IEEE Trans. Commun. 2020, 68, 1631–1647. [Google Scholar] [CrossRef]
- Chauhan, I.; Paul, P.; Bhatnagar, M.R.; Nebhen, J. Performance of optical space shift keying under jamming. Appl. Opt. 2021, 60, 1856–1863. [Google Scholar] [CrossRef] [PubMed]
- Allen, L.; Beijersbergen, M.W.; Spreeuw, R.J.C.; Woerdman, J.P. Orbital angular momentum of light and the transformation of Laguerre–Gaussian laser modes. Phys. Rev. A 1992, 45, 8185–8189. [Google Scholar] [CrossRef] [PubMed]
- Siegman, A.E. Lasers; University Science Books: Mill Valley, CA, USA, 1986. [Google Scholar]
- Siegman, A. How to (Maybe) Measure Laser Beam Quality. DPSS (Diode Pumped Solid State) Lasers: Applications and Issues; Optical Society of America: Washington, DC, USA, 1998; p. MQ1. [Google Scholar] [CrossRef]
- Bishop, C.M. Pattern Recognition and Machine Learning; Springer: Berlin/Heidelberg, Germany, 2006. [Google Scholar]
- Kingma, D.P.; Ba, J. Adam: A method for stochastic optimization. arXiv 2014, arXiv:1412.6980. [Google Scholar]
- Tharwat, A.; Gaber, T.; Ibrahim, A.; Hassanien, A.E. Linear discriminant analysis: A detailed tutorial. AI Commun. 2017, 30, 169–190. [Google Scholar] [CrossRef]
- Stegenburgs, E.; Bertoncini, A.; Trichili, A.; Alias, M.S.; Ng, T.K.; Alouini, M.S.; Ooi, B.S. Near-Infrared OAM Communication Using 3D-Printed Microscale Spiral Phase Plates. IEEE Commun. Mag. 2019, 57, 65–69. [Google Scholar] [CrossRef]
Publisher’s Note: MDPI stays neutral with regard to jurisdictional claims in published maps and institutional affiliations. |
© 2021 by the authors. Licensee MDPI, Basel, Switzerland. This article is an open access article distributed under the terms and conditions of the Creative Commons Attribution (CC BY) license (https://creativecommons.org/licenses/by/4.0/).

