Article

Indoor and Outdoor Surface Measurement of 3D Objects under Different Background Illuminations and Wind Conditions Using Laser-Beam-Based Sinusoidal Fringe Projections

Research Center for Quantum Optics and Quantum Communication, School of Science, Qingdao University of Technology, Qingdao 266525, China
*
Author to whom correspondence should be addressed.
These authors contributed equally to this work.
Photonics 2021, 8(6), 178; https://doi.org/10.3390/photonics8060178
Submission received: 26 April 2021 / Revised: 17 May 2021 / Accepted: 21 May 2021 / Published: 22 May 2021
(This article belongs to the Special Issue Advances in Optical Metrology)

Abstract

:
In this study, both theoretical analysis and experimental validation are carried out for 3D surface measurement under different indoor/outdoor environmental conditions via combining the projected laser-beam-based sinusoidal optical signal, the optical filtering technique, and the single-shot approach based on Fourier transform profilometry. The designed optical signal generator used in this work is capable of ensuring that the projected fringe pattern is monochromatic, higher-contrast, time-invariant, and truly sinusoidal. The proposed and developed optical setup of 3D surface measurement is portable and is used for in-situ experiments of 3D surface measurements that have been carried out under different sunlight illuminations. The experimental results indicate that accurate reconstructions of measured objects with even or varying surface reflectivity can be obtained under windy conditions and strong environmental illuminations such as the background illuminance of 5600–35,000 Lux. The generated fringe-pattern signal is not sensitive to vibrations from environmental influences including the effects of the wind, which has overcome the outdoor-measurement restrictions of the traditional interferometric system and the profilometry approaches based on phase-shifting methods.

1. Introduction

There has been a demand of methods and technologies for non-contact and high-resolution shape measurement of three-dimensional (3D) objects, which is expected to have applications in in-situ industrial inspection of manufactured parts, target recognition, corrosion analysis, measurement of surface roughness, and biomedical applications such as 3D intra-oral dental measurements and non-invasive 3D imaging and monitoring of vascular wall deformations [1,2]. 3D surface measurement using the structured light techniques [3,4,5] has been attracting increasing attention in the field of optical profilometry and related applications. As indicated in recent review articles [2,6], one of the challenging issues in this field is still the development of new fringe-projection technology and hardware, for improving the accuracy, resolution, and speed of a 3D-shape imaging system.
In the diagram of a typical system with structured light, there are two basic parts: one part is the projector for generating structured illuminating patterns onto the observed object, and the other part is a camera for measuring distorted structured patterns on the target, while the projection of structured light patterns has been considered as the critically important part. For generating the structured signal of projecting light, there have been some useful and successful approaches [7], such as the interferometry with monochromatic light [8,9,10,11], projection using grating with white light [12], the acousto-optic fringe projection [13,14,15], the encoded projection techniques [16], the approach with a sinusoidal phase grating [17], and the DMD-chip-based digital-light-processing (DLP) projector [1,2,18]. However, the structured optical signal generated using interferometry is very sensitive to vibrations from environmental influences including the structural vibration of the system and the air disturbance, which can weaken the temporal coherence, and yield low-contrast sinusoidal signal since it is difficult to adjust the spatial frequency and obtain a high-spatial-frequency signal. For the method using white-light grating, it usually uses Ronchi grating for which it is difficult to obtain the sinusoidal structured signal. Note that the white-light grating method is basically unable to complete a dynamic and real-time measurement with adjustable spatial frequencies. The higher spatial frequency can be obtained using the acousto-optic approach, but the generating system is complicated compared to others. Noises are possibly introduced when the encoded projection is used in profilometry. The spatial frequency of the sinusoidal structured signal generated by a DLP projector is usually lower, while the illuminating area is also relatively limited.
Even sinusoidal patterns generated with a DLP projector are widely used, it does have its limitations such as the requirement of precise synchronization, speed limit of measurement, and the nonlinear gamma effect of the DLP projector [19]. Note that the laser-based DLP projector still uses a DLP chipset, but its light source is laser-based instead of light-based, while the laser-based DLP projector also has the drawbacks of a typical DLP projector. Thus, there has still been a very challenging need for developing methods that can generate sinusoidal fringe patterns for improving the 3D surface profilometry accuracy.
Moreover, 3D surface measurement under outdoor environmental conditions has been extremely challenging, since the available methods are unable to go through the restrictions of vibrations from environmental influences and effects of background illumination from sunlight. Meanwhile, for another challenging issue of carrying out 3D surface measurement of objects with a wide range of reflectance [20], there have been some recently developed techniques such as the dynamic projection theory [21], the approach utilizing the transitioning state of digital micromirror device [22], and the method with a dual optical sensing configuration via combining the diffuse reflective light and the specular surface light [23]. However, these techniques might only be allowed for applications of indoor measurements or under dark environmental conditions.
Generally speaking, the most existing techniques basically suffer the main drawbacks as follows: First of all, phase-shifting-based methods and techniques have a rigorous requirement that the observed target has to remain still during the measuring time, thus vibrations caused by the surrounding environment such as the wind or the observed target itself such as the human breathing during a medical scan will prohibit the practical measurements. Next, if the projected pattern is based on the sinusoidal fringe generated by DLP projector, the intensity deviation of the sinusoidal-fringe curve affected by the Gamma effect and defocusing issue will result in errors of target measurement. Finally, for structured-pattern projections with white light, background illumination is mostly not allowed during the measurement, which indicates that outdoor in-situ measurements of usual objects will be impossible.
Therefore, the purpose of this work will focus on the introduction and analysis of the designed optical system for generating laser-beam-based sinusoidal optical fringe patterns and the experimental measurements and reconstruction of objects for both indoor and outdoor conditions. Note that, in addition to the object surface with the same material and isotropic reflectance, we will apply our approach for measuring the surface shape of object with a wide range of reflectance under different background illuminance, which is based on the combination of the laser-beam-based sinusoidal optical fringe patterns generated using our designed optical system, Fourier transform profilometry (FTP), and the optical filtering processing technique.

2. The Designed Optical System and Theoretical Analysis

An important part of this work is to design and develop an optical system for the sinusoidal optical signal generator. The basic goal of our design is twofold: the first objective is to obtain monochromatic, high contrast, high quality, and truly sinusoidal fringes, and the second one is to overcome the shortcomings of the traditional interferometric system. We know that a interferometric system is usually complex and sensitive to vibrations from environmental influences including the structural vibrations of the operating system and air disturbances from the surrounding environment, which have imposed restrictions on the applications of outdoor and production line in-situ measurement.

2.1. Experimental Methodologies Using the Designed Optical System

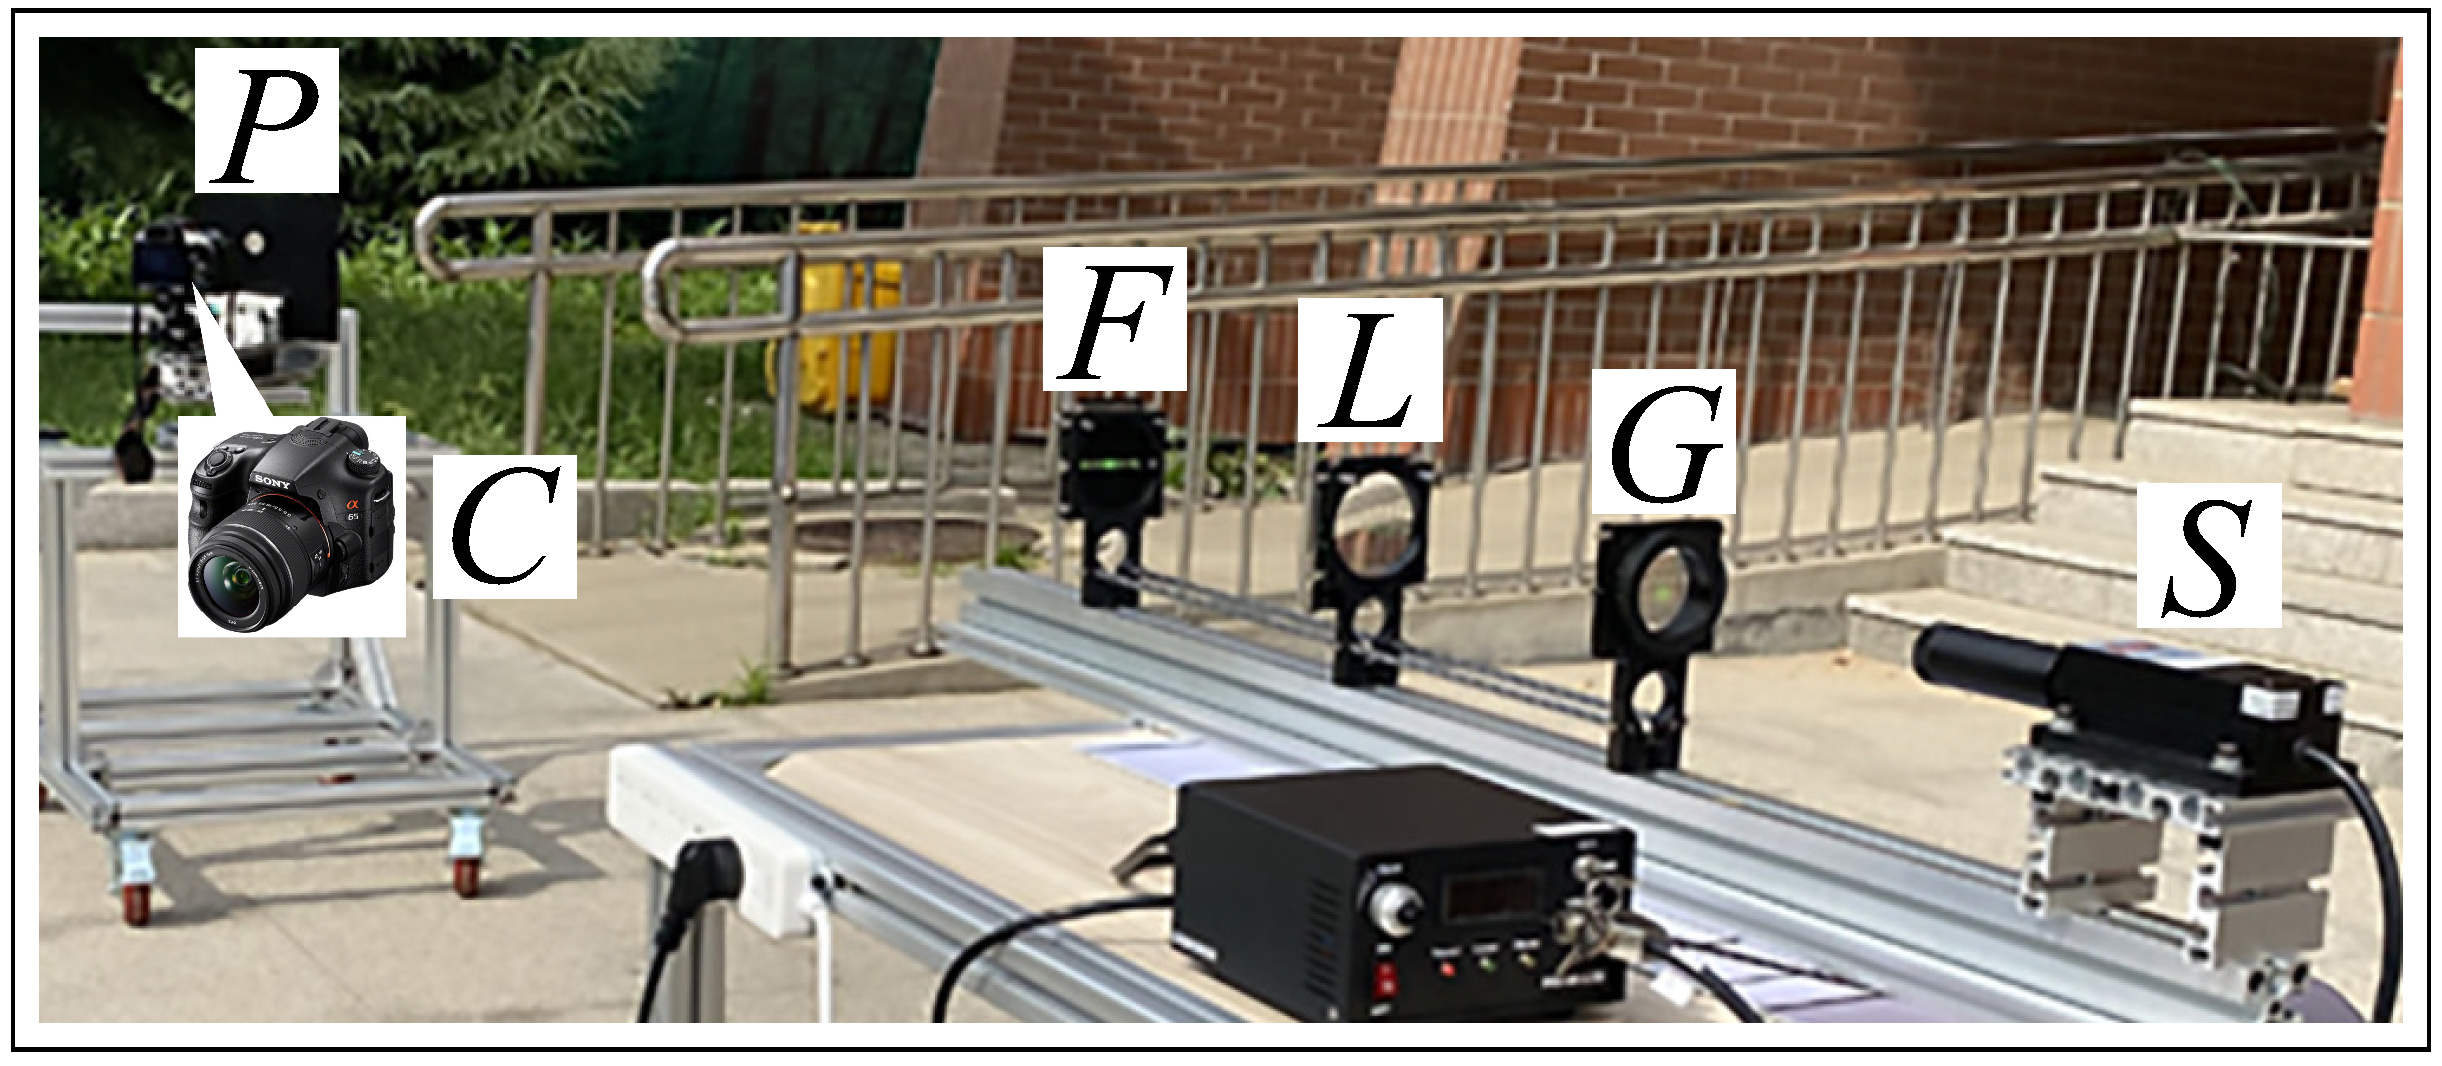
Figure 1 is the photo of experimental setup of in-situ measurement under the sunlight, while the parts S, G, L, and F in Figure 1 are the main components of the sinusoidal optical signal generator. The optical system starts with a CW-laser source S with the wavelength λ = 532 nm, maximum output power of 200 mW, and a small divergence angle ( 1.5 ). A rectangular grating G illuminated by the laser beam is placed at a front focal point of a positive lens L. On the conjugate plane of S, an adjustable spatial-frequency filter F is set, which is considered that the part F plays a critical role in this system. For this spatial-frequency filter, a V-shape aperture with a width of 0.5 mm is carved with high precision, we can then choose and allow the selected order of the spatial frequency to pass through. The output of a sinusoidal fringe pattern can then be observed on the plane P, as indicated in Figure 1. Note that the design of this adjustable spatial-frequency filter F containing three accurately-cut slits is actually based on our previous work of measuring modulation transfer function [24] and a recent study on human face imaging [25].
Since the focus of this investigation is the indoor and outdoor surface measurement of 3D Objects under different background illuminations and wind conditions, there will be two environmental parameters, the background illuminance E, and the wind speed v w i n d , to be measured. For both indoor and outdoor measurements, the real-time background illuminance E was measured using a digital luxmeter placed beside the observation plane P. Note that the digital luxmeter should not be illuminated by the signal of the projected fringe pattern when the background illuminance is being measured. The wind speed of indoor measurement is set to zero. For outdoor measurement, the real-time wind speed v w i n d of the measuring period was monitored and measured using a digital anemometer.

2.2. Mathematical Description of the Sinusoidal Optical Signal Generator

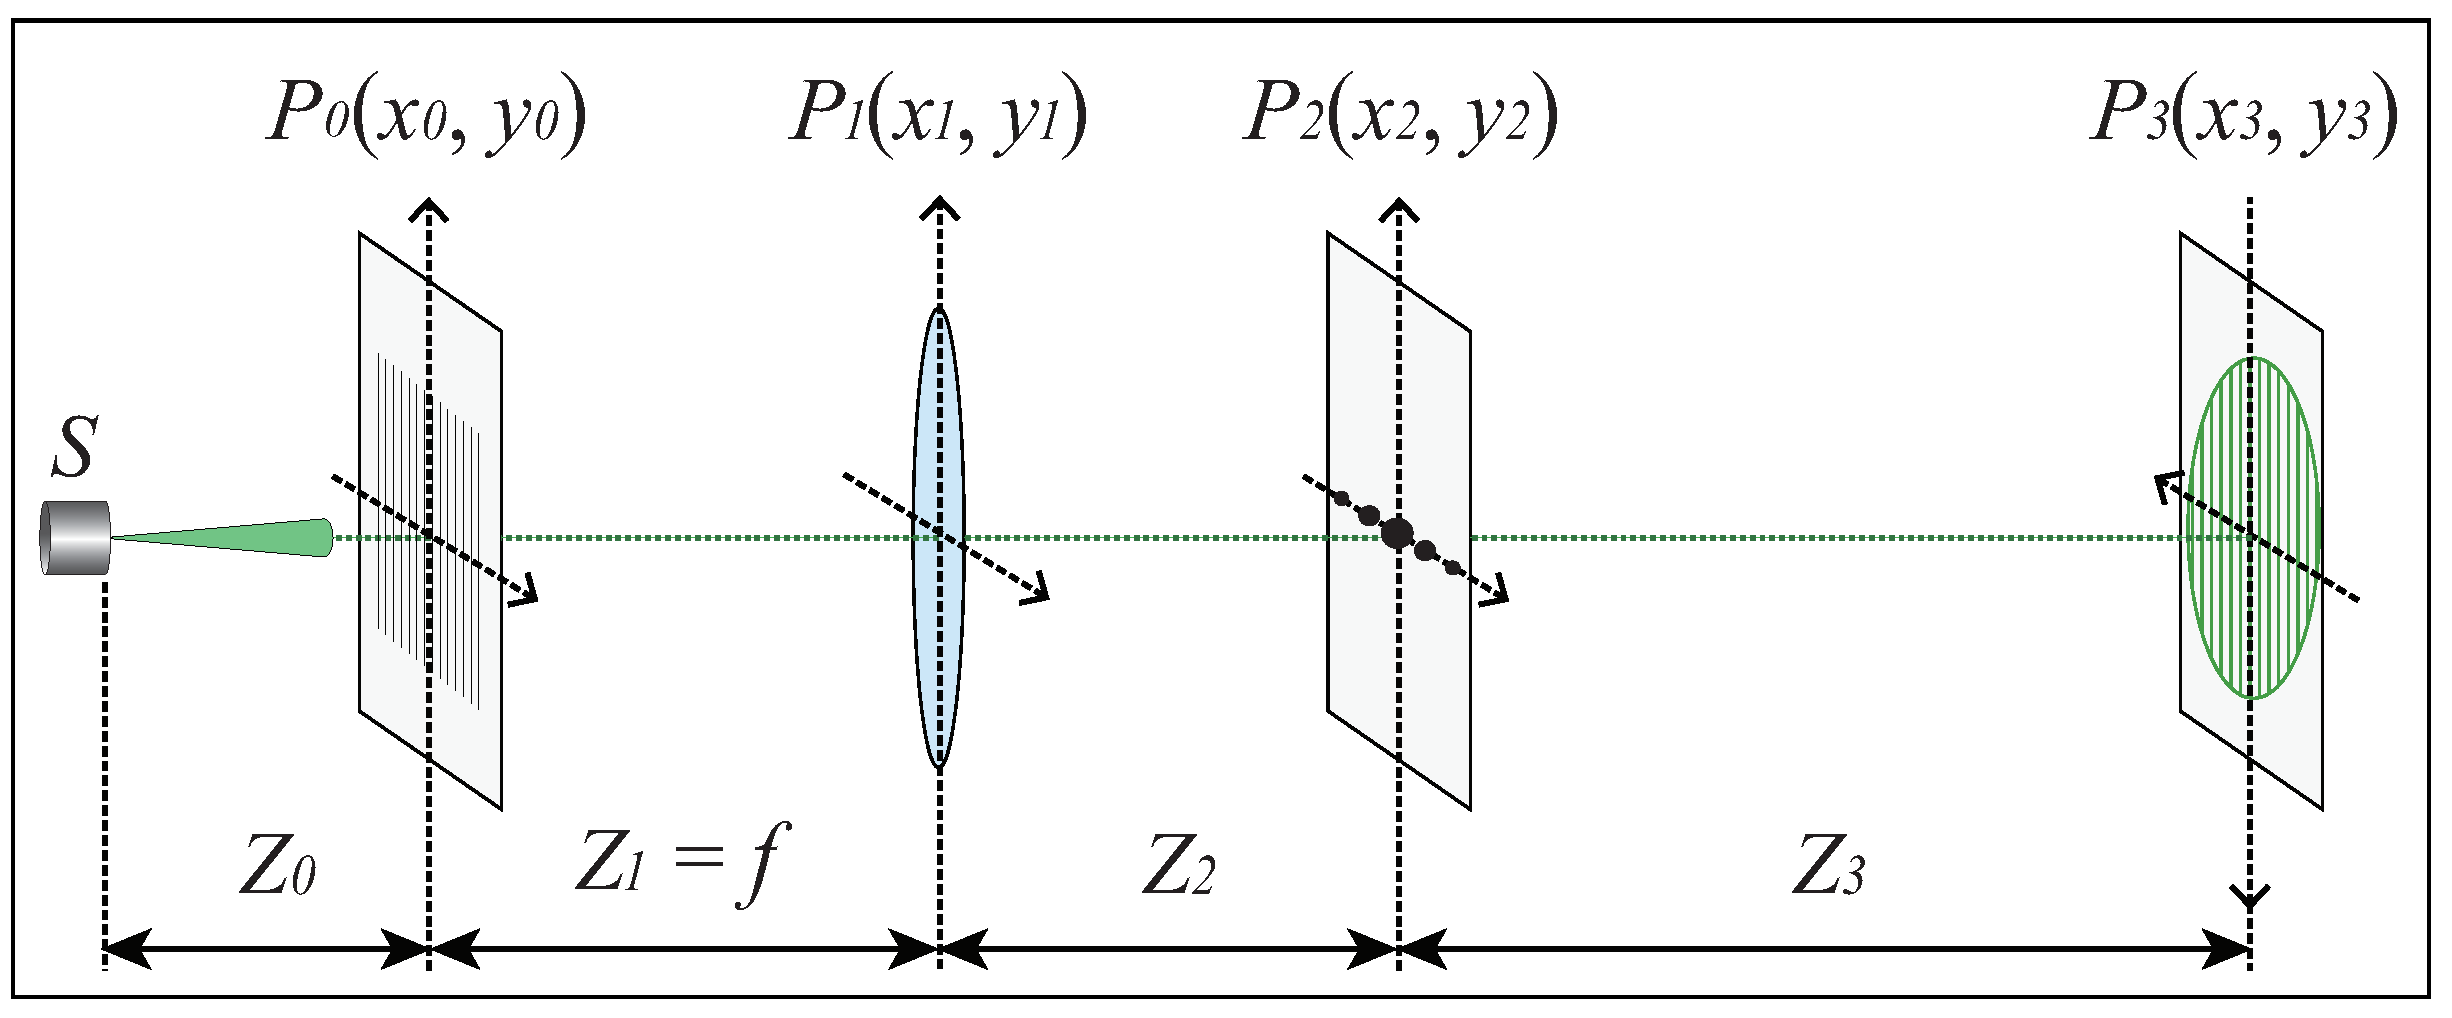
The theoretical description of the sinusoidal fringe pattern generated by the optical system described in Figure 1 is given as follows. A schematic diagram of Figure 1 can be sketched using Figure 2, which will be used to derive a mathematical expression for the sinusoidal fringe pattern obtained at the observation plane P in Figure 1, i.e., the plane P 3 in Figure 2. For other planes in Figure 2, the grating G is located at plane P 0 , the positive lens L is at plane P 1 , and the plane P 2 is the position of the spatial-frequency filter F.
The filed U ( r ) from a continuous-wave point source laser S can be described as
U ( r ) = A r e i k r ,
where A is a complex constant related to the laser power, and r = x 2 + y 2 + z 2 . Taking A = 1 for simplicity and using the paraxial approximation, the field U 0 ( x 0 , y 0 ) behind the grating G at the plane P 0 is given by
U 0 ( x 0 , y 0 ) = 1 Z 0 e i k Z 0 e i k 2 Z 0 ( x 0 2 + y 0 2 ) t 0 ( x 0 , y 0 ) ,
where Z 0 is the distance between the laser source S and grating G, and t 0 ( x 0 , y 0 ) the transmission function of G. Considering that G is one-dimensional, t 0 ( x 0 , y 0 ) can be described using
t 0 ( x 0 , y 0 ) = t 0 ( x 0 ) = rect ( x 0 a ) 1 d comb ( x 0 d ) circ 2 | x 0 | H ,
where x 0 and y 0 are the coordinate variables of P 0 , and a and d are the optical parameters of grating G. H is the grating width, which is assumed, for the sake of simplicity, to be the diameter of the illumination spot of the laser.
Note that the propagation of field U 0 ( x 0 , y 0 ) from plane P 0 to plane P 1 is within the Fresnel region. The field U 1 ( x 1 , y 1 ) in front of the lens L at plane P 1 is given by
U 1 ( x 1 , y 1 ) = C 1 Σ 0 U 0 ( x 0 , y 0 ) e i k 2 Z 1 [ ( x 1 x 0 ) 2 + ( y 1 y 0 ) 2 ] d x 0 d y 0 ,
where C 1 = 1 i λ Z 1 e i k Z 1 is a complex constant, and Z 1 is the distance between the planes P 0 and P 1 . The field U 1 ( x 1 , y 1 ) after the lens L at plane P 1 can be written as
U 1 ( x 1 , y 1 ) = U 1 ( x 1 , y 1 ) t L ( x 1 , y 1 ) = U 1 ( x 1 , y 1 ) e i k 2 f ( x 1 2 + y 1 2 ) ,
where t L ( x 1 , y 1 ) = e i k 2 f ( x 1 2 + y 1 2 ) denotes the transmission function of the lens L.
The propagating field U 1 ( x 1 , y 1 ) at plane P 1 to U 2 ( x 2 , y 2 ) at plane P 2 can be accurately computed using Fresnel diffraction. U 2 ( x 2 , y 2 ) denotes the field in front of the spatial-frequency filter F, and is given by
U 2 ( x 2 , y 2 ) = C 2 Σ 1 U 1 ( x 1 , y 1 ) e i k 2 Z 2 [ ( x 2 x 1 ) 2 + ( y 2 y 1 ) 2 ] d x 1 d y 1 ,
where C 2 = 1 i λ Z 2 e i k Z 2 is a complex constant, and Z 2 is the distance between the planes P 1 and P 2 . Combining Equations (2)–(6) as well as the expression of t L ( x 1 , y 1 ) , we have
U 2 ( ω ) = a C 3 d m = sinc a m d J 1 [ π H ( ω m / d ) ] ω m / d ,
where J 1 [ π H ( ω m / d ) ] is the Bessel function of the first kind, ω = 2 π f x with the spatial frequency f x at plane P 2 defined by f x = x 2 λ f , and C 3 is a complex constant given by C 3 = 1 λ f Z 0 e i [ k ( Z 0 + Z 1 + Z 2 ) π / 2 ] .
The role of the adjustable spatial-frequency filter F at plane P 2 is to select a ± m -th order spectrum described in Equation (7), and let them pass through it, and here we take m = 1 . We then get the field U 2 ( x 2 , y 2 ) right behind the filter F in the following form:
U 2 ( x 2 , y 2 ) = U 2 ( ω ) = U 2 ( ω ) | m = ± 1 = a C 1 d sinc a d { J 1 [ π H ( ω 1 / d ) ] ω 1 / d + J 1 [ π H ( ω + 1 / d ) ] ω + 1 / d } .
The propagation of field U 2 ( x 2 , y 2 ) from plane P 2 to P 3 can also be analyzed using Fresnel diffraction, which let the field U 3 ( x 3 , y 3 ) at plane P 3 to be given by
U 3 ( x 3 , y 3 ) = C 4 Σ 2 U 2 ( x 2 , y 2 ) e i k 2 Z 3 [ ( x 3 x 2 ) 2 + ( y 3 y 2 ) 2 ] d x 2 d y 2 ,
where C 4 = 1 i λ Z 3 e i k Z 3 is also a complex constant, and Z 3 is the distance between the planes P 2 and P 3 . Considering that the size of Σ 2 ( x 2 , y 2 ) ( 4 mm in diameter) is much less than that of Σ 3 ( x 3 , y 3 ) , i.e., the spot size of the sinusoidal fringe pattern ( 100 mm in diameter), we take an approximation that λ f ( f x 2 + f y 2 ) 2 ( f x x 3 + f y y 3 ) for further derivation of Equation (9). Equation (9) then becomes
U 3 ( x 3 , y 3 ) = C 5 Σ 2 U 2 ( f x , f y ) e i 2 π ( f x f x 3 Z 3 + f y f y 3 Z 3 ) d f x d f y = C 5 F 1 { U 2 ( f x , f y ) } ,
where the complex parameter C 5 is given by C 5 = λ f 2 Z 3 e i ( k Z 3 π / 2 ) e i k 2 Z 3 ( x 3 2 + y 3 2 ) .
Equation (10) indicates that the field at the observation plane P 3 is an inverse Fourier transform of the field output from the spatial-frequency filter F. Combining Equations (8) and (10), we have
U 3 ( x 3 ) = C 6 · circ 2 f | x 3 | H Z 3 · cos 2 π f x 3 d Z 3 ,
C 6 = 2 f Z 0 Z 3 π sin a π d e i [ k ( Z 0 + Z 1 + Z 2 + Z 3 ) π ] e i k 2 Z 3 ( x 3 2 + y 3 2 ) .
Obviously, C 6 is a complex constant for determined spatial distances Z 0 and Z 3 , and the modulus of C 6 represents the amplitude of the generated sinusoidal signal. We see that the fringe intensity will decrease as Z 3 increases since f and Z 0 are generally parameters with fixed values. The part of circ 2 f | x 3 | H Z 3 in Equation (11) results in a definition of the range of the fringe pattern with a circle of radius H Z 3 2 f . The term of cos 2 π f x 3 d Z 3 is the key part of output of the designed optical system, i.e., the expression of a sinusoidal curve.

2.3. Physical Characteristics of the Generated Sinusoidal Fringe Pattern

From Equation (11), it can be seen that the c o s i n e term in Equation (11) has only one variable x 3 at the plane P 3 along the x 3 -axis, which indicates that the output of this system is monochromatic, high contrast, and truly sinusoidal fringes. The c o s i n e term also includes the information that the fringe width (related to the spatial frequency of the output fringe pattern) will increase as Z 3 increases, which might be useful and important for 3D surface measurement.
The light-intensity distribution of the sinusoidal fringe pattern generated using the developed optical system is measured using a CMOS camera, and the camera uses an Aptina CMOS sensor with the sensor size of 5.70 × 4.28 mm and each pixel size of 2.2 × 2.2 μm. Due to the fact that the laser power is high, the exposure time and the γ value of the camera must be carefully adjusted for obtaining a color picture of the fringe pattern with good quality, as shown in Figure 3a.
The measured light-intensity distribution of the sinusoidal fringe pattern is compared with the standard sine function in Figure 3b. Fringe contrast denoted by ( I m a x I m i n ) / ( I m a x + I m i n ) is one important measure of the output pattern quality, while the fringe contrast of the sinusoidal signal curve shown in Figure 3b is 0.847 with I m a x and I m i n being 137.6 and 11.4, respectively, which responds to the measurement of M 3 in Figure 3c. The background illumination of the measurement M 1 M 6 in Figure 3c is 1.7, 3.2, 4.1, 4.9, 6.0, and 6.8 L u x , respectively, which results in the contrast of the same sinusoidal curve having different values, i.e., 0.985 ( M 1 ), 0.893 ( M 2 ), 0.886 ( M 3 ), 0.847 ( M 4 ), 0.844 ( M 5 ), and 0.745 ( M 6 ). The difference or the error between the measured intensity curve and that of the standard sine function, as indicated in Figure 3b, may have over-estimated the real error value, since the measured intensity distribution is affected by the nonlinear gamma effect of the CMOS camera, dark current, lab background light noises, and other possible items from the measuring instruments and related hardware devices.
Figure 3c indicates that the fringe contrast will decrease as the background illumination goes up. However, the optical filter can be employed for removing the effect of background illumination to remain the fringe contrast and improve the accuracy of reconstruction.
Based on Equation (11) and the related derivation process, it should be noted that the output fringe pattern is not affected by the focusing issue at all, which is different from the focusing feature of the fringe pattern generated by a DLP projector, an image with programmed intensity distribution.

3. Experimental Results of Measuring 3D Objects under Different Indoor/Outdoor Conditions

3.1. 3D Measurement Framework with Optical Filtering

For the processing of measured data for the retrievals of phase and 3D-surface height, a typical triangulation framework of 3D surface measurement based on FTP is adopted. However, as indicated by Figure 3c, the fringe contrast will decrease dramatically if the background illumination increases. Considering that the illuminated fringe pattern is monochromatic with wavelength at λ = 532 nm, an optical bandpass filter centered at 532 nm with FWHM being 20 nm is used for removing the effects of background illuminations. Based on the descriptions above, the sinusoidal fringe pattern can be described using
I ( x 3 , y 3 ) = U 3 ( x 3 , y 3 ) U 3 * ( x 3 , y 3 ) ,
where U 3 ( x 3 , y 3 ) = U 3 ( x 3 ) that is given in Equation (11), and x 3 is the only variable in this equation at the object plane along the x 3 -axis for describing the illuminated fringe patterns. After the optical filtering, the algorithm of phase retrieval and surface-height computation is basically similar to the theoretical analyses of Takeda and Mutoh [3], Rajoub et al. [26], and Maurel and co-workers [27].

3.2. Measuring a Coin with Different Background Illuminances

A coin of the diameter 27 mm is selected as the first object to be measured. For indoor measurement, the background illuminance E was adjusted using LED lights, for the cases of E = 0 L u x and E = 1000 L u x , respectively. For outdoor measurement, the wind speed v w i n d of the measuring period was measured using a digital anemometer and recorded as v w i n d = 3.2 6.5 m/s. The outdoor background illuminance E was adjusted using natural sunlight and an umbrella, for the cases of E = 12,200 L u x and E = 35,000 L u x , respectively, while the weather condition was clear when the outdoor experiments were being carried out as indicated in Figure 1.
A sinusoidal optical fringe pattern generated using the optical setup described in Figure 1 with spatial frequency of 8 lp/mm is used to illuminate the selected coin. Figure 4 shows the illuminated coin and its retrieval for background illuminance E = 0 L u x . We see from Figure 4 that the illuminated coin of Figure 4a is a little brighter than that of Figure 4b, even E = 0 L u x , which is due to the fact that the optical filtering affects the exposure compensation of the camera. For the retrieved coins shown in Figure 4c,d, both yield accurate reconstructions, and it does not indicate any distinct difference, which means that optical filtering is not necessary if there is no environmental illumination. When environmental illumination exists, the illuminated sinusoidal optical signal will be modulated by the noise due to the background illumination, as indicated by Figure 5a and Figure 6a below, or even be almost buried by the noise, as shown in Figure 7a below.
When the background illuminance changes from E = 1000 L u x to E = 35,000 L u x as shown in Figure 5, Figure 6, Figure 7 and Figure 8, the optical filtering plays a critically important role for realizing accurate retrievals. Figure 4a, Figure 5a, Figure 6a, and Figure 7a are the coin images with illuminated fringe patterns without optical filtering, and Figure 4b, Figure 5b, Figure 6b, and Figure 7b are the coin images with illuminated fringe patterns with optical filtering. The reason that one cannot see the fringe pattern could be that the spatial frequency of the projected fringe pattern is very high (8 lp/mm). Figure 7e,f are the enlarged parts for Figure 7a,b, respectively, which is capable of telling the difference between the images of the object projected with fringe pattern for two measuring conditions: (i) Figure 7e, measurement without optical filtering: (ii) Figure 7f, measurement with optical filtering. Without using optical filtering, the accuracy of coin retrieval shown in Figure 5c ( E = 1000 L u x ) is worse than that of Figure 4c ( E = 0 ), the quality of Figure 6c (E = 12,200 L u x ) is getting much worse, and the result of Figure 7c (E = 35,000 L u x ) is almost useless. The combination of optical filtering and the feature of monochromatic and higher-contrast sinusoidal optical fringe pattern makes it possible that the useful signal can be picked up from the noised measurements, as shown in Figure 5b, Figure 6b and Figure 7b. Generally speaking, the retrieval accuracy indicated in Figure 5d, Figure 6d, and Figure 7d is the same as in Figure 4d. Even the quality of retrieved image of Figure 7d is slightly lower than other cases, it still shows that the proposed approach is capable of obtaining accurate 3D shape measurement under strong background illumination.

3.3. Measuring a Human-Head Model with Different Background Illuminances

We now present the experimental results for measuring a model of human head with a size of 45 mm in diameter. Such a model of human head does have very different geometrical features compared to the object coin described and discussed above. The coin is relatively flat, and its height variation is within a small range. The curvature and surface-height difference will lead to relatively severe fringe distortion, which will affect the accuracy of the image processing algorithm used in this study.
Note that the severe fringe distortion due to height variation within a small range of such an observed object can usually result in the overlapping of the zero-order spectrum and the spectrum of fundamental frequency [28,29,30], which has been solved in this investigation via using a higher spatial frequency of the projected fringe pattern, such as 3 lp/mm that might be 10 times larger than the researchers usually use with DPL projectors.
Similar to the coin measurement, for the indoor measurement of human-head model, the background illuminance E was adjusted using LED lights, for the cases of E = 0 L u x , E = 500 L u x , and E = 3500 L u x , respectively. For outdoor measurement, the wind speed v w i n d of the measuring period was measured using a digital anemometer and recorded as v w i n d = 3.5 5.7 m/s. The outdoor background illuminance E was contributed by natural sunlight, while the weather condition was clear when the outdoor experiments were being carried out. For all the measurements of both indoor and outdoor situations, a sinusoidal optical fringe pattern generated using the optical setup described in Section 2 with a spatial frequency of 3 lp/mm is used to illuminate the human-head model.
Figure 8 highlights that optical filtering is not necessary if the measurement is carried in a dark environment (i.e., E = 0 L u x ) since we cannot find any difference between the Figure 8a,b, and their retrievals in Figure 8c,d are also almost identical. However, if environmental illumination appears as shown in Figure 9a, Figure 10a, and Figure 11a, the optical filtering is needed in the measurements for getting accurate reconstructions of the object.
We know that E = 500 L u x is about the perfect value of room/background illumination for reading and writing conditions. When the background illuminance E = 500 L u x , Figure 9d shows that the reconstruction using measurement with optical filtering has the same quality as Figure 8d, while Figure 9c indicates that it is getting difficult to accurately reconstruct the observed object if the optical filtering technique is not used for the background illuminance E = 500 L u x . Up to E = 3500 L u x , Figure 10c indicates that this approach can yield a very good reconstruction via comparing the result of Figure 10c to that of Figure 8d. For the background illuminance of E = 12,000 L u x , a quite strong illumination under sunlight as in the case in Figure 11, we can still get a satisfied reconstruction of the observed object as shown in Figure 10c.

3.4. Measuring a 3D-Printed Color Object with Varying Surface Reflectivity

We now take a 3D-printed color object as the observed target for carrying out in-situ measurements and reconstructions. This object has the shape similar to an elongated triangular dipyramid, while it is initially generated using a 3D printer and then coated with the same type of paint but with different colors, as shown in Figure 12. The color-dependent surface reflectivity of the 3D-printed color object at 532 nm is clearly displayed in Figure 13. From Figure 13, we see that, if we take the perpendicular reflectivity of the white-color region of the object surface shown in Figure 12 as unity, the reflectivities of the yellow, green, and blue regions of Figure 12 will be 48%, 20%, and 5%, respectively. The measurements and reconstructions of the 3D-printed color object have followed the same procedure as we did with the coin and human-head model above, and the results are shown in Figure 14 and Figure 15.
Figure 14 and Figure 15 indicate that accurate reconstructions of the 3D-printed color object can be obtained for the background illuminance up to E = 5600 L u x . Figure 15c,d present the plots of the reconstruction error, i.e., the comparison between the retrieved height distributions and the actual values of the observed object. The plot of Figure 15c represents a cross section perpendicular to the ridge of the 3D-printed color object, while the left slope covers the blue, the white, and the yellow regions from the bottom to the ridge, and the right slope is totally located in the blue region. The plot of Figure 15d represents a cross section parallel to the ridge of the 3D-printed color object. This cross section is within the right slope of object as shown in Figure 12 with a maximum height of 4.1 mm, and it crosses the white, the blue, the green, the yellow, and the white regions from one side to the other. Even though the background illuminance is strong ( E = 5600 L u x ) and the relative reflectivity of the projected fringe signal is very low (such as 5% in blue region), the deviation of the retrieval is very small as indicated in Figure 15c,d.

3.5. Discussion

Experimental results presented above show that 3D surface measurement with the proposed approach is capable of being completed under complicated outdoor conditions, such as for the windy and strong-sunlight illuminating conditions, while the approaches using DMD-chip-based DLP projector and multiple projections are unable to fulfill this task. Note that the optical filtering technique is not applicable to DLP-based-illumination approaches since the DLP-based-illumination approach is unable to generate the monochromatic signal for the purpose of 3D surface measurement. Note also that the illuminated sinusoidal signal will not be affected by the so-called gamma effect, and there is no need for precise synchronization between a fringe pattern generator and the camera. The monochromatic feature and the possibly high power of the laser beam can ensure the success of the optical filtering technique for outdoor applications.
It should be noted that the output power of the CW laser source used in this work may put a limit of the highest background illuminance E m a x for obtaining accurate reconstruction of the observed 3D target. In practice, a new CW laser source with higher output power can be employed, which can definitely result in outdoor in-situ measurements and accurate reconstructions under much stronger background illumination being able to be successfully completed. As far as the safety issue of using high-power laser is concerned, we have to be reminded that the energy of the reaching fringe pattern on the surface of the observed object is much less than the nominal power of the CW laser for two main reasons: (i) The power of the propagating fringe pattern decreases with the square of the propagating distance as indicated in Equations (11) and (12). (ii) The power of the propagating fringe pattern is almost evenly distributed on a 2D circular area perpendicular to the propagating direction, while the diameter of the circular area is of the order of 1 m if the observed object is placed at Z 3 = 10 m in Equation (11). Thus, the laser-power limit with numerical safety criteria will be determined using experimental measurements for different applications and situations.

4. Conclusions

Both theoretical and experimental results of this work have indicated that the proposed approach of 3D surface measurement is capable of being successfully completed under complicated outdoor conditions. The critical important basis for carrying outdoor 3D surface measurement is the proposed and designed novel sinusoidal optical signal generator as well as the combination of the projected laser-beam-based sinusoidal optical signal, the optical filtering technique, and the single-shot approach based on Fourier transform profilometry. The designed optical system can generate monochromatic, high contrast, and truly sinusoidal fringe patterns with high-accuracy applications to 3D-surface measurement, as we presented in our experimental results of this work. The time-invariant feature of the sinusoidal fringe pattern generated using the designed optical system is important and useful for 3D-surface measurement of both static and dynamic objects. In addition to the higher fringe contrast as discussed above, the fringe pattern is a monochromatic signal, which can be combined with an optical filter to effectively reduce or remove the influence of the environmental noisy light signals as we indicated and discussed in Section 3. Moreover, the fringe-pattern signal is not sensitive to vibrations from environmental influences including the structural vibration of the system and the air disturbance, which has overcome the outdoor and in-situ measurement restrictions of the traditional interferometric system, especially for the applications of 3D surface profilometry. Experimental results indicate that outdoor in-situ measurements and accurate reconstructions can be obtained for much stronger outdoor environmental illumination such as the background illuminance E = 5600 L u x for measuring the 3D-printed color object with varying surface reflectivity, E = 12,000 L u x for measuring the human-head model, and E = 35,000 L u x for measuring the selected coin. The portable and stable optical setup of 3D surface measurement developed in this study can be used to measure objects with even or varying surface reflectivity under windy conditions and strong environmental illuminations and obtain accurate reconstructions.

Author Contributions

Theory and conceptualization, B.C. and P.S.; methodology and optical design, H.G. and H.M.; experimental validation and investigation, H.G. and P.G.; algorithm and software, H.L. and P.C.; image processing and figure plot, H.L. and P.S.; writing the original draft of the manuscript, B.C.; review and editing of the manuscript, P.S. All authors have read and agreed to the published version of the manuscript.

Funding

This work was partially supported by the Shandong Province Higher Educational Science and Technology Program under Grant No. J18KZ012, the National Natural Science Foundation of China under Grant No. 11975132, the Natural Science Foundation of Shandong Province for Excellent Young Scholars under Grant No. ZR2019YQ01, and the Natural Science Foundation of Shandong Province under Grant No. ZR2016FB09.

Institutional Review Board Statement

Not applicable.

Informed Consent Statement

Not applicable.

Data Availability Statement

The data presented in this study are available on request from the corresponding author.

Acknowledgments

The authors would like to thank the Editorial Board and three anonymous reviewers for their constructive comments that greatly improved the final version of the paper. The authors are also grateful to other colleagues and students for their help during the period of experimental measurement.

Conflicts of Interest

The authors declare no conflict of interest.

References

  1. Salvi, J.; Fernandez, S.; Pribanic, T.; Llado, X. A state of the art in structured light patterns for surface profilometry. Patt. Recogn. 2010, 43, 2666–2680. [Google Scholar] [CrossRef]
  2. Van der Jeught, S.; Dirckx, J.J.J. Real-time structured light profilometry: A review. Opt. Laser Eng. 2016, 87, 18–31. [Google Scholar] [CrossRef]
  3. Takeda, M.; Mutoh, K. Fourier transform profilometry for the automatic measurement of 3D object shapes. Appl. Opt. 1983, 22, 3977–3982. [Google Scholar] [CrossRef] [PubMed]
  4. Geng, J. Structured-light 3D surface imaging: A tutorial. Adv. Opt. Photonics 2011, 3, 128–160. [Google Scholar] [CrossRef]
  5. Zappa, E.; Busca, G. Static and dynamic features of Fourier transform profilometry: A review. Opt. Laser Eng. 2012, 50, 1140–1151. [Google Scholar] [CrossRef]
  6. Zhang, S. High-speed 3D shape measurement with structured light methods: A review. Opt. Laser Eng. 2018, 106, 119–131. [Google Scholar] [CrossRef]
  7. Gorthi, S.S.; Rastogi, P. Fringe projection techniques: Whither we are? Opt. Laser Eng. 2010, 48, 133–140. [Google Scholar] [CrossRef] [Green Version]
  8. Widjanarko, T.; Huntley, J.M.; Ruiz, P.D. Single-shot profilometry of rough surfaces using hyperspectral interferometry. Opt. Lett. 2012, 37, 350–352. [Google Scholar] [CrossRef] [Green Version]
  9. Moreau, V.; Laboury, D.; Tilkens, B.; Renotte, Y.L.M. Interferometric fringes projection system for 3D profilometry and relief investigation. Proc. SPIE 2005, 5857. [Google Scholar] [CrossRef] [Green Version]
  10. Chen, L.-C.; Yeh, S.-L.; Tapilouw, A.M.; Chang, J.-C. 3D surface profilometry using simultaneous phase-shifting interferometry. Opt. Commun. 2010, 283, 3376–3382. [Google Scholar] [CrossRef]
  11. Chang, C.-W.; Hou, M.T.; Hsu, I.-J. High-sensitivity dynamical profilometry with a fiber-based composite interferometer. Opt. Lett. 2013, 38, 2434–2436. [Google Scholar] [CrossRef]
  12. Stahl, H.P. White-light moire phase-measuring interferometry. Proc. SPIE 1991, 1332. [Google Scholar] [CrossRef]
  13. Mermelstein, M.S.; Feldkhun, D.L.; Shirley, L.G. Video-rate surface profiling with acousto-optic accordion fringe interferometry. Opt. Eng. 2000, 39, 106–113. [Google Scholar] [CrossRef]
  14. Li, E.B.; Peng, X.; Xi, J.; Chicharo, J.F.; Yao, J.Q.; Zhang, D.W. Multi-frequency and multiple phase-shift sinusoidal fringe projection for 3D profilometry. Opt. Express 2005, 13, 1561–1569. [Google Scholar] [CrossRef]
  15. Anna, T.; Dubey, S.K.; Shakher, C.; Roy, A.; Mehta, D.S. Sinusoidal fringe projection system based on compact and non-mechanical scanning low-coherence Michelson interferometer for three-dimensional shape measurement. Opt. Commun. 2009, 282, 1237–1242. [Google Scholar] [CrossRef]
  16. Su, W.-H. Color-encoded fringe projection for 3D shape measurements. Opt. Express 2007, 15, 13167–13181. [Google Scholar] [CrossRef]
  17. Stoykova, E.; Minchev, G.; Sainov, V. Fringe projection with a sinusoidal phase grating. Appl. Opt. 2009, 48, 4774–4784. [Google Scholar] [CrossRef] [Green Version]
  18. Gong, Y.; Zhang, S. Ultrafast 3D shape measurement with an off-the-shelf DLP projector. Opt. Express 2010, 18, 19743–19754. [Google Scholar] [CrossRef]
  19. Lei, S.; Zhang, S. Digital sinusoidal fringe pattern generation: Defocusing binary patterns VS focusing sinusoidal patterns. Opt. Laser Eng. 2010, 48, 561–569. [Google Scholar] [CrossRef]
  20. Liu, G.-H.; Liu, X.-Y.; Feng, Q.-Y. 3D shape measurement of objects with high dynamic range of surface reflectivity. Appl. Opt. 2011, 50, 4557–4565. [Google Scholar] [CrossRef]
  21. Sheng, H.; Xu, J.; Zhang, S. Dynamic projection theory for fringe projection profilometry. Appl. Opt. 2017, 56, 8452–8460. [Google Scholar] [CrossRef] [PubMed]
  22. Suresh, V.; Wang, Y.; Li, B. High-dynamic-range 3D shape measurement utilizing the transitioning state of digital micromirror device. Opt. Laser Eng. 2018, 107, 176–181. [Google Scholar] [CrossRef]
  23. Chen, L.-C.; Duong, D.-H.; Chen, C.-S. Optical 3D profilometry for measuring semiconductor wafer surfaces with extremely variant reflectivities. Appl. Sci. 2019, 9, 2060. [Google Scholar] [CrossRef] [Green Version]
  24. Li, H.; Chen, B.; Feng, K.; Ma, H. Modulation transfer function measurement method for fiber optic imaging bundles. Opt. Laser Technol. 2008, 40, 415–519. [Google Scholar] [CrossRef]
  25. Chen, B.; Li, H.; Yue, J.; Shi, P. Fourier-transform-based surface measurement and reconstruction of human face using the projection of monochromatic structured light. Sensors 2021, 21, 2529. [Google Scholar] [CrossRef]
  26. Rajoub, B.A.; Lalor, M.J.; Burton, D.R.; Karout, S.A. A new model for measuring object shape using non-collimated fringe-pattern projections. J. Opt. A: Pure Appl. Opt. 2007, 9, S66–S75. [Google Scholar] [CrossRef]
  27. Maurel, A.; Cobelli, P.; Pagneux, V.; Petitjeans, P. Experimental and theoretical inspection of the phase-to-height relation in Fourier transform profilometry. Appl. Opt. 2009, 48, 380–392. [Google Scholar] [CrossRef]
  28. Chen, W.; Su, X.; Cao, Y.; Zhang, Q.; Xiang, L. Method for eliminating zero spectrum in Fourier transform profilometry. Opt. Laser Eng. 2005, 43, 1267–1276. [Google Scholar] [CrossRef]
  29. Gdeisat, M.A.; Burton, D.R.; Lalor, M.J. Eliminating the zero spectrum in Fourier transform profilometry using a two-dimensional continuous wavelet transform. Opt. Commun. 2006, 266, 482–489. [Google Scholar] [CrossRef]
  30. Casco-Vasquez, J.F.; Juarez-Salazar, R.; Robledo-Sanchez, C.; Rodriguez-Zurita, G.; Sanchez, F.G.; Aguilar, L.M.A.; Meneses-Fabian, C. Fourier normalized-fringe analysis by zero-order spectrum suppression using a parameter estimation approach. Opt. Eng. 2013, 52, 074109. [Google Scholar] [CrossRef]
Figure 1. Photo of in-situ measurement under the sunlight via using the projection of sinusoidal fringe patterns generated by the designed optical system. C—Camera; F—spatial-frequency filter; G—grating; L—lens; P—observation plane; S—CW laser source.
Photonics 08 00178 g001
Figure 2. Sketch of the sinusoidal optical signal generator.
Photonics 08 00178 g002
Figure 3. The generated sinusoidal fringe pattern. (a) the measured intensity distribution; (b) comparison intensity-distribution curve with standard sine curve; (c) the measured fringe contrast corresponding to different background illumination for a given-power laser.
Photonics 08 00178 g003
Figure 4. Illuminated coin and its retrieval as background illuminance E = 0 L u x for indoor measurement. (a) without filtering; (b) with filtering; (c) retrieval using the image of (a); (d) retrieval using the image of (b).
Photonics 08 00178 g004
Figure 5. Illuminated coin and its retrieval as background illuminance E = 1000 L u x for indoor measurement. (a) without filtering; (b) with filtering; (c) retrieval using the image of (a); (d) retrieval using the image of (b).
Photonics 08 00178 g005
Figure 6. Illuminated coin and its retrieval as background illuminance E = 12,200 L u x for outdoor measurement. (a) without filtering; (b) with filtering; (c) retrieval using the image of (a); (d) retrieval using the image of (b).
Photonics 08 00178 g006
Figure 7. Illuminated coin and its retrieval as background illuminance E = 35,000 L u x for outdoor measurement. (a) without filtering; (b) with filtering; (c) retrieval using the image of (a); (d) retrieval using the image of (b); (e) part of the enlarged image of (a); (f) part of the enlarged image of (b).
Photonics 08 00178 g007
Figure 8. Human-head-model retrieval as background illuminance E = 0 L u x for indoor measurement. (a) without filtering; (b) with filtering; (c) retrieval using the image of (a); (d) retrieval using the image of (b).
Photonics 08 00178 g008
Figure 9. Human-head-model retrieval as background illuminance E = 500 L u x for indoor measurement. (a) without filtering; (b) with filtering; (c) retrieval using the image of (a); (d) retrieval using the image of (b).
Photonics 08 00178 g009
Figure 10. Human-head-model retrieval as background illuminance E = 3500 L u x for indoor measurement. (a) without filtering; (b) with filtering; (c) This is the retrieval using the measurement of (b), while it is unable to obtain satisfied retrieval using the measurement of (a).
Photonics 08 00178 g010
Figure 11. Human-head-model retrieval as background illuminance E = 12,000 L u x for outdoor measurement. (a) without filtering; (b) with filtering; (c) This is the retrieval using the measurement of (b), while it is unable to obtain satisfied retrieval using the measurement of (a).
Photonics 08 00178 g011
Figure 12. 3D-printed color object is generated using 3D printer and painted with different colors.
Photonics 08 00178 g012
Figure 13. The measured color-dependent surface reflectivity of the 3D-printed color object at 532 nm, while the reflectivity of the white-color paint is assumed to be unity.
Photonics 08 00178 g013
Figure 14. Reconstruction of 3D-printed color object with optical filtering. (a) background illuminance E = 505 L u x ; (b) background illuminance E = 3050 L u x ; (c) retrieval using the image of (a); (d) retrieval using the image of (b).
Photonics 08 00178 g014
Figure 15. Reconstruction of 3D-printed color object with optical filtering as background illuminance E = 5600 L u x . (a) image of the illuminated object; (b) retrieval using the image of (a); (c) comparing the retrieved height distribution on the cross section perpendicular to the ridge with the actual values; (d) comparing the retrieved height distribution on the cross section parallel to the ridge the ridge with the actual values.
Photonics 08 00178 g015
Publisher’s Note: MDPI stays neutral with regard to jurisdictional claims in published maps and institutional affiliations.

