Article

Proposal for a Calculation Model of Perceived Luminance in Road Tunnel Interior Environment: A Case Study of a Tunnel in China

1
State Key Laboratory of Mountain Bridge and Tunnel Engineering, Chongqing Jiaotong University, Chongqing 400074, China
2
Zhejiang Engineering Research Center of Advcanced Mass Spectrometry and Clinical Application, Ningbo 315211, China
3
Department of Information Science and Engineering, Ningbo University, Ningbo 315211, China
4
School of Information Science and Engineering (School of Mechanical Engineering), Jiaxing University, Jiaxing 314001, China
5
Department of Civil and Environmental Engineering, College of Engineering and Computing, Florida International University, Miami, FL 33174, USA
*
Author to whom correspondence should be addressed.
Photonics 2022, 9(11), 870; https://doi.org/10.3390/photonics9110870
Submission received: 2 November 2022 / Revised: 12 November 2022 / Accepted: 14 November 2022 / Published: 17 November 2022
(This article belongs to the Section Lasers, Light Sources and Sensors)

Abstract

:
This study describes applying the visual target color and spectra of light sources to calculate the perceived luminance in a tunnel interior lighting environment. The proposed approach aims to identify the combined effects of the light source, target surface color, and human eye on the perception of luminance in a tunnel interior lighting environment. The new method was tested in DIALux software using three light-emitting diodes (LEDs) with correlated color temperatures (CCTs) of 3000 K, 4000 K, and 6000 K, as well as four observed targets with red, yellow, blue, and green colors. Overall findings demonstrated that the yellow surface target’s mesopic luminance for the specified light source is greater than that of the other three-color surface targets. Additionally, it can be concluded that the mesopic luminance under a low CCT LED is greater than under a high CCT LED in the case of the specific color surface target.

1. Introduction

Tunnel construction has been undergoing rapid development as it reduces traffic transportation time and facilitates rapid economic development [1,2,3]. By the end of 2020, China had 21,316 highway tunnels with a combined length of 21,999.3 km [4]. Among these tunnels, 1394 are extra-long (tunnel length > 3 km) with a combined length of 6235.5 km, and 5541 are long tunnels (1 km < length < 3 km) with a combined length of 9633.2 km. Tunnels’ unique characteristics can increase drivers’ psychological load at the tunnel portals and result in more severe accidents [5,6] compared to other road segments. Thus, tunnels require an adequate lighting environment to ensure quick response of drivers. Indeed, road tunnels need adequate illumination to enhance driving safety and the visual perception of drivers [7] during daytime and nighttime, which, given the continuous working 24 h a day, 365 days a year, results in very high energy consumption [8].
Therefore, to improve operational energy efficiency and thus minimize energy consumption in road tunnels, LEDs are increasingly being used to replace conventional light sources for tunnel lighting, such as high-pressure sodium (HPS) and fluorescent tubes, due to their notable advantages of high energy efficiency, wide range spectral, long lifespan, less maintenance, short start-up time, and high color rendering [9,10], which are making them preferred lighting option in highway tunnel lighting.
However, several key factors determine whether the light source is suitable for tunnel lighting.
The luminance levels for the tunnel interior zone (the longest part of the tunnel) are extremely low (between 1 cd/m2 and 5 cd/m2) [11,12,13], falling within the mesopic vision range [14]. Spectral luminous efficiency function in the mesopic range Vmes(λ) is not constant [15,16,17], which can be expressed as a linear combination of the photopic V(λ) function and the scotopic V′(λ) function.
The SPD of light sources needs to be considered. Many studies [18,19,20] have discovered that SPD affects the perception of the atmosphere and the luminous efficacy of the light source [19].
The spectral property of the road targets needs to be considered. Surface color [21] refers to the spectral properties of the target surfaces, which influences the perception of luminance.
Several factors significantly influence the perceived luminance of target surfaces and directly affect drivers’ visual performance, which influences target detection in the tunnel.

1.1. Previous Work on the Effect of SPD on Visibility in Road Tunnels

Many studies [22,23] have investigated the effect of light source SPD on luminance perception or humans’ ability to detect the target appearing in their visual field under mesopic conditions. Some focused on general road lighting, while others were specifically designed to address the tunnel lighting issue.
Zak and Zalesak [21] discussed the impact of the light source spectrum on visual perception. Results showed that a light source’s spectral significantly influences the visibility of small objects or human adaptation level. Additionally, LEDs have a higher perceived luminance in a mesopic region compared to other light sources. Additionally, visual perception varied with the spectral properties of the object surfaces. Preciado and Manzano [24] considered three different luminaries (an HPS luminaire, a metal halide lamp, and an LED device) in their work. The calculation results inferred that metal halide (MH) and LED luminaries would always create a mesopic luminance greater than that produced by an HPS luminaire at the same photopic luminance over the road surface. In a field investigation, Akashi et al. [25] used six types of light sources to compare the reaction time of 13 individuals in a mesopic lighting situation: a ceramic metal halide (CMH) lamp and five 60W-HPS lamps). The experiment results showed that the response time was significantly shorter for the CMH than for the HPS at the same photopic luminance level. Gibbons et al. [26,27] conducted a realistic roadway study to compare the detection distance of 36 participants under three overhead lighting types (2100 K HPS, 3500 K LED, and 6000 K LED) at five adaptation luminance levels. The findings demonstrated that the mean detection distance among the overhead lighting types varied depending on offset. The results also showed that the 6000 K LED lighting’s spectral distribution is more efficient for the 8.9 m and 21.0 m offsets. Jin et al. [28] examined the lighting performance of LED luminaires with various color temperatures. Dark adaptation time data of fifty subjects were gathered under various lighting conditions given by five LEDs with various CCTs (1870 K, 2490 K, 3007 K, 4075 K, and 5020 K). The results indicated that five LEDs exhibit various mesopic vision luminances and dark adaptation times at the same photopic illuminance condition. Additionally, the dark adaptation time increased with the increase of CCT. Jin et al. [29] studied three kinds of white LEDs (cold white LEDs with 8000 K, neutral white LEDs with 4500 K, and warm white LEDs with 3500 K) to estimate the variation in luminous efficiency in the mesopic condition. The results demonstrated that the luminous efficiency of an 8000 K LED is 53% higher than that of a 3500 K LED in the mesopic vision state at 0.1 cd/m2. Bandopadhyay et al. [30] studied the effect of LED’s spectral power distribution on mesopic lighting design and found that LED luminaires with longer wavelength components produce a lower mesopic luminance than those with shorter wavelength components.
Yang et al. [31] utilized five kinds of spectra light sources (1958 K HPS, 5537 K fluorescent lamp, 3177 K LED, 4054 K LED, and 4765 K LED) to examine the reaction time of various lamps under the mesopic condition. It is concluded that the reaction times were shorter for the fluorescent lamp and LEDs than for the HPS at the same background luminance level. Liu et al. [32] used five LEDs with CCTs of 2500 K, 3800 K, 4500 K, 4800 K, and 5100 K together with two conventional light sources (an HPS lamp in 1900 K and an MH lamp in 2700 K) to study the influence of light source SPD on driving safety in long tunnel lighting. Experiment results showed that driving safety relates to light sources’ CCT and shortwave composition. Additionally, LED lighting with a CCT of 5100 K is more conducive to driving safety. Liang et al. [33] investigated the spectrum impact on drivers’ visual performance using a 10:1 scale model of road tunnel lighting. Three different spectral light sources (3000 K LEDs, 4000 K LEDs, and 5000 K LEDs) were adopted in the study. The experiment results concluded that the reaction time decreases with the increased LED CCT under the same background luminance, which indicates that the driver’s visual performance can be improved by increasing light source CCT. Dong et al. [34] assessed the visual performance of several LED CCTs under mesopic lighting conditions. Ten subjects’ reaction times were measured under one hundred forty-four lighting conditions, including six CCTs, four background luminances, three CRIs, two target contrasts, and two horizontal eccentricities. Experiment results showed that the mesopic luminance of different LEDs differed at the same photopic luminance level, and the calculated mesopic luminance increased with the LED CCT. Moreover, the reaction time for a high CCT lamp is shorter than a low CCT lamp, which means that a higher light source CCT can make humans easy to identify the obstacle. Zhang et al. [35] studied the visual performance of 12 test drivers under 15 different LED lighting combinations (5 CCTs, 4 CRIs, and 8 lighting levels). An enclosed environment with a length of 60 m, a width of 3.8 m, and a height of 3.8 m were established in the study. The calculating and analyzing results indicated that the visual recognition time was shortened with an increase in brightness and color rendering index.

1.2. Goals and Hypothesis

All these studies showed that different light sources could result in different visual perceptions and performances for the same photopic luminance levels. However, three factors- the light source and its SPDs, targets’ surface color and its spectral reflectance properties, and the human eye photoreceptor with its spectral sensitivity- influence drivers’ perceived luminance and visual performance in tunnel lighting applications. Additional evidence shows that an object’s property directly impacts luminance perception. Luminance is an essential factor related to traffic safety in tunnels, which is a fundamental visual perception and is related to how well we can see what is happening around us. Additionally, an area that is brightly lit after dark is perceived to provide good visibility and that, in the public mind, is likely to be more interesting and safer [36].
The scope of this work is first to present a calculation model to examine how the visual performance of the driver is affected by the spectra of light sources and the spectra reflectance of object surfaces at mesopic levels. Then, a tunnel’s interior environment is simulated based on DIALux software. Finally, the calculation model was validated using lightness channel L photographs of four-color targets in three lighting scenarios.
Figure 1 plots the flowchart of the study. The proposed method’s calculation procedure is depicted graphically in the left portion of the figure; Section 2 gives a thorough description. The experimental study and data processing techniques are shown in the right portion; Section 3 and Section 4 provide a full explanation.

2. Perception Luminance Calculation Method

2.1. Mesopic Luminance Calculation Model

Tunnel interior lighting belongs to the mesopic region; thus, the human perception luminance calculation should adopt the mesopic spectral luminous efficiency function Vmes(λ). Moreover, Vmes(λ) is a linear combination of the photopic spectral luminous efficiency function V(λ), and the scotopic spectral luminous efficiency function V’(λ). MES-2 model [37], with an upper luminance limit of 5 cd/m2 and lower luminance limit of 0.005 cd/m2, was recommended system for mesopic photometry based on visual performance by CIE (Commission Internationale de L’Eclairage), is used to calculate Vmes (λ), as follows,
M ( m ) V mes ( λ ) = m V ( λ ) + ( 1 m ) V ( λ )
L mes = 683 V mes λ 0 V mes ( λ ) L e λ d λ
where M(m) is a normalizing function such that Vmes(λ) attains a maximum value of 1, m is a coefficient dependent on the visual adaptation conditions, Vmes(λ0) is the value of Vmes(λ) at 555 nm, Lmes is the mesopic luminance, Le(λ) is the spectral power distribution of the light source (W/m2·sr), when Lmes ≥ 5 cd/m2, m = 1, when Lmes ≤ 0.005 cd/m2, m = 0. Lmes and m are calculated iteratively:
L mes , n = m n 1 + ( 1 m n 1 ) V ( λ 0 ) R SP m n 1 + ( 1 m n 1 ) V ( λ 0 ) L p , m 0 = 0.5
m n = 0.3334 log 10 L mes , n + 0.767 , 0 m n 1
R SP = 1700 V ( λ ) L e λ d λ 684 V ( λ ) L e λ d λ
where Lp is the photopic luminance, Ls is the scotopic luminance, and V′(λ0) = 683/1700 is the value of scotopic spectral function V’(λ) at 555 nm, RSP is the ratio between radiation’s scotopic and photopic spectral power distributions, and n is an iteration step.
Three LED light sources with different color temperatures were considered to compare scotopic, mesopic, and photopic spectral luminous efficiency. Table 1 shows the characteristics of light sources, and the calculation of CCT and duv can be found in refs. [38,39].
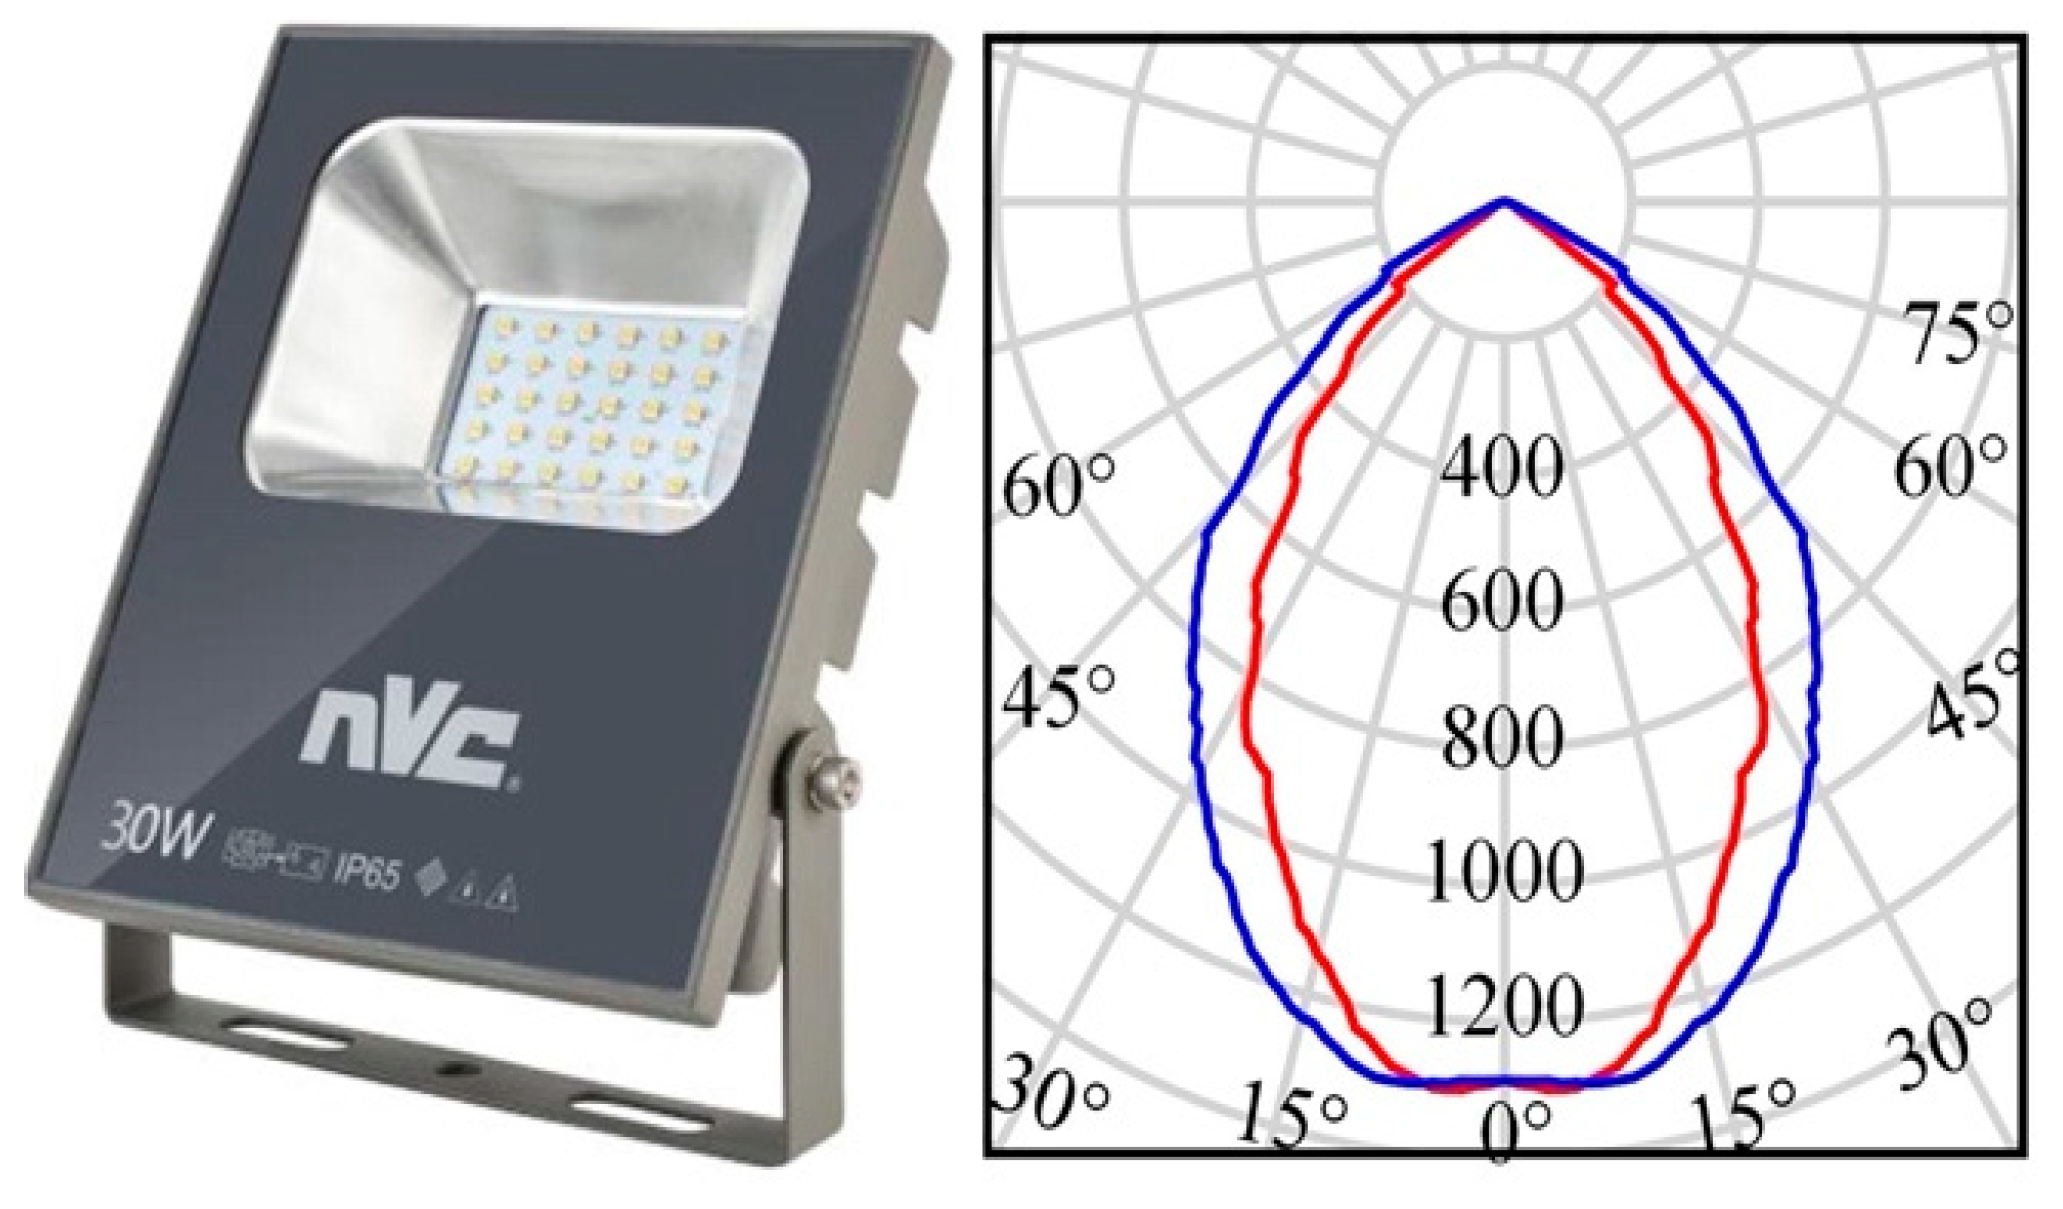
It can be found in Table 1 that all the luminaries have the same luminous efficiency (70 lm/W). This value was taken by investigating the NVC database (https://www.nvc-lighting.com.cn/ (accessed on 15 December 2020)). Figure 2 shows the radiation characteristic of luminaries.
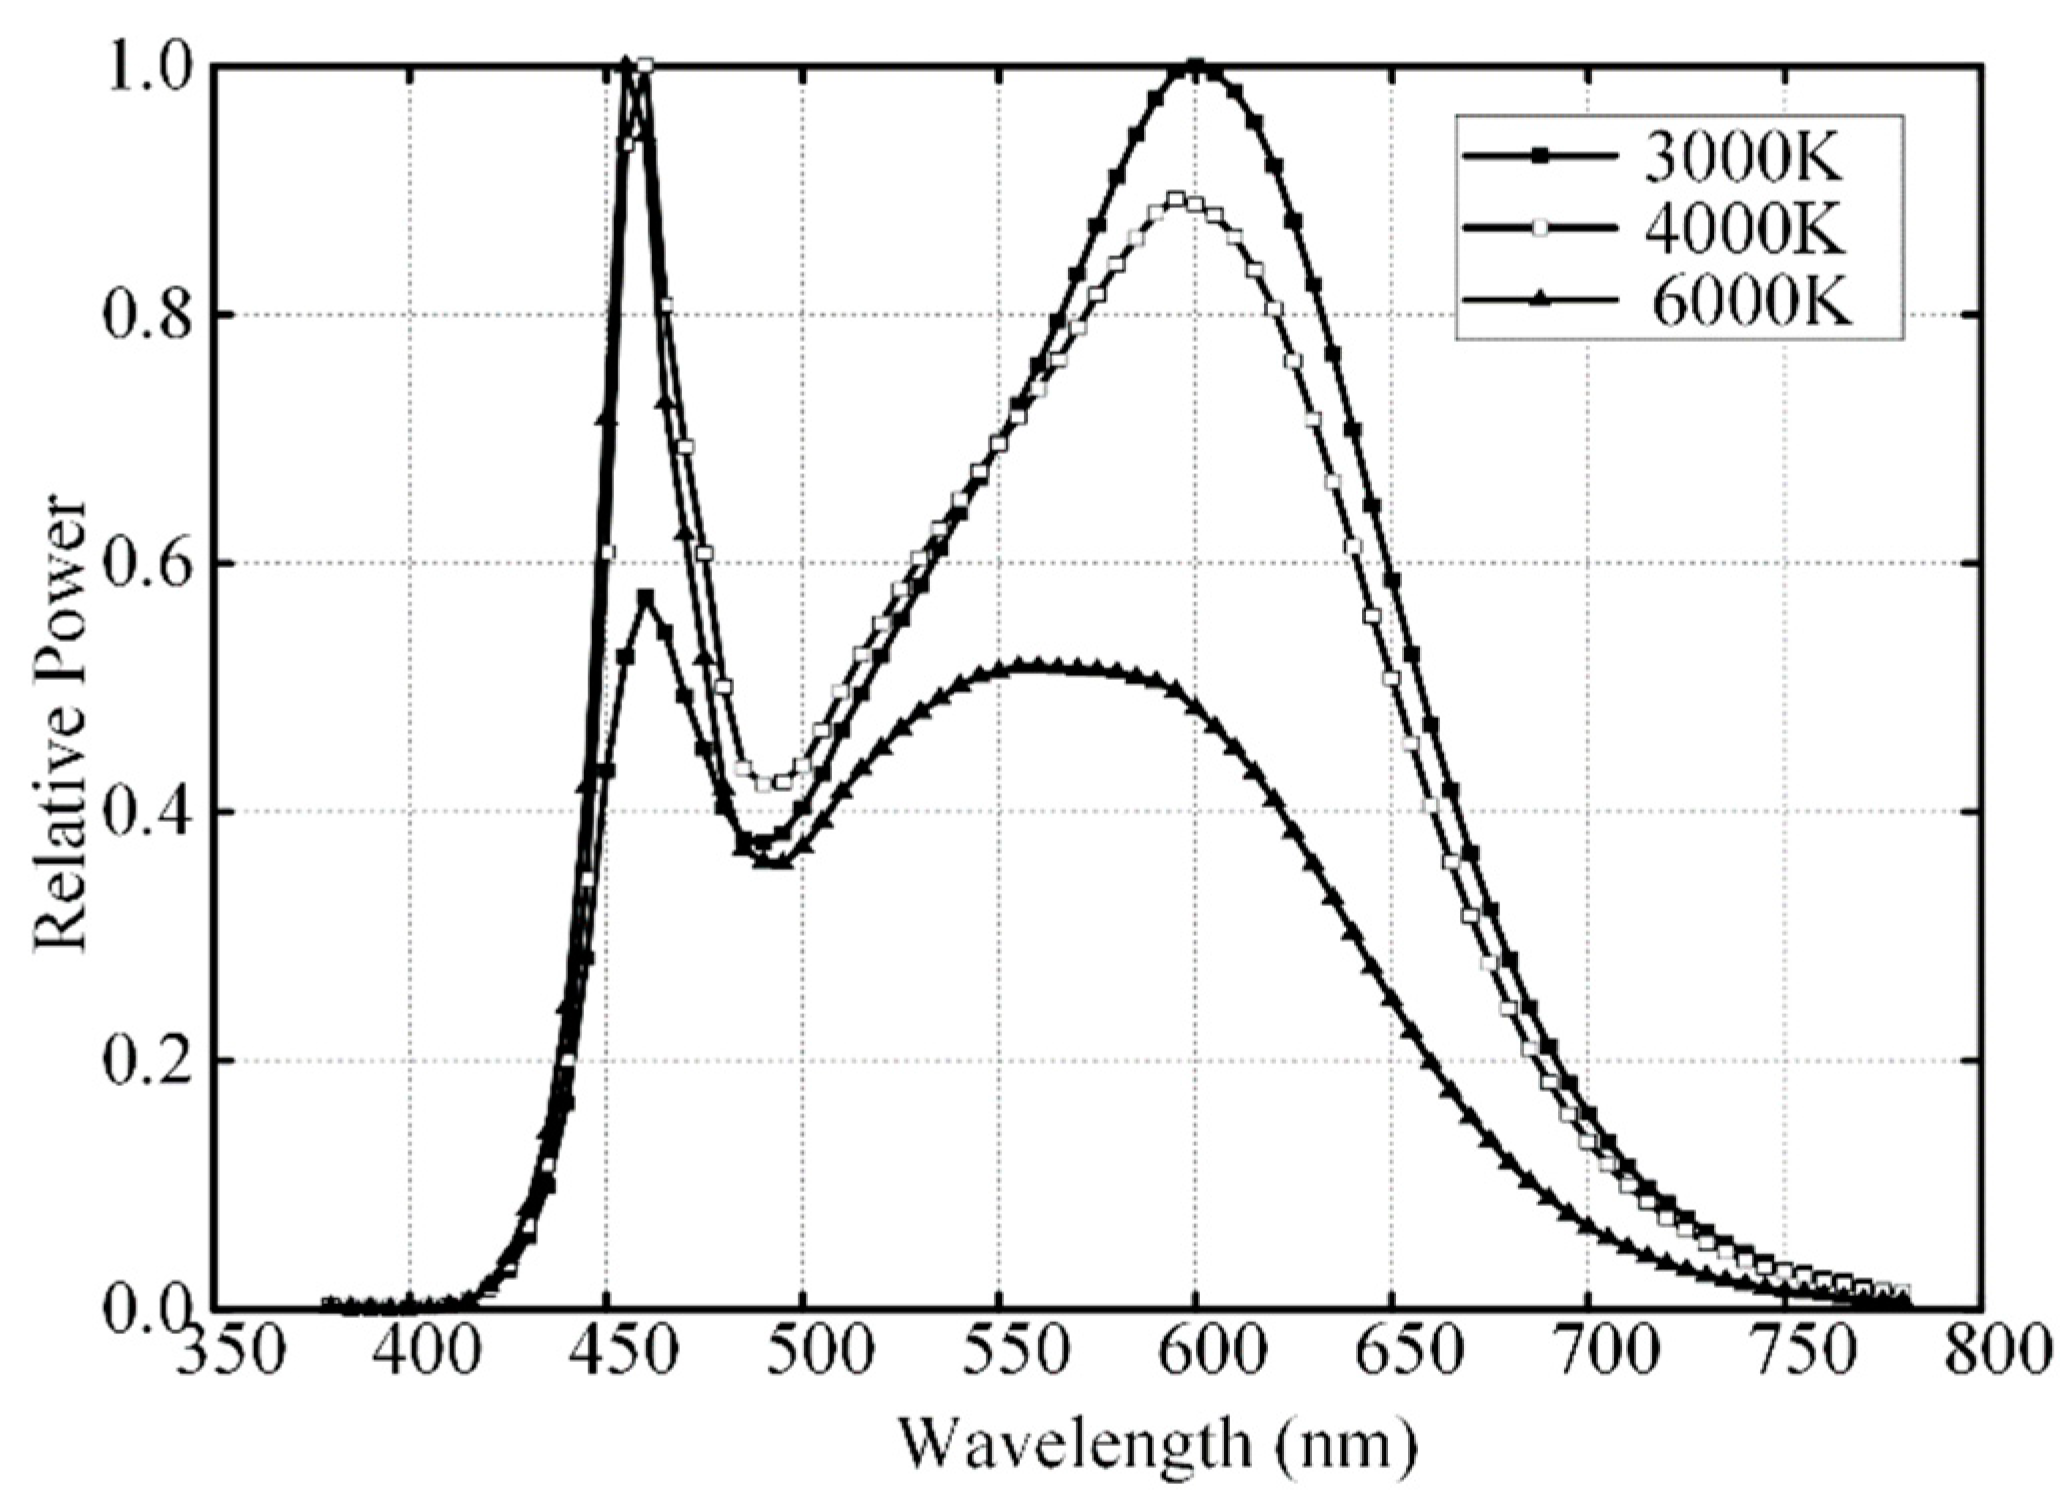
Figure 3 gives the relative SPD of three light sources. It can be shown that lower CCT LEDs have more long waves at the red end of the spectrum and higher CCT LEDs have more short waves at the blue end of the spectrum.
Figure 4 indicates scotopic and photopic spectral luminous efficiency and the mesopic spectral luminous efficiency functions (calculated based on Equation (1)) for three LEDs with luminance at 2.5 cd/m2(tunnel interior luminance). As shown in Figure 4, the difference between mesopic spectral luminous efficiency functions is slight for different CCTs. Moreover, these mesopic spectral luminous efficiency functions (background luminance at 2.5 cd/m2) are closer to the photopic spectral luminous efficiency function.
Figure 5 plots the percentage difference value curves between mesopic luminance and photopic luminance against the photopic luminance with three LED light sources. It can be found that the difference is a positive value, which indicates that mesopic luminance obtained with LED luminaires is considerably higher than photopic luminance, especially for low photopic luminance. For example, for an Lp = 0.1 cd/m2, Lmes would be for 3000 K LED 19.94% higher (Lmes = 0.12 cd/m2); for 4000 K LED 26.5% higher (Lmes = 0.1265 cd/m2) and 6000 K LED 37.17% higher (Lmes = 0.1372 cd/m2).

2.2. New Mesopic Luminance Calculation

However, perceived luminance not only depends on human vision and the SPD of light sources but is also influenced by the target’s light spectrum. Study shows that the surfaces’ colors also influence the reflected light spectrum [40]. Additionally, the reflecting surfaces of obstacles in tunnels are often not neutral in terms of color.
The new proposed mesopic luminance calculation model in tunnels should be as follows:
L mes _ new = 683 V mes λ 0 V mes ( λ ) L e λ S t ( λ ) d λ
where St(λ) indicates the spectral reflectance distribution of the target surface.
Three LED CCTs (SPDs are given in Figure 3) and four-colored targets (SPDs are shown in Figure 6) are selected to compare the perceived luminance.
Lmes_new is calculated according to the spectral data of light sources, target surface, and luminous efficiency functions of the human eye using Equation (6). The calculation results are shown in Figure 7.
It can be observed that the Lmes_new of the yellow surface target is the largest, followed by the green surface target. Conversely, the luminance of the blue surface target is the smallest. Furthermore, the Lmes_new value of the yellow and red surface targets increases with a decrease in LED CCTs, but the Lmes_new value of the blue and green surface targets increases with the increase of LED CCTs.

3. Simulation Experiments

3.1. Case Study

According to JTG-2014 [41], road tunnels are divided into five main zones according to their lighting requirements, as shown in Figure 8.
The length and required luminance of the tunnel’s interior zone can be calculated using Equations (7) and (8) [41], respectively,
D i n = L 1.539 D s + 7.561 h 1.667 v t 71.34
L i n = 0.0007 v t 2 0.0693 v t + 2.6    N 350 0.0005 v t 2 0.0207 v t + 0.9      350 < N < 1200 0.0012 v t 2 0.0732 v t + 2.1    N 1200
where Din is the distance of tunnel interior zone (m); L is the tunnel length (m); Ds is the stopping sign distance (m); h is tunnel clearance height (m); vt is the design speed (km/h); Lin is the interior zone luminance (cd/m2), and N is the traffic volume (Veh/h·ln).
It can be seen from Equation (8) that the luminance in the tunnel interior depends on traffic volume and the design speed.
The Xiaogou tunnel at Heda expressway, Jilin Province, China, was selected as the study model. The tunnel is doubled-arched, having an overall road width of 10.5 m, a lane width of 3.75 m, a left shoulder width of 1.5 m, and a right shoulder width of 1.5 m. Xiaogou tunnel’s parameters, used in the present study, are presented in Table 2. Once the parameters are known, the calculation method is the same for other tunnels.
The distribution of the luminance L on the roadways illuminated by stationary lighting systems can be calculated using the following equation [42]:
L = I × r × ϕ × M F × 10 4 H 2
where L is the maintained luminance on the road surface (cd/m2), I is the luminous intensity in the direction, r is the reduced luminance coefficient for a light path, ϕ is the initial luminous flux of the sources in each luminaire, MF is the luminaire maintenance factor, and H is the mounting height of luminaire above the road surface (m).

3.2. Simulation Software

The software DIALux (DIAL, GmbH, Germany) was used to establish the geometry of the interior zone of the Xiaogou tunnel, as well as to calculate artificial lighting. DIALux is a comprehensive software that can provide accurate analysis and evaluation of artificial lighting [43], which is intuitive and straightforward to simulate, calculate, analyze, and optimize the lighting environment. DIALux also has access to databases of the major lighting companies. Many pieces of research have repeatedly proved the reliability of simulating and calculating artificial road lighting [44,45].
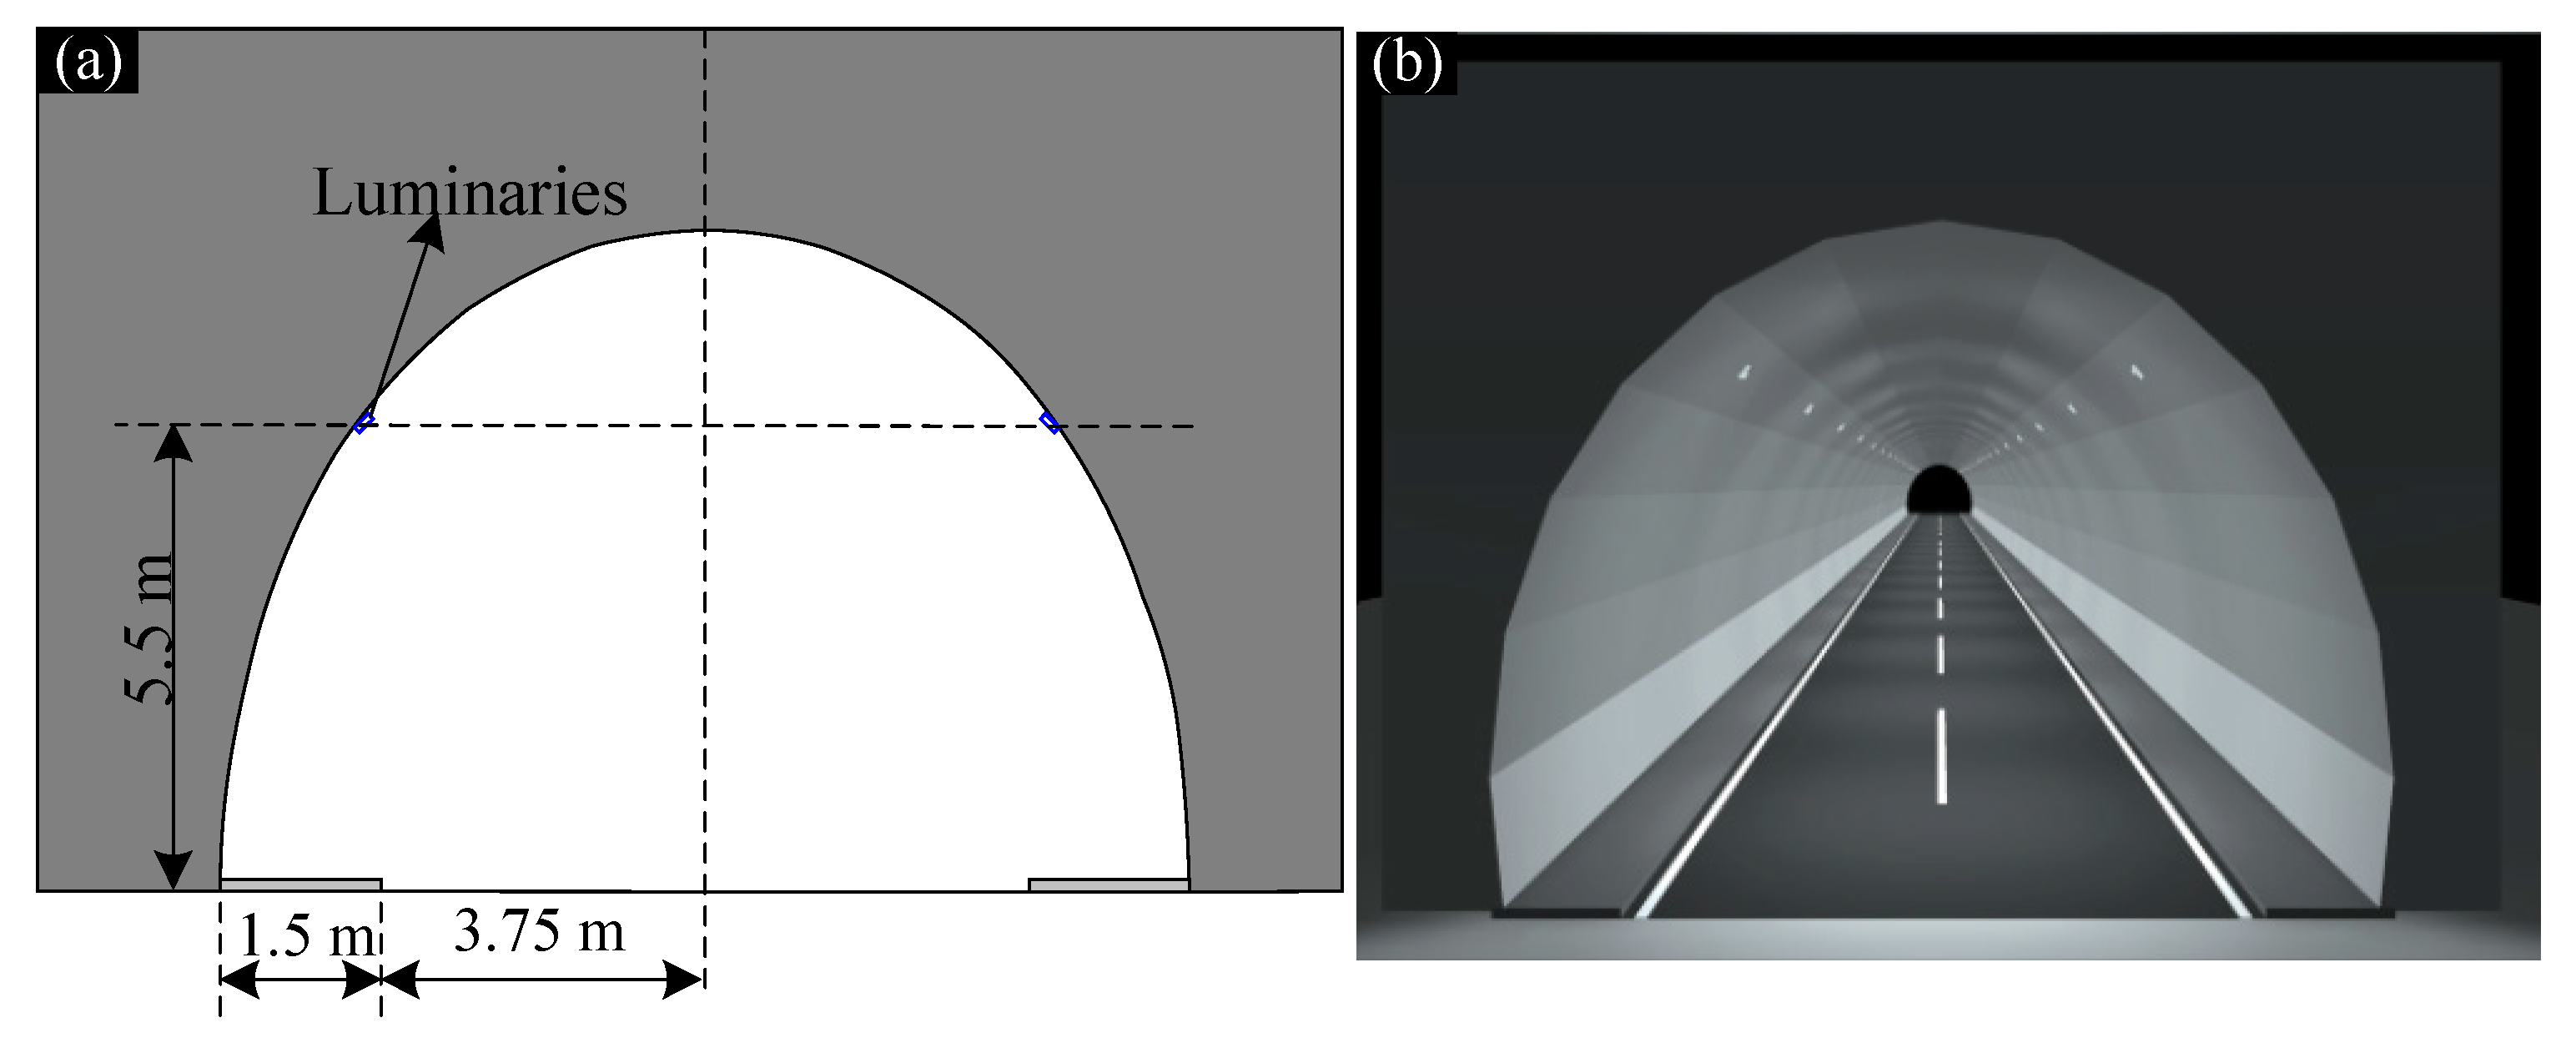
The Xiaogou tunnel interior is cemented concrete pavement with a 24% reflection coefficient. The tunnel wall for heights within 2 m contains high reflection materials having a 70% reflection coefficient. Low-reflection materials were used for heights higher than 2 m, with a 27% reflection coefficient (see Figure 9b). Xiaogou tunnel lighting system is provided with 30 W LED luminaries at a mounting height of 5.5 m, placed approximately 1.5 m from the edge of the sidewalk with a spacing between luminaries of about 9 m. Figure 9 shows the cross-section of the test tunnel and the render by DIALux.

3.3. Target Object

The ANSI/IES RP-8-18 roadway lighting guidance [46] recommends that the target is an 0.18 m × 0.18 m × 0.18 m cube having a 50% reflectance. The Japanese national standard [47] recommends that the target be a 0.2 m × 0.2 m × 0.2 m cube with a 30% reflectance. However, tunnels are tubular and enclosed except for the entrance and exit. The objects on the tunnel pavement are cartons, foam, and other items, whose reflectance is between 20% and 35%. Thus, considering the target object recommendation for tunnel lighting, a 0.2 m × 0.2 m × 0.2 m cube with 30% reflectance was selected as the target object.
Small target visibility (STV) is an effective metric to relate the physics of roadway lighting performance to the biology of the human eye [37]. Visibility is a function of contrast from the physics perspective. Weber-contrast can be defined by Equation (10), which is the relationship between the amount of light reflected off a target and the amount of light reflected off its background.
C = Δ L L b = L t L b L b
where C indicates contrast, Lt indicates the target’s luminance, Lb indicates the target’s adjacent background luminance. The target can have a higher luminance than the background (positive contrast) or appear darker than Lb (negative contrast). Furthermore, the absolute value of contrast represents the difference between the luminance of the target and its background. Thus, a higher absolute contrast value makes distinguishing between the target and background easier.

4. Analysis and Results

4.1. Simulation of Tunnel Model

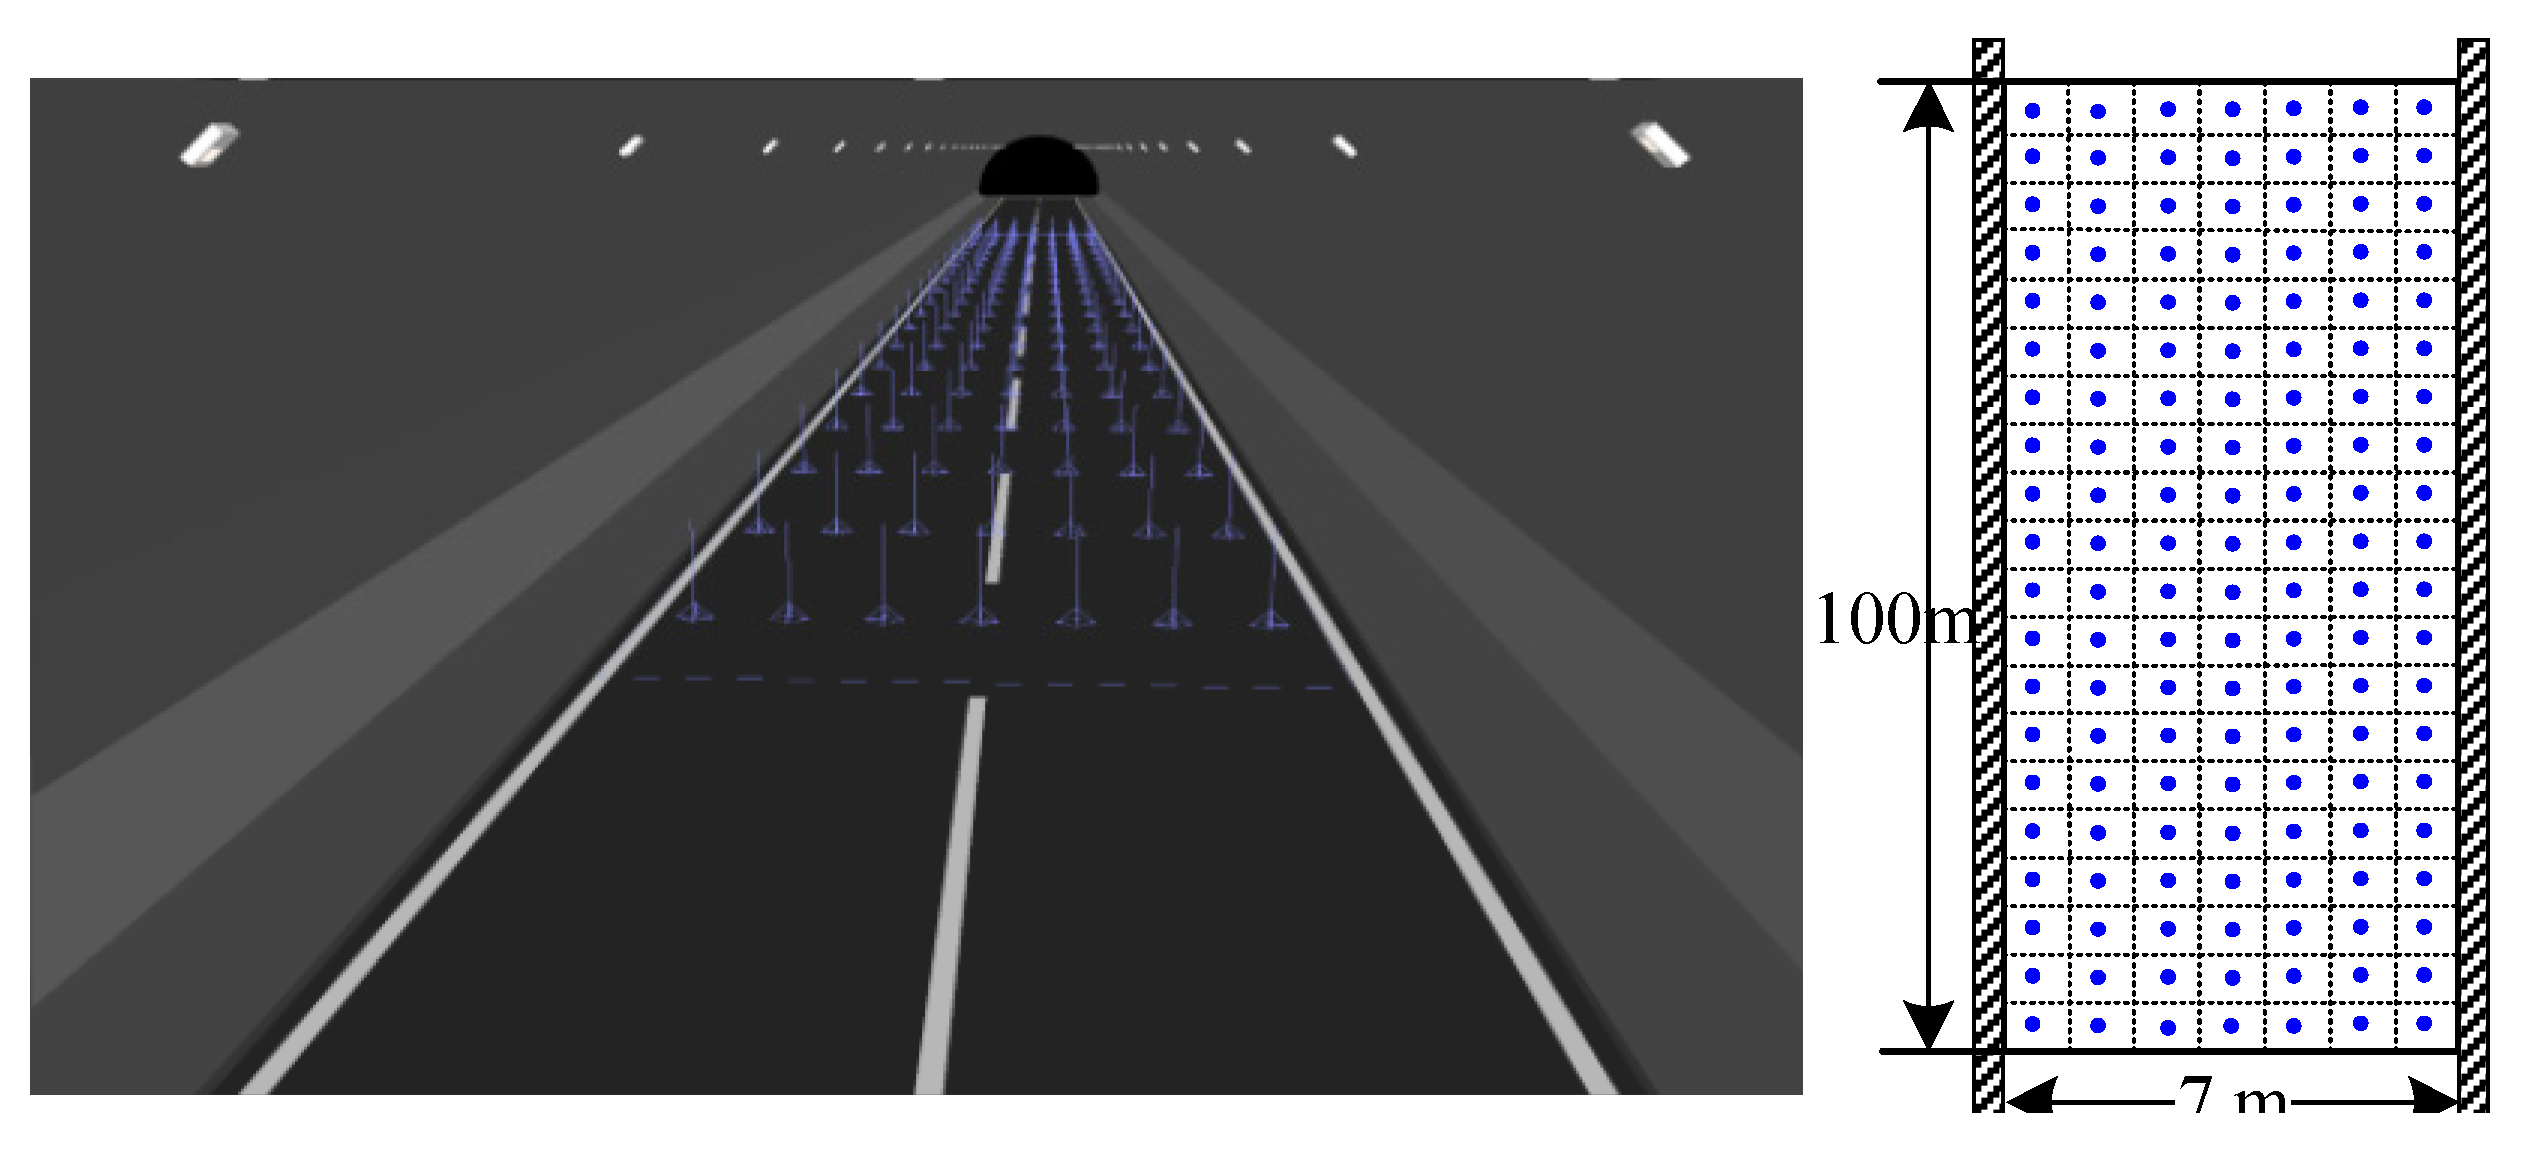
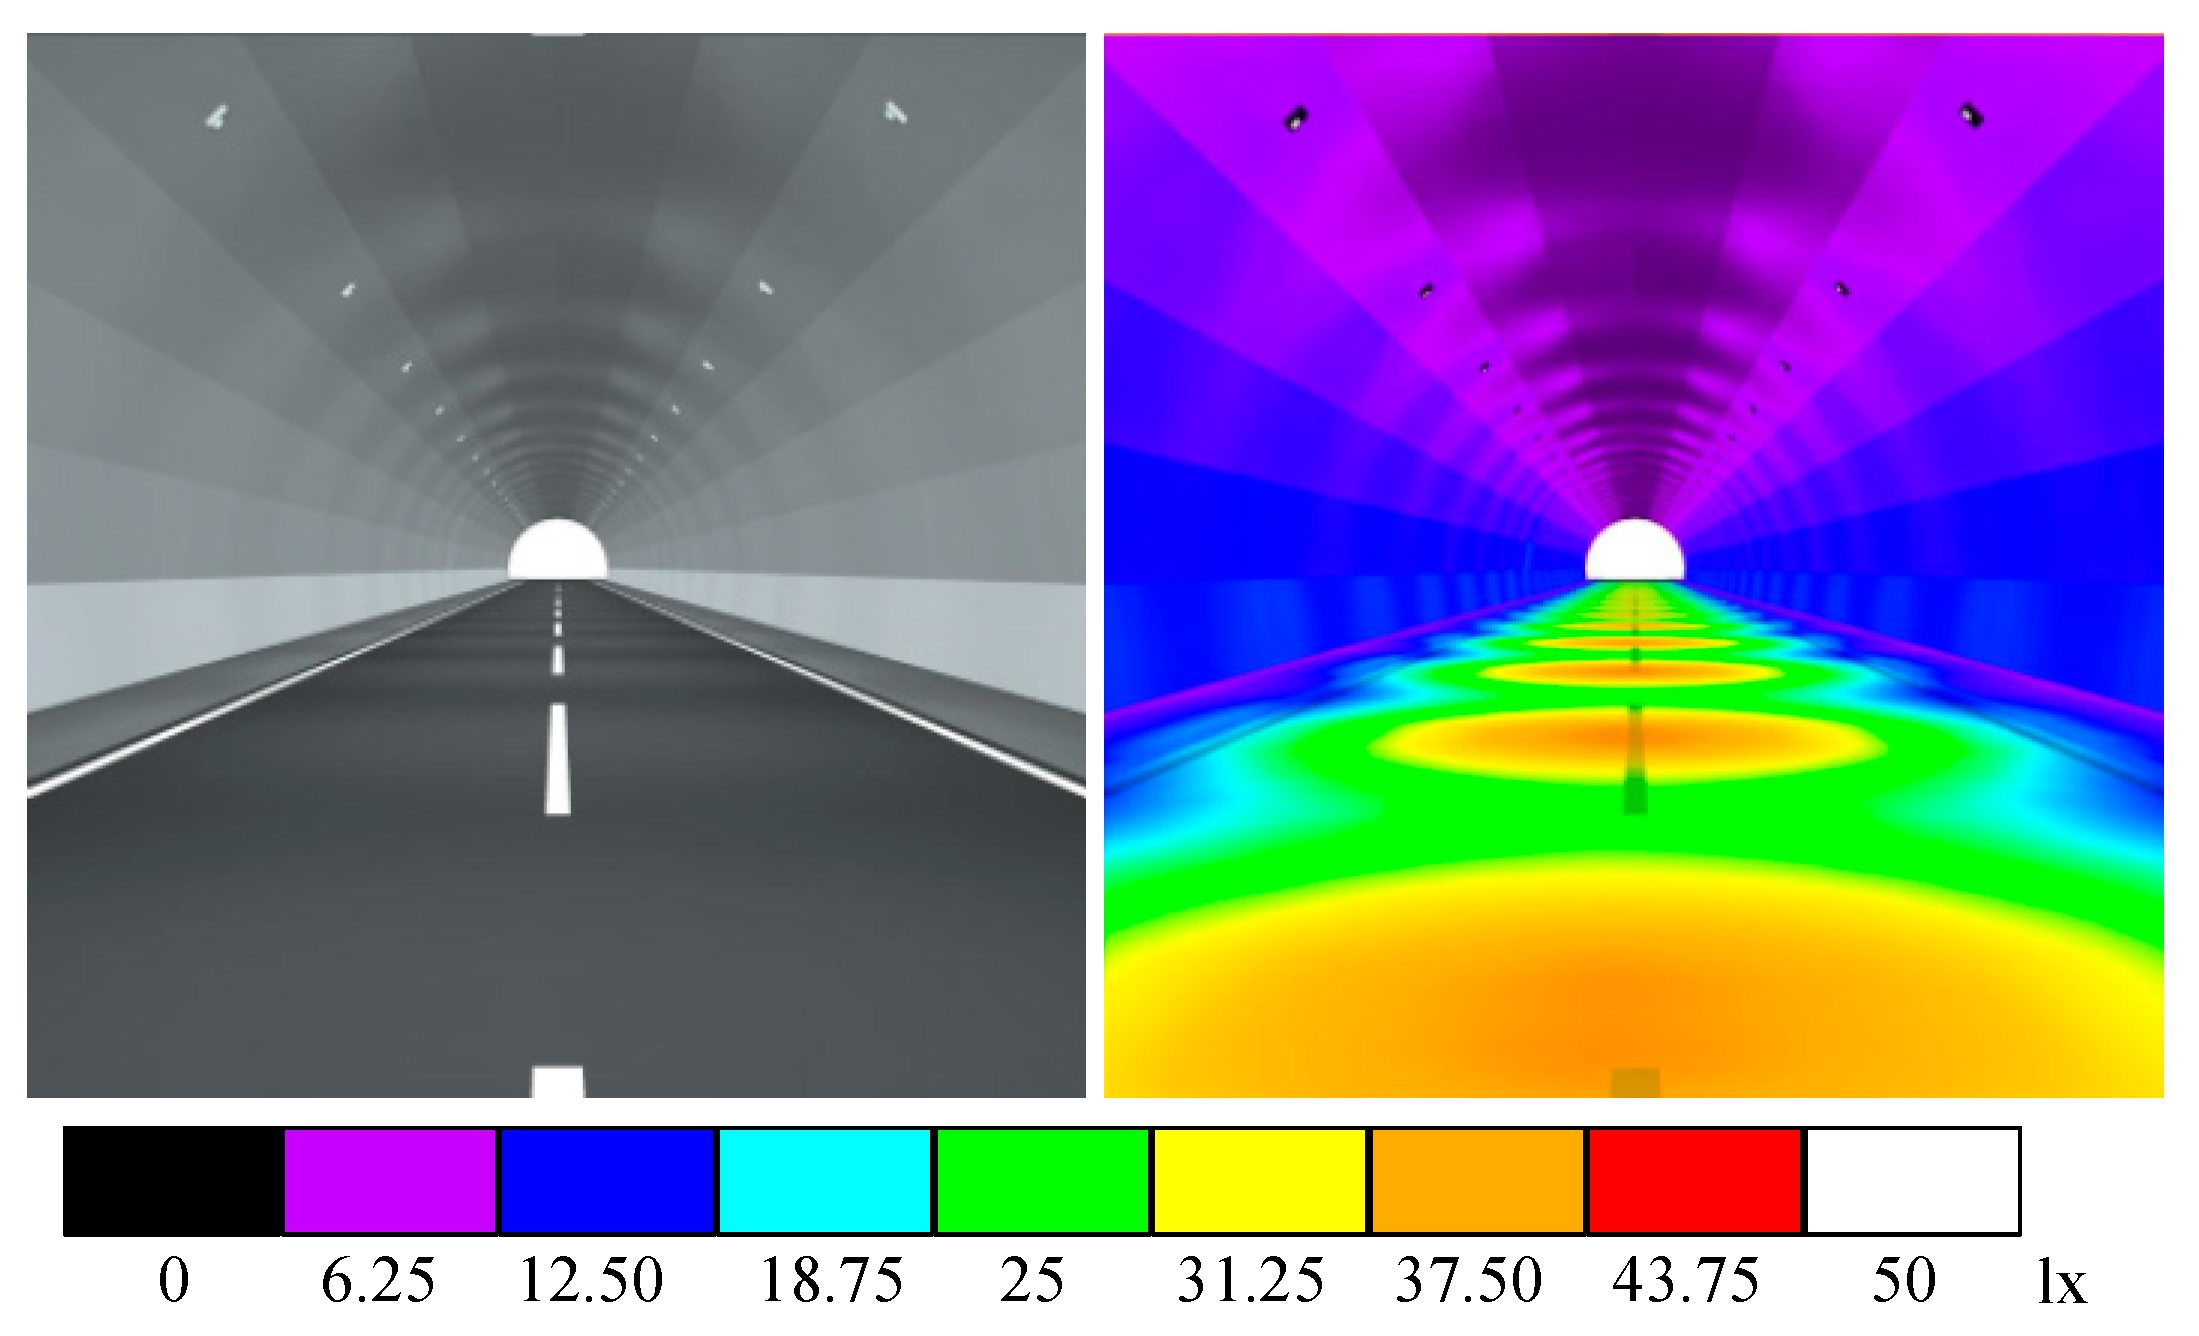
The study used the virtual model of a portion (300 m long) of the Xiaogou tunnel interior zone. The computational grid for the pavement illumination simulation is presented in Figure 10. The length and width of the computational grid are approximately 100 m and 7 m, respectively. Additionally, the tunnel interior simulation result and its rendering effect are shown in Figure 11.
Calculation results showed that the minimum luminance is 1.63 cd/m2, and the average luminance is 2.50 cd/m2. Thus, the overall uniformity of road surface luminance is the ratio of the minimum luminance to the average luminance on the road (U1 = Minimum/Average cd/m2 = 1.63/2.50 = 0.65), which meets the requirement of the lighting standard.

4.2. Contrast Calculation

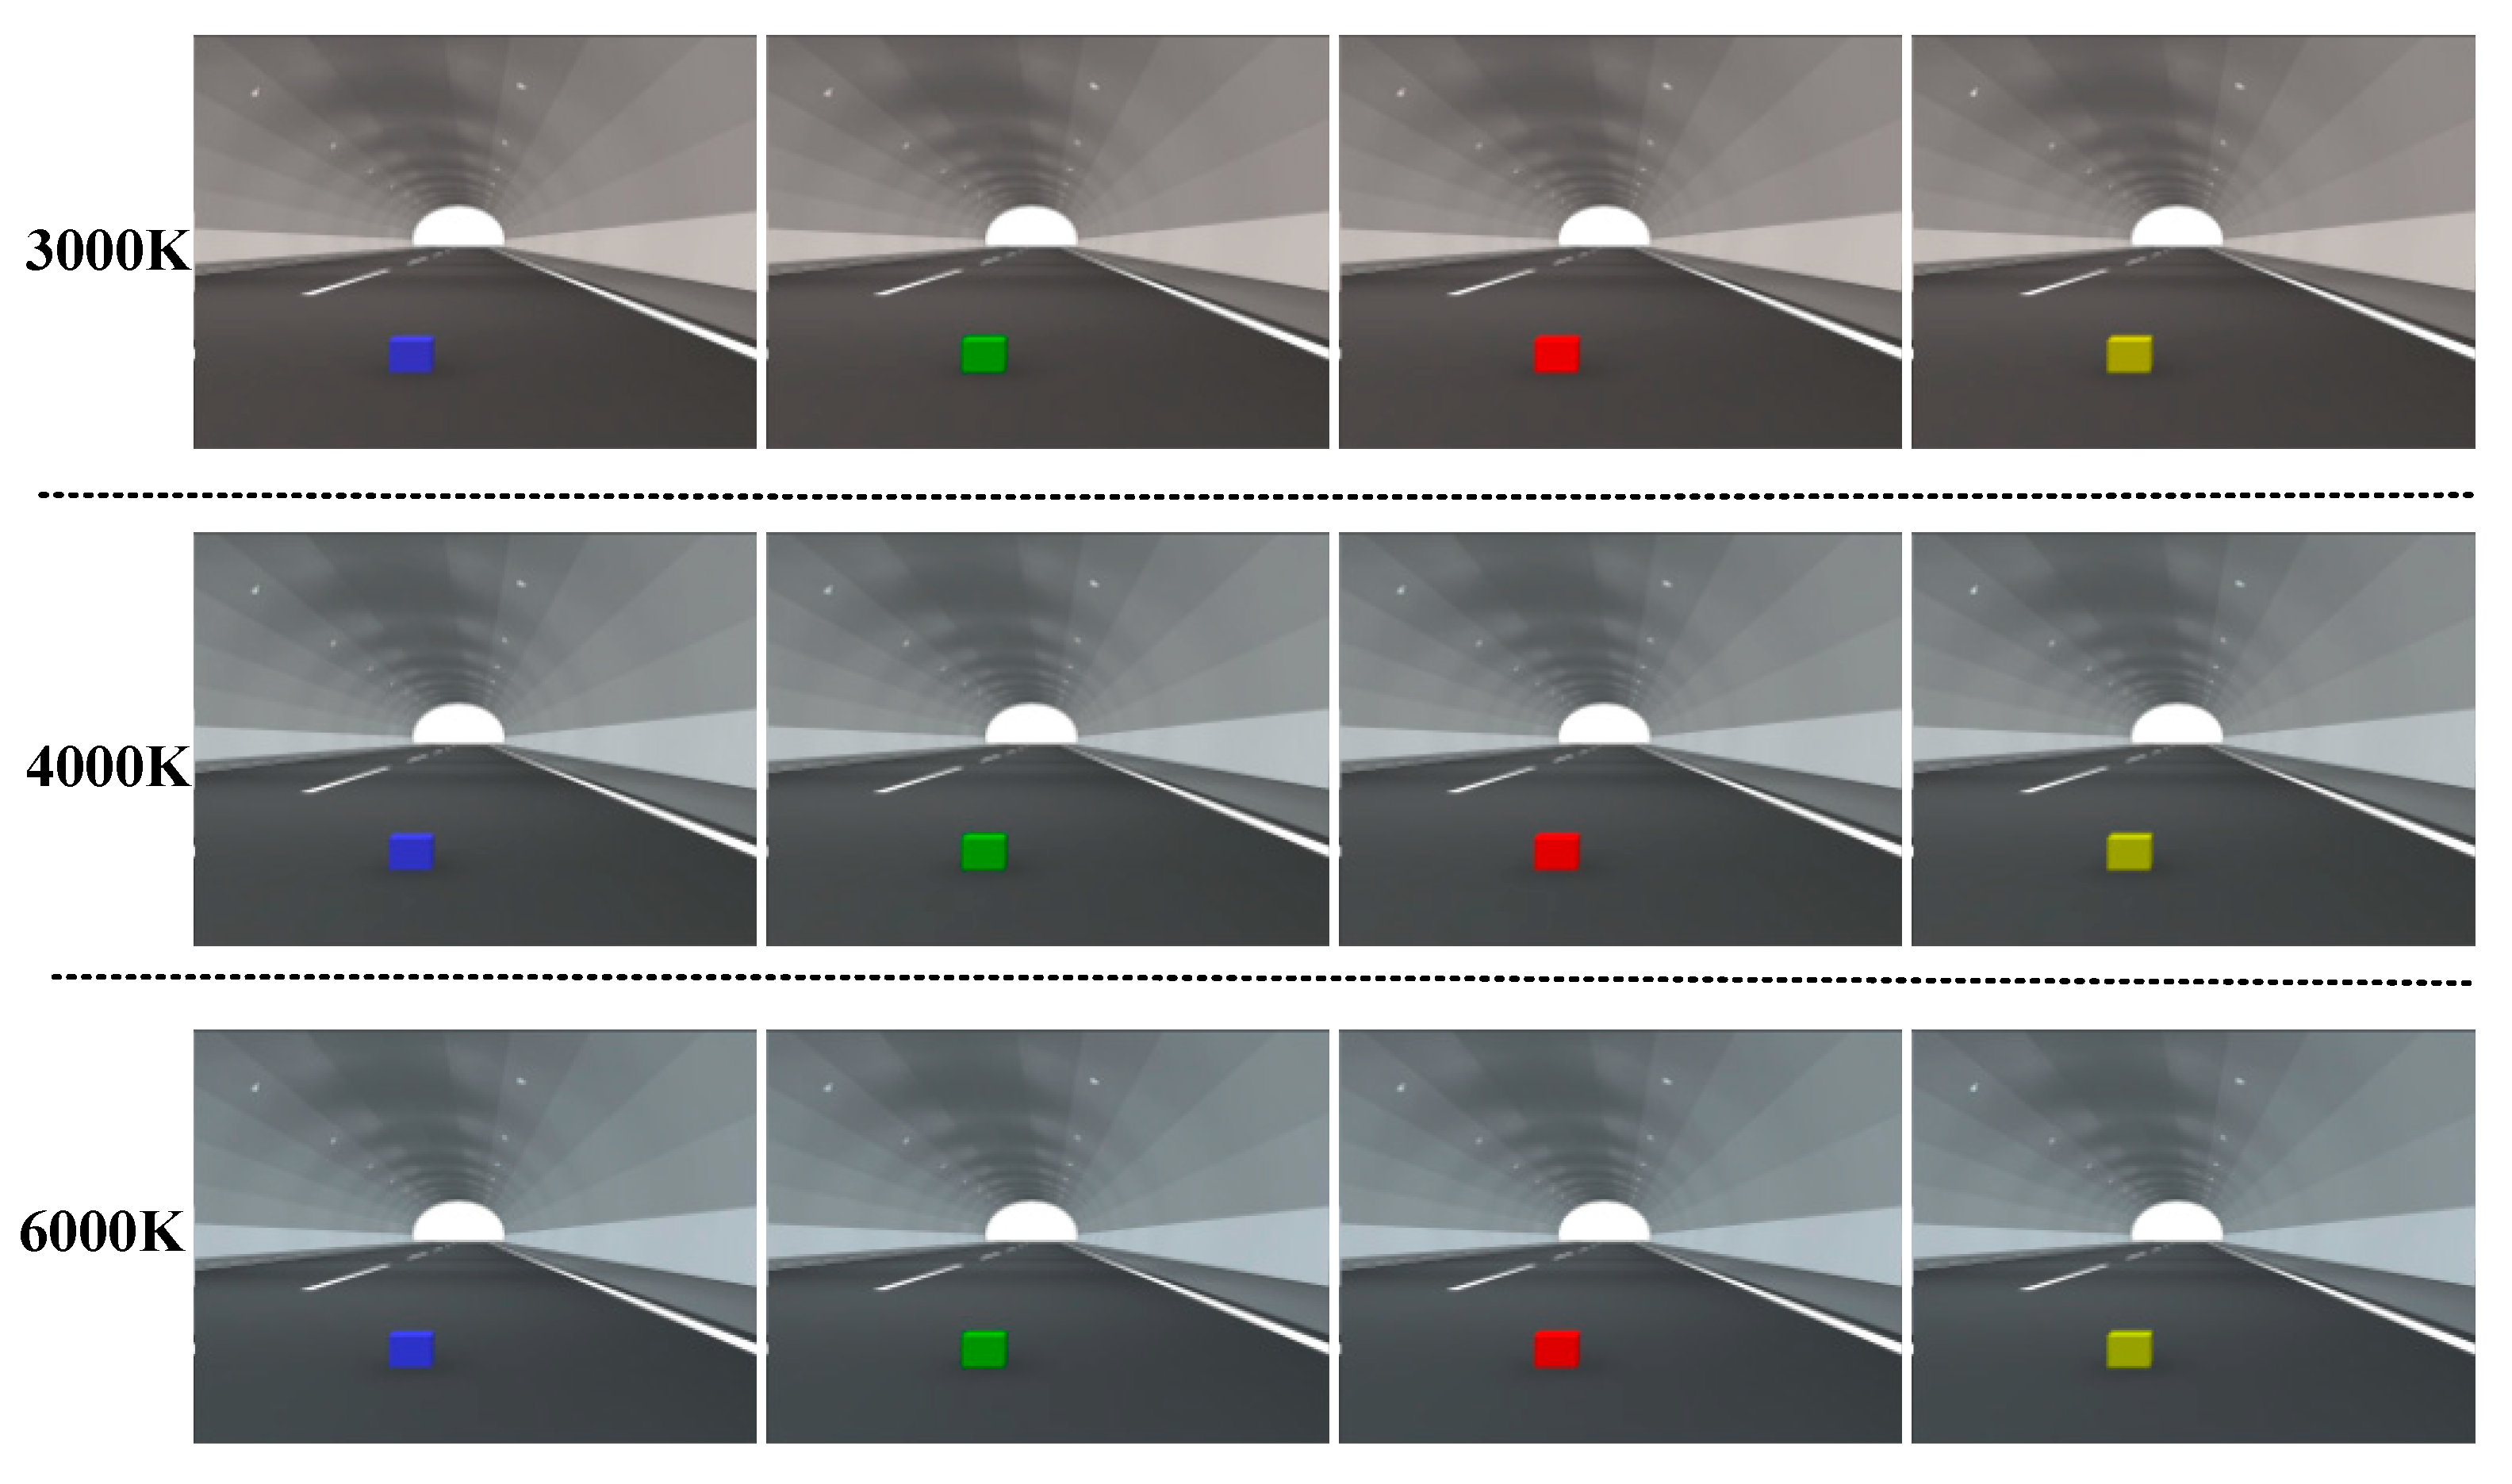
A standard small target visibility (STV) target was placed on the road, and the video camera was placed at 100 m [41] (the stopping recognition distance) and 1.5 m above the pavement. This height corresponds to the visual cognition height of a typical passenger car. The target was placed at the center of the camera frame to obtain a one-degree down angle. Figure 12 gives the simulation results of the lighting environments provided by 3000 K, 4000 K, and 6000 K LED luminaries.
It can be observed from Figure 12 that the lighting environment produced by 3000 K LED is between soft white and warm white. Likewise, the lighting environment created by 4000 K and 6000 K LEDs is cool white or blue-white.
Images of the target under different lighting environments were collected to analyze the influence of LED luminaire CCT and target surface reflection properties on the target contrast, and the image contrast was calculated to evaluate the target contrast. Figure 13 shows photos of the four-color target for 3000 K, 4000 K, and 6000 K LED lighting environments.
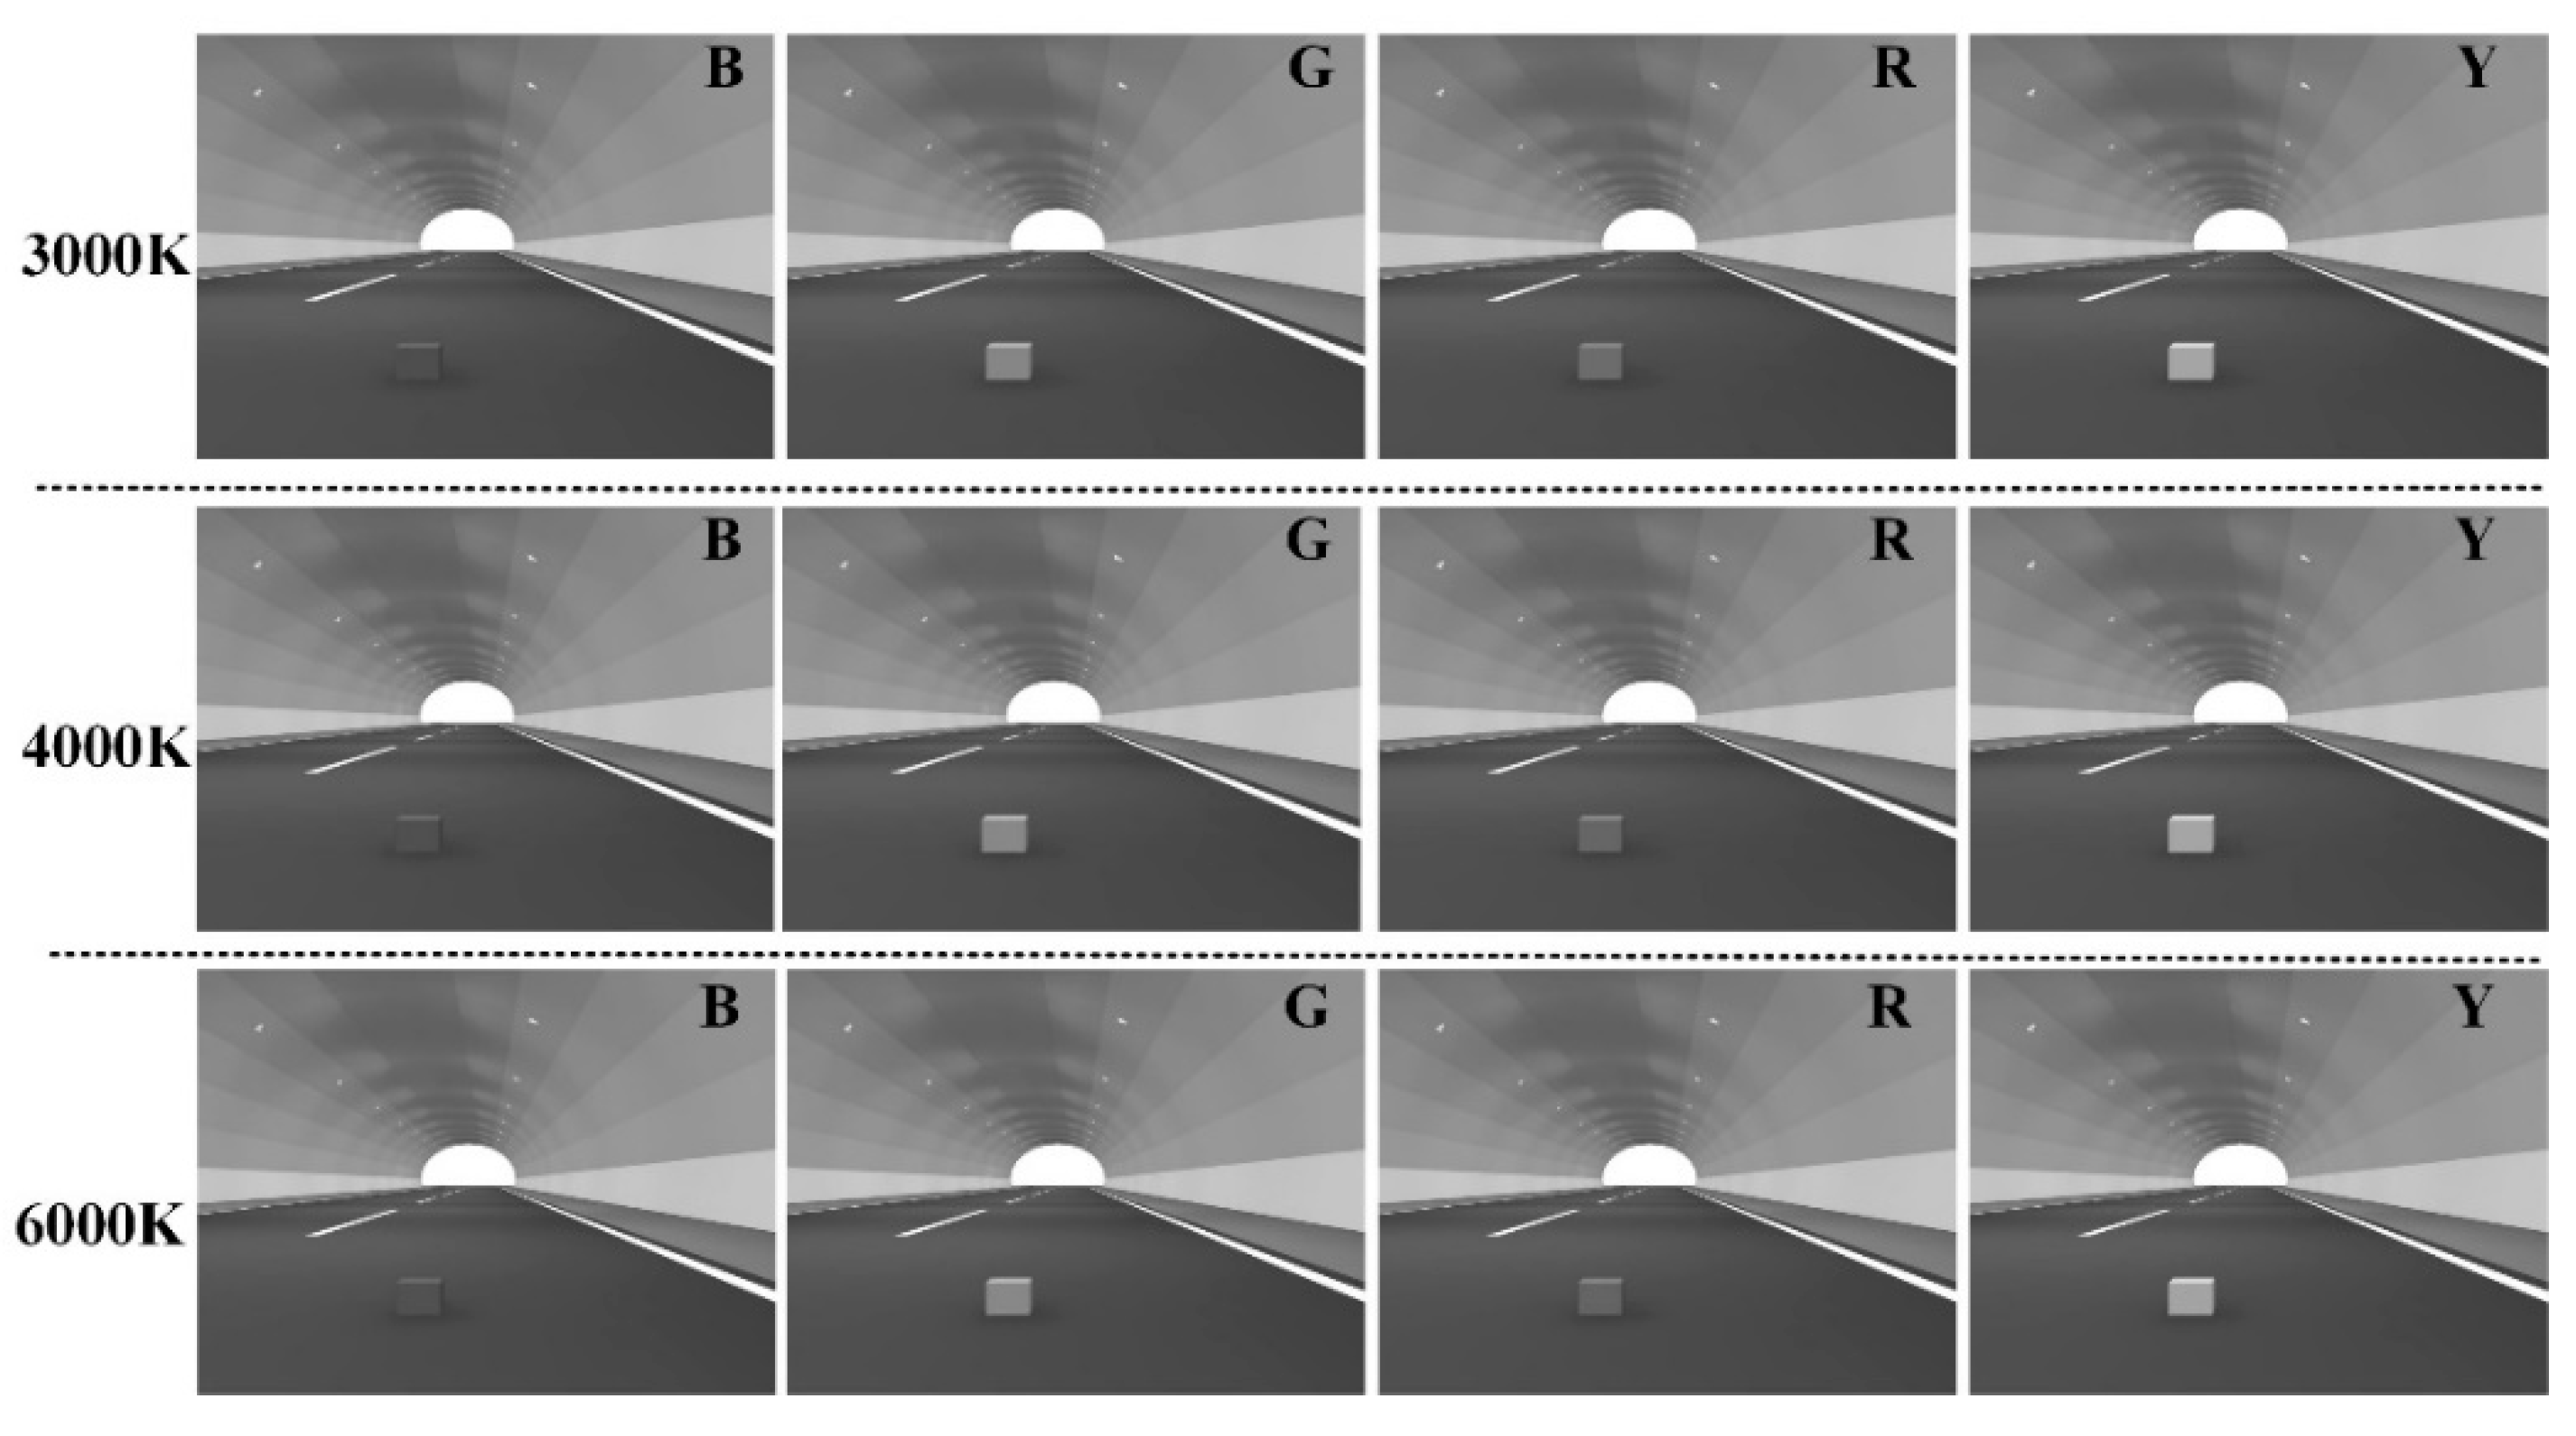
The RGB photo was converted to CIE Lab color space [48,49] (Equations (11) and (12)), which aims to calculate the contrast value.
X Y Z = 2.7689 1.7517 1.1302 1.0000 4.5907 0.0601 0.0000 0.0565 5.5943 R G B
L * = 116 f Y Y 0 16 , a * = 500 f X X 0 f Y Y 0 , b * = 200 f Y Y 0 f Z Z 0 ,
where X0, Y0, and Z0 are the tristimulus values corresponding to “the illuminant”, which the eye is assumed to reference as “white.”
Lightness channel L images of Figure 13 are shown in Figure 14. Again, it can be found that the green and yellow targets are brighter than the red and blue targets.
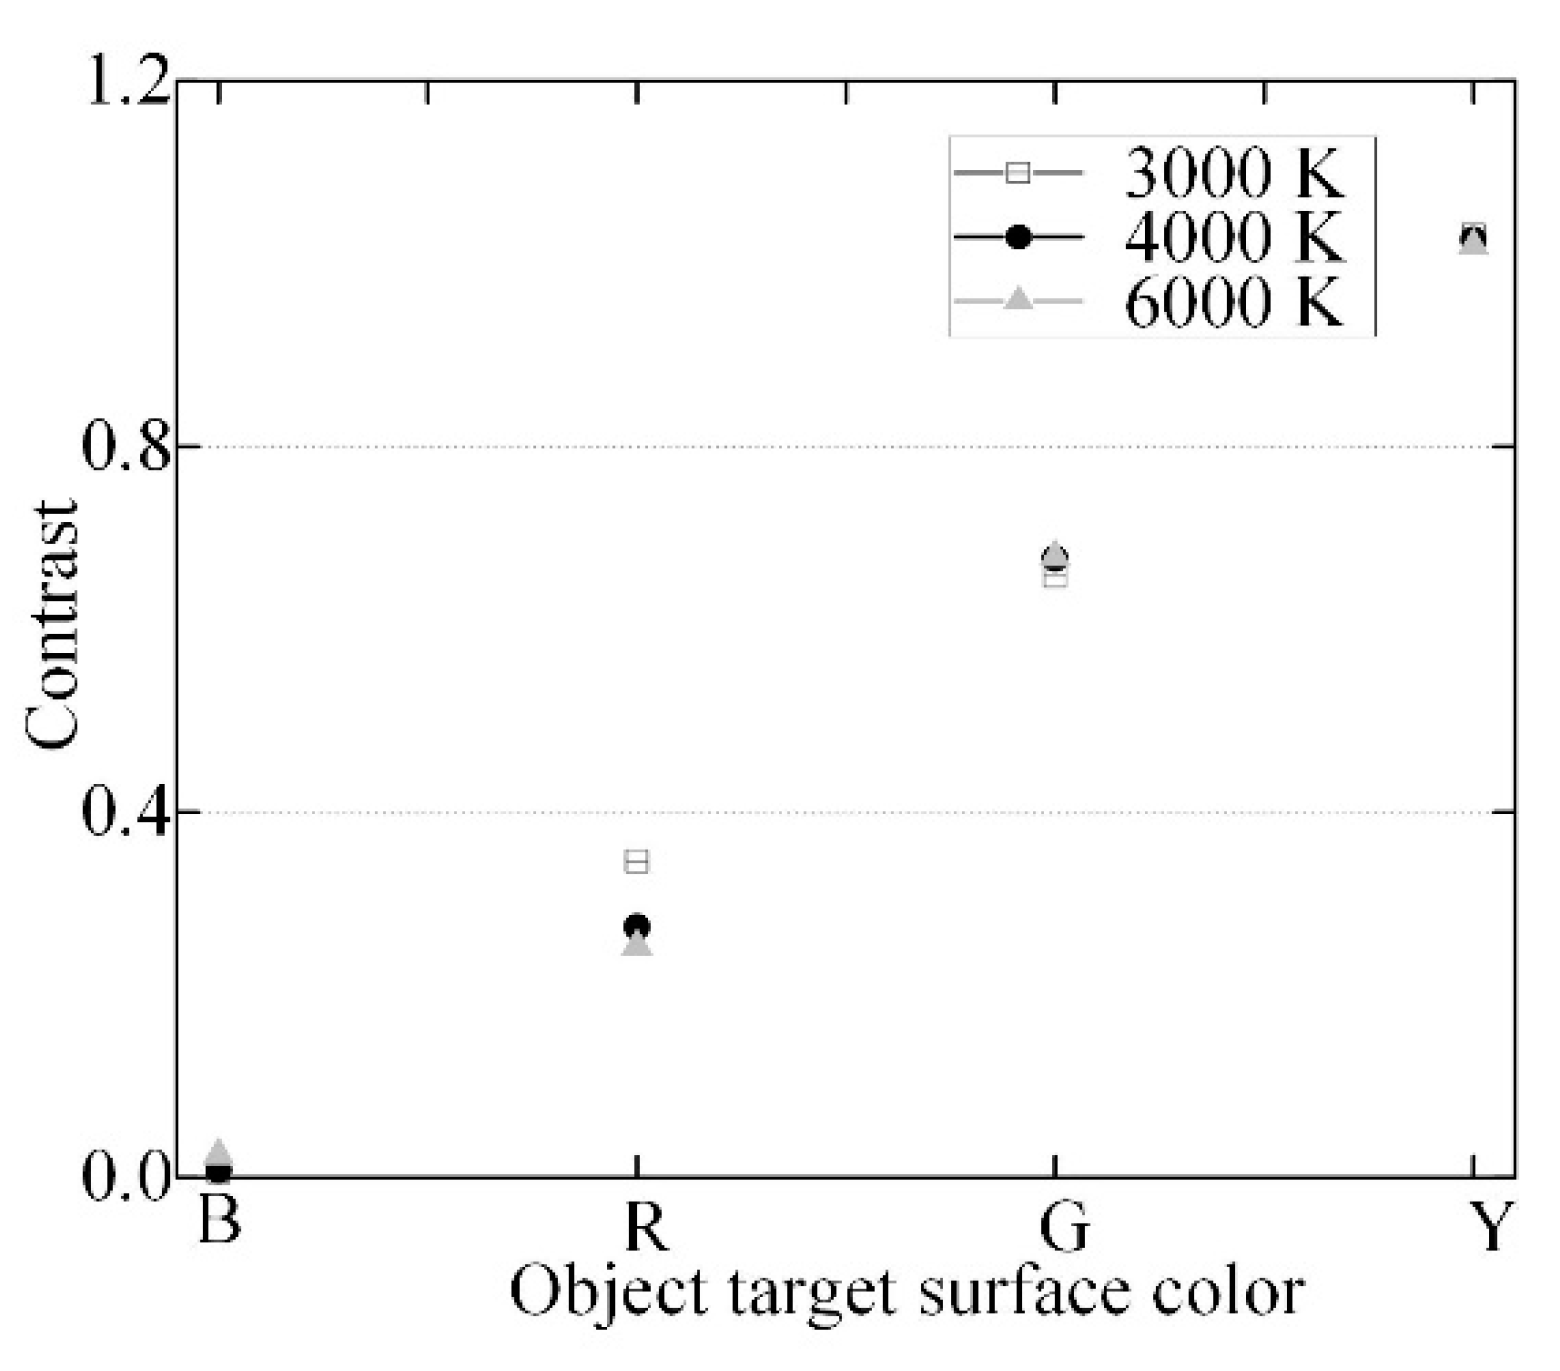
The C values of the target for each lighting environment according to Equation (10) are presented in Table 3.

5. Discussion

It can be seen from Section 2.1 that the mesopic luminance of the tunnel interior zone is greater than the photopic luminance, which means that it needs less luminance level to create the same values of standardized luminance value in practice. For example, for the normative requirement of average pavement luminance (2.5 cd/m2, calculated in Section 4.1), the pavement luminance level created by 3000 K LEDs would be 2.435 cd/m2 (2.6% lower); for 4000 K LEDs would be 2.415 cd/m2 (3.4% lower) and 6000 K LEDs would be 2.375 cd/m2 (5.0% lower). It can save more energy once used mesopic theory in a tunnel interior lighting environment.
In the tunnel interior zone, the relationship between target contrast and surface color in the case of different light sources is shown in Figure 15. The target contrast depends on the target surface color and the CCT of the light source (SPD of the light source). Furthermore, it can be inferred from Figure 15 that the contrast of the yellow surface target is the largest, followed by the green surface target. Conversely, the contrast of the blue surface target is the smallest, which agrees with the calculation results in Section 2.2.
The contrast value of the blue/green surface target for 3000 K LED luminaries is smaller than 4000 K and 6000 K LED luminaires. On the contrary, the contrast value of the red/yellow surface target for 3000 K LED luminaires is higher than 4000 K and 6000 K LED luminaries. Therefore, the results agree with the calculation results in Section 2.2. Moreover, the contrast absolute value of the blue surface target is the largest, which means that the blue surface target is the easiest to distinguish than the other three-color surface targets.

6. Conclusions

A new luminance calculation model was proposed considering the light distribution, color of the small target, and human eye sensitivity in a tunnel lighting environment. The tunnel interior zone’s lighting environment was modeled using the simulation software DIALux. Four colored surface targets (red, yellow, blue, and green) and three LEDs (3000 K, 4000 K, and 6000 K) were used to evaluate visual luminance. The influence of light sources’ characteristics, mesopic vision, and target surface colors on perceived luminance was analyzed.
Lmes_new is proposed as a factor to analyze the perceived luminance after the combined effect of light source SPDs, small target reflection properties, and human visual characteristics. The results showed that the amount of reflected light or the luminance value varies depending on the surface colors. Thus, surface color may significantly influence small targets’ identification under the same light distribution environment.
The simulation results showed that in the case of specific light distribution, the Lmes_new value of the yellow surface target is higher than that of the other three-color surface targets. In contrast, the blue surface target has the lowest Lmes_new value.
In the case of the yellow/red color surface target, the Lmes_new value under a low CCT LED is higher than that under a high CCT LED. On the contrary, for the blue/green color surface target, the Lmes_new value under a low CCT LED is smaller than that under a high CCT LED.
The main limitation is that the work is a simulation-based study. Future studies should be conducted in an actual tunnel to confirm the results. Future studies should also consider the effects of vehicle headlamps with different SPDs. In other words, additional research is needed to distinguish between novice and experienced drivers, male and female drivers, and younger and older drivers.

Author Contributions

Conceptualization, L.Q.; methodology, L.Q. and D.Y.; software, S.H.; validation, L.Q. and D.Y.; formal analysis, L.Q.; writing—original draft preparation L.Q.; writing—review and editing, A.S.L.; supervision, L.Q.; funding acquisition, L.Q. and S.H. All authors have read and agreed to the published version of the manuscript.

Funding

This research was supported in part by State Key Laboratory of Mountain Bridge and Tunnel Engineering, Chongqing Jiaotong University under Grant SKLBT-2108; by Zhejiang Provincial Natural Science Foundation of China under Grant LQ21E080005; by Major Science and Technology Special Project in Jiangbei District, Ningbo City under Grant 201901A03.

Institutional Review Board Statement

Not applicable.

Informed Consent Statement

Not applicable.

Data Availability Statement

Not applicable.

Conflicts of Interest

The authors declare no conflict of interest.

References

  1. Tsai, M.-S.; Lee, X.-H.; Lo, Y.-C.; Sun, C.-C. Optical design of tunnel lighting with white light-emitting diodes. Appl. Opt. 2014, 53, H114. [Google Scholar] [CrossRef]
  2. Makarov, V.V. Island megalopolises: Tunnel systems as a critical alternative in solving transport problems. Eng. Cybersecur. 2018, 4, 138–142. [Google Scholar] [CrossRef]
  3. Qin, L.; Shi, X.; Leon, A.S.; Tong, C.; Ding, C. Dynamic luminance tuning method for tunnel lighting based on data mining of real-time traffic flow. Build. Environ. 2020, 176, 106844. [Google Scholar] [CrossRef]
  4. Transportation Department. Statistical bulletin on the development of the transportation industry in 2020. Financ. Account. Commun. 2021, 6, 92–97. [Google Scholar]
  5. Peña-García, A.; Gómez-Lorente, D. Installation of solar panels in the surroundings of tunnel portals: A double-targeted strategy to decrease lighting requirements and consumption. Tunn. Undergr. Space Technol. 2020, 97, 103251. [Google Scholar] [CrossRef]
  6. Zhang, Y.; Zhuo, X.; Guo, W.; Wang, X.; Zhao, Z. Lighting environment optimization of highway tunnel entrance based on simulation research. Int. J. Environ. Res. Public Health 2019, 16, 2195. [Google Scholar] [CrossRef] [Green Version]
  7. Salata, F.; Golasi, I.; Bovenzi, S.; Vollaro, E.; Pagliaro, F.; Cellucci, L.; Coppi, M.; Gugliermetti, F.; Vollaro, A. Energy optimization of road tunnel lighting systems. Sustainability 2015, 7, 9664–9680. [Google Scholar] [CrossRef] [Green Version]
  8. Peña-García, A. Sustainable tunnel lighting: One decade of proposals, advances and open points. Tunn. Undergr. Space Technol. 2022, 119, 104227. [Google Scholar] [CrossRef]
  9. Jang, D.; Yook, S.-J.; Lee, K.-S. Optimum design of a radial heat sink with a fin-height profile for high-power LED lighting applications. Appl. Energy 2014, 116, 260–268. [Google Scholar] [CrossRef]
  10. 1Zeng, H.; Qiu, J.; Shen, X.; Dai, G.; Liu, P.; Le, S. Fuzzy control of led tunnel lighting and energy conservation. Tsinghua Sci. Technol. 2011, 16, 576–582. [Google Scholar]
  11. CIE 88:2004; Guide for the Lighting of Road Tunnels and Underpasses. CIE: Vienna, Austria, 2004.
  12. CETU. In Dossier Pilote des Tunnels-Eclairage; SPECIFIQUE J.L.P: Lyon, France, 2000.
  13. FD CEN/CR 14380; Lighting Applications-Tunnel Lighting. Association Francaise de Normalisation: Paris, France, 2006.
  14. Yao, Q.; Yuan, L.; Bian, Y. Establishment of vision effect diagram for optimization of smart led lighting. IEEE Photonics J. 2016, 8, 1–8. [Google Scholar] [CrossRef]
  15. He, Y.; Rea, M.; Bierman, A.; Bullough, J. Evaluating Light Source Efficacy under Mesopic Conditions Using Reaction Times. J. Illum. Eng. Soc. 1997, 26, 125–138. [Google Scholar] [CrossRef]
  16. He, Y.; Bierman, A.; Rea, M. A system of mesopic photometry. Light. Res. Technol. 1998, 30, 175–181. [Google Scholar] [CrossRef]
  17. Viikari, M.; Chen, W.; Eloholma, M.; Halonen, L.; Chen, D. Comparative study of two visual performance based mesopic models based on reaction time and contrast threshold data. Light Eng. 2006, 14, 13. [Google Scholar]
  18. Beckwith, D.; Zhang, X.; Smalley, E.; Chan, L.; Yand, M. LED streetlight application assessment project: Pilot study in Seattle, Washington. Transp. Res. Rec. 2011, 2250, 65–75. [Google Scholar] [CrossRef]
  19. Petrulis, A.; Petkevičius, L.; Vitta, P.; Vaicekauskas, R.; Žukauskas, A. Exploring Preferred Correlated Color Temperature in Outdoor Environments Using a Smart Solid-State Light Engine. LEUKOS 2018, 14, 95–106. [Google Scholar] [CrossRef]
  20. Davidovic, M.; Djokic, L.; Cabarkapa, A.; Kostic, M. Warm white versus neutral white LED street lighting: Pedestrians' impressions. Light. Res. Technol. 2019, 51, 1237–1248. [Google Scholar] [CrossRef]
  21. Zak, P.; Zalesak, J. The influence of spectral properties of light in street lighting on visual perception. In Proceedings of the 2016 IEEE Lighting Conference of the Visegrad Countries (Lumen V4), Karpacz, Poland, 13–16 September 2016; pp. 1–4. [Google Scholar]
  22. Dong, L.; Zhao, E.; Chen, Y.; Qin, G.; Xu, W. Impact of led color temperatures on perception luminance in the interior zone of a tunnel considering fog transmittance. Adv. Civ. Eng. 2020, 2020, 1–13. [Google Scholar] [CrossRef] [Green Version]
  23. Fotios, S.; Cheal, C.; Boyce, P. Light source spectrum, brightness perception and visual performance in pedestrian environments: A review. Light. Res. Technol. 2005, 37, 271–291. [Google Scholar] [CrossRef] [Green Version]
  24. Preciado, O.; Manzano, E. Spectral characteristics of road surfaces and eye transmittance: Effects on energy efficiency of road lighting at mesopic levels. Light. Res. Technol. 2018, 50, 842–861. [Google Scholar] [CrossRef]
  25. Akashi, Y.; Rea, M.S.; Bullough, J.D. Driver decision making in response to peripheral moving targets under mesopic light levels. Light. Res. Technol. 2007, 39, 53–67. [Google Scholar] [CrossRef]
  26. Gibbons, R.; Terry, T.; Bhagavathula, R.; Meyer, J.; Lewis, A. Applicability of mesopic factors to the driving task. Light. Res. Technol. 2016, 48, 70–82. [Google Scholar] [CrossRef]
  27. Gibbons, R.; Meyer, J.; Terry, T.; Bhagavathula, R.; Lewis, A.; Flanagan, M.; Connell, C. Evaluation of the Impact of Spectral Power Distribution on Driver Performance; Technical Report FHWA-HRT-15-047; Turner-Fairbank Highway Research Center: McLean, Virginia, 2015. [Google Scholar]
  28. Jin, H.; Jin, S.; Chen, L.; Cen, S.; Yuan, K. Research on the lighting performance of led street lights with different color temperatures. IEEE Photonics J. 2015, 7, 1–9. [Google Scholar] [CrossRef]
  29. Jin, P.; Wang, Y.; Zhou, Q.; Rooymans, J.; Yu, C. Luminous efficacy of white LED in the mesopic vision state. Optoelectron. Lett. 2009, 5, 265–267. [Google Scholar] [CrossRef]
  30. Bandopadhyay, S.; Kole, A. Review and studies on the effect of spectral composition of LED based lighting system over its scotopic-photopic ratio. In Proceedings of the 2016 International Conference on Intelligent Control Power and Instrumentation (ICICPI), Kolkata, India, 21–23 October 2016; p. 5. [Google Scholar]
  31. Yang, Y.; Han, W.Y.; Yan, M.; Jiang, H.F.; Zhu, L.W. The performance analysis for lighting sources in highway tunnel based on visual function. Guang Pu Xue Yu Guang Pu Fen Xi 2015, 35, 2686–2690. [Google Scholar] [PubMed]
  32. Liu, Y.; Peng, L.; Lin, L.; Chen, Z.; Weng, J.; Zhang, Q. The impact of LED spectrum and correlated color temperature on driving safety in long tunnel lighting. Tunn. Undergr. Space Technol. 2021, 112, 103867. [Google Scholar] [CrossRef]
  33. Liang, B.; He, S.; Tähkämö, L.; Tetri, E.; Cui, L.; Dangol, R.; Halonen, L. Lighting for road tunnels: The influence of CCT of light sources on reaction time. Displays 2020, 61, 101931. [Google Scholar] [CrossRef]
  34. Dong, L.; Qin, L.; Xu, W.; Zhang, L. The impact of led correlated color temperature on visual performance under mesopic conditions. IEEE Photonics J. 2017, 9, 1–16. [Google Scholar] [CrossRef]
  35. Zhang, X.; Hu, J.; Wang, R.; Gao, X.; He, L. The comprehensive efficiency analysis of tunnel lighting based on visual performance. Adv. Mech. Eng. 2017, 9, 168781401769644. [Google Scholar] [CrossRef] [Green Version]
  36. Boyce, P.R.; Eklund, N.H.; Hamilton, B.J.; Bruno, L.D. Perceptions of safety at night in different lighting conditions. Light. Res. Technol. 2000, 32, 79–91. [Google Scholar] [CrossRef]
  37. CIE 191:2010; Recommended System for Mesopic Photometry Based on Visual Performance. CIE Publication: Vienna, Austria, 2010.
  38. Ohno, Y. Practical use and calculation of CCT and Duv. LEUKOS 2014, 10, 47–55. [Google Scholar] [CrossRef]
  39. Durmus, D. Correlated color temperature: Use and limitations. Light. Res. Technol. 2022, 54, 363–375. [Google Scholar] [CrossRef]
  40. Maksimainen, M.; Kurkela, M.; Bhusal, P.; Hyyppä, H. Calculation of mesopic luminance using per pixel s/p ratios measured with digital imaging. LEUKOS 2019, 15, 309–317. [Google Scholar] [CrossRef]
  41. JTG/T D70/2-01-2014; Guidelines for Design of Highway Tunnels. China Communications Press: Beijing, China, 2014.
  42. CEN EN 13201-3:2003; Calculation of Performance. German Version DIN: Berlin, Germany, 2003.
  43. Jiaming, D.; Hongyan, M. Analysis and optimization of ancient building lighting based on DIALux. In Proceedings of the 2020 Chinese Control and Decision Conference (CCDC), Hefei, China, 22–24 August 2020; pp. 134–139. [Google Scholar]
  44. Lim, G.-H.; Keumala, N.; Ghafar, N.A. Energy saving potential and visual comfort of task light usage for offices in Malaysia. Energy Build. 2017, 147, 166–175. [Google Scholar] [CrossRef]
  45. Salvadori, G.; Fantozzi, F.; Rocca, M.; Leccese, F. The energy audit activity focused on the lighting systems in historical buildings. Energies 2016, 9, 998. [Google Scholar] [CrossRef] [Green Version]
  46. American National Standards Institute/Illuminating Engineering Society of North America. Recommended Practice for Design and Maintenance of Roadway and Parking Facility Lighting; DRAFT RP-22-05; IES: New York, NY, USA, 2018; 475p. [Google Scholar]
  47. Narisada, K.; Yoshikawa, K. Lighting of short tunnels- effects of exit luminance on the lighting level. J. Illum. Eng. Inst. Jpn. 1978, 62, 11–18. [Google Scholar]
  48. Abbadi, N.K.E.; Razaq, E.S. Automatic gray images colorization based on lab color space. Indones. J. Electr. Eng. Comput. Sci. 2020, 18, 1501–1509. [Google Scholar] [CrossRef]
  49. Xu, H.-S. Color Information Engineering, 2nd ed.; Zhejiang University Press: Hangzhou, China, 2015. [Google Scholar]
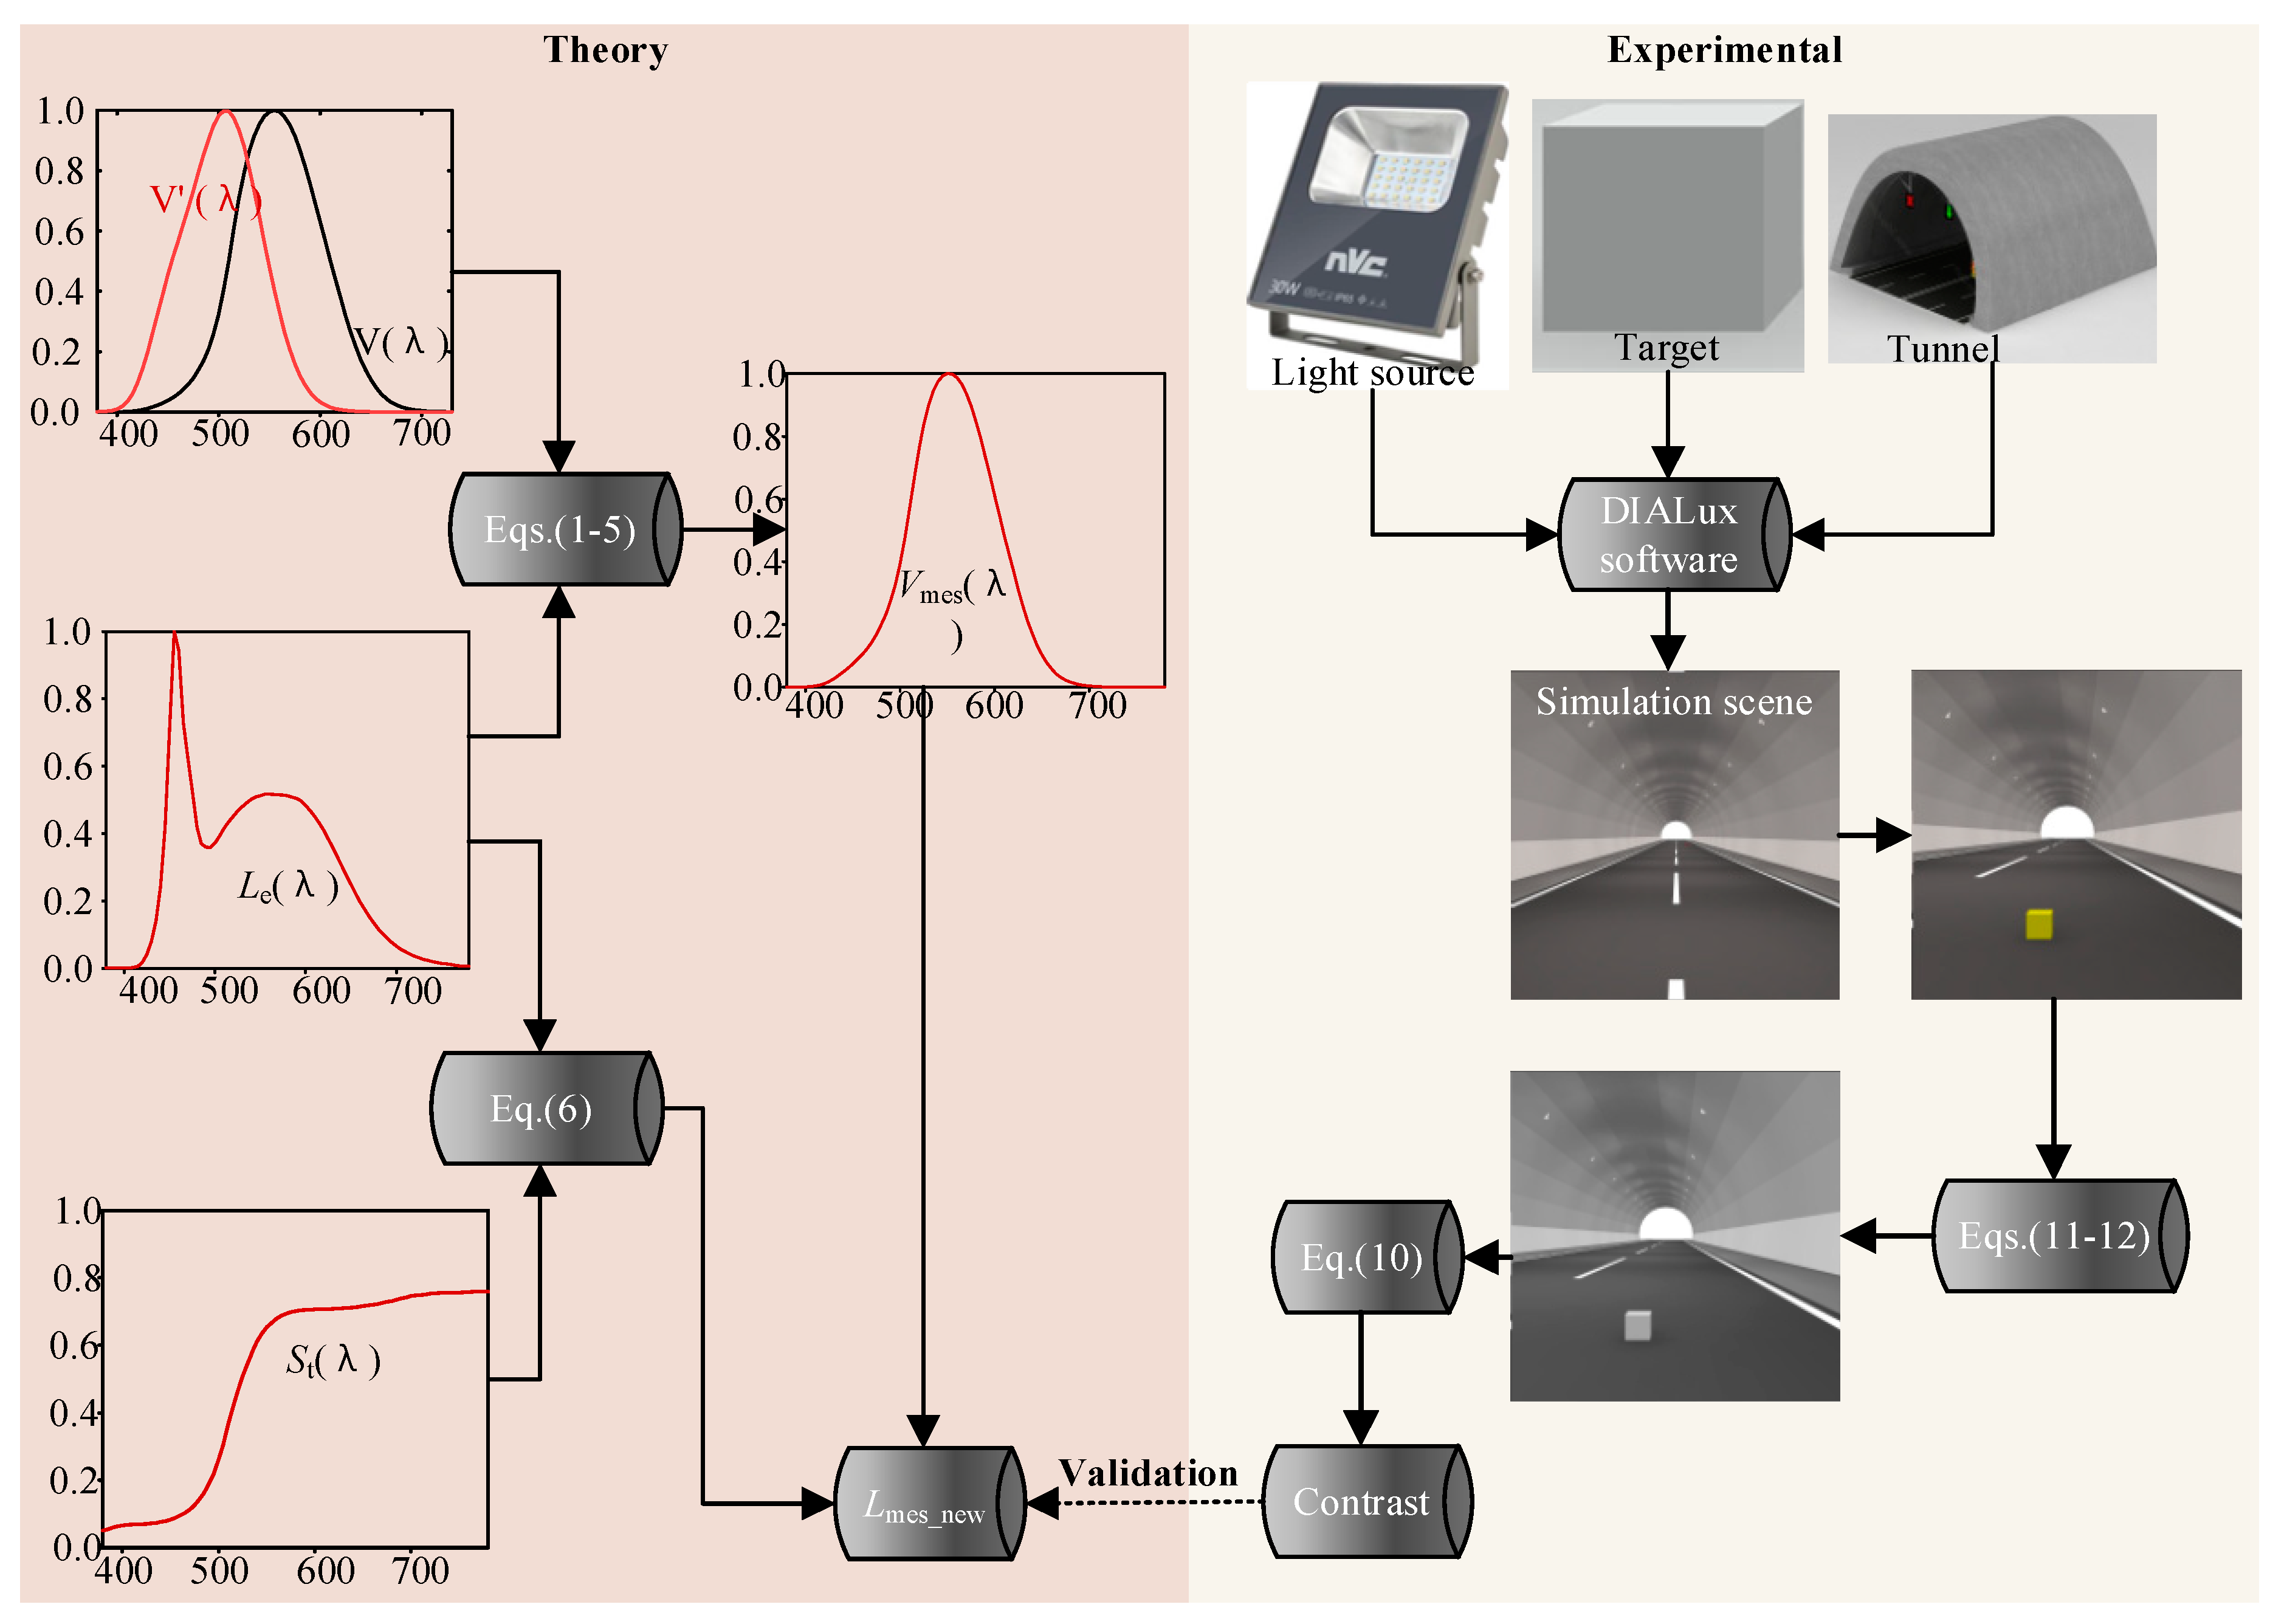
Figure 1. The workflow of the study.
Photonics 09 00870 g001
Figure 2. Photo of NVC LED luminaires and light distribution curve.
Photonics 09 00870 g002
Figure 3. The relative power of three light sources.
Photonics 09 00870 g003
Figure 4. V(λ), V′ (λ), and Vmes(λ) for LEDs with different CCTs.
Photonics 09 00870 g004
Figure 5. Percentage difference between Lmes and Lp plotted against Lp.
Photonics 09 00870 g005
Figure 6. Spectral reflectance distribution of four surface colors.
Photonics 09 00870 g006
Figure 7. Lmes_new value of four-colored targets under three lighting conditions.
Photonics 09 00870 g007
Figure 8. Tunnel lighting zones.
Photonics 09 00870 g008
Figure 9. (a) cross-section, (b) render of the test tunnel by DIALux.
Photonics 09 00870 g009
Figure 10. Pavement illumination simulation points.
Photonics 09 00870 g010
Figure 11. Simulation result and false-color image of road pavement.
Photonics 09 00870 g011
Figure 12. Different lighting environments.
Photonics 09 00870 g012
Figure 13. Images of the four-color targets.
Photonics 09 00870 g013
Figure 14. L channel images of the four-color targets under three lighting conditions.
Photonics 09 00870 g014
Figure 15. Relationship between target contrast and target surface color for different LED CCTs.
Photonics 09 00870 g015
Table 1. Characteristics of light sources.
No.123
Luminous2100 lm2100 lm2100 lm
Electric power30 W30 W30 W
CCT3000 K4000 K6000 K
Duv−0.0006−0.00120.0044
Table 2. Parameters of Xiaogou tunnel.
ParameterValue
L1140 m
Ds100 m
h6 m
Vt80 km/h
N704 Veh/(h۰ln)
Din826 m
Lin2.5 cd/m2
Table 3. Contrast value of target object.
Target Surface ColorBGRY
LED CCT
3000 K0.00640.65790.34671.0309
4000 K0.00800.67730.27441.0265
6000 K0.02460.67910.25291.0196
Notes: B is blue, G is green, R is red, and Y is yellow.
Publisher’s Note: MDPI stays neutral with regard to jurisdictional claims in published maps and institutional affiliations.